Article

System Dynamics and Graphical Interface Modeling of a Fig-Derived Micro-Producer Factory

by
Ernesto A. Lagarda-Leyva
1,
Alfredo Bueno-Solano
1,* and
Luis F. Morales-Mendoza
2
1
Industrial Engineering Department, Instituto Tecnológico de Sonora, 85000 Cd Obregón, Mexico
2
Faculty of Chemical Engineering, Universidad Autónoma de Yucatan, 97000 Mérida, Mexico
*
Author to whom correspondence should be addressed.
Sustainability 2022, 14(20), 13043; https://doi.org/10.3390/su142013043
Submission received: 27 August 2022 / Revised: 26 September 2022 / Accepted: 7 October 2022 / Published: 12 October 2022
(This article belongs to the Section Sustainable Management)

Abstract

:
This study started from a fig-derived product project in the 2022–2026 Strategic Plan from Sonora, Mexico, to develop technological solutions in complex environments and provide a global panorama from the industry to the prevailing situation in Valle del Mayo. A technological solution is based on a graphical interface to support decision-making in fig supply, production and distribution in the administration process, given that the main problem has been the lack of a processing plant with a sustainable approach. Four options were set up for nine producers—figs in syrup, dehydrated, marmalade, compost—based on the system dynamics methodology to solve the problem of factory installation. Six stages were followed: (1) mapping the system to determine variables and parameters; (2) constructing the causal diagram; (3) developing the flow and level diagram and model equations; (4) simulating and validating the current model; (5) designing policies and evaluating scenarios using a multi-criteria analysis; and (6) developing the graphical interface. The main conclusions show that fig-derived products and their distribution can feature in diverse markets in a graphics environment supported by complex mathematical models in the supply chain along with the capacity to generate income into utilities to support the decision of the physical factory prior to important investments.

1. Introduction

Ficus carica is an adapted plant distributed especially in warm, subtropical, temperate climates and tolerant to drought. It can be produced in many regions of Mexico, although its cultivation in the open field is typically performed in temporal conditions (usually, the collection season is from July to September) [1,2,3,4].
The fig is the edible fruit of F. carica, a robust tree that comes from the family Moraceae. The tree may reach 10 m in height, 6 or 7 cm in length, and 4.5 to 5.5 cm in diameter. The fig fruit is 3–5 cm long, with green skin that ripens to purple or brown, and is seasonal, thus being easier to find at the end of the summer and beginning of autumn. It can be eaten fresh, dried, or mashed for confectionery, in preserves or as crystalized fruit, and has important nutritional properties [5,6].
In 2019, the Agri-Food and Fisheries Information Service (SIAP) [7] of the Mexican Federal Government reported the commercial presence of F. carica in 15 states, of which the main ones are Morelos, showing the greatest harvested surface (497.3 ha), followed by Baja California Sur (302 ha) and Veracruz (165 ha).
The municipalities of Sonora with the largest area of F. carica sown and harvested in 2020 according to SIAP were Cajeme in the first place with a total of 95,124.68 and 93,995.90 ha, respectively, second and third place Hermosillo (53,196.80) and Etchojoa (49,062.00). The municipality of Navojoa, where the project is developed, occupied the fourth place in hectares sown (45,478.82 ha) and harvested (45,179.82 ha) with a relationship of 99.34% harvesting/sowing [7,8].
Fig fruit is an important harvest around the world because of its fresh and dry consumption. Its common edible part is a fleshy and hollow receptacle (scyconium) that develops as a fruit [9]. The dried fruit of F. carica has been reported as an important source of vitamins, minerals, carbohydrates, sugars, organic acids, and phenolic compounds [10,11]. All these characteristics make fig fruit a high-potential product for market sales and distribution.
In 2022 a strategic long-term vision plan of 12 objectives was developed towards 2026 with the idea of determining the projects to close gaps. Therefore, two strategic objectives were considered in this research study: (1) develop technological solutions to standardize fig fruit production and packing, considering alternative products to meet the current and future demand and (2) build a sustainable fig-derived product factory according to current and future needs.
Among the priorities for a small-scale producer, one is the installation of a fig-derived product factory. In this sense, before making investments, a technological solution was developed based on simulating the factory, starting from the equipment and capabilities, as well as the production logistics that each of the alternative products studied for their marketing potential would need. For example, fig: (1) preserved (whole fruit) in syrup; (2) dehydrated; (3) jam (mashed) or marmalade (larger chunks); and (4) compost from waste throughout the food supply chain.
In this context and in the interest in starting the factory investment project, a technological solution was developed to support decision-making based on a graphical interface to evaluate different future scenarios prior to physical installation. Thus, the proposal is based on system dynamics methodology using simulation and scenario analyses from multi-criteria techniques to observe the different modes of behavior before starting any type of investment and real operations. Therefore, this factory simulation study starts from current data related to the number of figs harvested, the capacity of the factory to make the products, and the potential demand to calculate income from sales.

Empirical Studies Related to This Research

In the review of the empirical studies related to the development of alternative products from fig fruit, Cuasquer and Chacua [12] determined the technological process for obtaining fig (F. carica) fruit flour in two maturity stages (green and black), and the second one involved producing cookies from the best treatment of the first stage. The figs at two different stages of maturity were subjected to a flux drier at different temperatures (50, 60, 70, 80 °C). Drying time and temperatures were determined to interact according to the fruit maturity stage, which is inversely related to sugar content reduction, and water elimination is essential; in contrast, sugar presence is rapidly eliminated in green maturity. Within the process, fruit latex should be eliminated beforehand by resting it in water for three hours [13,14].
On the other hand, Rodman and Ortiz [15] developed a technological fig fruit processing alternative, which intends to preserve the benefits of this fruit for longer. Fresh fig production is undoubtedly becoming more important with regards to export. Small figs mainly have an industrial destination and are canned in syrup. Fresh figs of greater size are typically for marketing purposes. Good quality dry figs are industrially vacuum-packed for human consumption, reaching prices that make their production profitable.
As outlined by Catraro [16], dehydrating food is one of the most ancient conservation methods known. This process entails a substantial food weight and volume reduction, and thus transport and storage costs decrease. The importance of encouraging added value to regional products is not only based on improving productive markers but also generating a degree of development in the communities. On the other hand, Helmy et al. [17] studied and simulated the behavior of whole fig drying with different parameters. The approach led to the development of an industrial fig dryer at a small scale, using gas butane as the thermal energy source and also describing the change in humidity content of the whole figs during the real drying process using the proposed dryer [18].
From the perspective of the empirical studies related to the fig fruit dehydration process, the research developed by Villalobos et al. [19] details a growing demand in part of the production sector for new drying technologies that can save time. The security of these products should be improved, as the optimum conditions and controlled drying of these proposed technologies reduce or inhibit fungi. This study represents a great opportunity to apply new techniques with the purpose of obtaining a product with adequate quality and sensorial security characteristics. Studies related to the three fig-derived products were taken as reference for developing the technological solution for the system dynamics methodology [20,21,22,23,24]. System dynamics can develop complex models based on data and variables through their relationship and behavior over time [21,22,25], allowing decision-makers to evaluate scenarios, according to Schwartz [26], from the most critical variables and parameters considering diverse policies.
The methods of Morales et al. [27] and Wang and Rangaiah [28], specifically the Technique for Order Preference by Similarity to Ideal Solution (TOPSIS) and Make an Adequate Choice (Faire Un Choix Adéquat—FUCA), were used for the multiple criteria analysis from the 10 performance markers considered in the dynamic model.
The solution based on a graphical interface in Lagarda-Leyva and Ruiz [29] and Arana et al. [30] allows the critical data to be concentrated in a clear and structured way for the users. A graphical interface is formed by the graphic elements that allow fluid communication between a system or structure and the interested user. The design is especially influential because of its technology, which helps the user to find an alternative to obtaining information by an electronic means. The main quality is covering the user’s needs to communicate or transmit the results derived from the possible decisions prior to implementing them, since it is based on simulating dynamic and discrete events that compose the model behind the graphical interface. Therefore, the objective of this project is the construction of a technological solution based on a graphical interface of fig-derived products to assess decision-making in the supply chain links starting from different scenarios.

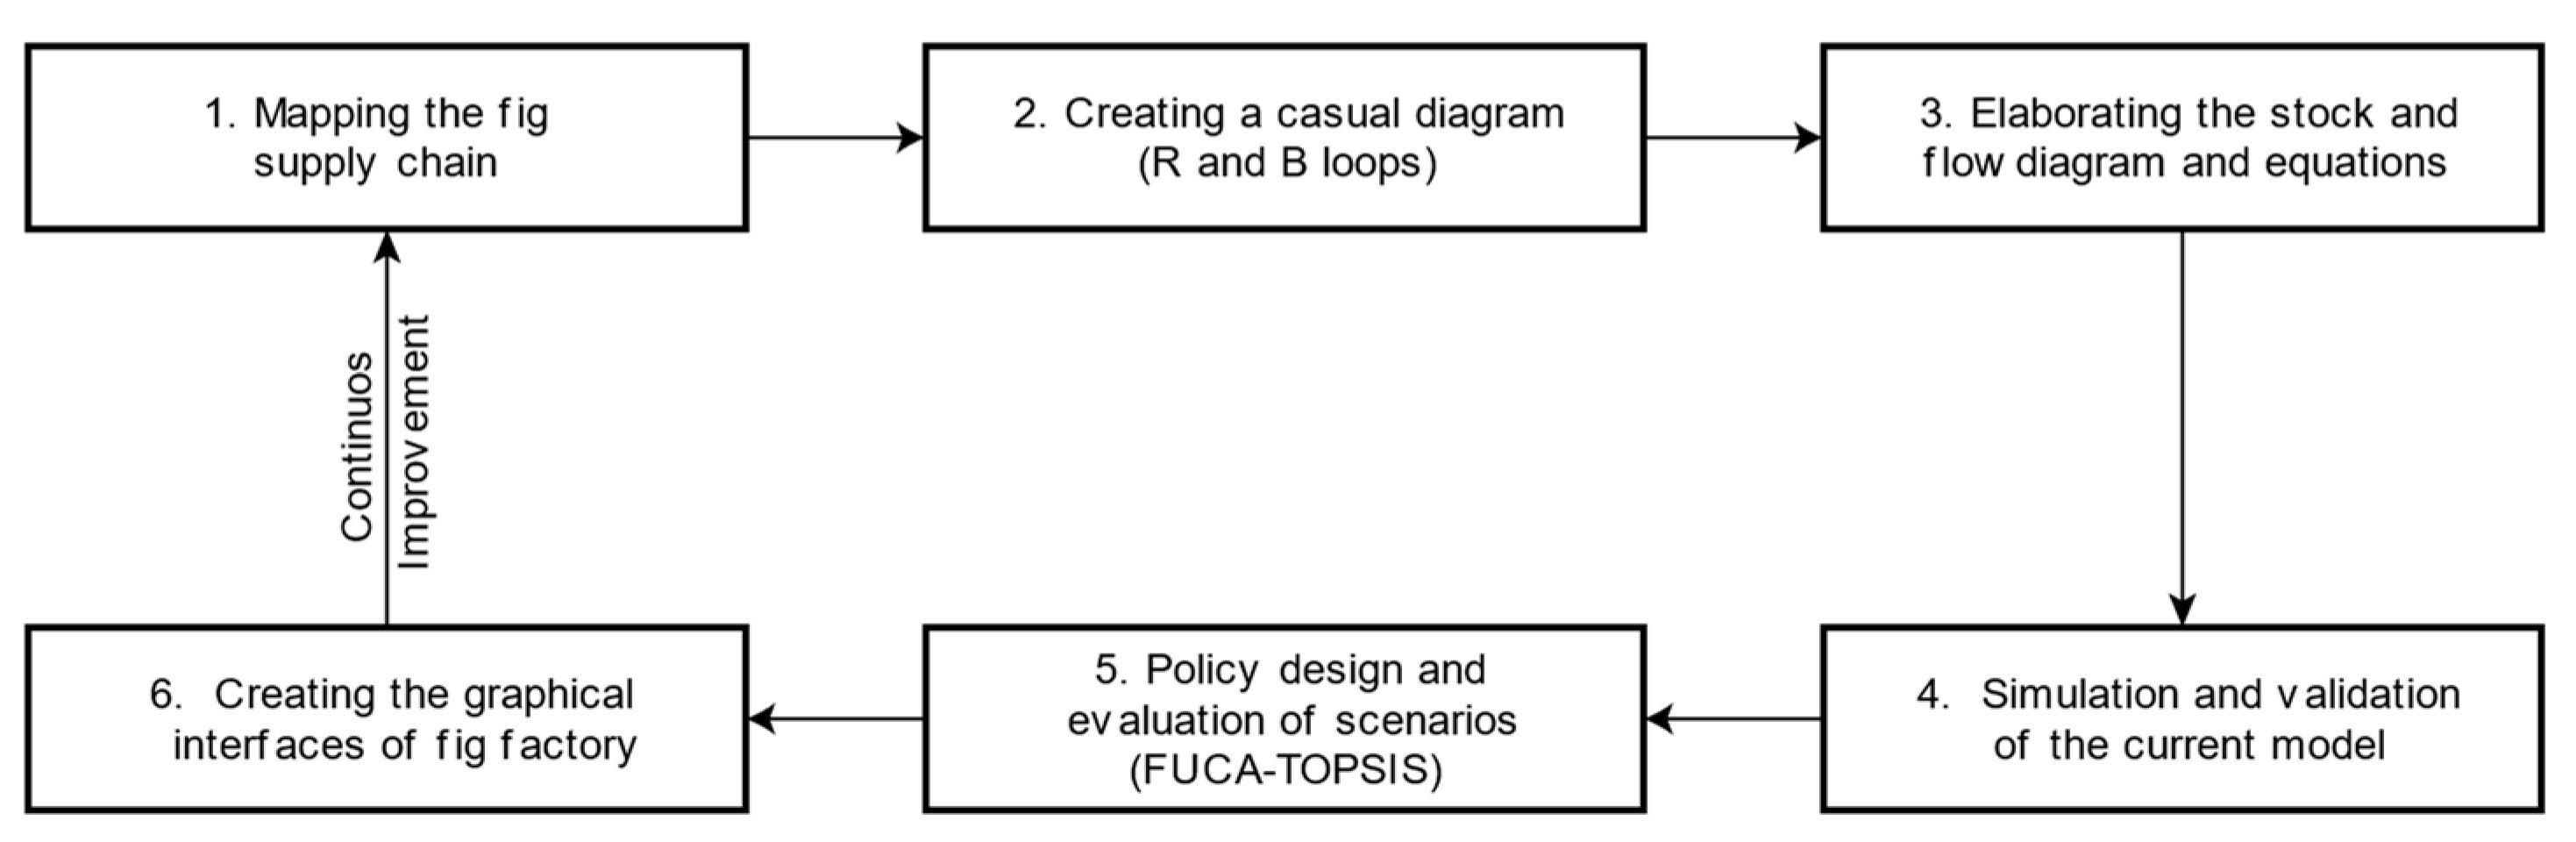
2. Materials and Methods

The materials used in this study include the following software:
Vensim PLE®, (Version 8.2.1, Ventana System Inc., Harvard, MA, USA, 2019) was used for causal loop diagrams.
Stella Architect®, 2020 (Version 1.9.1, Isee Systems Inc., Lebanon, NH, USA, 2019) was used for flow and stock models, simulation, and graphical interfaces. This software was chosen because it included the module for designing graphical interfaces and could also run them online.
Excel® (Microsoft, Redmond, WA, USA, 2018) was used to process data and information (Macros of TOPSIS and FUCA) that did not need additional modules for specific statistics considerations; basic arithmetical functions were included in formulas.
Freepik® (Freepik, Malaga, Spain) was used to include free vectors for the graphical interface design.
The method used consists of six stages that close with a circle of continuous improvement. Figure 1 shows the stages followed as part of the method: (1) mapping the supply chain proposed for the producers in Valle del Mayo, Sonora, Mexico; (2) creating the causal diagram to observe the cause–effect relationships, classified as reinforcing (R) and balancing (B) loops; (3) developing the stock level and flow diagram with the mathematical equations that represent it; (4) simulating and validating the current scenario under the normal conditions of the proposed factory; (5) designing policies and evaluation of optimistic, pessimistic, and normal scenarios, using multi-criteria methods (FUCA and TOPSIS) to select those that have the best value; and (6) constructing the graphical interface to be used by the investors starting from the policies implemented or to be implemented.
First, the mapping process was developed using the cause–effect relationship between the variables and parameters in the supply chain, considering four main links: supply, production, distribution, and inverse logistics. For this purpose, processing maps were used where input entries, elements that compose the production process and finished product output, were considered including losses in each part of the process. This stage included a generalized vision of the supply chain dynamics.
The second step involved the creation of the causal diagram where the critical variables are taken into account and generated the complex cause–effect relationships of the supply chain over time. Likewise, the parameters of the four links and reinforcing (R) and balance (B) loops were developed. The result of this stage is the causal diagram with three reinforcing and six balance loops.
The third stage was constructing the stock level and flow diagram based on the causal diagram. Starting from an analysis with fig producers from Valle del Mayo, 21 variables were selected considering the fig supply chain and the subproducts generated for their sale. From this step, the key performance indicators (KPIs) that need to be monitored to assess their performance were defined according to the link they belonged to. For example, the supply link measures the incoming number of tons of figs per season. The production link determines the number of tons used for each of the fig-derived products. The distribution link considerers the number of figs delivered to the clients. Finally, the inverse logistic link measures how to make use of shrinkage in the business units. The flux and level diagrams can be used to observe the number of figs accumulated over time starting from those obtained in harvest, which is also provided by input flux. The input and output (physical and information) flow variables and other elements are the auxiliary variables that allow flow and levels to be connected, as well as those basically associated with the behavior of inventories. The equations are part of this stage and are all based on Runge–Kutta method [31].
The fourth stage is associated with the current model simulation and its validation [32] and is the first version of the model to generate reliable data for producers in decision-making. The result is the most realistic model according to the capacity of the equipment to be acquired.
The fifth stage establishes the different policies according to the studied (18) scenarios. With this simulation, the organization anticipated the possible results before proceeding to reality, above all facing exogenous events, such as the behavior of the demand. The result—starting from the multi-criteria analysis using the FUCA and TOPSIS methodologies—allows the current, optimistic, and pessimistic scenarios to be differentiated according to the rules of operation expected for the factory.
The sixth and last stage involved construction of the graphical interface. For this purpose, the images, charts, and indicators of relevance for decision-making were considered using Stella Architect software, creating diverse environments where the user can analyze tendencies starting from different modifiable parameters in the model.
The methodology used in this study is based on works of Forrester [22] and Senge [33] on precursors of systems dynamics developed at Massachusetts Institute of Technology (MIT) since the 1960s, which have been used to date in several contexts with important applications in the agri-food sector.

3. Results

The results for the operation of the fig-derived product factory were generated from the previously mentioned stages as follows:

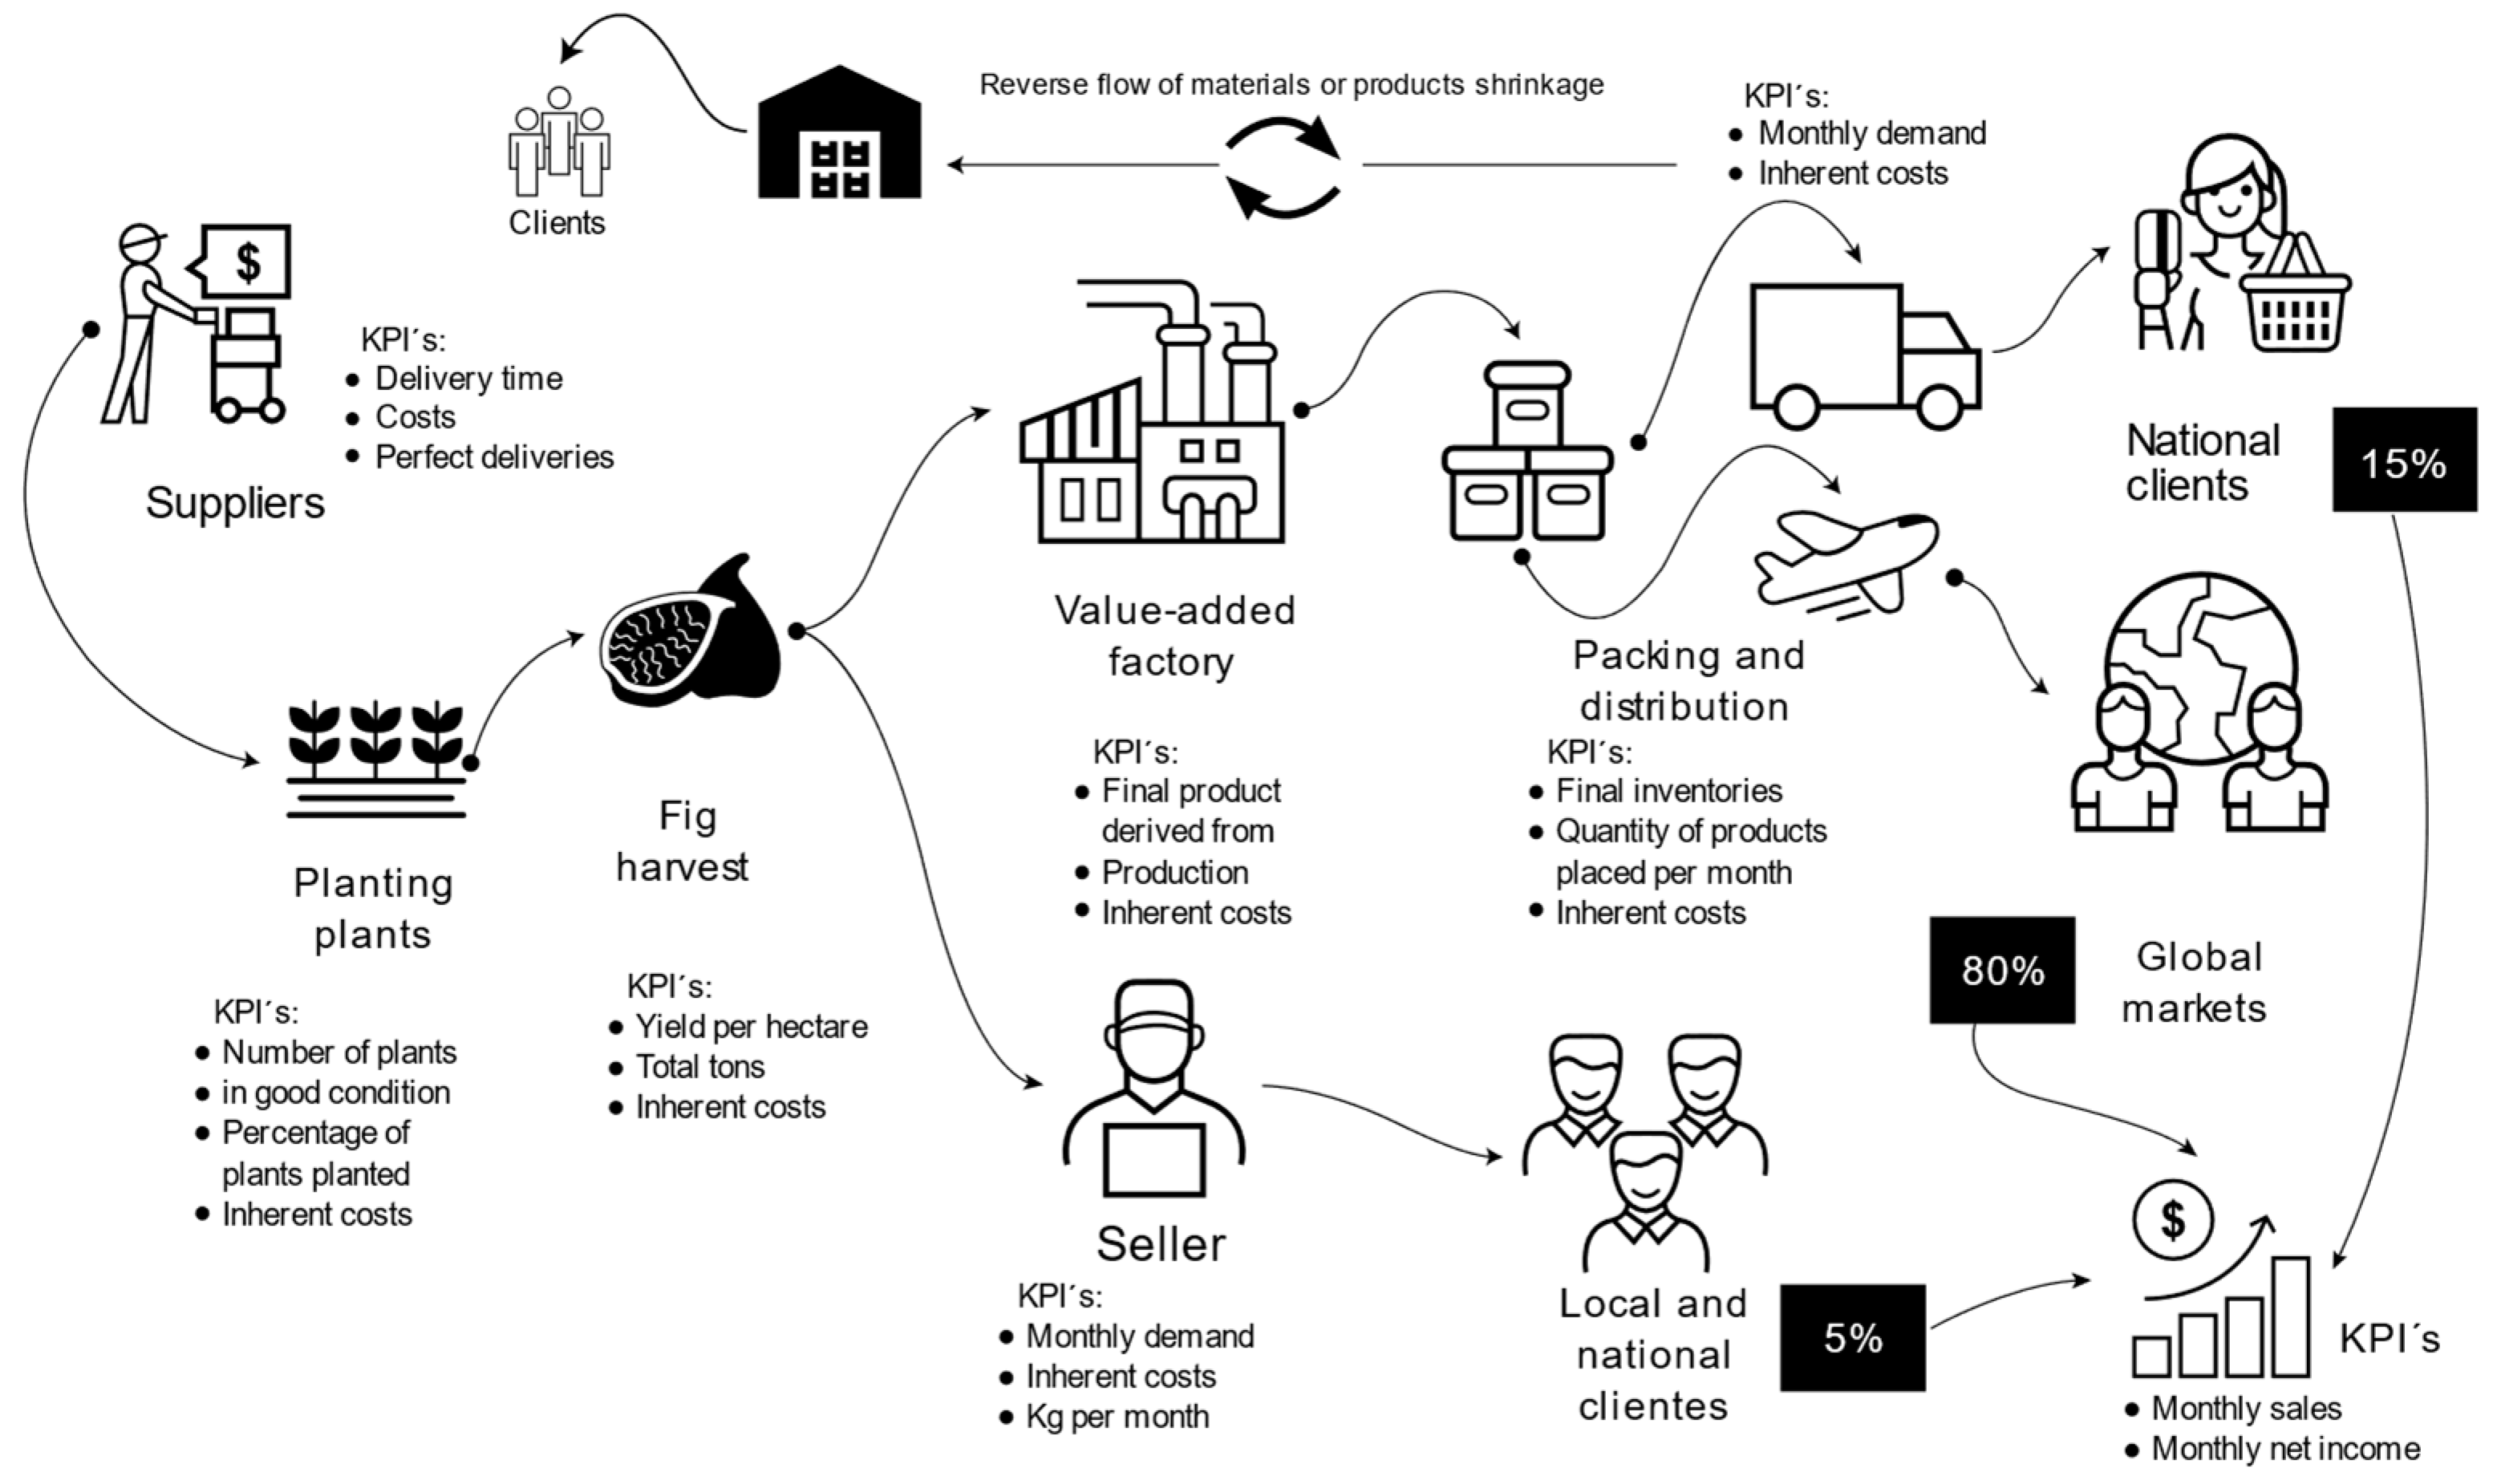
3.1. Mapping the Fig Supply Chain

The fig producers of Valle del Mayo have only 9 ha with 4500 F. carica plants with an average production capacity from 5–6 t/ha starting from year three. Figure 2 shows the logistics of the fig supply chain, in general, from the supply process up to fig sale to the different markets that form part of the project.
The logistics and supply chain work together to achieve product fluidity. Delivery time, minimum costs, and perfect deliveries are considered technological solutions that can be implemented in the fig factory and connected to providers and distributers for internal and external clients. The links are explained as follows:
Supply: F. carica variety Black Mission trees are supplied by plant providers to different producers, either external or internal, that supply figs to the production process. It is important to highlight that this part is critical throughout the supply chain. The care provided during plant growth, harvest, and storage is very important because of the adequate temperatures needed to maintain a top quality product for export to international markets.
Production: The plants are sown independently by each producer, a process which can take several years. The maturity process of the fig plant according to the harvest premises has three stages: (1) fig fruit transformation into added-value products (fig paste for cookies; “coyotas”, flat and filled pastries from Sonora, Mexico; cakes; marmalade; yoghurt; liquor; honey figs; fig salami; fig coffee as artisanal infusion; fig slices; extracts of fig leaf in drops; fig drops; fig leaves as alternative medicine; figs in syrup); (2) harvesting and displayed fig fruit as directly for sale with local, regional, or national clients; (3) consumption of figs in Southern Sonora, as long as the sufficient demand exists.
End product distribution: The distribution logistics according to the packaging and product sale process is variable. If the product is to be placed in international markets, it should be tailored to the adequate transport means, managing the cold chain for its distribution, given that figs undergoing this process are highly perishable in normal conditions. If the product is transformed, the logistics of packaging and packing for its distribution is different.
End client: The client is the recipient of the end products according to the orders made to the association. The provider in common agreement establishes credit to receive the payment for the end product. The cycle is repeated in accordance with the client demand and the capacity of each producer’s production as part of the association.
Reverse logistics: This stage takes place in the inner part of the producers’ association to make use of all the raw matter that is not safe for human consumption, which may be used as compost. Packaging can be recycled, with the aim of optimizing the use of water and energy required throughout the supply chain.
As previously mentioned, each of the processes and their relationships, including their key performance indicators (KPIs), were designed according to the needs. For example, starting from the providers, sowing and harvest follows and is divided into two: fresh product sale directly to the client or as sub-products (added value) considering the packaging, storage, and distribution processes. In each of the chains, reverse logistics is considered to ensure environmental friendliness, for which KPIs are applied, such as percentage of returns and shrinkage and cost per units returned.

3.2. Creating a Causal Diagram (R and B Loops)

The interaction between the variable is represented by means of symbols that elucidate the behaviors, which are reinforcing effects, represented by a positive sign or with the letter R. On the other hand, the balance effect is represented by a negative symbol or the letter B. Figure 3 shows the causal diagram structure where the cause–effect relationships given between two or more variables are shown graphically.
The causal diagram can be used to analyze the complexity of the supply chain from raw matter to the end consumer. The structure has nine loops, of which six are balance type (B1, B2, B3, B4, B5, and B6) and three are the reinforcing type (R1, R2, and R3). The first causal loops—B1, B2, and B3—show the relationship between fig harvesting with production orders, storage, and subproducts that have shrinkage within spoilage and processing, respectively; B4 shows the relationship between fertilizers and contamination; and the B5 and B6 loops show the relationship that exists between raw material supply with the supplier and raw material in storage. On the other hand, the reinforcing R1 loop shows the relationships between fig processing, production orders and sales; R2 shows the relationship between pruning and fig harvesting; and lastly, the R3 reinforcing loop shows the relationship between subproducts and specification.

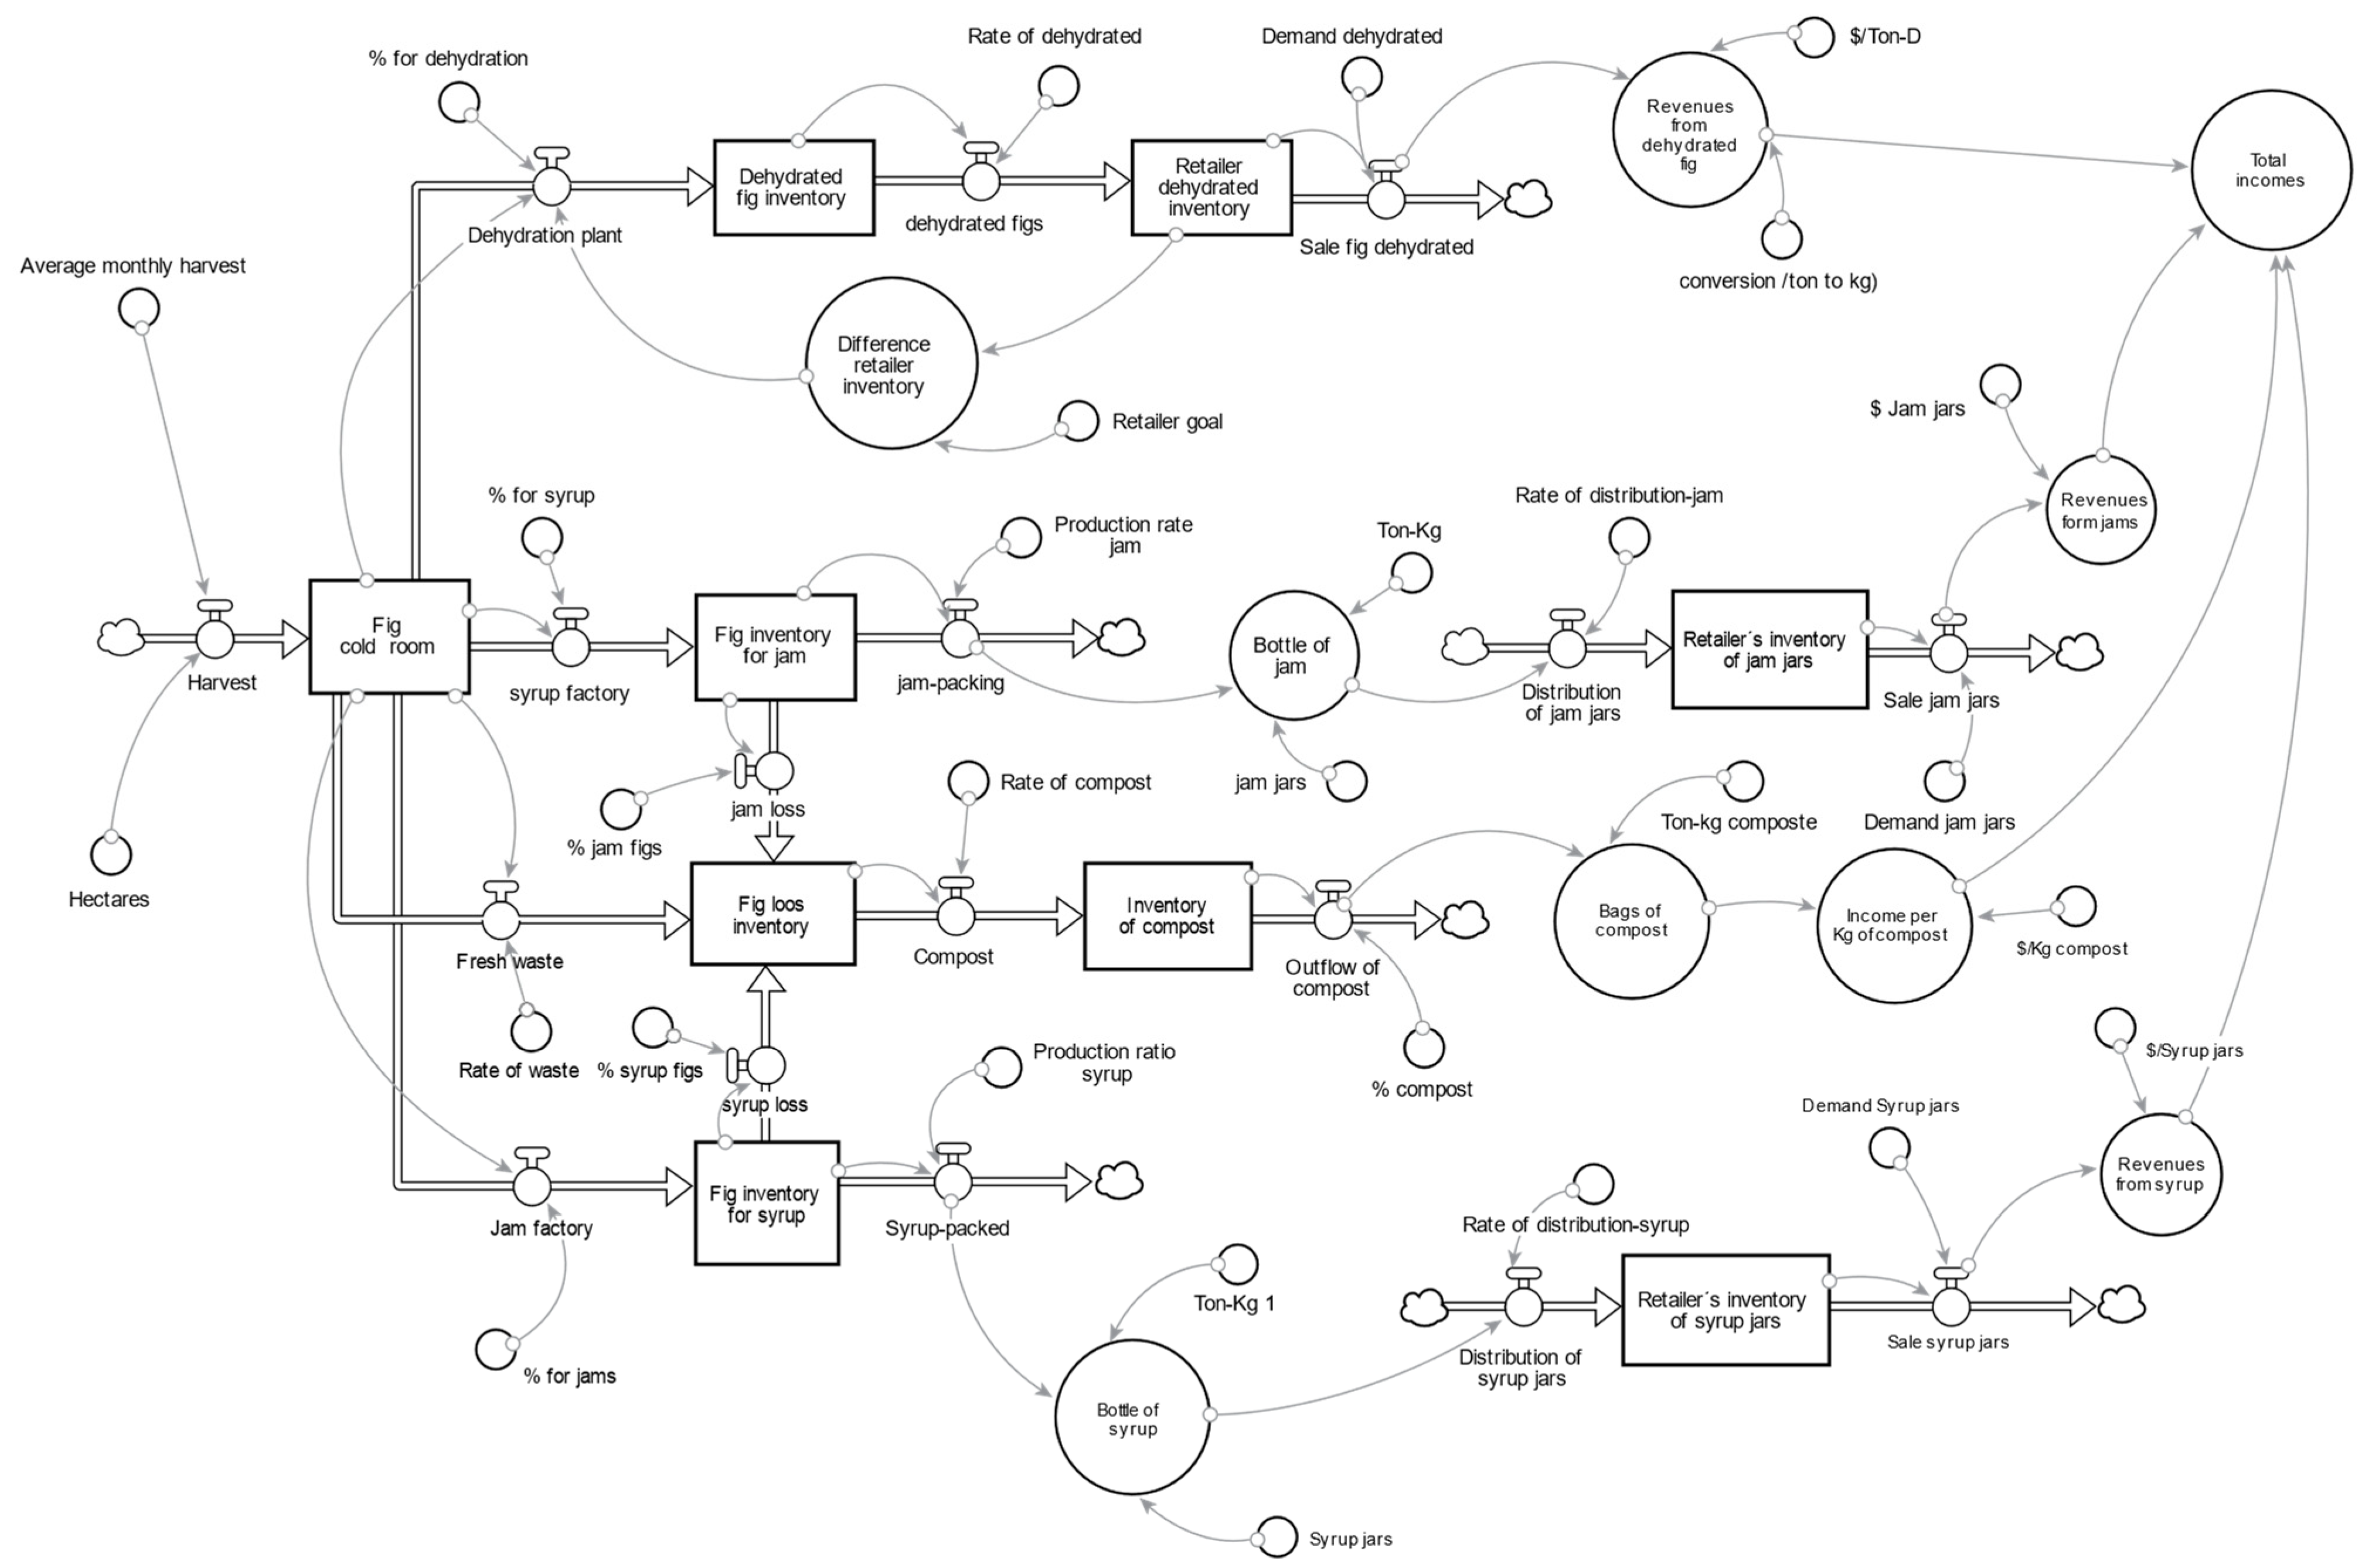
3.3. Elaborating the Stock and Flow Diagram and Equations

The flow and stock level diagram was developed from the causal logistics diagram. Figure 4 shows the structure that represents part of the stocking link and production concentrated in the inventory levels, as well as the sale of four subproducts to sellers for their distribution in the different markets. Sales generated by the retailers during 20 simulation days were also calculated.
The stocking link considers the fig harvest that forms part of the daily inventories placed in the factory cold rooms that is then processed in each subproduct, classified as four types: (1) jars of figs in syrup; (2) bags of dehydrated fig; (3) jars of fig marmalade; and (4) compost from subproduct waste or fresh fig shrinkage or spoilage. The structure outlines all the model variables and parameters in general. As an example, the following events are detailed:
  • Dehydrated fig fruit production: A percentage of the total fig harvest is assigned to each of the fig-derived products. For dehydrated figs, 30% of fresh figs are assigned and require pre-treatment before processing. The figs should be washed with boiling water to eliminate any type of bacteria and improve their odor, color, and texture. Then, the process starts, first by peeling the skin off, cutting, and draining, followed by mechanized drying, which completely dries the fruit, and lastly the packaging process. The same logistics follows for the fig-derived syrup and marmalade products.
  • Utilizing fig fruit shrinkage: The process starts with harvest shrinkage or spoilage inflow once the determined processes are performed. When the shrinkage percentage is obtained, it is converted into compost and sold to clients as fertilizers. The demand and approximate sales are determined.
  • Subproducts sales: The clients and sales are considered as local, national, or international for each of these subproducts, which varies because of the demand that each category has.
  • Total income: Income is the sum of the inflow generated by the sales of the subproducts: jars of figs with syrup, dehydrated figs (kilogram), jars of marmalade, as well as compost.
  • Mathematical equations and dynamic model parameters.
  • The model contemplates different mathematical equations classified by type in: (a) level; (b) inflows; (c) outflows; and (d) auxiliaries, including the parameters as deterministic information to run the model. All the equations interact in the supply chain dynamics. Ten equations and eight parameters are considered in the model.
Level:
Dehydrated _ fig _ Dehydrated _ fig _ inventory ( t ) =   Dehydrated _ fig _ inventory ( t     dt ) + ( Dehydration _ plant     Dehydrated _ figs ) ×   dt  
Fig _ inventory _ for _ syrup ( t ) =   Fig _ inventory _ for _ syrup   ( t     dt ) + ( Jam _ factory   Syrup packed   syrup _ Loops ) ×   dt  
Fig _ Cold _ Room ( t ) =   Fig _ Cold _ Room ( t     dt ) + ( Harvest     Syrup _ factory     Jam _ factory     Dehydration _ plant     fresh _ waste ) ×   dt  
Inflows:
Dehydration _ plant =   IF   Difference _ Retailer _ Inventory   > 10   THEN   Fig _ Cold _ Room × % _ for _ dheydration   ELSE   1
Harvest   =   Average _ monthly _ harvest × Hectares  
Ouflows:
Dehydrated _ figs   =   Dehydrated _ fig _ inventory   ×   Rate _ of _ Dehydrated
Sale _ Fig _ Dehydrated   =   STEP   ( Retailer _ dehydrated _ Inventory × Demand _ Dehydrated ,   5 )
Auxiliary:
Revenues _ from _ dehydrated _ fig   =   Sale _ Fig _ Dehydrated × $ / ton D × conversion _ ( ton _ to _ kg )
Difference _ Retailer _ Inventory   =   Retailer _ Goal Retailer _ dehydrated _ Inventory
Total _ Incomes = Revenues _ from _ syrup + Revenues _ from _ dehydrated _ fig + Revenues _ form _ Jams +   Income _ per _ Kg _ of _ compost
Parameters:
  • Production_rate_jam = STEP (5, RANDOM (0.2, 0.5))
  • Production_ratio_syrup = STEP (5, RANDOM (0.3, 0.6))
  • Rate_of_compost = 0.8
  • Rate_of_Dehydrated = STEP (5, RANDOM (0.2, 0.4))
  • Rate_of_Distribution-Jam = RANDOM (0.4, 0.6)
  • Rate_of_Distribution-Syrup = RANDOM (0.7, 1)
  • Rate_of_Wate = 0.1
  • Retailer_Goal = 10,000 kg

3.4. Simulation and Validation of the Current Model

The current fig fruit supply chain model can generate six scenarios, which are simulated using Stella Architect software as shown in Table 1. Each scenario has 10 performance markers, which form part of the model. Moreover, the table shows the objective of each of the markers (maximizing or minimizing). Another important value is weighing each marker (the sum of which should be 1 in total). The rest of the table matrix consists of the results obtained for the corresponding scenario simulation for each of the markers. Table 1 shows the decision matrix used in the TOPSIS method to obtain the ranking of the scenarios generated from the fig supply chain.
The application of the TOPSIS method shows that the best ranked scenario is number 2 with a relative proximate value of 0.6803, whereas the worst one (last position) was the current scenario 6 with a relative proximate value of 0.3298.
A comparative analysis was performed to validate the results by using FUCA. This method is used in multiple criteria decision aiding (MCDA), which differs from TOPSIS in that the lower the value of the weighted sum, the better the position in the ranking scenario (Table 2).
The best current scenario is 2 with the weight sum value of 2.3, and the worst one is scenario 6 (0.3298).

3.4.1. Policy Design and Scenario (FUCA and TOPSIS) Evaluation

The simulation of the current scenarios was compared with six pessimistic and six optimistic scenarios by means of MCDA TOPSIS and FUCA methods. In this comparison, the same 10 performance markers (criteria) previously mentioned were used and taken into account in the analysis data, showing the three best and worst scenarios compared to the current ones (see Table 3).
With respect to the previous table, the comparison of the 18 scenarios analyzed provided the best results that could be obtained. The following is determined according to the type of scenario:
  • Optimistic scenario: The higher the general value, the better scenario for the fig-derived factory operation. The general value obtained with TOPSIS was 0.6027, given in the optimistic scenario number 2, ranked in position 1.
  • Pessimistic scenario: The higher the general value in the worst scenario, the better the scenario for the factory operation. The value generated with TOPSIS was 0.4627 for scenario number 6, ranked in position 6.
  • Current scenario: The higher general value is selected for the factory operation under the current conditions. The generated value with TOPSIS was 0.4530 for the normal scenario 8, ranked in position 8.
On the other hand, Table 4 shows the FUCA method to compare the 18 scenarios that derived from the simulation and its analysis.
The following three best results were obtained from the 18 scenarios and their comparison in Table 4, considering the following:
  • Optimistic scenario: The lower the value generated, the better the scenario for the fig-derived factory operation. The general value with FUCA is 1, which is given in the optimistic scenario ranked 6 in position 1.
  • Pessimistic scenario: The lower the general value in the worst scenario, the better the scenario for the factory operation. The generated value with FUCA is 4.6 for the pessimist scenario 6, ranked in position 7.
  • Current scenario: The lowest general value is selected for the factory operation under the current conditions. The generated value with FUCA is 6.55 for the normal scenario 5, ranked in position 12.

3.4.2. Comparative Analyses with FUCA and TOPSIS

The comparative analysis was developed starting from the summary generated by the general values. In this sense, Table 5 shows the agreement between the FUCA and TOPSIS methods in determining the scenarios the factory could reach.
The scenarios with greater coincidence in both methods are optimistic 5 and 6 scenarios, where TOPSIS offers the general values of 0.6016 and 0.5822 ranked in second and third place, respectively. Likewise, FUCA offers the general values of 1 and 1.5 ranked in first and second place, respectively. Therefore, the two optimistic scenarios (5 and 6) are the best, according to the two previously mentioned multi-criterion methods offered and considering the analyses of the selected variables and parameters.

3.5. Graphical Interface

Starting from the model validation and scenario execution, the technological solution was developed based on a graphical interface as a decision-making quantitative support for the association of fig producers from Valle del Mayo. The interface consists of screens, starting with the main menu where the instructions and content of the graphical interface are shown. The most relevant screens in this project are as follows.
Figure 5 shows the behavior of the fresh fig inventories, which should be considered for the fig production option (fresh, dehydrated, and in syrup).
Managing fresh figs is of vital importance. The chart shows the deliveries made to the different transformation processes during the 20-day simulation in the factory proposal for the Valle del Mayo fig producers. Figure 5 shows the distribution for the different options: dehydrated figs (492 kg), marmalade (491 kg), and finally syrup (654 kg).
Similarly, Figure 6 shows the inventory behavior of the retailers associated with the fig-derived subproducts with the values reached in the initial simulation.
The inventory charts have a behavior based on the demand obtained from the following link. Some of them have a chaotic behavior, such as the dehydrated fig sales, because the minimum and maximum variable demands were considered from 40% to 60% during simulation. In the case of the compost inventory, the demands were considered at 80% without variations, starting from the scenario of a fixed demand.
On the other hand, an important element for business decisions is established by the income of the sales achieved. Figure 7 shows the behavior of the scenario under the normal current conditions of the organization.
Figure 7 shows the values in terms of income established under the normal conditions of the best income given by the sale of dehydrated figs (USD 66,400.00). Likewise, the sales of the rest of the fig-derived products generated income for the investors of USD 7270.00 for compost; USD 8660 for figs in syrup; and USD 2880 for the total fig marmalade bottles sold for each 20-day factory operation.

4. Discussion

The basis of the model construction starts from an existing strategic plan that demands the closure of gaps by implementing projects. One of the projects is to develop technological solutions for decision-making, from which the proposed system dynamics methodology is taken as reference to respond to the needs of the fig fruit producers of Valle del Mayo, Sonora.
Two different systematic approaches exist to solve real problems from formal models that are supported by mathematics and numeric methods [31]. The challenge is how to correctly select the decision variables that represent the system reality. Thus, methodologies, such as the system dynamics work of Sterman [21] and Randers [34], support decision-making in complex environments. From this context, the theoretical foundation based on mathematical sciences can be used to construct models that represent the reality of a supply chain, such as the one proposed in this research study starting from a systematic process as discussed in the following sections:
The first section is the real system representation by mapping the process that can visualize the elements that make up the fig fruit supply chain and its derivatives, where the associated relationships and KPIs are determined.
The second section is the construction stage of the causal models based on two important contributions. Senge [33] in his methodological systems thinking developed one of the most important stages for exploring the dynamic behavior of the variables by taking advantage of the thinking models of all the persons involved in the construction process of the causal diagrams, which can also determine the previous step of the formal model represented by the diagram of blocks and levels proposed by Forrester [22], starting from developing the mathematical equations that form the simulations of each future scenario [26].
The following stages—scenarios and their validation as well as their construction—are discussed according to the results generated and compared with the proposals of other empirical studies.
Using simulation in complex dynamic systems generates relevant information for decision-making when faced with different scenarios present in organizations, the development of which leads to savings before making important investments. In this sense, starting from the decision of the fig-derived product factory construction and equipment and the best use of shrinkage, the initial proposal based on a graphical interface was constructed. Thus, the investors could appreciate the different behaviors of production, sales, and income.
Simulating the scenarios offers a wide panorama in a time horizon of 20 working days of production and through the behavior with tendencies where the decision-makers have the option to implement policies for directing the best decisions based on data and mathematical models for the analysis of complex systems.
In this sense, researchers have expressed the importance of using system dynamics for decision-making in complex environment projects such as the one discussed in this research. For example, Cedillo and Sánchez [35] proposed dynamic self-assessment of the supply chain yield performance in emerging markets. The model was based on key performance indicators (KPIs) as a helpful tool for decision-making and developed with a dynamic system (DS) approach, analyzing different scenarios and taking into account the KPIs and their dynamic relationships. This study is associated with the fig-derived product factory because it also studied performance indicators that affect the variables in the supply chain using a DS.
The work of Rebs et al. [36] offers a review of the DS models related to the supply chain from the systemic perspective in a conceptual framework proposing guidelines for modeling with a DS. The authors examined the DS models for the supply chain as direct, inverse, and closed cycles that include environmental or social sustainable aspects. The importance of developing the proposal of the fig factory is that it can generate a solution that does not affect the environment and may be a viable economic and social option for generating income and creating employment in Valle del Mayo.
On the other hand, the contributions of Mohammad et al. [37] dealt with social challenges that involve the phosphorus supply chain at the global level, such as eradicating poverty, child labor, and malnutrition; promoting gender equality; decent work availability and economic growth; sustainable water use and maintenance; and achieving food security. This research is motivated by the circular economy approach to direct phosphorus management toward the resolution of social problems associated with its supply chain [38].
Therefore, in comparison with the fig factory study, this project deals with the topic of providing support to micro-producers to generate fig-derived products with added value for sale in diverse markets at a better price and avoiding loss because these products require a cold chain for their maintenance over time and normal conditions.

5. Conclusions

The use of simulation in complex dynamic systems generates relevant information for decision-making in diverse scenarios found in organizations, which can lead to savings for decision-makers before making important investments.
The main conclusion shows 18 scenarios, of which 6 were simulated in the most normal conditions of the factory and where inventory aspects—raw matter, finished products, demand, and income—are addressed as the main attributes of the factory. The determination of scenarios that considered to need more attention was based on the analysis of the 10 criteria applying FUCA and TOPSIS. These methods can discretize the scenarios where the factory would be in the best conditions, as well as those in which the factory could be at greater risk according to the general values.
The proposal in this research is based on a general model that basically studies the behavior of inventories in 20 days of production. It is the basis for analyzing each of the parts that compose the storage links considering the equipment to be acquired and associated with stocking, production, and distribution policies based on the current and projected demand. Furthermore, reusing the raw matter generated as waste by fresh fig shrinkage or derived products should be considered in the transformation process. This study was carried out for a specific site and purpose in Mexico, but it can be applied in other parts of the country and at the global level.

Author Contributions

Conceptualization, E.A.L.-L., A.B.-S., and L.F.M.-M.; Methodology, E.A.L.-L.; A.B.-S. and L.F.M.-M.; Software, E.A.L.-L.; Validation, E.A.L.-L., L.F.M.-M., and A.B.-S.; Formal Analysis, E.A.L.-L.; Investigation, E.A.L.-L.; Resources, E.A.L.-L.; Data Curation, E.A.L.-L. and L.F.M.-M.; Writing—Original Draft Preparation, E.A.L.-L.; Writing—Review and Editing, L.F.M.-M. and A.B.-S.; Visualization, E.A.L.-L.; Supervision, A.B.-S.; Project Administration, E.A.L.-L. and A.B.-S.; Funding Acquisition, E.A.L.-L. All authors have read and agreed to the published version of the manuscript.

Funding

This research received no external funding.

Institutional Review Board Statement

Not applicable.

Informed Consent Statement

Not applicable.

Acknowledgments

The authors are grateful to ITSON (Instituto Tecnológico de Sonora) for the support through the project PROFAPI 2022; to Consejo Nacional de Ciencia y Tecnología (CONACYT) for the support of ITSON Laboratorio Nacional en Sistemas de Transporte y Logística-Sede; to small fig producers of Valle del Mayo for access to the information; and to Diana Fischer for English translation and editing of the manuscript.

Conflicts of Interest

The authors declare no conflict of interest.

References

  1. Grupo Ceres. Higo, una Deliciosa Opción Para Cultivar. Centro Internacional de Mejora de Maíz y Trigo. 2021. Available online: https://idp.cimmyt.org/higo-una-deliciosa-opcion-para-cultivar/ (accessed on 19 June 2022).
  2. Gallego, M.C.; Angulo, R.; Serrano, S.; Jodral, M. Estudio espacio-temporal del consumo de higos. CYTA-J. Food 1996, 1, 43–48. [Google Scholar] [CrossRef]
  3. Secretaría de Agricultura y Desarrollo Rural. Higo, Fruto de Gran Historia Presente en Nuestra Canasta de Dulces Tradicionales. Gobierno de México. 2020. Available online: https://www.gob.mx/agricultura/articulos/higo-fruto-de-gran-historia-presente-en-nuestra-canasta-de-dulces-tradicionales (accessed on 29 June 2022).
  4. SENASICA. Huertos de Higo Registrados Para Exportación a los Estados Unidos de América. Gobierno de México. 2022. Available online: https://www.gob.mx/senasica/documentos/huertos-de-higo-registrados-para-exportacion-a-los-estados-unidos-de-america?idiom=es (accessed on 22 June 2022).
  5. Rambaldi, M. Higo: Propiedades y Características. Pregon Agropecuario. 2017. Available online: https://www.pregonagropecuario.com/cat.php?txt=9248 (accessed on 2 July 2022).
  6. Galvez Fustamante, J.V. Capacidad antioxidante y Contenido de Polifenoles Las Hojas de Ficus Carica (higo). 2018. Available online: https://repositorio.uladech.edu.pe/bitstream/handle/20.500.13032/7942/FICUS_CARICA_CAPACIDAD_ANTIOXIDANTE_GALVEZ_FUSTAMANTE_JOSE_VLADIMIR.pdf?sequence=1&isAllowed=y (accessed on 12 July 2022).
  7. SIAP. Infosiap, Gobierno de México. 2020. Available online: http://infosiap.siap.gob.mx:8080/agricola_siap_gobmx/AvanceNacionalCultivo.do (accessed on 7 June 2022).
  8. Lagarda-Leyva, E.; y Zavala, C. Plan Estratégico 2022-20226 Para la Asociación de Productores del Valle del Mayo, Navojoa, México. 2021. Available online: https://drive.google.com/file/d/1regBEvpBRC3a4BiJz7LShuoalFDl7kME/view?usp=sharing (accessed on 25 June 2022).
  9. Rønsted, N.; Weiblen, G.D.; Savolainen, V.; Cook, J.M. Phylogeny, biogeography, and ecology of Ficus section Malvanthera (Moraceae). Mol. Phylogenet. Evol. 2008, 48, 12–22. [Google Scholar] [CrossRef] [PubMed]
  10. Jeong, W.S.; Lachance, P.A. Phytosterols and fatty acids in fig (Ficus carica var. mission) fruit and tree components. Food Chem. Toxicol. 2001, 66, 278–281. [Google Scholar] [CrossRef]
  11. Veberic, R.; Jakopic, J.; Stampar, F. Internal fruit quality of figs (Ficus carica) in the Northern Mediterranean Region. Ital. J. Food Sci. 2008, 20, 255–262. [Google Scholar]
  12. Cuasquer, D.; Chacua, A. Determinación del Proceso Tecnológico Para la Obtención de Harina de Higo de dos Estados de Madurez. Universidad Técnica del Norte. 2010. Available online: http://repositorio.utn.edu.ec/handle/123456789/384 (accessed on 18 June 2022).
  13. Andrea, D. Elaboración de Saborizantes en Polvo, a Partir de Cinco Frutas Deshidratadas Como: Higo, Membrillo, Níspero, Mortiño, y Uvilla Para la Aplicación en Cinco Tipos de Bizcochos y Cinco Tipos de Galletas. 2015. Available online: http://dspace.ucuenca.edu.ec/handle/123456789/22376 (accessed on 15 July 2022).
  14. Veberic, R.; Colaric, M.; Stampar, F. Phenolic acids and flavonoids of fig fruit (Ficus carica) in the northern Mediterranean region. Food Chem. 2008, 106, 153–157. [Google Scholar] [CrossRef]
  15. Abril Ortiz, R.G. Incidencia de los Métodos de Procesamiento en la Subutilización y Escasa Exportación del Higo (Ficus carica). Séptimo Seminario de Graduación de la Facultad de Ciencia e Ingeniería en Alimentos. Bachelor’s Thesis, Universidad Técnica de Ambato, Ambato, Ecuador, 2007. [Google Scholar]
  16. Catraro, M. El Cultivo de la Higuera: Producción de Higos y su Deshidratación Como Método para el Agregado de Valor del Producto. 2014. Available online: https://bibliotecavirtual.unl.edu.ar:8443/bitstream/handle/11185/663/TFI.pdf?sequence=1&isAllowed=y (accessed on 29 July 2022).
  17. Helmy, M.; Sorour, H.; El-Kholy, M.; El-Mesery, H. Drying figs using development mechanical dryer. Misr. J. Agric. Eng. 2010, 27, 1879–1889. [Google Scholar] [CrossRef]
  18. Villalobos, M.; Córdova, M.; Serradilla, M.; Sánchez, S.; González, A. Sistemas de Secado Alternativos al Secado al sol en Higos. 2015. Available online: https://www.unex.es/conoce-la-uex/centros/eia/archivos/iag/2015/2015-10-sistemas-de-secado-alternativos-al-secado.pdf (accessed on 2 August 2022).
  19. Villalobos, M.C.; Serradilla, M.J.; Martín, A.; Pereira, C.; López-Corrales, M.; Córdoba, M.G. Evaluation of different drying systems as an alternative to sun drying for figs (Ficus carica). Innov. Food Sci. Emerg. Technol. 2016, 36, 156–165. [Google Scholar] [CrossRef]
  20. Aracil, J.; Gordillo, F. Dinámica de Sistemas; Alianza: Madrid, Spain, 1997. [Google Scholar]
  21. Sterman, J. Business Dynamics: Systems Thinking and Modeling for a Complex World; McGraw Hill: New York, NY, USA, 2000. [Google Scholar]
  22. Forrester, J. Dinámica Industrial (Segunda Edición); El Ateneo: Buenos Aires, Argentina, 1981. [Google Scholar]
  23. Bueno-Solano, A.; Lagarda-Leyva, E.A.; Miranda-Ackerman, M.A.; Velarde-Cantú, J.M.; Pérez, K.G. Conceptual fluidity model for resilient agroindustry supply chains. Prod. Manuf. Res. 2022, 10, 281–293. [Google Scholar] [CrossRef]
  24. Lagarda-Leyva, E.A.; Morales-Mendoza, L.F.; Ríos-Vázquez, N.J.; Ayala-Espinoza, A.; Nieblas-Armenta, C.K. Managing plastic waste from agriculture through reverse logistics and dynamic modeling. Clean Technol. Environ. Policy 2019, 21, 1415–1432. [Google Scholar] [CrossRef]
  25. Richardson, G.; Pugh, A., III. Introduction to System Dynamics Modeling with Dynamo. J. Oper. Res. Soc. 1997, 48, 1146. [Google Scholar] [CrossRef]
  26. Schwartz, P. The Art of the Long View: “Planning for the Future in an Uncertain World”; Currency Doubleday: New York, NY, USA, 1996. [Google Scholar]
  27. Fernando, M.M.L.; Escobedo, J.L.P.; Azzaro-Pantel, C.; Pibouleau, L.; Domenech, S.; Aguilar-Lasserre, A. Selecting the best portfolio alternative from a hybrid multi objective GA-MCDM approach for New Product Development in the pharmaceutical industry. In Proceedings of the IEEE Symposium on Computational Intelligence in Multicriteria Decision-Making (MDCM), Paris, France, 11–15 April 2011; pp. 159–166. [Google Scholar] [CrossRef]
  28. Wang, Z.; Rangaiah, G.P. Application and Analysis of Methods for Selecting an Optimal Solution from the Pareto-Optimal Front obtained by Multiobjective Optimization. Ind. Eng. Chem. Res. 2016, 56, 560–574. [Google Scholar] [CrossRef]
  29. Lagarda-Leyva, E.A.; Ruiz, A. A Systems Thinking Model to Support Long-Term Bearability of the Healthcare System: The Case of the Province of Quebec. Sustainability 2019, 11, 7028. [Google Scholar] [CrossRef] [Green Version]
  30. Arana, A.; Cárdenas, K.; Gutiérrez, P.; Lagarda, A.; Perez, A.; Robles, C.; Salido, F.; Verdugo, S. Dinámica de Sistemas: Solución Tecnológica Para la Cadena de Suministro del Cerdo en una Empresa del sur de Sonora, En Análisis Logístico, un Enfoque Integral. 2021. Available online: https://itson.mx/publicaciones/Documents/ingytec/Libro%20ANÁLISIS%20LOGÍSTICO_compressed.pdf (accessed on 5 August 2022).
  31. Chapra, S.; Canale, R. Métodos Numéricos para Ingenierios, 7th ed.; Mc Graw Hill Education: New York, NY, USA, 2015. [Google Scholar]
  32. Miser, H. A foundational concept of science appropriate for validation in operational research. Eur. J. Oper. Res. 1993, 66, 204–215. [Google Scholar] [CrossRef]
  33. Senge, P. La Quinta Disciplina. (Segunda Edición); Granica: Buenos Aires, Argentina, 2005. [Google Scholar]
  34. Randers, J. Elements of the System Dynamics Methods. MIT Press: Cambridge, MA, USA, 1980; ISBN 0-262180928. [Google Scholar]
  35. Cedillo-Campos, G.; Sánchez Ramírez, C. Dynamic Self-Assessment of Supply Chains Performance: An Emerging Market Approach. J. Appl. Res. Technol. 2013, 11, 338–347. [Google Scholar] [CrossRef]
  36. Kleijnen, J. Verification and validation of simulation models. Eur. J. Oper. Res. 1995, 82, 145–162. [Google Scholar] [CrossRef] [Green Version]
  37. el Wali, M.; Golroudbary, S.R.; Kraslawski, A. Circular economy for phosphorus supply chain and its impact on social sustainable development goals. Sci. Total Environ. 2021, 777, 146060. [Google Scholar] [CrossRef] [PubMed]
  38. Rebs, T.; Brandenburg, M.; Seuring, S. System dynamics modeling for sustainable supply chain management: A literature review and systems thinking approach. J. Clean. Prod. 2018, 208, 1265–1280. [Google Scholar] [CrossRef]
Figure 1. System dynamics methodology for a fig-derived product factory. Source: own production.
Sustainability 14 13043 g001
Figure 2. Supply chain of Ficus carica Black Mission fruit product. Source: own production, 2022.
Sustainability 14 13043 g002
Figure 3. Causal loop diagram for fig factory. Source: own production (2022).
Sustainability 14 13043 g003
Figure 4. Flow and stock diagram for fig supply chain. Source: own production (2022).
Sustainability 14 13043 g004
Figure 5. Graphical interface of fresh fig inventory management for each subproduct. Source: own production with the support of Freepik (https://www.freepik.es/vectores/taza-vintage (accessed on 7 July 2022).
Sustainability 14 13043 g005
Figure 6. Graphical interface for inventory management for retailers of fig-derived subproducts. Source: own production with the support of Freepik (https://www.freepik.es/vectores/productos-servicios (accessed on 7 July 2022).
Sustainability 14 13043 g006
Figure 7. Income per fig-derived product. Source: own production with the support of Freepik (https://www.freepik.es/vectores/finanzas (accessed on 7 July 2022)).
Sustainability 14 13043 g007
Table 1. The Technique for Order Preference by Similarity to Ideal Solution (TOPSIS) for the analysis of the current scenarios.
FCRRDIRIJJRISJSDFSJJSSJTIFLIBC
Multicriteria Method:
TOPSIS
Max/MinMaxMinMinMinMaxMaxMaxMaxMinMax
RankingRWeight
Scenario
0.150.150.10.10.10.050.050.20.050.05
50.52190500Current 18.21.09420071901.49126028801140001.07727
10.68039180Current 28.20.97418068101.83126027201580000.849731
30.53874757Current 34.290.532431073801.36129029501030000.566392
20.55765102Current 48.20.454419072801.1312602910905004.3626
40.52955798Current 59.030.58310075900.8519313030795001.17797
60.32984497Current 68.20.704411073800.9931230295075200160
Source: own production (2022). Note: Performance markers: fig cold room (FCR); retailer dehydrated inventory (RDI); retailer's inventory of jam jars (RIJJ); retailer's inventory of syrup jars (RISJ); sales of dehydrated figs (SDF); sales of jam jars (SJJ); sales of syrup jars (SSJ); total income (TI); fig loop inventory (FLI); and bags of compost (BC).
Table 2. Make an Adequate Choice (FUCA) method for the analyses of current scenarios.
FCRRDIRIJJRISJSDFSJJSSJTIFLIBC
Multicriteria Method:
FUCA
Max/MinMaxMinMinMinMaxMaxMaxMaxMinMax
RankingWeight SumWeight
Scenario
0.150.150.10.10.10.050.050.20.050.05
33.15Current 18.21.09420071901.49126028801140001.07727
12.35Current 28.20.97418068101.83126027201580000.849731
53.55Current 34.290.532431073801.36129029501030000.566392
23.1Current 48.20.454419072801.1312602910905004.3626
43.5Current 59.030.58310075900.8519313030795001.17797
64.15Current 68.20.704411073800.9931230295075200160
Source: own production (2022). Note: Performance markers: fig cold room (FCR); retailer dehydrated inventory (RDI); retailer's inventory of jam jars (RIJJ); retailer's inventory of syrup jars (RISJ); sales of dehydrated figs (SDF); sales of jam jars (SJJ); sales of syrup jars (SSJ); total income (TI); fig loop inventory (FLI); and bags of compost (BC).
Table 3. Comparison of all the scenarios with the Technique for Order Preference by Similarity to Ideal Solution (TOPSIS).
FCRRDIRIJJRISJSDFSJJSSJTIFLIBC
Multicriteria Method:
TOPSIS
Max/MinMaxMinMinMinMaxMaxMaxMaxMinMax
RankingGeneral
Value
Weight
Scenario
0.150.150.10.10.10.050.050.20.050.05
10.6027Optimistic 28.21.34418068305.4912502730374,0001.22724
20.6016Optimistic 611.30.84395073803.8311802950266,0001.47986
30.5822Optimistic 58.21.44434072105.4513002880349,0001.07727
40.5660Optimistic 35.631.5271048105.278121920350,0000.729503
50.5232Optimistic 18.20.6420070002.3812602800200,0001.07727
60.4627Pessimistic 523.1011,3000.00333034000.00133781039.50
70.4583Optimistic 49.031.78469059003.0614102360218,0001.17795
80.4530Current 28.20.97418068101.8312602720158,0000.849731
90.4425Pessimistic 47.510.108363067100.561090269050,3000.976668
100.4351Current 48.20.454419072801.131260291090,5004.3626
110.4324Current 59.030.58310075900.851931303079,5001.17797
120.4190Current 34.290.532431073801.3612902950103,0000.566392
130.4097Pessimistic 111.30.857400072001.281200288052,8001.47986
140.4063Pessimistic 611.305620957001690383015,40021.50
150.4052Current 18.21.09420071901.4912602880114,0001.07727
160.4041Pessimistic 35.290.372266012,1000.417799483047,9000.558487
170.3786Pessimistic 28.20.709413069400.6971240278018,5001.07727
180.3760Current 68.20.704411073800.9931230295075,200160
Source: own production (2022). Note: fig cold room (FCR); retailer dehydrated inventory (RDI); retailer's inventory of jam jars (RIJJ); retailer's inventory of syrup jars (RISJ); sales of dehydrated figs (SDF); sales of jam jars (SJJ); sales of syrup jars (SSJ); total income (TI); fig loop inventory (FLI); and bags of compost (BC).
Table 4. The Make an Adequate Choice (FUCA) method for the analyses of all the scenarios.
FCRRDIRIJJRISJSDFSJJSSJTIFLIBC
Multicriteria Method:
FUCA
Max/MinMaxMinMinMinMaxMaxMaxMaxMinMax
RankingGeneral
Value
Weight
Scenario
0.150.150.10.10.10.050.050.20.050.05
188.95Current 11.052.11.20.90.80.30.41.60.30.3
167.9Current 21.051.950.90.50.70.30.651.40.20.25
168.9Current 32.40.91.21.10.70.250.21.40.10.65
157.65Current 41.050.75110.80.250.31.40.60.5
126.55Current 50.750.750.31.20.90.60.151.40.350.15
137.25Current 60.90.90.610.80.40.151.40.550.55
106Pessimistic 10.31.20.50.80.70.40.21.40.450.05
106.25Pessimistic 20.750.90.50.60.70.350.31.80.20.15
106.6Pessimistic 31.50.60.110.80.50.051.60.050.4
95.45Pessimistic 41.20.450.20.40.70.40.31.40.10.3
84.7Pessimistic 50.150.150.80.10.70.050.41.60.40.35
74.6Pessimistic 60.150.150.70.70.70.050.051.40.350.35
63.75Optimistic 10.450.150.40.40.60.150.151.20.10.15
42.35Optimistic 20.450.30.30.30.10.150.150.20.20.2
32.3Optimistic 30.60.450.10.10.20.20.20.20.050.2
32.45Optimistic 40.30.450.30.10.30.050.150.60.10.1
21.5Optimistic 50.30.30.20.10.10.050.10.20.050.1
11Optimistic 60.150.150.10.10.10.050.050.20.050.05
Source: own production (2022). Note: fig cold room (FCR); retailer dehydrated inventory (RDI); retailer's inventory of jam jars (RIJJ); retailer's inventory of syrup jars (RISJ); sales of dehydrated figs (SDF); sales of jam jars (SJJ); sales of syrup jars (SSJ); total income (TI); fig loop inventory (FLI); and bags of compost (BC).
Table 5. Comparative Make an Adequate Choice (FUCA) and Technique for Order Preference by Similarity to Ideal Solution (TOPSIS) analyses.
No.ScenarioRanking
TOPSIS
Ranking
FUCA
General Value
TOPSISFUCA
1Optimistic 2140.60272.35
2Optimistic 3430.56602.30
3Optimistic 4730.45832.45
4Optimistic 5320.58221.50
5Optimistic 6210.60161.00
Source: own production (2022).
Publisher’s Note: MDPI stays neutral with regard to jurisdictional claims in published maps and institutional affiliations.

