Article

Reducing Risks by Transporting Dangerous Cargo in Drones

Transportation, Logistics & Finance, College of Business, North Dakota State University, P.O. Box 6050, Fargo, ND 58108-6050, USA
Sustainability 2022, 14(20), 13044; https://doi.org/10.3390/su142013044
Submission received: 26 September 2022 / Revised: 4 October 2022 / Accepted: 9 October 2022 / Published: 12 October 2022

Abstract

:
The transportation of dangerous goods by truck or railway multiplies the risk of harm to people and the environment when accidents occur. Many manufacturers are developing autonomous drones that can fly heavy cargo and safely integrate into the national air space. Those developments present an opportunity to not only diminish risk but also to decrease cost and ground traffic congestion by moving certain types of dangerous cargo by air. This work identified a minimal set of metropolitan areas where initial cargo drone deployments would be the most impactful in demonstrating the safety, efficiency, and environmental benefits of this technology. The contribution is a new hybrid data mining workflow that combines unsupervised machine learning (UML) and geospatial information system (GIS) techniques to inform managerial or investment decision making. The data mining and UML techniques transformed comprehensive origin–destination records of more than 40 commodity category movements to identify a minimal set of metropolitan statistical areas (MSAs) with the greatest demand for transporting dangerous goods. The GIS part of the workflow determined the geodesic distances between and within all pairwise combinations of MSAs in the continental United States. The case study of applying the workflow to a commodity category of dangerous goods revealed that cargo drone deployments in only nine MSAs in four U.S. states can transport 38% of those commodities within 400 miles. The analysis concludes that future cargo drone technology has the potential to replace the equivalent of 4.7 million North American semitrailer trucks that currently move dangerous cargo through populated communities.

1. Introduction

The ground transport of dangerous goods or hazardous materials (hazmat) multiplies the risk of exposing populations and the environment to spills from handling or transportation mishaps [1]. Therefore, this research identified potential opportunities for future autonomous cargo drone fleets to carry hazmat. In addition to the safety benefits of eliminating the human operator and removing the vehicle from the ground environment, autonomous aircraft service will be faster and more efficient by avoiding ground traffic congestion and operating continuously. External benefits to the environment would be the reduction in road wear from heavy vehicle traffic and the reduction in road congestion, which would also reduce greenhouse gas emissions [2]. Initial successful deployments will encourage the public and regulators to speed up adoption by enacting new policies and standards that will scale commercial cargo drone services worldwide. Therefore, the goal of this research was to identify a minimal set of metropolitan areas where early cargo drone deployments could demonstrate the greatest initial benefits.
Cargo drone developments show steadily increasing levels of automation, heavy-lift performance [3], cost reduction [4], and enhanced safety with distributed electric propulsion [5] and integrated parachute systems [6]. Fleets of cargo drones can fly continuously, autonomously, and quietly [7] to meet the freight throughput demands. Hence, shippers in the commodity supply chain are now evaluating the potential for drones to complement or even replace ground transport modes for some types of commodities [8].
Despite many barriers to their adoption today [9], innovators and manufacturers are on track to automate drones so that they can fly safely without human intervention in beyond visual line of sight (BVLOS) conditions [10], and in all types of weather [11]. Meanwhile, manufacturers and governments are collaborating in an initiative known as Advanced Air Mobility (AAM) to overcome the technical and regulatory hurdles of safely integrating drones into the national airspace [12].
A contribution of this work is a new hybrid data mining (HDM) workflow that combined unsupervised machine learning (UML) and geospatial processing (GP). The UML part of the workflow analyzed the raw data of commodity flows to identify a minimal set of metropolitan areas with the greatest demand for transporting dangerous goods. The GP part of the workflow used geographical information system (GIS) techniques and spatial data to determine the geodesic distances between and within all pairwise combinations of metropolitan areas in the continental United States (CONUS). The technique revealed the potential demand for moving hazmat within various distance bands. The author could not find a similar hybrid analytical workflow within the literature.
The organization of the rest of this paper is as follows: Section 2 reviews the literature on AAM, the classification of dangerous goods, and its transport hazards. Section 3 describes the hybrid data mining (HDM) workflow developed to address the goal of this research. Section 4 discusses the analytical results and implications for stakeholders such as supply chain managers, shippers, urban planners, and policy makers. Section 5 concludes the research and suggests future work.

2. Literature Review

The three subsections of this literature review explore the status of AAM, define dangerous goods, and discuss related research on the risks of transporting dangerous goods.

2.1. Advanced Air Mobility

For certain high-value or urgently needed items, shippers generally exchange the lower cost of ground transportation for the higher speed and security of air transport [13]. The electrification and automation of drones can further reduce the operating costs and safety risks of air transport [14]. Cost savings due to time reduction is one of the main factors driving the drone package delivery initiative by Amazon [15]. Drones can also transport cargo across regions with poor roads, inhospitable terrain, jungles, waterways, or lakes [12]. Hence, cargo drones have recently been used in niche applications such as humanitarian logistics [16], emergency response [17], and the delivery of urgent items such as medical supplies [18] and replacement parts [19].
There has been a drastic increase in the number of articles about using drones for transportation [20]. Many large retailers and shippers have already been using drones for “last-mile” deliveries. For example, in 2022, Walmart announced that it is expanding delivery services from stores to homes and has been achieving average delivery times of 30 min [21]. Similarly, Amazon, DHL, and Federal Express are evaluating the use of drones to expand their next-day or same-day package delivery services [22]. Manufacturers are also developing heavy-lift cargo drones to address “middle-mile” opportunities [23]. In contrast to last-mile, middle-mile encompasses transport service between ports, transshipment facilities, distribution centers, sortation centers, fulfillment centers, warehouses, and stores [24].
In 2021, the U.S. National Aeronautics and Space Administration (NASA) released a concept of operations for Urban Air Mobility (UAM) to promote their vision of using drones to fly passengers and cargo over dense population centers [25]. The Federal Aviation Administration (FAA) released an accompanying concept of operations that expanded the UAM vision as Advanced Air Mobility (AAM) to include other use cases such as public services and recreational use [10]. Although there are still many unresolved risks for the safe integration of drones into the national airspace system [26], there have been many proposals [27] and safety demonstrations [28]. In anticipation of inevitable regulatory certifications, supporting infrastructure, and demand, hundreds of drone manufacturers have attracted billions of dollars in investments to commercialize their aircraft [11,29]. Analysts predict that the global cargo market for drones will reach $58 billion by 2035 [30,31].
FAA regulations will not allow commercial drone operations until service providers can demonstrate their safe operation in the national airspace [10]. Therefore, once certified, shippers will be confident that pilotless drones are safer than other modes of surface transportation because of the reduced conflict with traffic in the vast three-dimensional airspace, the impossibility of human errors, and advancements in air traffic management [12]. Subsequently, shippers can encourage a policy shift towards cargo drones by demonstrating safe operations in a few focused regions that maximize their safety, environmental, and economic impacts [32].

2.2. Defining Dangerous Goods

The USDOT Pipeline and Hazardous Materials Safety Administration (PHMSA) defines nine classes of dangerous goods [33,34]. Table 1 summarizes the classes of hazmat, some examples, their typical uses, and risks.

2.3. Transporting Dangerous Goods

The accidental release of hazmat during transport can adversely affect human health and damage the environment [38]. The Code of Federal Regulations (Title 49, Subtitle B, Chapter I, Subchapter C) regulates the transport of hazmat in the United States [39]. Despite such detailed and strict regulations, the United States experienced more than 189,000 accidents (non-pipeline from 2012 to 2021) involving hazmat that resulted in 1732 injuries, 83 fatalities, and nearly $827 million in property damages [33]. Most of the hazmat incidents occurred on roadways [40]. An external cost from accidents that involve hazmat is the loss of traffic capacity (economic productivity) from closed links during the incident investigation, environmental cleanup, and facility repairs.
The proximity of roadways and railways to vulnerable facilities such as gas stations, hospitals, large buildings, and schools can multiply the potential consequences of accidents involving hazmat [41]. Hazmat spills can contaminate water sources [42] and harm wildlife [43]. Nearby communities can become contaminated in cases involving the release of chemical, biological, radiological, or nuclear substances [44]. A recent study found that exposure to toxic chemicals can adversely affect learning in early childhood [45]. Another recent study found that exposure to pollution increases the risk of more severe infections and deaths from viruses such as COVID-19 [46].
Human factors have been the dominant cause of both railroad [47] and truck accidents [48]. Wei et al. (2021) found that weather, traffic signals, surface conditions, fatigue, and the time of day have strong associations with hazmat road accidents [49]. Future autonomous aircraft offer the potential to reduce the risk of hazmat transport by eliminating the vehicle operator and distancing the vehicle from populated places and the ground environment. Yet, a recent review paper found that there have been extraordinarily few studies of the potential to transport dangerous goods by aircraft [50]. The literature mainly covered risk assessment [51], traffic flow prediction [52], vehicle routing [53], tour length optimization [54], facility locating, scheduling, aircraft loading [55], emergency response [56], and accident cause analysis [40].
A recent survey found that there are currently no regulations that explicitly address the transport of dangerous goods by drones [57]. A few studies examined the risks of carrying certain types of hazmat by air. Hafeez et al. (2022) reviewed the use of drones to apply pesticides [58]. Lukežič et al. (2010) conducted a series of experiments on hexamethylenetetramine and ignition briquettes, which are chemically similar substances that had the same recommended packing group class for air cargo [59]. They found that exposure to elevated temperatures can cause spontaneous combustion in ignition briquettes and, therefore, policies should increase their packaging group class. Flammable liquids will require special containers for both ground and air transport [60]. Containers that eliminate the possibility of an uncontrolled fire can prevent the explosion of substances such as ammonium nitrate fertilizer [61].
The need for rapid response in emergency medicine has led to a proliferation of drone usage to carry certain life-saving items [62]. Studies have shown that active cooling boxes attached to drones can maintain the integrity of biological samples [63], human organs [64], and adrenaline auto-injectors used to treat anaphylaxis [65]. Zipline in Rwanda has grown into a service that uses drones to deliver blood and related medical products to remote health facilities [18].
In summary, there is no other work in the literature that considered opportunities to leverage the future capabilities of AAM to transport dangerous cargo. The literature does not describe a similar data mining workflow that combined methods of transforming origin–destination commodity flow data to reveal insights about outlier locations that currently move the largest amounts of dangerous cargo. The literature does not discuss how to select distance bands that would address the maximum potential demand in the fewest locations that future cargo drones could serve.

3. Methodology

Figure 1 illustrates the HDM workflow with the procedures, as coded in software, and their interactions. The data layer of the workflow used the Freight Analysis Framework (FAF) dataset because it is the most comprehensive source of multimodal commodity flows available for locations within the United States [66]. The FAF combines shipping data from the Bureau of Transportation Statistics (BTS) of the U.S. Department of Transportation (USDOT) and the U.S. Census Bureau (USCB) [67]. Each row of version 5.2 of the FAF dataset lists a commodity category moved between pre-defined zones (FAF zone) by transport mode category (air, rail, truck, etc.), weight in thousand-ton units, and value in million U.S. dollar (USD) units. The generalized design of the workflow enables analysts to apply it to any available dataset of commodity flows elsewhere in the world.
The next three subsections describe how the HDM workflow summarized the weight of commodity categories moved in each FAF zone of the CONUS, determined a suitable category of dangerous goods for the case study, identified clusters of demand for multiple ground transportation modes, and created a histogram of the weight moved within a series of distance bands.

3.1. Pivot Table by Weight

The “Extract” procedure partitioned the data into three modal subsets of commodity flows: truck, rail, and air. The mode category code served as a key for the software logic to filter and separate the rows of data accordingly. The procedure “Pivot Table by Weight” converted raw origin–destination movement data into tables that summarize the weight by origin and destination in every FAF zone for each of the commodity categories in a modal data subset. The origin and destination pivot tables listed 130 FAF zones along the rows and 43 commodity categories across the columns. Movements by air had the same number of FAF zones as for trucks and rail but two fewer (41) commodity categories. Combining the origin and destination pivot tables produced a summary of the weight moved by commodity category in each FAF zone. In addition to summarizing the data, the pivot table procedure helped to detect errors such as missing values, incorrectly coded features, and any outlier values that were incorrect.

3.2. Dangerous Goods Category

An analysis of the FAF 5 metadata description revealed that many of the items in the commodity categories of crude oil, fuels, pharmaceuticals, and basic chemicals are within the dangerous goods classes defined in Table 1 above. This analysis considered the commodity category of basic chemical materials (BCMs) for the U.S. case study because it contains most of the dangerous goods transported without pipelines. BCMs defined in the FAF are further subclassified as organic and inorganic chemicals. Examples of organic chemicals include ethyl benzene, paraformaldehyde, acyclic alcohols, peroxides, hydrocarbons, hormones, and toners. Examples of inorganic chemicals include hydrochloric acid, sulfuric acid, hydrogen, rare gases, alkali metals, mercury, and radioactive elements.

3.3. Regional Demand Cluster

The FAF zones include metropolitan statistical areas (MSAs) and areas outside of MSAs, which were the remainder of states or entire states. The analysis focused on MSAs for initial deployments because any localized disruptions in their large population centers and trade gateways will amplify the risk of harm to society and increase the risk of supply chain disruptions. A procedure flagged FAF zones as MSAs where the metadata description contained the words “area” or “part” so that the “extract” procedure produced a list of only the MSA movements by weight. The procedure identified 83 of the 130 FAF zones as MSAs in the CONUS.
The next objective was to identify a minimal set of MSAs that moved the largest amount of BCMs. It is not possible for humans to visually identify clusters or outliers when a data element has more than three features. Hence, the strategy to generalize the workflow was to apply unsupervised machine learning (UML) to detect MSA clusters and outliers based on the weight of BCMs moved by all transport modes.
The HDM workflow used three of the most popular UML methods, which are clustering algorithms: the density-based spatial clustering of applications with noise (DBSCAN) [68], Louvain [69], and k-means clustering [70]. Table 2 summarizes their basic theory of operation, their advantages (A), and their disadvantages (D). The hyperparameters are algorithm parameter values that the user must provide based on cyclically observing intermediate results from a range of settings. The table shows the values of those hyperparameters that provided the best performance for this dataset. The next step in the workflow extracted the demand outliers to calculate the distance band distribution.

3.4. Distance Band Creation

The GP part of the workflow determined the inter-MSA geodesic distances and estimated intra-MSA distances. Establishing cargo drone hubs near the center of MSAs would minimize the connecting first-mile and last-mile distances within the MSA. The tactic to determine the inter-MSA distances was to utilize a dataset containing the areas of all U.S. counties, combine the areas of counties that are part of an MSA, find the centroid of each MSA, and then compute a distance matrix that accounted for all pairwise combinations of the centroids. The TIGER® shapefile maintained by the USCB contains both the land and water areas of all U.S. counties [71]. The 2017 commodity flow survey geographies database, also maintained by the USCB, contained a FAF zone identifier for every county in the United States [72]. The merge procedure is a data manipulation technique that adds more variables to a record by combining data from two or more records that may be sourced from different locations [70]. However, a successful data merge requires that each record have a common variable called the key. In this workflow, the county code (FIPS5) served as a key that added the FAF zone identifier to the TIGER® shapefile. That enabled a GIS dissolve procedure to define contiguous MSAs and to aggregate the areas of their counties. Next, a GIS centroid procedure calculated the center of each MSA as shown in Figure 2, which then enabled a GIS distance matrix procedure to calculate the geodesic distances among the MSA centroids.
Unfolding the distance matrix and merging it with the commodity flow data added a geodesic distance for flows between MSAs. However, the distance matrix cannot produce a value for intra-MSA flows. Therefore, the tactic was to estimate an average inter-MSA distance based on a direct proportion of the MSA size, which was half the diagonal of a square with an area equal to that of the MSA. Figure 2 shows that the GIS dissolve procedure produced 83 MSAs and 46 remaining FAF zones, along with their geospatial centroids. Finally, a histogram procedure binned the weight of BCM moved into 100-mile distance bands from 100 to 2800 miles.

4. Results and Discussions

The following subsections discuss the results of the regional demand clustering and the distance band distribution of BCM weight moved.

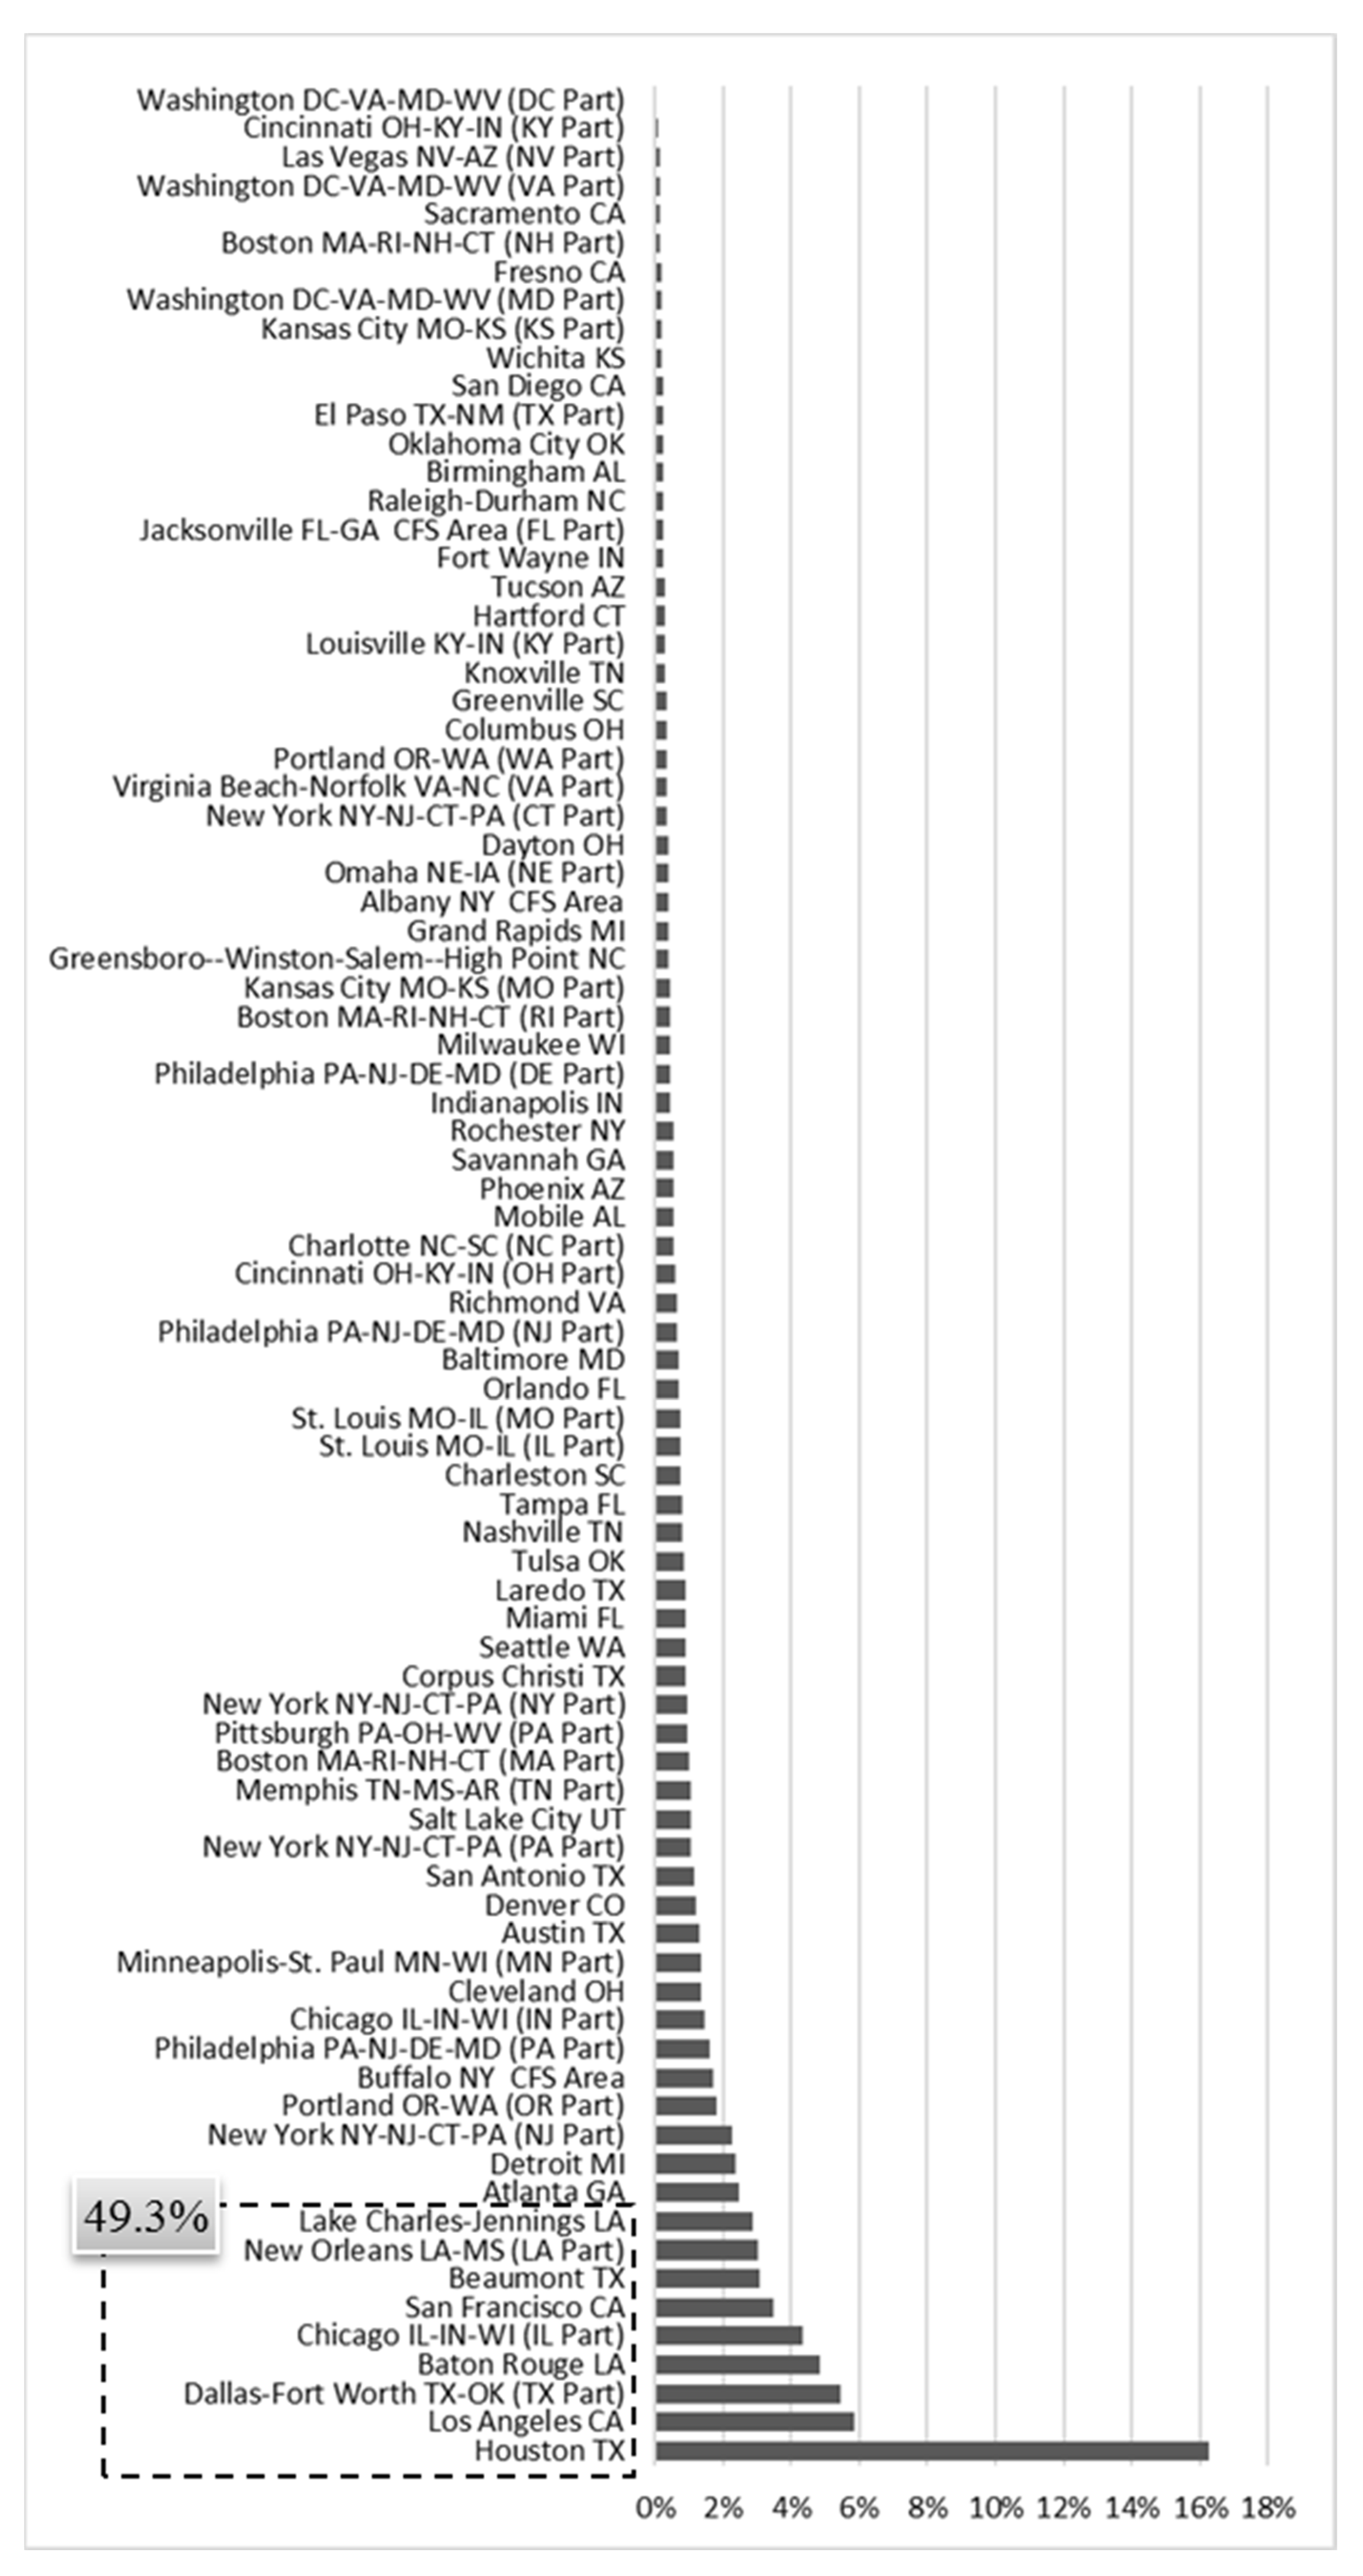
4.1. Regional Demand Cluster

Figure 3 shows the results from the three clustering algorithms but using the top two modes for ease of visualization. The vertical and horizontal positions of each point (circle) in the figure represent the total weight of BCMs moved in 2017 by truck and rail, respectively. Each point on the scatter plot represents an MSA that moved the indicated weight by the two modes. The label of each colored point in the legend indicates the cluster number to which the algorithm assigned them. Table 3 lists the tuned hyperparameter settings for each clustering algorithm.
Visually, the scatter plot shows one extreme outlier in the top right (Houston, TX), one dense cluster in the lower left, and a set of outliers towards the middle. The outliers are distinctively separated from the high-density cluster in the lower left. DBSCAN correctly identified the outliers. Louvain identified nine clusters, with its C5 cluster mostly agreeing with DBSCAN. k-means treated the extreme outlier as its own cluster but included a few edge points of the high-density cluster into the outlier group as a third cluster.
Visual validation suggested that DBSCAN provided the best performance for this application by identifying all the outlier MSAs. The two-dimensional visualization was effective because the weight of BCMs moved by air was substantially less than the weight moved by trucks and rail. Figure 4 shows the proportional distribution of the total BCM weight moved by the three modes of truck, rail, and air in each MSA. The figure shows the MSAs by total weight moved, sorted with the highest at the bottom. As labeled in the figure, only 9 of 83 MSA in the CONUS moved nearly half the weight (49.3%) of the BCMs. The long distribution tail of Figure 4 further illustrates that beyond those initial 9 MSAs, there are diminishing returns on the weight of the BCMs that cargo drone deployments can move in each additional location.
Nine of the MSAs among the DBSCAN outliers are in only four states: California (Los Angeles, San Francisco), Texas (Houston, Dallas-Fort Worth, Beaumont), Louisiana (Baton Rouge, New Orleans, Lake Charles-Jennings), and Illinois (Chicago). This result is fortuitous because focusing deployment plans within only a few states will ease the burden of working across many jurisdictions that may initially have different constraints, policies, and regulations for commercial cargo drone services. Focused deployments in only a few states can also help to minimize the risk of supply chain disruptions from localized weather events such as hurricanes, tornados, and extreme cold that can damage utilities and block surface transportation routes.

4.2. Distance Band Distribution

To put the weight moved into perspective, a typical North American semi-trailer truck (18-wheeler/big rig) carries 45,000 pounds (22.5 tons) of cargo [73]. Table 4 lists the distance band distribution of truckload equivalents and their proportion for the selected outlier MSAs, and Figure 5 plots the data for visualization. Current projections based on the anticipated improvements in battery technology suggest that cargo drones will exceed 400-mile ranges well before 2050 [74]. As shown in Table 4, air, rail, and trucks accumulated (acc.) to 48.9%, 53.3%, and 84.7% of all BCM movements, respectively, within 400 miles. Figure 5 reveals that for each transport mode, there was a distinct point of diminishing returns in the accumulated proportion after 400 miles. Therefore, cargo drones with a robust 400-mile range have the potential to remove nearly 85% of the trucks that carry BCMs across the nation’s roadways. Based on growth estimates from the National Freight Strategic Plan, truck transport will increase by 35% by 2040 [75], which means that the potential benefits will be even greater over time.
The above results demonstrate the practical value of the workflow in providing insights for decision making under high uncertainty. The data mining workflow transformed a large origin–destination database into a tabular summary that enabled further merging with GIS data to add geodesic distance information estimated from the spatial geometry of maps. Logistical managers and investors can adopt the workflow without concerns about using non-standard or unproven functions because it incorporated mature data science methods like pivoting, extraction, merging, histogram, clustering, GIS dissolve, and GIS centroid.
A limitation of this study is that it focused on identifying areas with significant amounts of hazmat movements that would be worthwhile locations for drone deployments but did not examine possible engineering limitations. For example, new policies would need to consider the design and availability of special containers of suitable weight and material for the proposed cargo drone applications. Engineers will need to address how the transport system will attach and release those containers, and how to design redundant systems that will enable safe landing in an emergency. Policymakers will also need to determine the population density threshold and minimum altitude for routes that need to cross populated places.
As noted above, only nine MSAs in four U.S. states accounted for 49.3% of the BCM weight moved and 76.3% of that weight moved within a 400-mile range. Therefore, deploying cargo drones in the MSAs of only four states have the potential to carry 49.3% × 76.3% = 37.6% of all the BCM weight moved in the CONUS. The equivalent in truckloads displaced in 2017 would have been 4.7 million.

5. Conclusions

Autonomous cargo drones are emerging as a new mode of air transportation that has the potential to displace the surface transportation of many types of commodities. The removal of human operators not only reduces cost but also increases safety by eliminating the potential for human error or harm. Based on the number of global incidences in recent years, air transportation has been far safer than other modes of surface transportation such as truck and rail. Federal regulations will ensure that all commercial cargo drones can safely integrate into the national airspace. Autonomous cargo drones can fly rapidly, in all types of weather conditions, as fleet swarms, and at all hours to support the demand for freight capacity. Whereas surface transportation modes are subject to weather events and accidents that can cause congestion and route closures, cargo drones can fly unimpeded and more directly between terminals. Electrified vertical takeoff and landing (eVTOL)-type cargo drones do not need airports because they can use vertiports atop buildings and in small open areas in metropolitan areas. Battery-powered drones will eliminate harmful emissions if they can charge from clean energy sources.
The future realization of advanced air mobility (AAM) presents an opportunity to move dangerous goods by air and thus minimize the risk of harm to people and the environment. This applied research developed a new hybrid data mining and machine learning workflow to identify the fewest initial locations where cargo drone deployments can yield the greatest benefits. Logistical managers and investors can adopt the workflow to analyze combined commodity flow and GIS datasets to produce insights for decision making under high uncertainty. A case study of the workflow on data from the United States found that deployments in only nine metropolitan areas in four states can move 38% of all basic chemicals within 400 miles. The implication is that initial success will demonstrate their safety and efficiency benefits to guide policy making and new logistical standards for transporting dangerous goods. Future work will utilize the generalized data mining workflow to study the potential markets for moving other types of commodities such as pharmaceuticals and perishable items that are vulnerable to supply chain disruptions.

Funding

The author conducted this work with support from North Dakota State University and the Mountain-Plains Consortium, a University Transportation Center funded by the U.S. Department of Transportation. Grant Number: 69A3551747108.

Data Availability Statement

Some or all data, models, or code used during the study were provided by a third party. Direct requests for these materials may be made to the provider cited in the manuscript.

Conflicts of Interest

The author has no competing interest to declare that are relevant to the content of this article.

References

  1. Saccomanno, F.F.; Shortreed, J.H. Hazmat transport risks: Societal and individual perspectives. J. Transp. Eng. 1993, 119, 177–188. [Google Scholar] [CrossRef]
  2. Huang, Z.; Loo, B.P. Urban traffic congestion in twelve large metropolitan cities: A thematic analysis of local news contents, 2009–2018. Int. J. Sustain. Transp. 2022, 1–23. [Google Scholar] [CrossRef]
  3. Palaia, G.; Salem, K.A.; Cipolla, V.; Binante, V.; Zanetti, D. A Conceptual Design Methodology for e-VTOL Aircraft for Urban Air Mobility. Appl. Sci. 2021, 11, 10815. [Google Scholar] [CrossRef]
  4. Lee, B.-S.; Tullu, A.; Hwang, H.-Y. Optimal design and design parameter sensitivity analyses of an eVTOL PAV in the conceptual design phase. Appl. Sci. 2020, 10, 5112. [Google Scholar] [CrossRef]
  5. Sahoo, S.; Zhao, X.; Kyprianidis, K. A review of concepts, benefits, and challenges for future electrical propulsion-based aircraft. Aerospace 2020, 7, 44. [Google Scholar] [CrossRef] [Green Version]
  6. Al-Madani, B.; Svirskis, M.; Narvydas, G.; Maskeliūnas, R.; Damaševičius, R. Design of fully automatic drone parachute system with temperature compensation mechanism for civilian and military applications. J. Adv. Transp. 2018, 2018, 2964583. [Google Scholar] [CrossRef]
  7. Schäffer, B.; Pieren, R.; Heutschi, K.; Wunderli, J.M.; Becker, S. Drone Noise Emission Characteristics and Noise Effects on Humans—A Systematic Review. Int. J. Environ. Res. Public Health 2021, 18, 5940. [Google Scholar] [CrossRef] [PubMed]
  8. Rejeb, A.; Rejeb, K.; Simske, S.; Treiblmaier, H. Drones for supply chain management and logistics: A review and research agenda. Int. J. Logist. Res. Appl. 2021. [Google Scholar] [CrossRef]
  9. Sah, B.; Gupta, R.; Bani-Hani, D. Analysis of barriers to implement drone logistics. Int. J. Logist. Res. Appl. 2021, 24, 531–550. [Google Scholar] [CrossRef]
  10. FAA. Urban Air Mobility: Concept of Operations, v1.0; Federal Aviation Administration (FAA): Washington, DC, USA, 2020. Available online: https://nari.arc.nasa.gov/sites/default/files/attachments/UAM_ConOps_v1.0.pdf (accessed on 16 June 2022).
  11. Cohen, A.; Shaheen, S.; Farrar, E. Urban Air Mobility: History, Ecosystem, Market Potential, and Challenges. IEEE Trans. Intell. Transp. Syst. 2021, 22, 6074–6087. [Google Scholar] [CrossRef]
  12. GAO. Transforming Aviation: Stakeholders Identified Issues to Address for ‘Advanced Air Mobility’; Government Accountability Office (GAO): Washington, DC, USA, 2022. Available online: https://www.gao.gov/products/gao-22-105020 (accessed on 16 June 2022).
  13. ACI. Air Cargo Guide; Airports Council International (ACI): Montreal, QC, Canada, 2019; Available online: https://airportscouncil.org/wp-content/uploads/2020/03/Air-Cargo-Guide.pdf (accessed on 16 June 2022).
  14. Frachtenberg, E. Practical Drone Delivery. Computer 2019, 52, 53–57. [Google Scholar] [CrossRef]
  15. Singireddy, S.R.; Daim, T.U. Technology roadmap: Drone delivery–amazon prime air. In Infrastructure and Technology Management. Innovation, Technology, and Knowledge Management; Daim, T., Chan, L., Estep, J., Eds.; Springer: Cham, Switzerland, 2018; pp. 387–412. [Google Scholar] [CrossRef]
  16. Rabta, B.; Wankmüller, C.; Reiner, G. A drone fleet model for last-mile distribution in disaster relief operations. Int. J. Disaster Risk Reduct. 2018, 28, 107–112. [Google Scholar] [CrossRef]
  17. Ayamga, M.; Akaba, S.; Nyaaba, A.A. Multifaceted applicability of drones: A review. Technol. Forecast. Soc. Chang. 2021, 167, 120677. [Google Scholar] [CrossRef]
  18. Nisingizwe, M.P.; Ndishimye, P.; Swaibu, K.; Nshimiyimana, L.; Karame, P.; Dushimiyimana, V.; Musabyimana, J.P.; Musanabaganwa, C.; Nsanzimana, S.; Law, M.R. Effect of unmanned aerial vehicle (drone) delivery on blood product delivery time and wastage in Rwanda: A retrospective, cross-sectional study and time series analysis. Lancet Glob. Health 2022, 10, e564–e569. [Google Scholar] [CrossRef]
  19. Achamrah, F.E.; Riane, F.; Limbourg, S. Spare parts inventory routing problem with transshipment and substitutions under stochastic demands. Appl. Math. Model. 2022, 101, 309–331. [Google Scholar] [CrossRef]
  20. Kellermann, R.; Biehle, T.; Fischer, L. Drones for parcel and passenger transportation: A literature review. Transp. Res. Interdiscip. Perspect. 2020, 4, 100088. [Google Scholar] [CrossRef]
  21. Guggina, D. We’re Bringing the Convenience of Drone Delivery to 4 Million U.S. Households in Partnership with DroneUp. Walmart, Producer, & Walmart. 24 May 2022. Available online: https://corporate.walmart.com/newsroom/2022/05/24/were-bringing-the-convenience-of-drone-delivery-to-4-million-u-s-households-in-partnership-with-droneup (accessed on 4 June 2022).
  22. Wang, X.; Poikonen, S.; Golden, B. The vehicle routing problem with drones: Several worst-case results. Optim. Lett. 2017, 11, 679–697. [Google Scholar] [CrossRef]
  23. Pak, H. Use-Cases for Heavy Lift Unmanned Cargo Aircraft. In Automated Low-Altitude Air Delivery. Research Topics in Aerospace; Dauer, J.C., Ed.; Springer: Cham, Switzerland, 2022. [Google Scholar] [CrossRef]
  24. Waters, M. Unpacked: Is Middle-Mile Delivery a Logistics Frontier or Retail Buzzword? Modern Retail. 1 December 2020. Available online: https://www.modernretail.co/startups/middle-mile-delivery-logistics-frontier-or-retail-buzzword/ (accessed on 25 April 2022).
  25. NASA. UAM Vision Concept of Operations (ConOps) UAM MAturity Level (UML) 4; Prepared by Deloitte Consulting LLP; National Aeronautics and Space Administration (NASA): Washington, DC, USA, 2020. Available online: https://ntrs.nasa.gov/citations/20205011091 (accessed on 16 June 2022).
  26. NAS. Assessing the Risks of Integrating Unmanned Aircraft Systems into the National Airspace System; National Academies Press: Washington, DC, USA, 2018. [Google Scholar] [CrossRef]
  27. Gkoumas, K.; Balen, M.V.; Tsakalidis, A.; Pekar, F. Evaluating the development of transport technologies in European research and innovation projects between 2007 and 2020. Res. Transp. Econ. 2022, 92, 101113. [Google Scholar] [CrossRef]
  28. Shvetsova, S.; Shvetsov, A. Safety when flying unmanned aerial vehicles at transport infrastructure facilities. Transp. Res. Procedia 2021, 54, 397–403. [Google Scholar] [CrossRef]
  29. Garrow, L.; German, B.; Leonard, C. Urban air mobility: A comprehensive review and comparative analysis with autonomous and electric ground transportation for informing future research. Transp. Res. Part C-Emerg. Technol. 2021, 132, 103377. [Google Scholar] [CrossRef]
  30. Lineberger, R.; Silver, D.; Hussain, A. Advanced Air Mobility: Can the United States Afford to Lose the Race? Deloitte Development LLC: London, UK, 2021. Available online: https://www2.deloitte.com/us/en/insights/industry/aerospace-defense/advanced-air-mobility.html (accessed on 16 June 2022).
  31. Reed Smith LLP. Global Air Freight’s Future—The Sky Is the Limit. 2022. Available online: https://www.reedsmith.com/en/perspectives/global-air-freight (accessed on 16 June 2022).
  32. Mihir Rimjha, S.T. On-Demand Mobility Cargo Demand Estimation in Northern California Region. In 2020 Integrated Communications Navigation and Surveillance Conference (ICNS); IEEE: Herndon, VA, USA, 2020; pp. 6A2-1–6A2-10. [Google Scholar] [CrossRef]
  33. PHMSA. 2020 Emergency Response Guidebook; U.S. Department of Transportation, Pipeline and Hazardous Materials Safety Administration (PHMSA): Washington, DC, USA, 2020. Available online: https://www.phmsa.dot.gov/sites/phmsa.dot.gov/files/2020-08/ERG2020-WEB.pdf (accessed on 16 June 2022).
  34. PHMSA. Hazmat Intelligence Portal; (U. D. Transportation, Producer) Retrieved from Pipeline and Hazardous Materials Safety Administration (PHMSA): Washington, DC, USA, 30 May 2022. Available online: https://www.phmsa.dot.gov/hazmat-program-management-data-and-statistics/data-operations/incident-statistics (accessed on 16 June 2022).
  35. McCormack, E. The Use of Small Unmanned Aircraft by the Washington State Department of Transportation; Washington State Department of Transportation: Olympia, WA, USA, 2008. Available online: https://rosap.ntl.bts.gov/view/dot/16515 (accessed on 16 June 2022).
  36. Oxley, J.C.; Smith, J.L.; Rogers, E.; Yu, M. Ammonium nitrate: Thermal stability and explosivity modifiers. Thermochim. Acta 2002, 384, 23–45. [Google Scholar] [CrossRef]
  37. Galatas, I. Prevention of CBRN Materials and Substances Getting into the Hands of Terrorists; International Centre for Counter-Terrorism (ICCT): The Hague, Netherlands, 2020. [Google Scholar]
  38. Mohammadfam, I.; Gholamizadeh, K. Developing a Comprehensive Technique for Investigating Hazmat Transport Accidents. J. Fail. Anal. Prev. 2021, 21, 1362–1373. [Google Scholar] [CrossRef]
  39. NARA. Code of Federal Regulations (Title 49, Subtitle B, Chapter I, Subchapter C); National Archives and Records Administration (NARA): College Park, MD, USA, 11 September 2022. Available online: https://www.ecfr.gov/current/title-49/subtitle-B/chapter-I/subchapter-C (accessed on 16 June 2022).
  40. Yilmaz, Z.; Serpil, E.R.; Aplak, H.S. Transportation of hazardous materials (hazmat) a literature survey. Pamukkale Üniversitesi Mühendislik Bilimleri Derg. 2016, 22, 39–53. [Google Scholar] [CrossRef]
  41. Bondžić, J.; Sremački, M.; Popov, S.; Mihajlović, I.; Vujić, B.; Petrović, M. Exposure to hazmat road accidents–Toxic release simulation and GIS-based assessment method. J. Environ. Manag. 2021, 293, 112941. [Google Scholar] [CrossRef] [PubMed]
  42. Amundsen, E.S.; Hansen, L.G.; Whitta-Jacobsen, H.J. Regulation of Location-Specific Externalities from Small-Scale Polluters. Environ. Resour. Econ. 2022, 82, 1–22. [Google Scholar] [CrossRef]
  43. Barbier, E.B. The Policy Implications of the Dasgupta Review: Land Use Change and Biodiversity. Environ. Resour. Econ. 2022, 1–25. [Google Scholar] [CrossRef]
  44. Grieco, L.; Gleed, H.; Groves, S.; Dyer, S.; Utley, M. Informing decisions on the purchase of equipment used by health services in response to incidents involving hazardous materials. Int. J. Disaster Risk Reduct. 2018, 28, 113–121. [Google Scholar] [CrossRef]
  45. Jacqz, I. Toxic test scores: The impact of chemical releases on standardized test performance within US schools. J. Environ. Econ. Manag. 2022, 2022, 102628. [Google Scholar] [CrossRef]
  46. Persico, C.L.; Johnson, K.R. The effects of increased pollution on COVID-19 cases and deaths. J. Environ. Econ. Manag. 2021, 107, 102431. [Google Scholar] [CrossRef]
  47. Bridgelall, R.; Tolliver, D.D. Closed form models to assess railroad technology investments. Transp. Plan. Technol. 2020, 43, 639–650. [Google Scholar] [CrossRef]
  48. Hosseinzadeh, A.; Moeinaddini, A.; Ghasemzadeh, A. Investigating factors affecting severity of large truck-involved crashes: Comparison of the SVM and random parameter logit model. J. Saf. Res. 2021, 77, 151–160. [Google Scholar] [CrossRef] [PubMed]
  49. Wei, S.; Shen, X.; Shao, M.; Sun, L. Applying Data Mining Approaches for Analyzing Hazardous Materials Transportation Accidents on Different Types of Roads. Sustainability 2021, 13, 12773. [Google Scholar] [CrossRef]
  50. Mohri, S.; Mohammadi, M.; Gendreau, M.; Pirayesh, A.; Ghasemaghaei, A.; Salehi, V. Hazardous material transportation problems: A comprehensive overview of models and solution approaches. Eur. J. Oper. Res. 2022, 302, 1–38. [Google Scholar] [CrossRef]
  51. Chia, W.M.; Keoh, S.L.; Michala, A.L.; Goh, C. Infrastructure-based pedestrian risk tagging methodology to support AV risk assessment. IEEE Access 2022, 10, 71462–71480. [Google Scholar] [CrossRef]
  52. Chen, X.; Wu, S.; Shi, C.; Huang, Y.; Yang, Y.; Ke, R.; Zhao, J. Sensing Data Supported Traffic Flow Prediction via Denoising Schemes and ANN: A Comparison. IEEE Sens. J. 2020, 20, 14317–14328. [Google Scholar] [CrossRef]
  53. Sinha Roy, D.; Defryn, C.; Golden, B.; Wasil, E. Data-driven optimization and statistical modeling to improve meter reading for utility companies. Comput. Oper. Res. 2022, 145, 105844. [Google Scholar] [CrossRef]
  54. Sinha Roy, D.; Golden, B.; Wang, X.; Wasil, E. Estimating the Tour Length for the Close Enough Traveling Salesman Problem. Algorithms 2021, 14, 123. [Google Scholar] [CrossRef]
  55. Wong, E.Y.; Ling, K.K. A Mixed Integer Programming Approach to Air Cargo Load Planning with Multiple Aircraft Configurations and Dangerous Goods. In Proceedings of the 2020 7th International Conference on Frontiers of Industrial Engineering (ICFIE), Singapore, 27–29 September 2020; pp. 123–130. [Google Scholar] [CrossRef]
  56. Liu, L.; Li, J.; Zhou, L.; Fan, T.; Li, S. Research on Route Optimization of Hazardous Materials Transportation Considering Risk Equity. Sustainability 2021, 13, 9427. [Google Scholar] [CrossRef]
  57. Grote, M.; Cherrett, T.; Oakey, A.; Royall, P.G.; Whalley, S.; Dickinson, J. How do dangerous goods regulations apply to uncrewed aerial vehicles transporting medical cargos? Drones 2021, 5, 38. [Google Scholar] [CrossRef]
  58. Hafeez, A.; Husain, M.A.; Singh, S.P.; Chauhan, A.; Khan, M.T.; Kumar, N.; Chauhan, A.; Soni, S.K. Implementation of Drone Technology for Farm Monitoring & Pesticide Spraying: A Review. Inf. Process. Agric. 2022. [Google Scholar] [CrossRef]
  59. Lukežič, M.; Marinšek, M.; Faganeli, J. Evaluation of Burning Test Rate Method for Flammable Solids to Increase Air-Cargo Safety. Acta Chim. Slov. 2010, 57, 129–135. [Google Scholar]
  60. Koulocheris, D.; Vossou, C. Exploration of Equivalent Design Approaches for Tanks Transporting Flammable Liquids. Computation 2020, 8, 33. [Google Scholar] [CrossRef]
  61. Babrauskas, V. Explosions of ammonium nitrate fertilizer in storage or transportation are preventable accidents. J. Hazard. Mater. 2016, 304, 134–149. [Google Scholar] [CrossRef] [PubMed]
  62. Johnson, A.M.; Cunningham, C.J.; Arnold, E.; Rosamond, W.D.; Zègre-Hemsey, J.K. Impact of Using Drones in Emergency Medicine: What Does the Future Hold? Open Access Emerg. Med. OAEM 2021, 13, 487. [Google Scholar] [CrossRef] [PubMed]
  63. Amukele, T.K.; Hernandez, J.; Snozek, C.L.; Wyatt, R.G.; Douglas, M.; Amini, R.; Street, J. Drone transport of chemistry and hematology samples over long distances. Am. J. Clin. Pathol. 2017, 148, 427–435. [Google Scholar] [CrossRef] [Green Version]
  64. Scalea, J.R.; Pucciarella, T.; Talaie, T.; Restaino, S.; Drachenberg, C.B.; Alexander, C.; Al Qaoud, T.; Barth, R.N.; Wereley, N.M.; Scassero, M. Successful Implementation of Unmanned Aircraft Use for Delivery of a Human Organ for Transplantation. An. Surg. 2021, 274, e282–e288. [Google Scholar] [CrossRef]
  65. Beck, S.; Bui, T.T.; Davies, A.; Courtney, P.; Brown, A.; Geudens, J.; Royall, P.G. An evaluation of the drone delivery of adrenaline auto-injectors for anaphylaxis: Pharmacists’ perceptions, acceptance, and concerns. Drones 2020, 4, 66. [Google Scholar] [CrossRef]
  66. FDOT. SWOT Analysis of TRANSEARCH and FAF Data; Florida Department of Transportation (FDOT): Washington, DC, USA, 2016. Available online: https://www.fdot.gov/statistics/multimodaldata/default.shtm (accessed on 16 June 2022).
  67. FHWA. Freight Analysis Framework Version 5 (FAF5); Federal Highway Administration (FHWA): Washington, DC, USA, 2021. Available online: https://faf.ornl.gov/faf5/Default.aspx (accessed on 13 February 2022).
  68. Kelleher, J.D.; Namee, B.M.; D’Arcy, A. Fundamentals of Machine Learning for Predictive Data Anayltics: Algorithms, Worked Examples, and Case Studies; The MIT Press: Cambridge, MA, USA, 2020. [Google Scholar]
  69. Burkov, A. The Hundred-Page Machine Learning Book; Andriy Burkov: Quebec City, QC, USA, 2019; Volume 1. [Google Scholar]
  70. Aggarwal, C.C. Data Mining; Springer International Publishing: New York, NY, USA, 2015. [Google Scholar]
  71. USCB. TIGER/Line Geodatabases; (U. S. (USCB), Producer, & United States Census Bureau (USCB)): Washington, DC, USA, 2021. Available online: https://www2.census.gov/geo/tiger/TIGER2021/COUNTY/ (accessed on 22 April 2022).
  72. USCB. Commodity Flow Survey Geographies; (U. S. (USCB), Producer, & United States Census Bureau (USCB)): Washington, DC, USA, 2021. Available online: https://www.census.gov/programs-surveys/cfs/technical-documentation/geographies.html (accessed on 18 April 2022).
  73. FreightWaves. How Much Weight Can a Big Rig Carry? FreightWaves. 1 January 2020. Available online: https://www.freightwaves.com/news/how-much-weight-can-a-big-rig-carry (accessed on 18 March 2022).
  74. Schwab, A.; Thomas, A.; Bennett, J.; Robertson, E.; Cary, S. Electrification of Aircraft: Challenges, Barriers, and Potential Impacts; National Renewable Energy Laboratory (NREL): Golden, CO, USA, 2021. Available online: https://www.nrel.gov/docs/fy22osti/80220.pdf (accessed on 16 June 2022).
  75. USDOT. National Freight Strategic Plan; United States Department of Transportation (USDOT): Washington, DC, USA, 2020. Available online: https://www.transportation.gov/freight/NFSP (accessed on 16 June 2022).
Figure 1. The HDM workflow.
Sustainability 14 13044 g001
Figure 2. MSAs, remaining FAF Zones, and their centroids.
Sustainability 14 13044 g002
Figure 3. Comparison of clustering results for (a) DBSCAN, (b) Louvain, and (c) k-means.
Sustainability 14 13044 g003
Figure 4. MSA rank of BCMs moved by truck, rail, and air.
Sustainability 14 13044 g004
Figure 5. MSA rank of BCMs moved by truck, rail, and air.
Sustainability 14 13044 g005
Table 1. Classification of Dangerous Goods.
ClassDescription and ExamplesTypical UsesRisks
ExplosivesSubstance, article, or device that can explode. Examples: gunpowder, safety flares, and fireworks.War, demolition, mining, and avalanche control [35].Explosion triggered by heat, radiation, vibration, or chemical reaction.
GasesNon-solid and non-liquid matter. Examples: butane, aerosols, oxygen, methane, acetylene, carbon monoxide, and hydrogen sulfide.Industrial uses, cooking grills, household cleaners, and cosmetics.Accidental release from pressurized containers, and possible contact with ignition sources.
Flammable LiquidsLiquids with flash points between 100 °F and 140 °F. Examples include gasoline, acetone, toluene, diethyl ether, and alcohols.Fuels, cleaning solutions, paints, polishes, varnishes, adhesives, and paint thinners.Exposure to heat can bring a liquid to its flash point (release of vapor) when ignition can occur.
Flammable SolidsIgnitable solids. Examples: alkali, coal, carbon, magnesium, metallic hydrides, sulfur, cellulose nitrate, and matches.Battery manufacturing, cooking, and composting.Ignitable by heat, friction, or contact with other substances such as oxidants or acids.
Oxidizing Substances & Organic PeroxidesChemicals that oxidize other substances and/or provide fuel to burn. Examples: ammonium nitrate, potassium nitrate, nitric acid, halogens, and potassium bromate.Manufacturing of plastics and rubbers and agricultural uses such as fertilizers.Unstable—prone to exothermic decomposition [36].
Toxic and Infectious SubstancesPoisons, infectious, and irritating materials. Examples: bacteria, blood samples, cyanide, methyl bromide, tear gases, medical waste, and forensic materials.War, pesticides, medicines, fuel additives, and disinfectants.Accidental releases can harm humans.
Radioactive MaterialMaterials with specific activity greater than 0.002 microcuries per gram. Examples: Cobalt-60, Americium-241, Cesium-137, Iridium-192, and Plutonium-239.Weapons manufacturing, power production, smoke alarms, and medical imaging [37].Accidental releases can harm humans.
Corrosive SubstancesChemicals that destroy materials or cause irreversible alterations of living tissue. Examples: sulfuric acid, sodium hydroxide, hydrofluoric acid, and some battery fluids.Cleaning solutions, drain unclogging, and paint stripping.Accidental release can cause severe burning and irritation of human skin.
OtherExamples: batteries (lithium-ion, lithium metal), magnetized material, asbestos, dry ice.Batteries for electric vehicles, electronics, electric scooters, and drones.Known to be combustible under certain circumstances.
Table 2. Unsupervised Machine Learning Algorithms Compared for Cluster Detection.
AlgorithmTheory of OperationsHyperparameters
DBSCANDensity-based spatial clustering of applications with noise (DBSCAN). Separates densely packed points from outliers. Initializes core points as those that are within distance d of k points. Grows a cluster by randomly labeling a core point as a cluster, and then grows that cluster by sequentially adding other core points that are within distance d until all core points are assigned to a cluster. Finally, it assigns non-core points to clusters that are within distance d. The unassigned points are labeled as outliers.
A: finds clusters that linear hyperplanes cannot separate.
D: specification of d of k requires heuristics, which can be impractical for large feature spaces.
Normalize features?
Number of points (k)
Distance (d)
Distance measure
LouvainExtracts communities from networks by constructing a k-nearest neighbor graph with edges weighted by the number of shared neighbors. Clusters are labeled based on edge density inside communities relative to between communities.
A: algorithms and process large networks quickly.
D: the resolution parameter adjusts the cluster size, which can make it difficult to cluster small communities.
Normalize features?
PCA preprocess vectors
Distance measure
Number of neighbors (k)
Resolution (r)
k-meansRandomly selects one point per cluster, and then iteratively recalculates centroids while reassigning points to their nearest centroid. The algorithm converges once cluster reassignments stops or the number of specified iterations is complete. Produces a silhouette score, which is a measure of within-cluster similarity and outside-cluster separation.
A: performs well when clusters are symmetrical.
D: specifying the number of clusters requires heuristics, but the silhouette score can help the analyst.
Normalize features?
Number of clusters (k)
Initialization method
Number of reruns (n)
Number of iterations (i)
Table 3. Tuned Hyperparameter Settings for the Clustering Algorithms.
HyperparameterDBSCANLouvaink-Means
Features normalizedYesYesNo
DistanceEuclideanEuclideanSquared-Euclidean
Initializationn/aPCA = 2k-means ++
Parametersk = 4; d = 12.99k = 4, r = 5.0n = 10, i = 300
Table 4. Truckload Equivalent and Proportion Moved by Miles Band and Mode in the Outlier MSAs.
BandAirAir Acc.RailRail Acc.TruckTruck Acc.3-Modes3-Modes Acc.
10011.40.5%239,468.114.5%1,858,411.240.8%2,097,890.733.8%
2008.81.0%217,816.727.7%892,520.160.4%1,110,345.651.7%
300555.127.7%291,106.745.4%892,206.980.0%1,183,868.770.8%
400440.148.9%130,613.353.3%213,958.384.7%345,011.776.3%
500151.956.3%29,614.755.1%102,053.086.9%131,819.578.5%
600107.861.5%54,879.458.4%75,802.388.6%130,789.580.6%
700137.368.1%65,460.362.4%88,755.790.6%154,353.383.1%
80099.172.9%71,947.066.8%79,644.792.3%151,690.785.5%
90053.475.4%63,921.170.6%38,083.493.1%102,057.987.2%
100099.980.2%123,533.878.1%66,995.194.6%190,628.790.2%
110021.681.3%41,494.480.6%36,211.395.4%77,727.391.5%
120022.182.4%191,184.692.2%79,192.497.2%270,399.195.8%
130017.583.2%69,207.696.4%19,629.797.6%88,854.897.3%
14009.383.6%27,812.598.1%33,419.698.3%61,241.398.3%
150022.284.7%5078.498.4%12,496.898.6%17,597.498.5%
160040.286.7%8511.998.9%15,235.898.9%23,787.998.9%
170021.187.7%5197.499.3%10,123.799.1%15,342.299.2%
180041.389.7%2393.199.4%10,285.099.4%12,719.399.4%
190059.692.5%1328.699.5%11,822.899.6%13,211.099.6%
200030.694.0%278.999.5%4089.599.7%4399.099.7%
21006.194.3%3991.599.7%2650.499.8%6647.999.8%
220018.995.2%347.099.8%966.899.8%1332.799.8%
230016.696.0%2785.599.9%2669.399.9%5471.499.9%
240034.797.7%447.3100.0%4383.5100.0%4865.5100.0%
250015.298.4%431.6100.0%473.2100.0%920.0100.0%
260022.599.5%141.5100.0%1335.7100.0%1499.7100.0%
27007.699.9%39.5100.0%32.1100.0%79.2100.0%
28002.7100.0%1.2100.0%2.7100.0%6.5100.0%
Publisher’s Note: MDPI stays neutral with regard to jurisdictional claims in published maps and institutional affiliations.

