Article

Use of Remote-Sensing-Based Global Products for Agricultural Drought Assessment in the Narmada Basin, India

1
Department of Water Engineering and Management, University of Twente, 7522 NB Enschede, The Netherlands
2
Department of Water Management, Delft University of Technology, 2600 GA Delft, The Netherlands
3
Department of Civil Engineering, University of Moratuwa, Katubedda 10400, Sri Lanka
*
Authors to whom correspondence should be addressed.
Sustainability 2022, 14(20), 13050; https://doi.org/10.3390/su142013050
Submission received: 4 September 2022 / Revised: 7 October 2022 / Accepted: 8 October 2022 / Published: 12 October 2022
(This article belongs to the Section Hazards and Sustainability)

Abstract

:
Droughts exert severe impacts on the environment, economy, and society. The south Asian region is vulnerable to droughts and the Indian sub-continent is one of the most vulnerable in the region to frequent drought disasters. This study assesses the agricultural droughts in the Narmada River Basin (NRB), India, where more than 50% of the area is utilized for agriculture, through freely available local and global remote-sensing-based data focusing on long-term rainfall trends (1989–2018) and recently weakened monsoons in 2017 and 2018. In this study, some of the widely used indices to characterize droughts (viz., Standardized Precipitation Index (SPI), simplified Rainfall Index (RIs), Normalized Difference Vegetation Index (NDVI)), soil moisture content, and reservoir surface areas were used to assess the drought conditions in the Narmada River Basin over the study period. Our analysis shows that the NRB has experienced a decreasing trend in monsoon rainfall over the past three decades. The SPI captured most of the basin’s historical droughts. The weakened monsoons during 2017–2018 show that different parts of the NRB have experienced severe or moderate drought conditions. A clear difference does not show in the NDVI and in the soil moisture contents of the basin over three hydrological years (2015/16, 2016/17, and 2017/18), except for July to September 2017/18. The estimated water area depletion using the Normalized Difference Water Index (NDWI) follows the actual water levels in three selected reservoirs in the basin, of which, two show a decline in the maximum surface area, likely due to the weakened monsoons in 2017 and 2018. This research indicates that the freely available data can be beneficial for local authorities to monitor and understand the drought conditions to support water resources management and planning for agricultural activities.

1. Introduction

Drought is one of the natural hazards frequently occurring in many parts of the world [1,2,3], bringing a considerable shortage of water resources due to the absence of rainfall over an extended period. High temperatures, low humidity, high winds, duration, timing, the intensity of precipitation, and the distribution of rainy days play a vital role in the occurrences of droughts [4]. Droughts lead to water supply reduction, the reduction in agricultural productivity, water quality deterioration, loss of ecosystems, lack of sediment, nutrient and organic matter transport, problems in livestock farming, tourism, and other economic and social activities [4,5]. Therefore, much research is being carried out to monitor and understand droughts’ occurrences, characteristics, severity, and impacts to assist water resources planning and management.
In general, droughts can be categorized into four types: meteorological drought, agricultural drought, hydrological drought, and socio-economic drought [2,4]. Meteorological drought occurs due to a region’s dominant dry weather patterns (i.e., lack of rainfall). Agricultural drought relates to a soil moisture deficit resulting in a crop yield loss. A hydrological drought occurs when the storage in surface and groundwater decreases. In contrast, a socioeconomic drought relates to an imbalance in the supply and demand of water among the different users (i.e., domestic, industrial, and environmental). A meteorological drought may develop very quickly and lasts over a short period. However, other droughts take more time to develop and last longer than meteorological droughts. These droughts are correlated with time lags [6]. However, a meteorological drought does not necessarily transform into an agricultural, hydrological, or socio-economic drought [7]. Drought in agriculture links to rainfall shortages, depletion of soil water, and differences in the actual and potential evapotranspiration. Crop water demands depend on weather conditions, the characteristics of the plants, and the growing stage. The accessibility of water for plants depends on the soil properties. Agricultural drought impact can be avoided or reduced by irrigation, but the water used for irrigation cannot be used for other demands. Agriculture is usually the first economic sector hit by drought due to the soil moisture depletion during the crop growth stage and its high vulnerability to small weather changes [2].
To understand this complex phenomenon, different indices are used to assess and monitor the drought conditions at different spatial (e.g., local, regional) and temporal (short-term and long-term) scales. Those indices are based on meteorological (e.g., rainfall, temperature, and evapotranspiration) and hydrological (e.g., discharge, (ground)water levels, soil moisture) data and the information related to crops’ health conditions. The recent advancements in remote sensing (RS) and geographical information system (GIS) technologies play a vital role in agricultural drought detection, monitoring, assessment, and management because they provide historical to near-real-time information at different spatial (<0.05° grid resolution) and temporal (3 hourly to few months) scales beyond the traditional field data collection methods [8]. Some of the RS-based products are rainfall, temperature, evapotranspiration, vegetation health, soil moisture, and surface water area. Several indices have been developed to assess drought based on the available in-situ data and remote-sensing-based data at different geographical locations. Some of the most commonly used indices to characterize droughts are the Standardized Precipitation Index (SPI, [9]), the Rainfall Anomaly Index (RAI, [10]), the Normalized Difference Vegetation Index (NDVI, [11]), the Temperature Condition Index (TCI, [12]), the Vegetation Condition Index (VCI, [12]), and the Standardized Soil Moisture Index (SSMI, [13]).
India is one of the most vulnerable and drought-prone countries in the world, facing drought conditions (moderate or severe) and water stress in over 16% of the land area over the past few decades [3,4,14,15]. Since the 1950s, the occurrences and spatial extent of droughts in India increased [16]. Since the mid-1990s, approximately 60% of the total population in India has been affected by prolonged and widespread droughts [17]. It is a norm that drought always increases the threat to the economic sectors that are sensitive to climate, particularly agriculture [4]. In India, where approximately two-thirds of the population depends on agriculture and related activities, the overall economy is at risk due to frequent drought events [18]. Indian agriculture mainly relies on the southwest monsoon rainfall (from June to September), contributing 70–90% of the annual rainfall [19]. According to the Department of Agriculture and Farmers Welfare [20], 51% of India’s cultivated lands are rain-fed, yet contribute to ~40% of the total food production. The high variability in the monsoon rainfall over India is a risk to the country’s agrarian economy. The situation worsens when prolonged droughts affect the groundwater and surface water availability for irrigation [18].
According to the Indian Meteorological Department (IMD), drought is defined as a deficit of 25% or more of the average rainfall (i.e., long-term mean seasonal or annual rainfall) over a particular region [17,21]. Over the last seven decades (1951–2015), the southwest monsoon over India has decreased by ~6% [16]. Due to this weaker monsoon, many parts of India are vulnerable to recurrent droughts [19,22]. Many studies have been carried out investigating the drought characteristics in India via various drought indices and hydrological models (e.g., Amrit et al., 2018; Bhardwaj et al., 2020; Mishra et al., 2007; Mujumdar and Bhaskar, 2021; Shah and Mishra, 2020a, 2020b; Swain et al., 2021; Vishwakarma and Goswami, 2022) [3,16,17,22,23,24,25,26]. However, most studies have only assessed the meteorological droughts [22]. Prolonged meteorological droughts propagate to agricultural droughts, potentially followed by hydrological and socio-economic droughts. Therefore, assessing the weakened monsoon rainfall and resulting agricultural drought is essential for better planning and managing water resources and agricultural activities.
In this study, we aimed to assess the applicability of the freely available data for agricultural drought monitoring in the Narmada River Basin, India. The Narmada River Basin is one of India’s largest basins; more than 50% of the land areas are utilized for crop cultivation. The north-western, western, or central parts of India have experienced recent major droughts (2000, 2002, 2008, 2009, and 2015) [16] and the Narmada basin is located within or nearby. Therefore, it is important to study the prolonged weakened monsoon and the continued drought conditions for this basin, which is important for large crop producers and the agro-economy.
We used freely available gridded rainfall data from IMD to assess the long-term rainfall variability and to calculate two drought indices (viz., Standardized Precipitation Index (SPI, Ref. [9]) and simplified Rainfall Index (RIs, Ref. [26]). We carried out a detailed assessment of the recent weakened monsoon rainfall events in 2017 and 2018. We calculated the vegetation index (NDVI) and assessed the surface and subsurface soil moisture over the basin from October 2015 to September 2018. Furthermore, we quantified the variability of the reservoir water areas to detect the drought conditions.

2. Materials and Methods
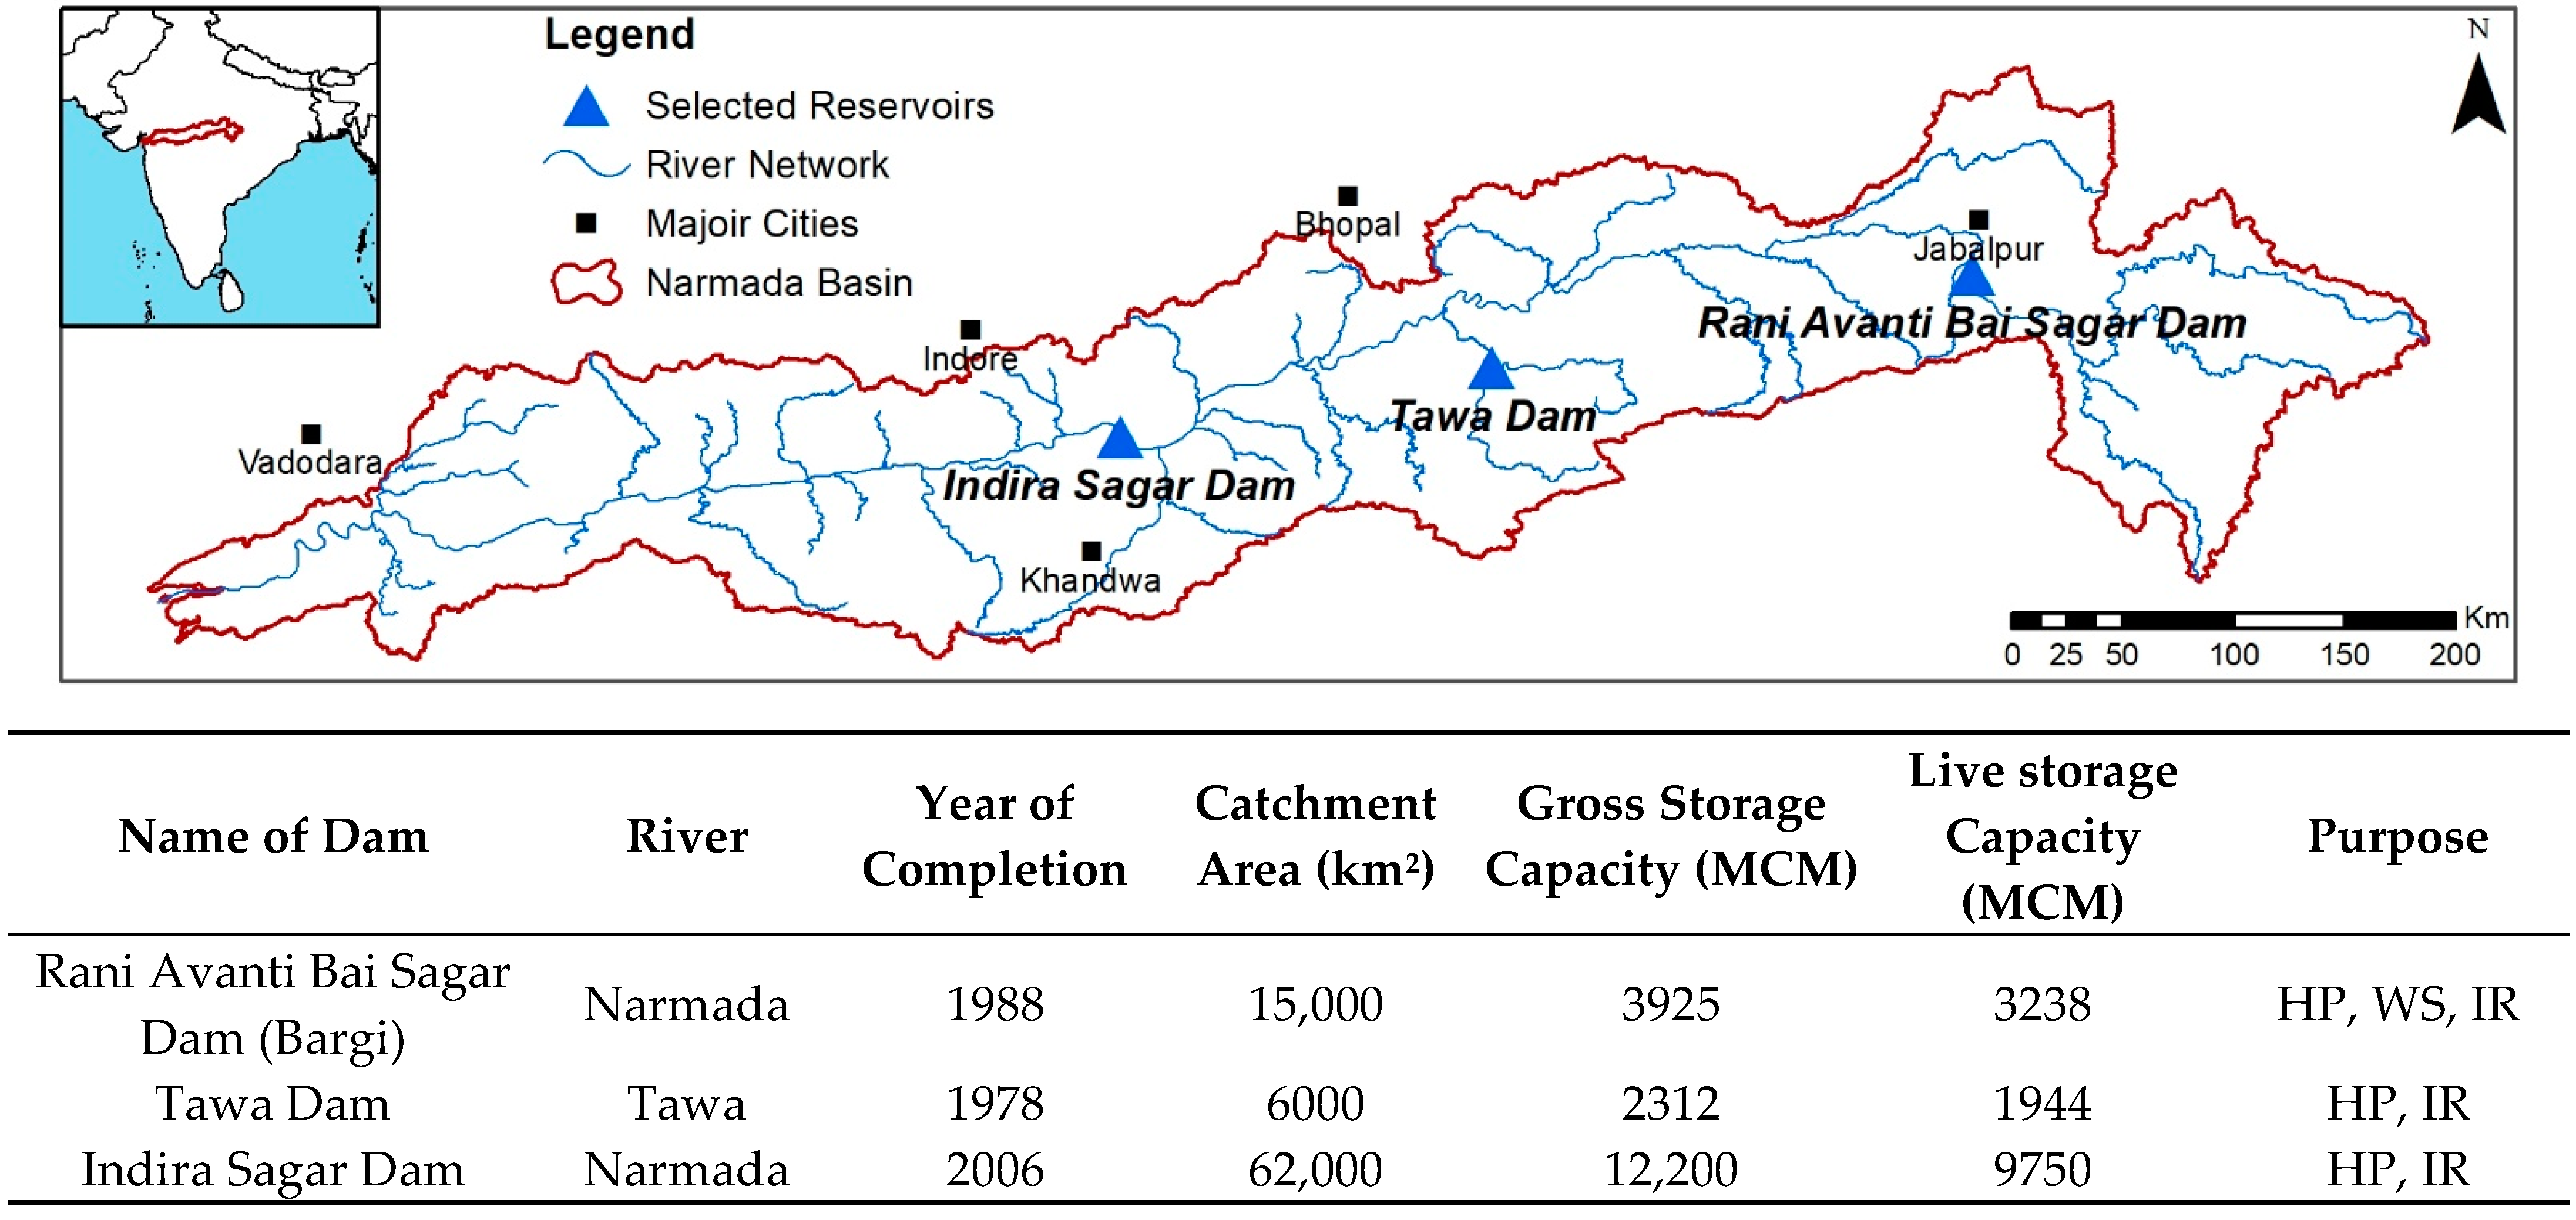
2.1. Study Area

The Narmada River Basin is the seventh-largest river basin in India, spanning between 72°32′ to 81°45′ E longitude and 21°20′ to 23°45′ N latitude (Figure 1) with a drainage area of 97,560 km2. It contains the fifth-longest river in the country (i.e., the Narmada River), which is 1312 km long and fed by 41 tributaries, annually draining ~46 km3 to the Arabian Sea. It can be categorized as a rift valley river with two hill ranges on either side. The elevation in the basin varies from ~1200 m above mean sea level (MSL) in the most upstream mountainous region to the low-lying coastal area (<100 m MSL) downstream (Figure 1a). The floodplain areas along the Narmada River are at <400 m MSL. According to the topographic slope classification of the FAO (2003) [27], the Narmada basin can be categorized as undulating land (0–8% slope). By 2005, approximately 52% of the basin’s land area was utilized as cropland, while the rest was primarily covered by forest, fallow lands, and water bodies (Figure 1b). Over the previous two decades (1985–2005), cropland has increased by 3.8%, and the total forest area was reduced by 1.2%. The basin’s population mainly depends on the agricultural production of paddy, wheat, soybean, sugarcane, jower, and gram [28]. According to the FAO soil classification, vertisols (heavy clay-rich with a high proportion of swelling clay) is the dominant soil type found in the basin [29].
The average annual rainfall in the basin is 1048 mm, varying from 1490 mm upstream to 670 mm downstream (Figure 1c). Approximately 90–95% of the total annual rainfall in the basin occurs during the south-west monsoon period (June to September). According to a trend analysis (using a simple linear regression method) of the annual rainfall over 30 years (1989–2018), most of the upstream basin areas show a decreasing trend, while middle and downstream areas show increasing trends (Figure 1d). Here, datasets were fitted to linear regression lines and the slope of the line is presented as trend in mm/yr. The mean annual temperature varies from 17.5 °C to 20 °C and 30 °C to 32.5 °C in the cold (December–January) and hot (March–April) seasons, respectively.

2.2. Data Used

This study used meteorological and reservoir data from local authorities and remote-sensing (RS)-based data from global products to analyze the long-term droughts (1989–2018) and the recent droughts caused by the weakened monsoons in 2017 and 2018.

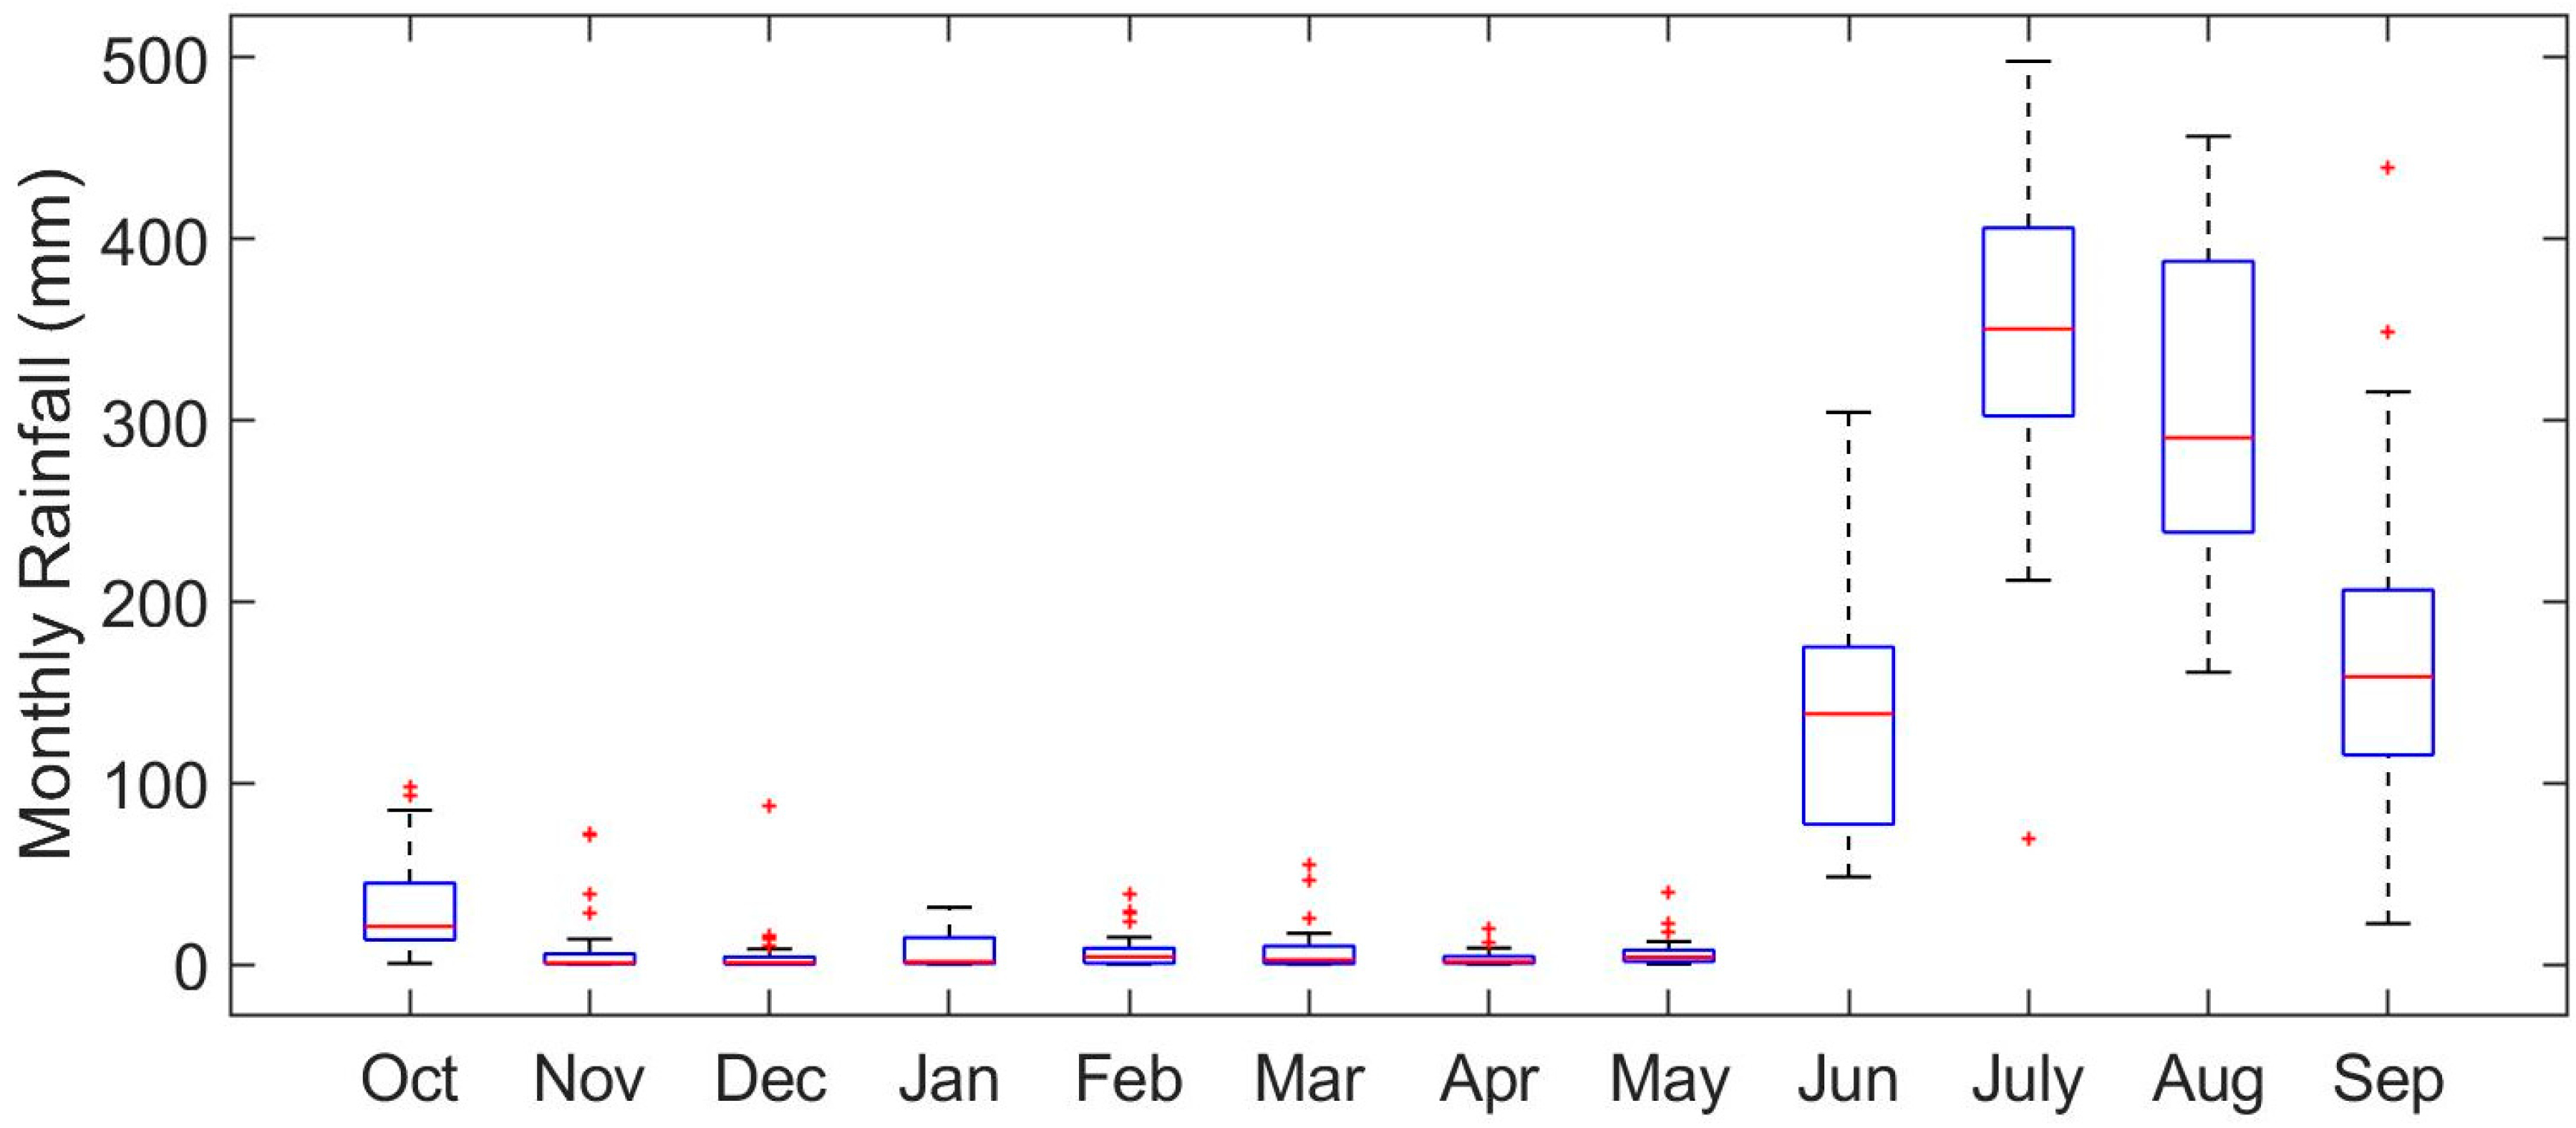
2.2.1. Meteorological Data

The daily rainfall and maximum and minimum temperatures were collected from the Indian Meteorological Department (IMD) at 0.25° × 0.25° (134 grids) and 1° × 1° resolutions, respectively [31,32]. This IMD rainfall was derived from Inverse Distance Weighted Interpolation (IDW) of 6955 rain gauge stations over India, whereas the temperature data is the interpolated (modified Shepard’s angular distance weighting algorithm) product from 395 stations. For our analysis, we considered a hydrological year from October to September.
The annual average basin rainfall has decreased over the last 30-year period (Figure 2a) by ~1.2 mm/year (on average), which is negligible, compared to the total annual rainfall (1048 mm). However, it is noteworthy that trends vary locally (Figure 1d). In 2017 and 2018, the annual rainfall volumes were below the long-term average of 1048 mm. Furthermore, the number of dry days (rainfall < 1 mm) has increased over 30 years (Figure 2b). Generally, the rainfall from November to May is almost zero, while the highest rainfall is received during July and August (Figure 3).

2.2.2. Remote-Sensing-Based Global Products

The Normalized Difference Vegetation Index (NDVI) over the basin was obtained from the MOD13Q V6 product [33,34] at 250 m pixel size and 16-day interval. This MODIS NDVI (moderate resolution imaging spectroradiometer—NDVI) is referred to as the continuity index to the existing advanced very high-resolution radiometer (AVHRR) derived NDVI by the National Oceanic and Atmospheric Administration (NOAA). This data is available from 2000 and is suitable for monitoring agricultural droughts, vegetation dynamics, and estimating crop yields.
The soil moisture at the surface and sub-surface was obtained from NASA-USDA Enhanced SMAP Global soil moisture data at a 10 km spatial resolution, available from the 1st of April 2015 at a three-day time interval. This dataset is produced by combining the satellite-derived Soil Moisture Active Passive (SMAP) Level 3 soil moisture data with the modified two-layer Palmer model using a 1D Ensemble Kalman Filter data assimilation approach [35,36,37,38] and is developed by the Hydrological Science Laboratory at NASA’s Goddard Space Flight Center, in cooperation with the USDA Foreign Agricultural Services and the USDA Hydrology and Remote Sensing Lab. The maximum water holding capacity of the first layer (surface) is estimated to be 25.4 mm, and the second layer (subsurface) is 275 mm, which can vary based on the soil type.
We derived the changes in the reservoir surface area using Landsat 8 Collection 1 Tier 1, representing scale, calibrated at sensor radiance. This highest quality data (i.e., Tier 1 data) are considered suitable for the time-series analysis. Landsat 8 images are available from 11 April 2013 to present (near-real-time).
We used the Google Earth Engine (GEE) platform (https://earthengine.google.com/, accessed on 15 August 2021) to download and process the spatial data (NDVI, soil moisture, and Landsat images). The NDVI and soil moisture data were downloaded for three hydrological years, spanning 1 October 2015 to 30 September 2018. The analysis was carried out for each quartile of a hydrological year by composite images of three month spans. Three reservoirs in the Narmada basin were used in our analysis to assess the reservoir surface area changes during the recent drought years of 2017 and 2018. More details on the reservoir surface area calculation are given in Section 2.3.4.

2.2.3. Reservoir Characteristics and Operational Data

The three main reservoirs located up-, middle-, and downstream (Figure 4) were considered for our analysis because of their importance in hydropower generation, irrigation of the water supply, and drinking water supply. The data required for this analysis (i.e., water level time series from October 2015 to September 2018) were collected from a web portal maintained by the Water Resources Department, Madhya Pradesh, India (http://eims1.mpwrd.gov.in/fcmreport/control/main, accessed on 1 August 2021). Even though the time series were not continuous, the data can be used for validating the reservoir water surface area changes computed in our study.

2.3. Drought Iindices and Assessment

In this study, a few of the most commonly used drought indices were used to assess the drought in the Narmada River Basin using freely available local and global data. At first, the meteorological drought assessment was carried out using the Standardized Precipitation Index (SPI) and the simplified Rainfall Index (RIs). Since more than 50% of land area of the Narmada basin is utilized for agriculture, the Normalized Difference Vegetation Index (NDVI) was used to capture crop health during the drought period and to assess the agricultural drought. Furthermore, the changes of the soil moisture is one of the indicators for agricultural drought monitoring as it is essential for crop growth. Finally, changes in the reservoirs were calculated to identify the consequences of the weakened monsoon and the resultant drought conditions in the basin.

2.3.1. Indices Derived from Rainfall

The SPI [39] is the most commonly used index among several other indices to determine the short- and long-term spatial-temporal distribution of meteorological droughts and to identify, monitor, and define the severity of droughts [7]. It fits the rainfall data to a probability distribution (commonly Gamma or normal distribution) to convert data to a reduced variate. The short- and long-term meteorological drought analysis can be represented by different SPI indices, based on the number of months considered (e.g., SPI-3, SPI-6, SPI-12, and SPI-24, in which 3, 6, 12, and 24 are the number of months). Generally, the short-term responses to the changes in rainfall can be found in soil moisture and plant health, while groundwater and reservoir storage respond to long-term changes in the rainfall. This study conducted the SPI analysis for 3, 6, and 12 months by considering the daily rainfall in the Narmada basin for 30 years. The subsequent drought categorization is presented in Table 1.
The IMD defined drought as more than a 25% rainfall deficit from the long-term average. Considering this IMD criterion, a simplified rainfall index (RIs) was introduced by Swain et al. (2021) [26], which can be expressed as:
R I s = 1 25 %   P i P m P m = 4 P i P m P m
where, P i is the total rainfall for the ith season or year and P m is the long-term mean rainfall over a particular season or year of each grid cell. In general, the meteorological applications require at least 30 years to represent the long-term mean value. In this study, the rainfall dataset covers 30 years spanning 1989 to 2018. The dry/wet conditions are categorized based on this index (Table 1).
Both indices (SPI and RIs) have their simplicity and similarly capture the drought severities. Here, we used the SPI to assess the basin-wide precipitation anomalies over the past 30 years and the RIs for the detailed spatial drought assessment over the last three years in the Narmada River Basin.

2.3.2. Normalized Difference Vegetation Index (NDVI)

The NDVI is one of the most commonly used vegetation indices for monitoring and agricultural drought assessment [41]. The changes in the canopy cover (green leaves) and vegetation health can be interpreted with an NDVI analysis. The NDVI is the normalized transform of near-infrared (NIR) to the red reflectance ratio, which varies between −1 and 1. Since the NDVI is a ratio, it can minimize certain band-correlated noises and influences related to changes in atmospheric and spatial conditions. However, ratio-based indices can exhibit a non-linear behavior resulting in a sensitivity to variation in vegetation over certain land cover conditions [33]. To analyze the effects of drought on vegetation at spatial and temporal scales, the MODIS NDVI (discussed in Section 2.2.2) was used in this study.

2.3.3. Soil Moisture Content

In recent studies, remote sensing-based soil moisture (SM) data has been used in agricultural drought monitoring [35,42,43]. It provides information to monitor the intensity of droughts, the beginning of rainy seasons and planting, and awareness and early warning of crop productivity or losses [44]. This analysis was carried out on a seasonal basis (3 months) for three hydrological years (2015/2016, 2016/2017, and 2017/2018). As the soil moisture data is available at a 3-day interval, we considered a cumulative soil moisture for three months and presented the total soil moisture every three months.

2.3.4. Reservoir Water Surface Area

Agricultural, hydrological, and socio-economic droughts may follow from prolonged meteorological droughts. The availability of water resources depletes with prolonged drought conditions, resulting in stress in fulfilling water demands for agriculture and other sectors. Reservoirs in the Narmada River Basin play a vital role in storing water during the rainy season and re-distributing for societal needs during dry seasons. However, with a continued meteorological drought, reservoirs may not be able to serve the required water amount for different purposes, as expected, which is a critical situation in most agricultural economies. Owing to the importance of reservoir water storage in the Narmada River Basin, this study analyzed the surface water area changes in three major reservoirs of the Narmada basin (Figure 4).
The Normalized Difference Water Index (NDWI, an indicator for surface water) was used to differentiate the water area from the Landsat 8 images. In this study, the water bodies were detected by using two methods: (1) normalized differences between green and NIR bands (Equation (2), [9]) and (2) normalized differences between green and short-wave infrared (SWIR) bands (Equation (3), [45]). The total water surface areas of each reservoir were calculated based on the images available for the analysis period (October 2015–September 2018). The calculated surface areas were compared with the reservoir water level data (discussed in Section 2.2.3). For this analysis, we only considered the images with less than 20% cloud cover. Hence, most of the images during the monsoon months (particularly July–September) were omitted from the estimations.
N D W I G r e e n ,   N I R = G r e e n N I R G r e e n + N I R
N D W I G r e e n , S W I R = G r e e n S W I R G r e e n + S W I R

3. Results and Discussion

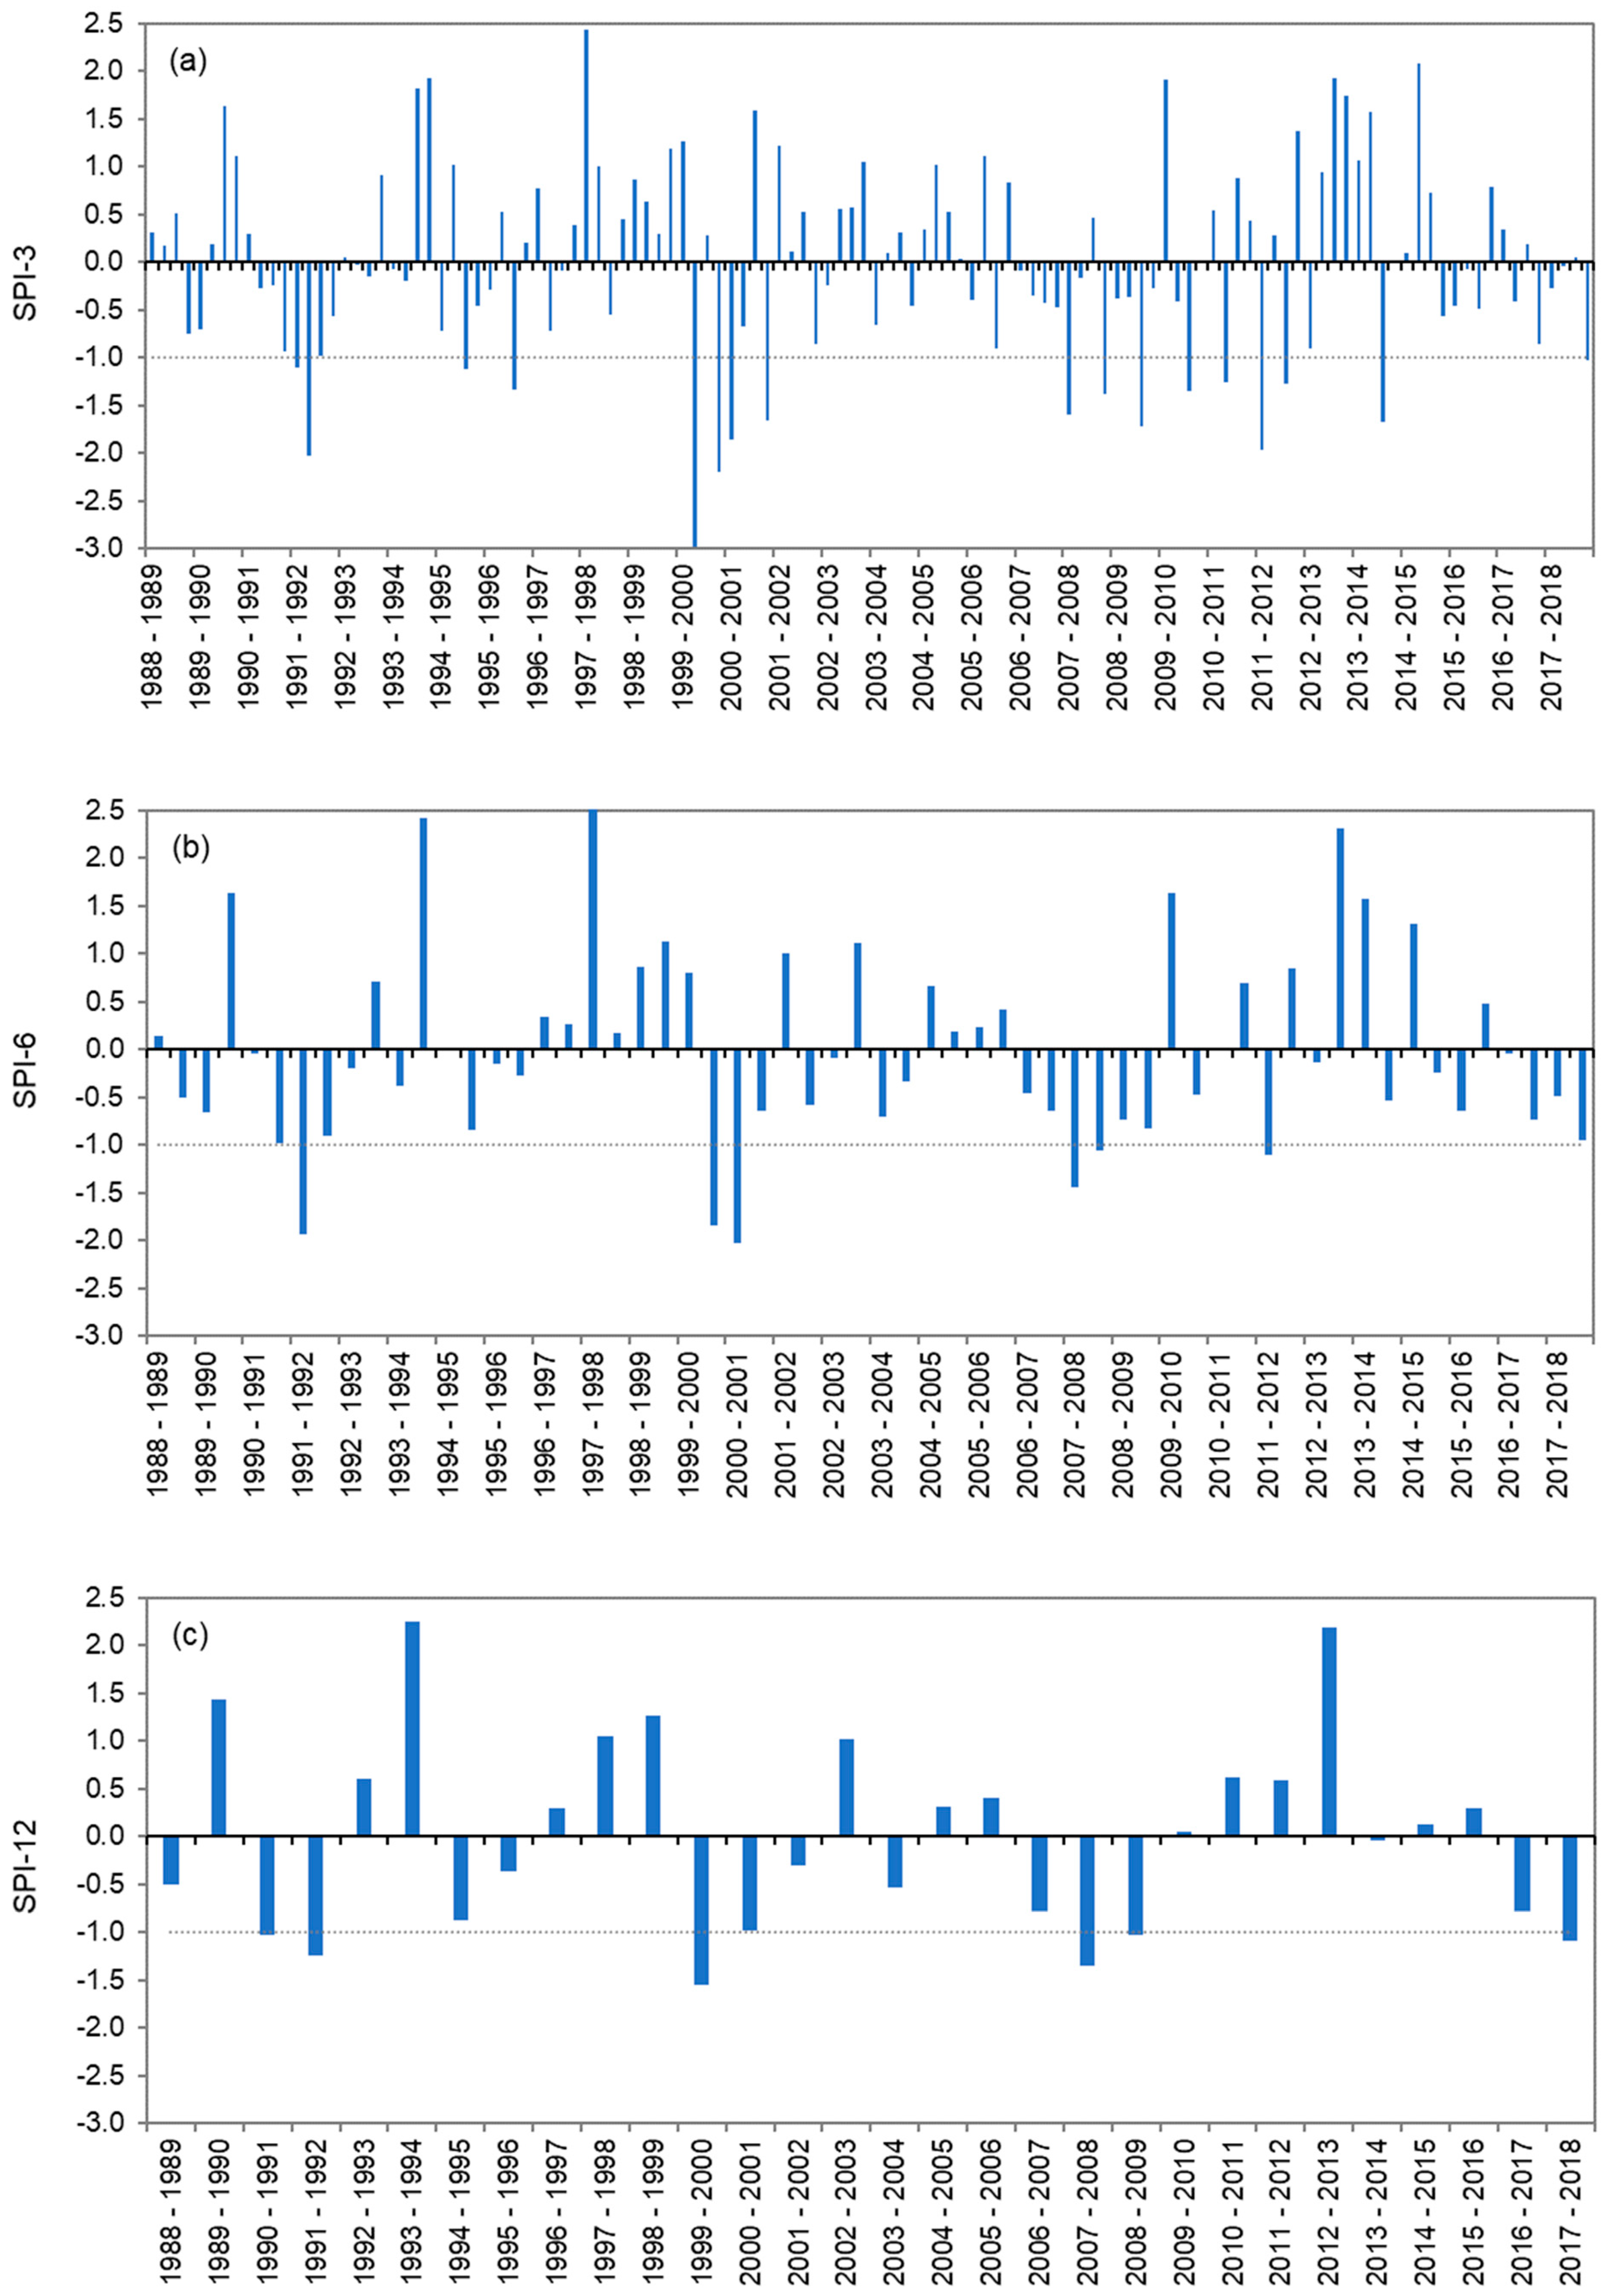
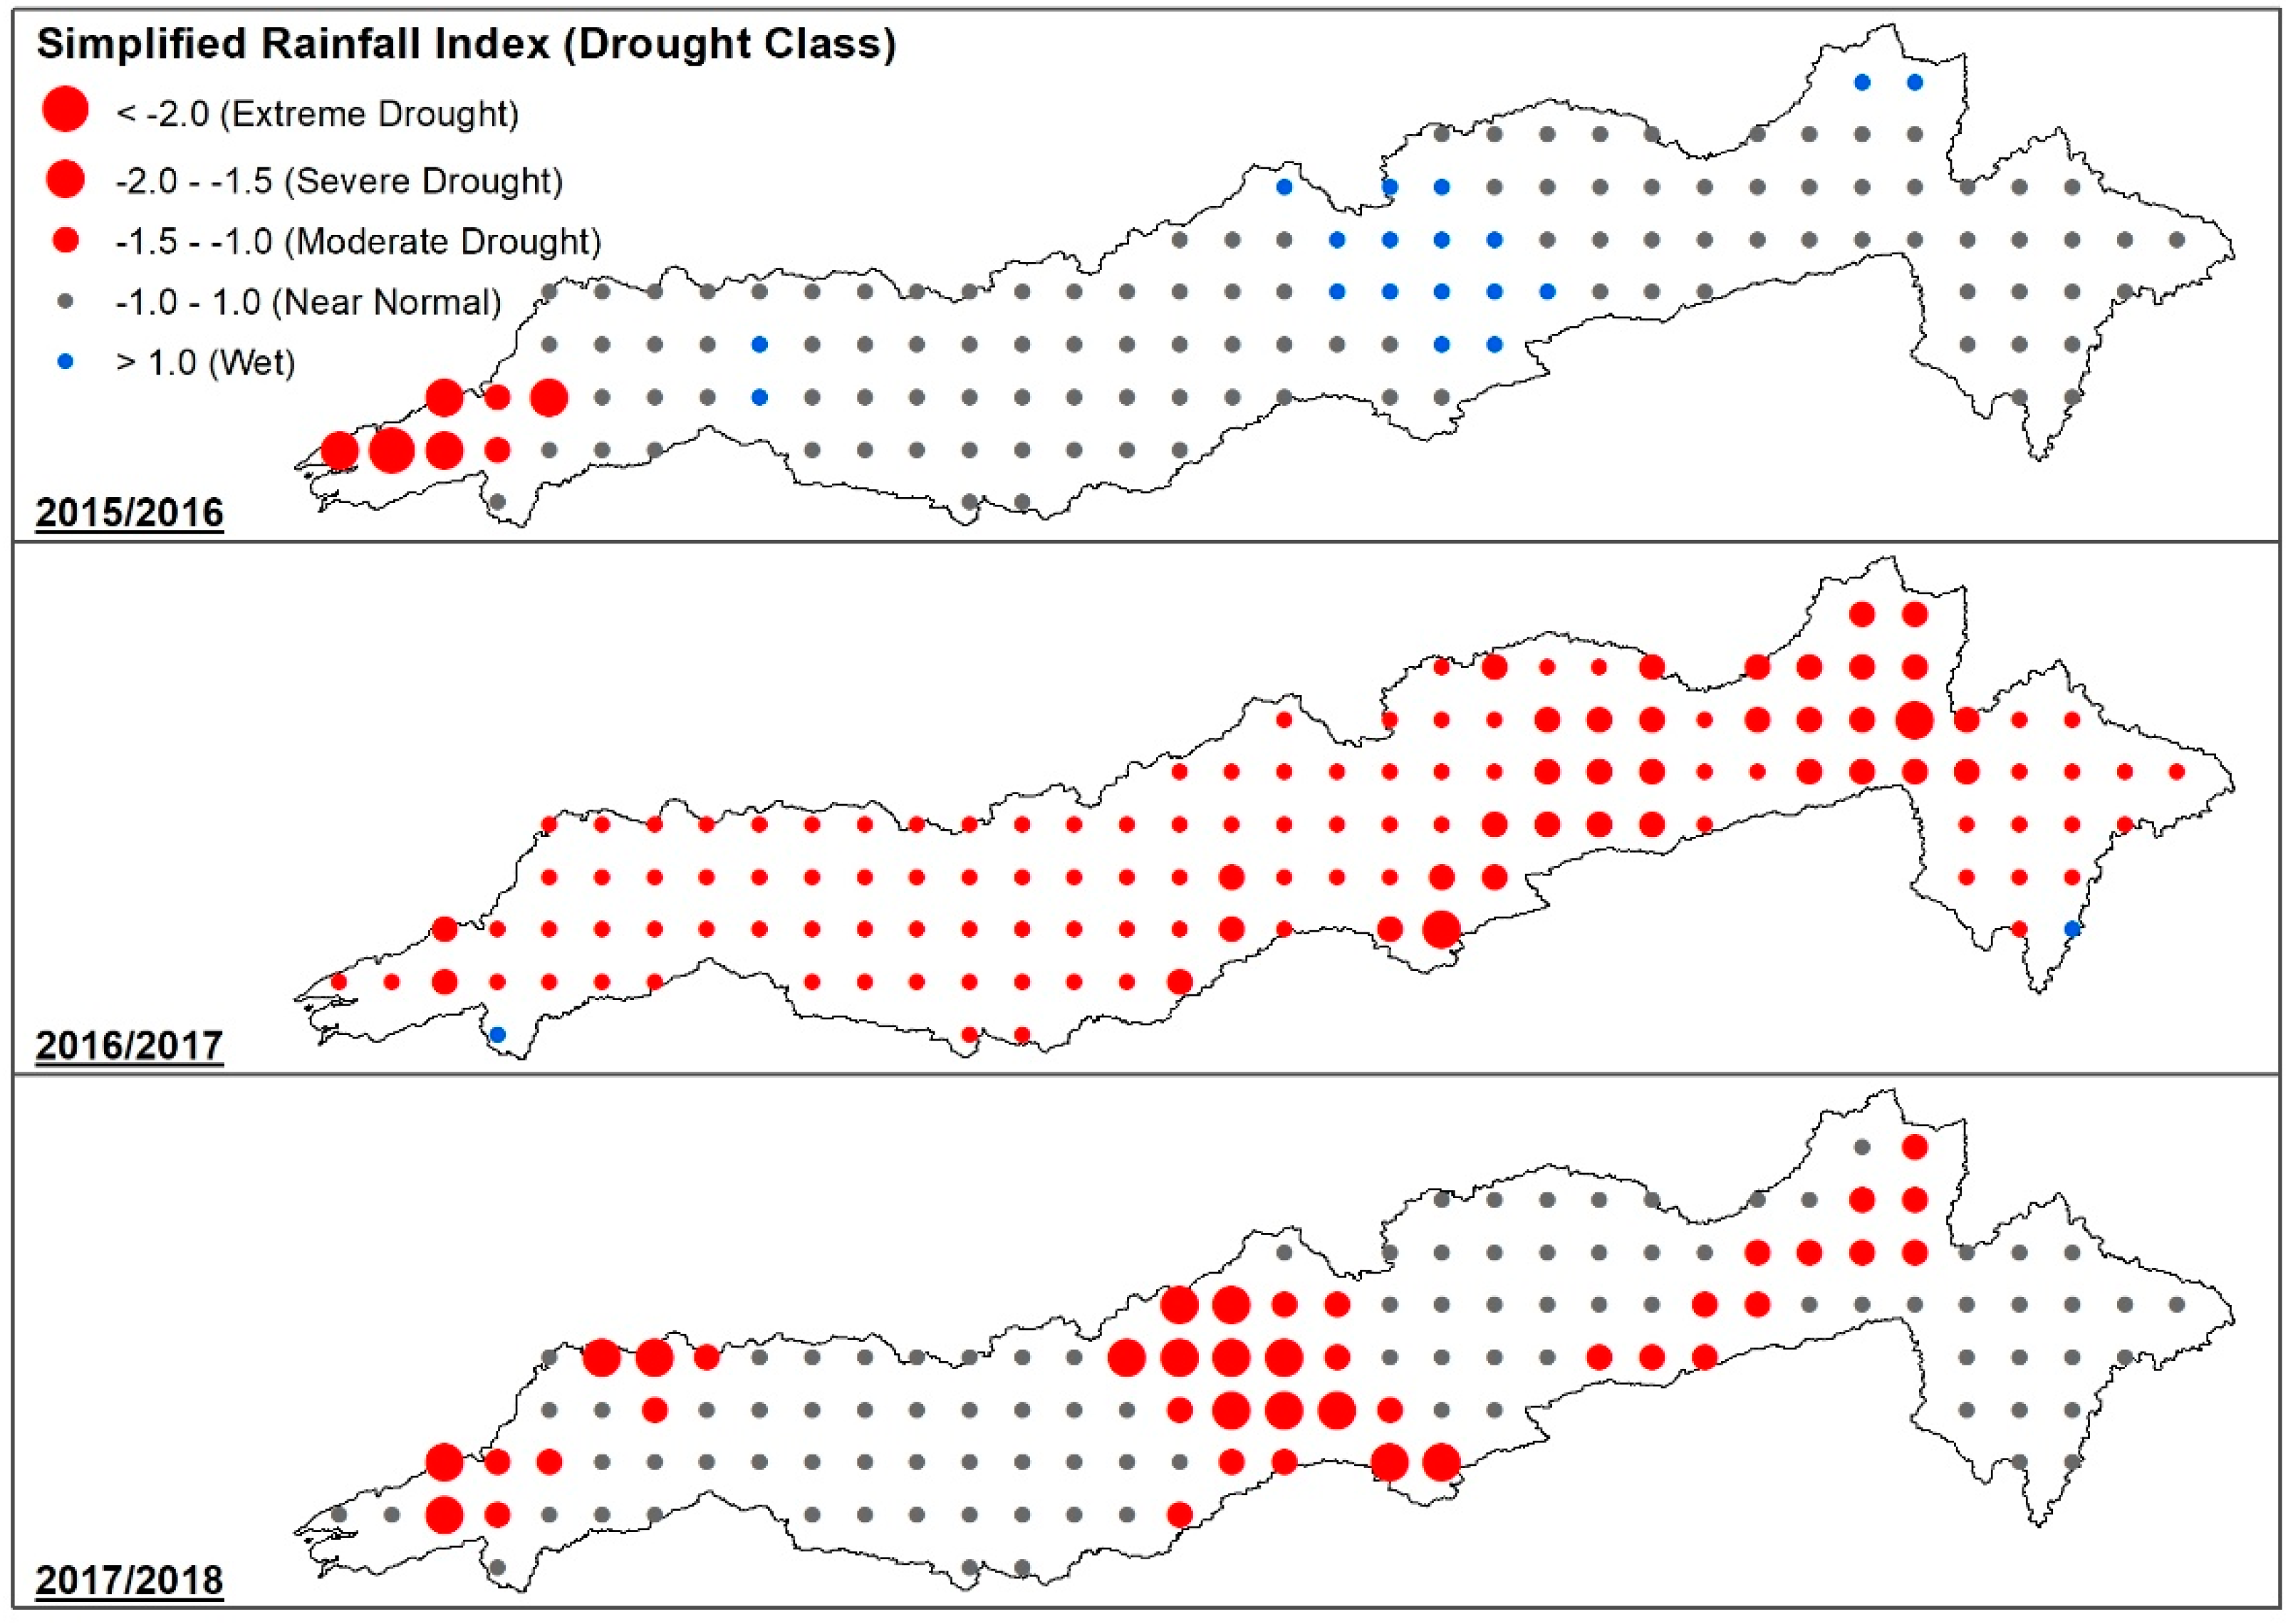
3.1. SPI and RIs over the Narmada Basin

Figure 5 shows that the Narmada basin has experienced many short (three months) and long-term (six and twelve months) droughts over the past 30 years (1989–2018). In India, monsoonal (June–September) droughts were recorded in 2002, 2004, 2009, 2014, and 2015 [16]. The recent major droughts have been documented in 2000, 2002, 2008, 2009, and 2015 in the north-western, western, or central parts of India [16], where the Narmada basin is located within or nearby. All three SPI indices shown in Figure 5 indicate the years 1999/2000 and 2007/2008 as ‘moderate’ or ‘severe’ droughts in the Narmada basin. Particularly, the year 2000 drought event was captured by the SPI-3 as an extreme drought (SPI < −2.5) from October to December of the hydrological year 1999/2000. Furthermore, the SPI indices were negative in 2001/2002 and 2008/2009, falling into ‘near normal’ conditions. In 2015/2016, the SPI-3 for July to September and the SPI-6 for April to September showed negative values, and the SPI-12 showed a positive value, classifying the whole year as ‘near normal’. The SPI-12 showed 2016/2017 as near-normal and 2017/2018 as moderate drought in the basin. According to the annual rainfall variation over the last three decades (Figure 2), 2017 and 2018 had rainfall deficits as it was below the long-term average value by 148 mm and 198 mm, respectively. These shortages were due to the weak monsoonal periods during the respective years. These results prove that the SPI can reasonably represent the recent meteorological drought conditions in terms of the short-term (SPI-3) and the long-term (SPI-6 and 12). This analysis was carried for the whole basin as one unit, however local conditions (regional or city level) may be different. The SPI-6 adequately reflects the seasonal and medium-term rainfall and their changing patterns. Agricultural and hydrological droughts generally take a season or more to develop. Therefore, the long-term SPI indices (SPI-6 and SPI-12) can be used as indicators to support the further investigation of impacts on water storage underground and in surface water (groundwater and reservoirs).
To further analyze the meteorological drought in the Narmada basin, we used the simplified rainfall index (RIs) suggested by Swain et al. (2021) [26]. They presented a detailed assessment of the meteorological drought at district levels in the basin from 1954–2013 by using the RIs. Therefore, our analysis was limited to three hydrological years from 2015 to 2018, covering the basin at a 0.25° × 0.25° spatial resolution at which the IMD rainfall data is available. Here, the RIs were calculated for the annual rainfall, where approximately 90–98% of its total is received during the monsoon season of the basin. Even more than the SPI-12, the RIs shows 2016/2017 and 2017/2018 as moderate or severe drought years in most of the basin. Particularly, in 2016/2017, the basin has undergone severe drought (Figure 6). This drought continued until 2018 when the middle and most downstream parts of the basin experienced a ‘severe’ drought, while most of the other regions were in ‘near normal’ condition and some faced a ‘moderate drought’. Due to the weakening of the monsoon rainfall in two consecutive years, this drought condition might significantly affect crop production, water supply, and hydropower generation.
These indices (SPI and RIs) only consider the rainfall to determine the drought severity. Therefore, temperature changes (maximum and minimum) were also analyzed and are presented in Figure A1. The analysis shows no significant changes in the average daily maximum and minimum temperatures over the Narmada basin during these three years (2015–2018). This further proves that droughts in 2016/2017 and 2017/2018 were mainly due to the weakening of monsoon rainfall only.

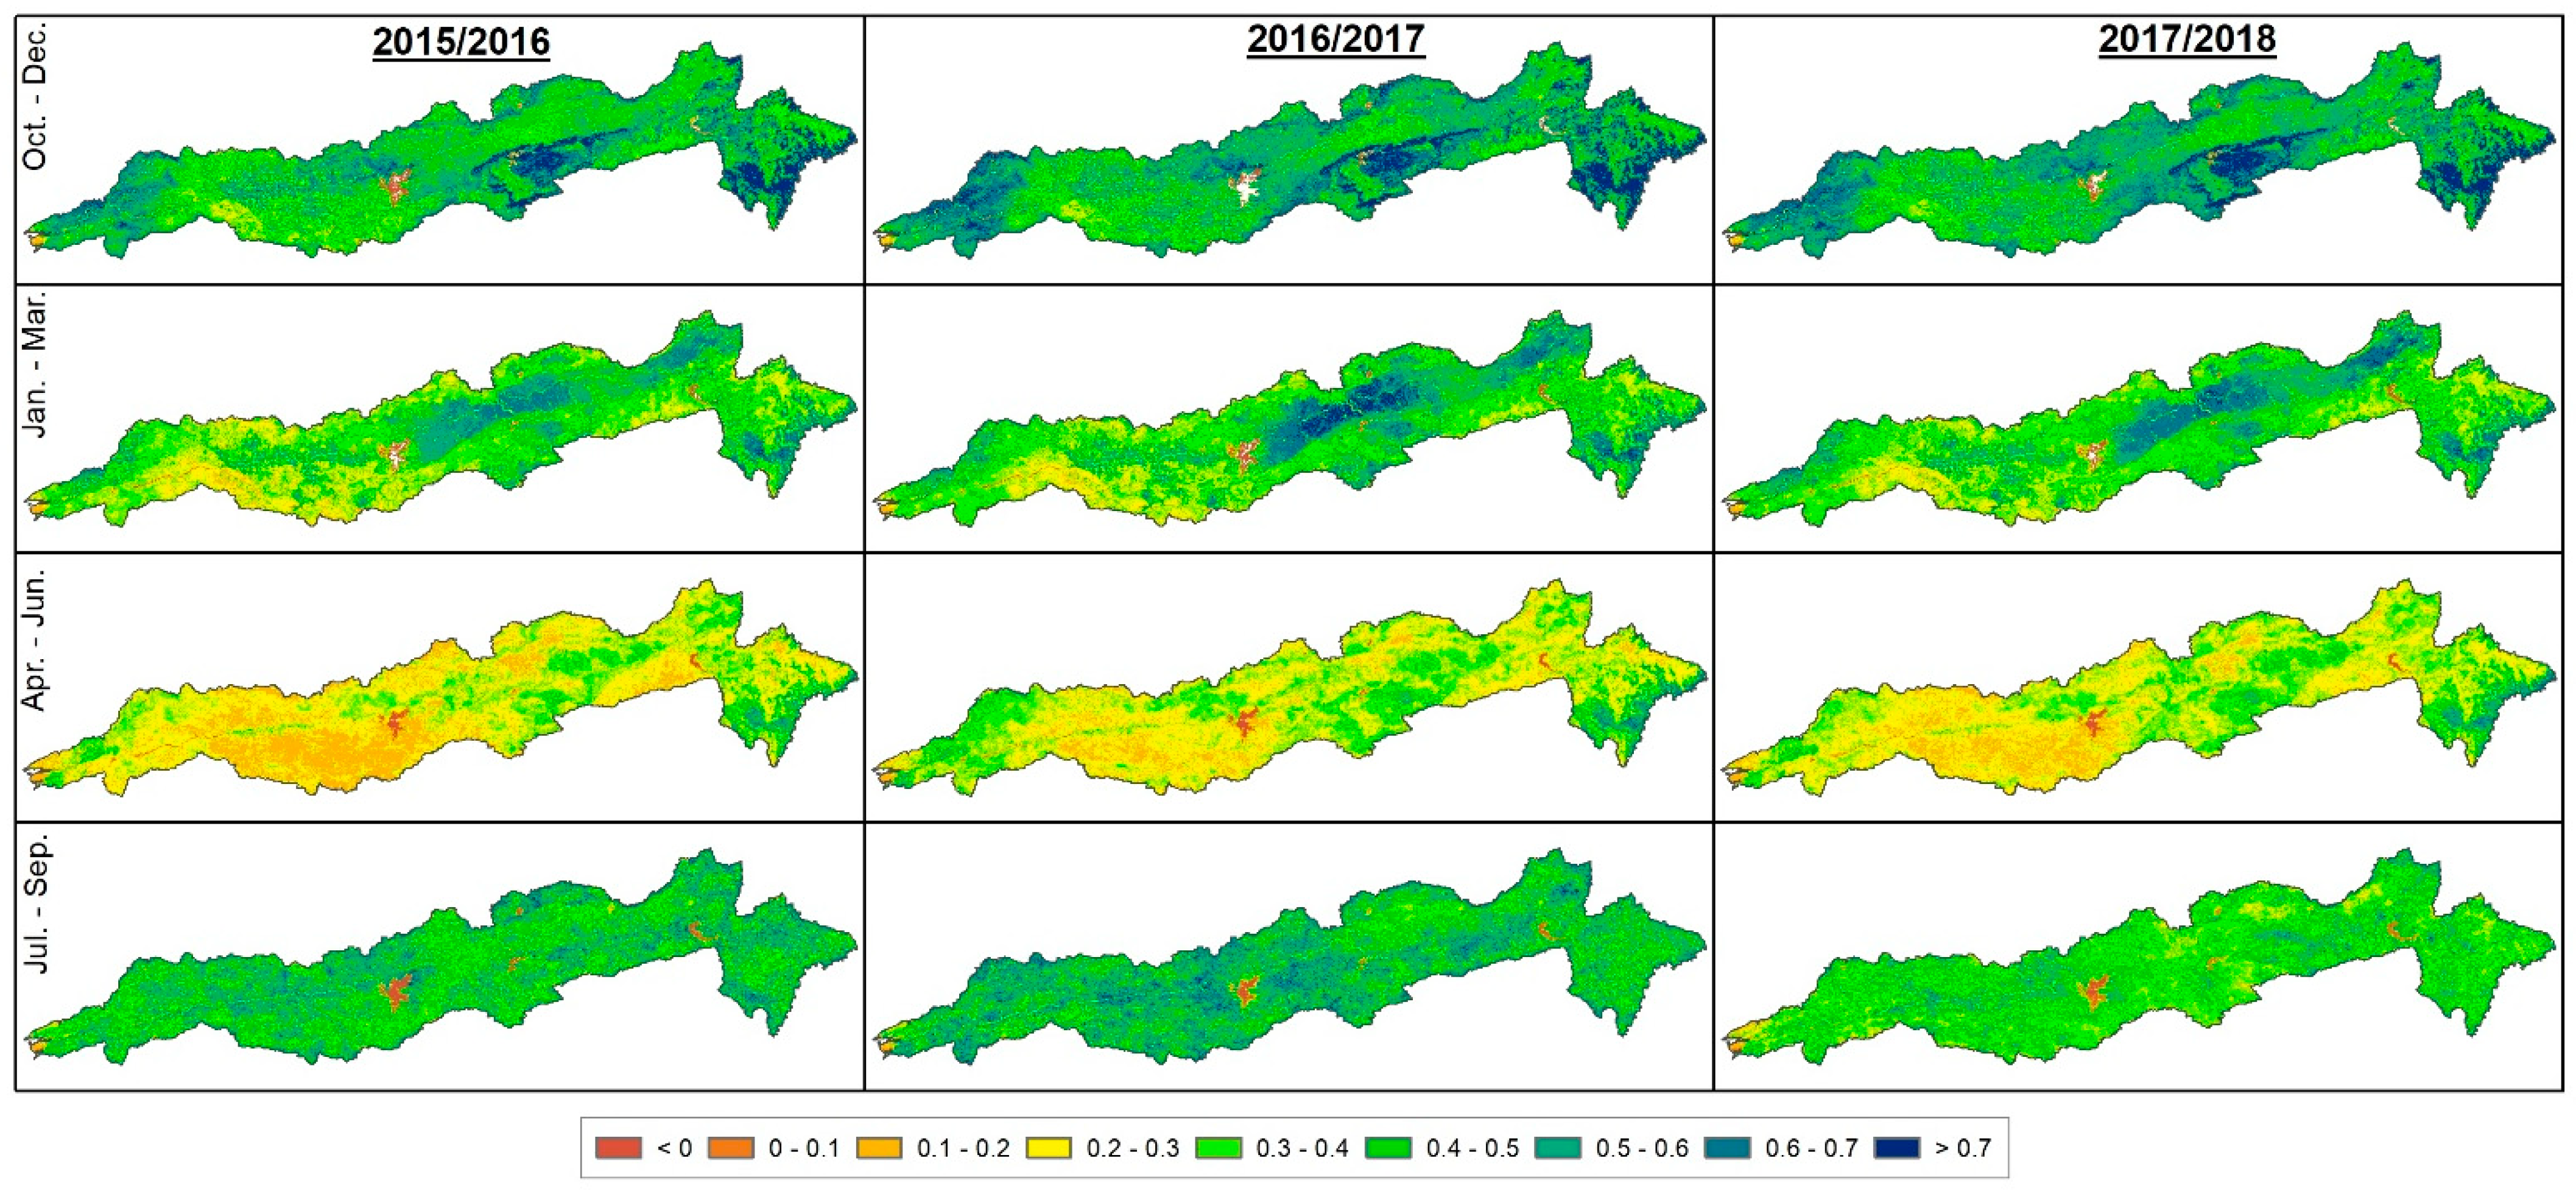
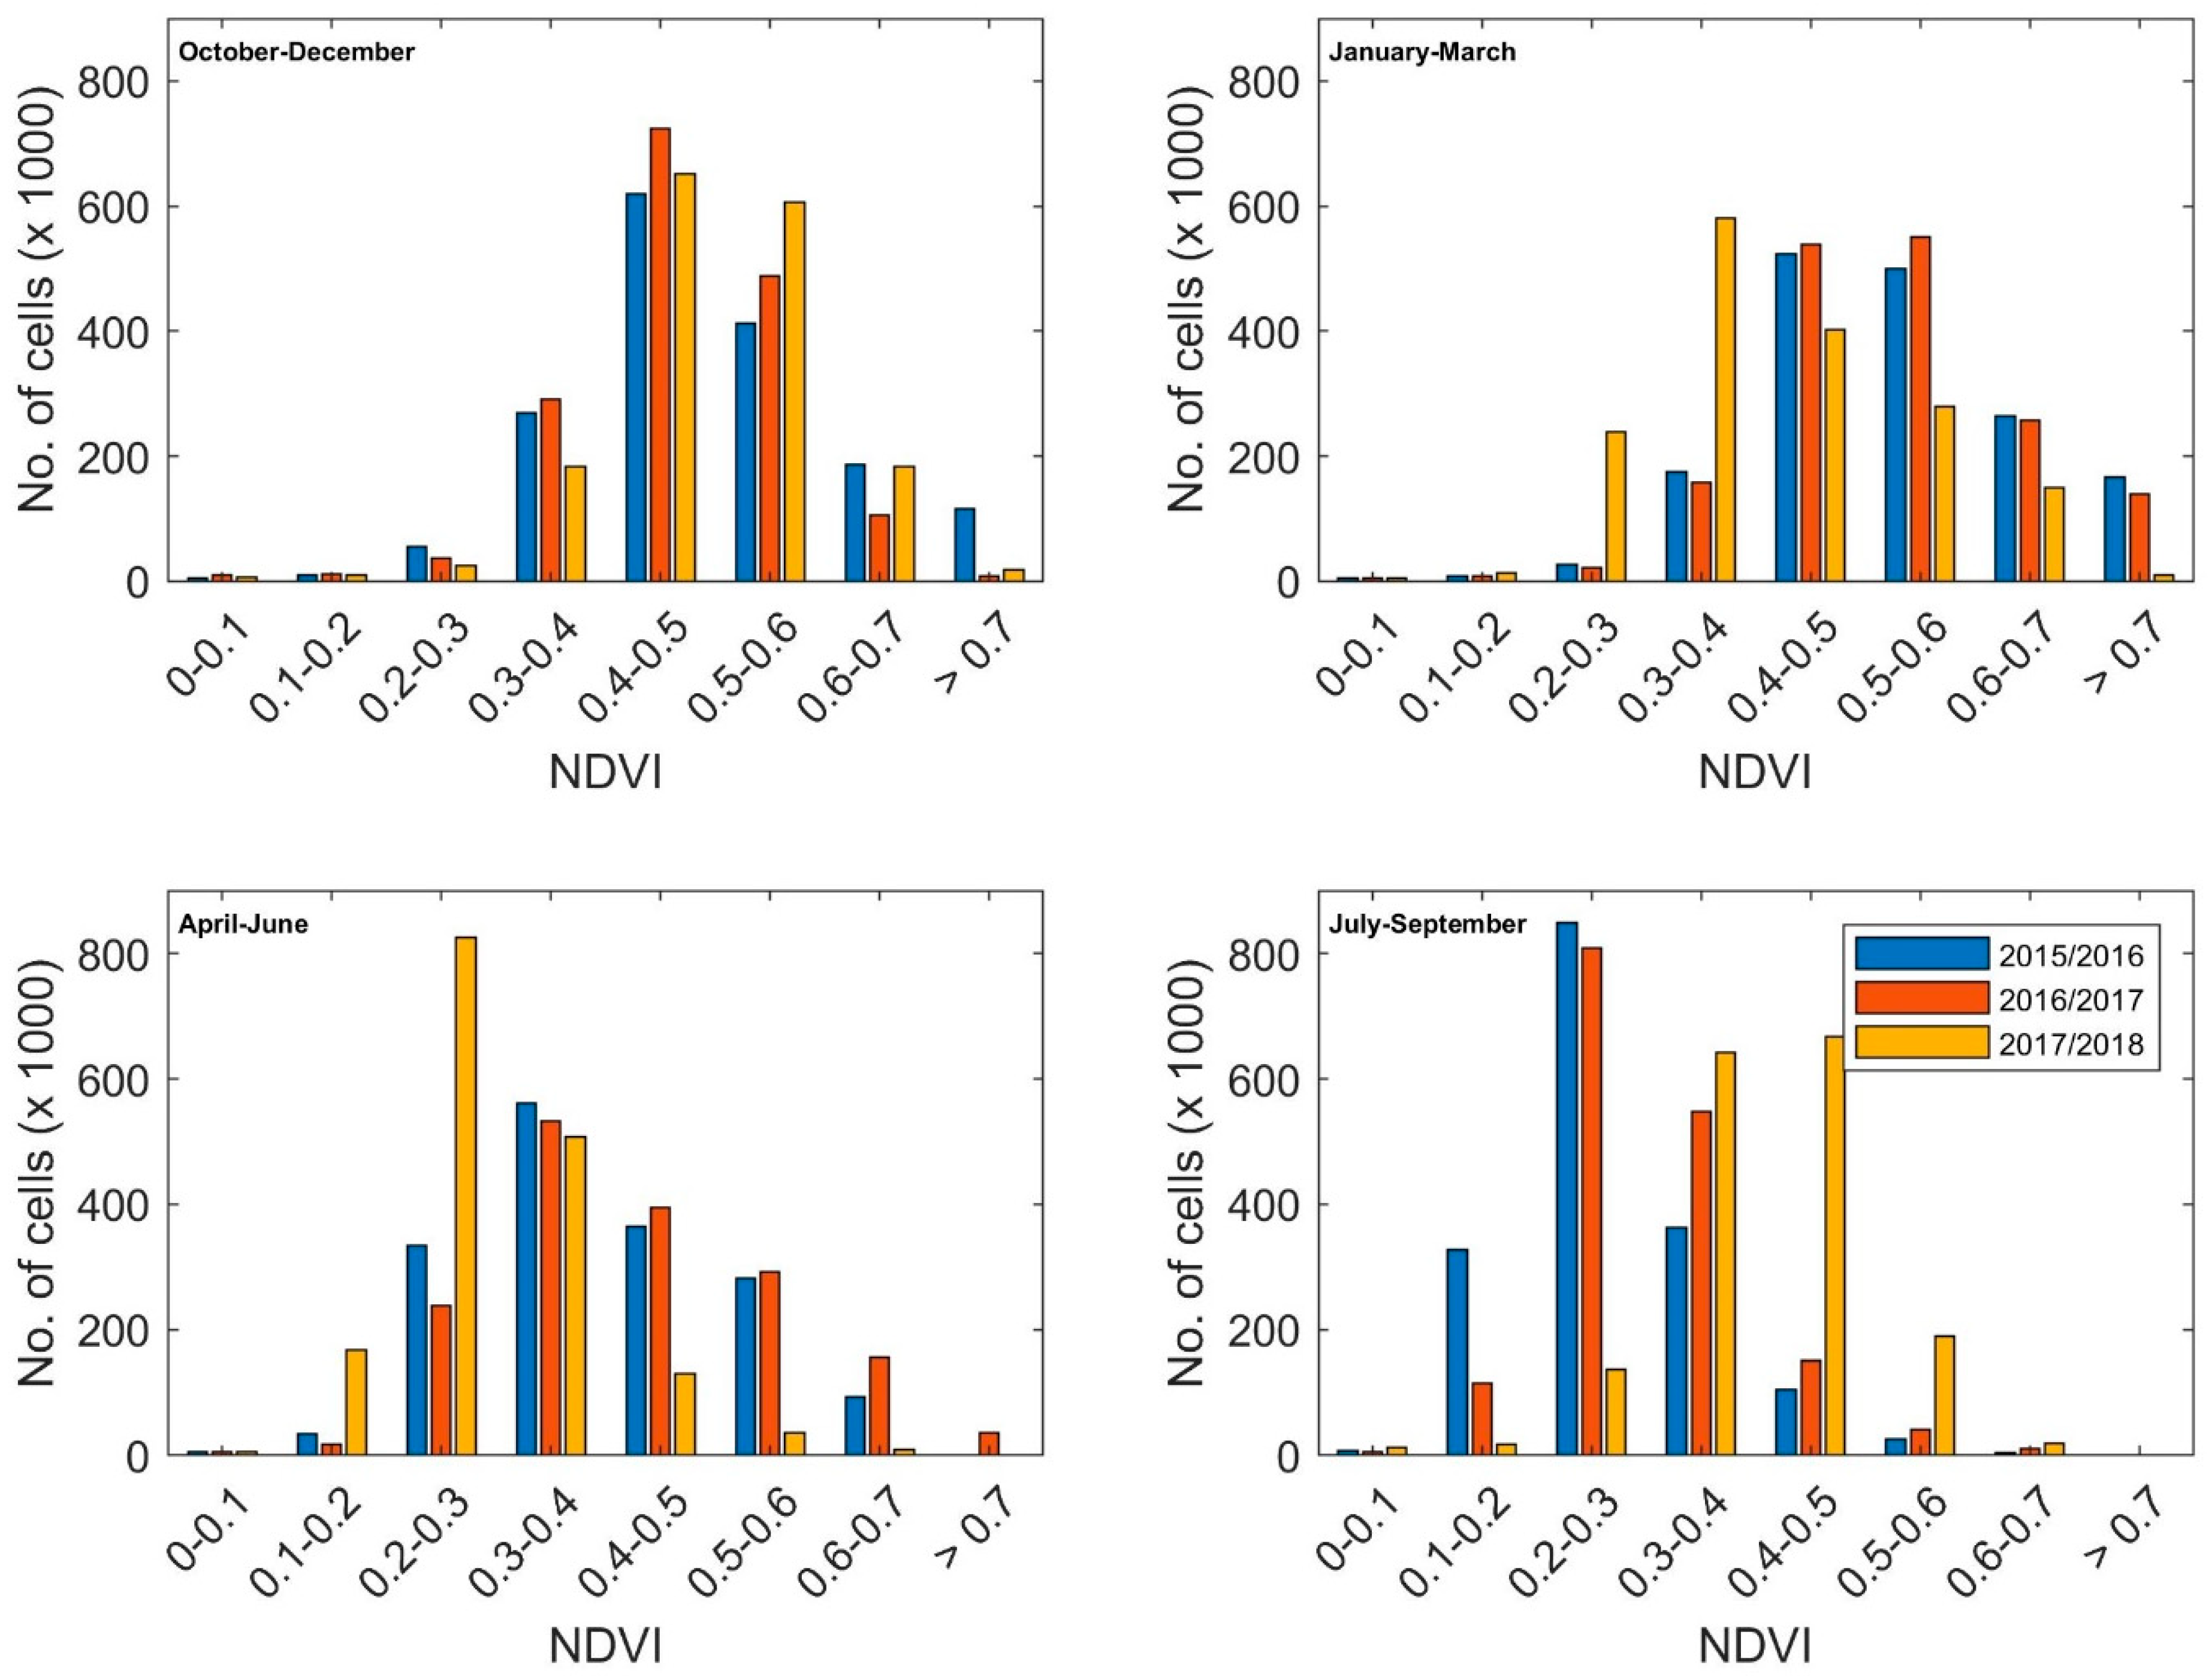
3.2. Changes in the NDVI

To assess the relationship between the meteorological and agricultural droughts, first, the vegetation conditions were analyzed in terms of the NDVI. The NDVI has a value between −1 and 1, where a higher value represents relatively greener and healthier vegetation. The Narmada basin area shows mean (standard deviation) values of 0.402 (0.081), 0.428 (0.082), and 0.405 (0.076) in 2015/2016, 2016/2017, and 2017/2018, respectively. These NDVI data were obtained from the MODIS NDVI products at 250 m grid resolution, which has been used for many studies around the world (e.g., Dutta, 2018, Mbatha and Xulu, 2018, and Zhi et al., 2019) [1,46,47]. In order to obtain more details on the spatial NDVI changes at seasonal scales, further analysis of the NDVI was carried out every three months. The quarters clearly show seasonal patterns in the NDVI (Figure 7). During the monsoon period (July–September), the NDVI is relatively high and even increases into the post-monsoon period (October–December). From January through June, the NDVI decreases. There are three types of cultivation seasons in the Narmada basin: (1) Kharif crops (July to October), (2) Rabi crops (October to March), and (3) Zaid crops (March to June). Kharif and Rabi are the major crop seasons [48]. Paddy is the most common Kharif crop, mostly cultivated in the middle and upper parts of the basin (the hot subhumid eco-region). Wheat and gram are the most common Rabi crops in the same areas. In the lower hot-semi arid eco-region of the basin, sorghum, soybean, maize, and pearl millet are common Kharif crops, whereas sorghum, sunflower, and gram are the common Rabi crops. Vegetables are the Zaid/summer crops cultivated as rotational systems. These cultivation patterns are based on the water availability (irrigation and rain). About 30% of the basin is covered by forests. In the upper parts, tropical moist deciduous forests exist, and the middle and lower areas comprise tropical dry vegetation, commonly bamboo. The Kharif and Rabi crop seasons profit from the monsoon rainfall, as it retains moisture and further develops during the post-monsoon periods. From February to May, the basin undergoes harvesting and the least cultivation, which is reflected in the lowest NDVI from April to June. This suggests that the NDVI provides a good representation of the vegetation health in the basin. However, part of the cultivated land area has irrigated agriculture as more than 250 dams in the basin serve as water suppliers for agriculture. In such conditions, the NDVI may not be able to reflect the agricultural drought in the Narmada basin as irrigation compensates for the rainfall deficiency for crop water requirements. There is no clear difference between the quarters in the three years considered, except for July-September in 2018, which could be a result of the weakened monsoon.

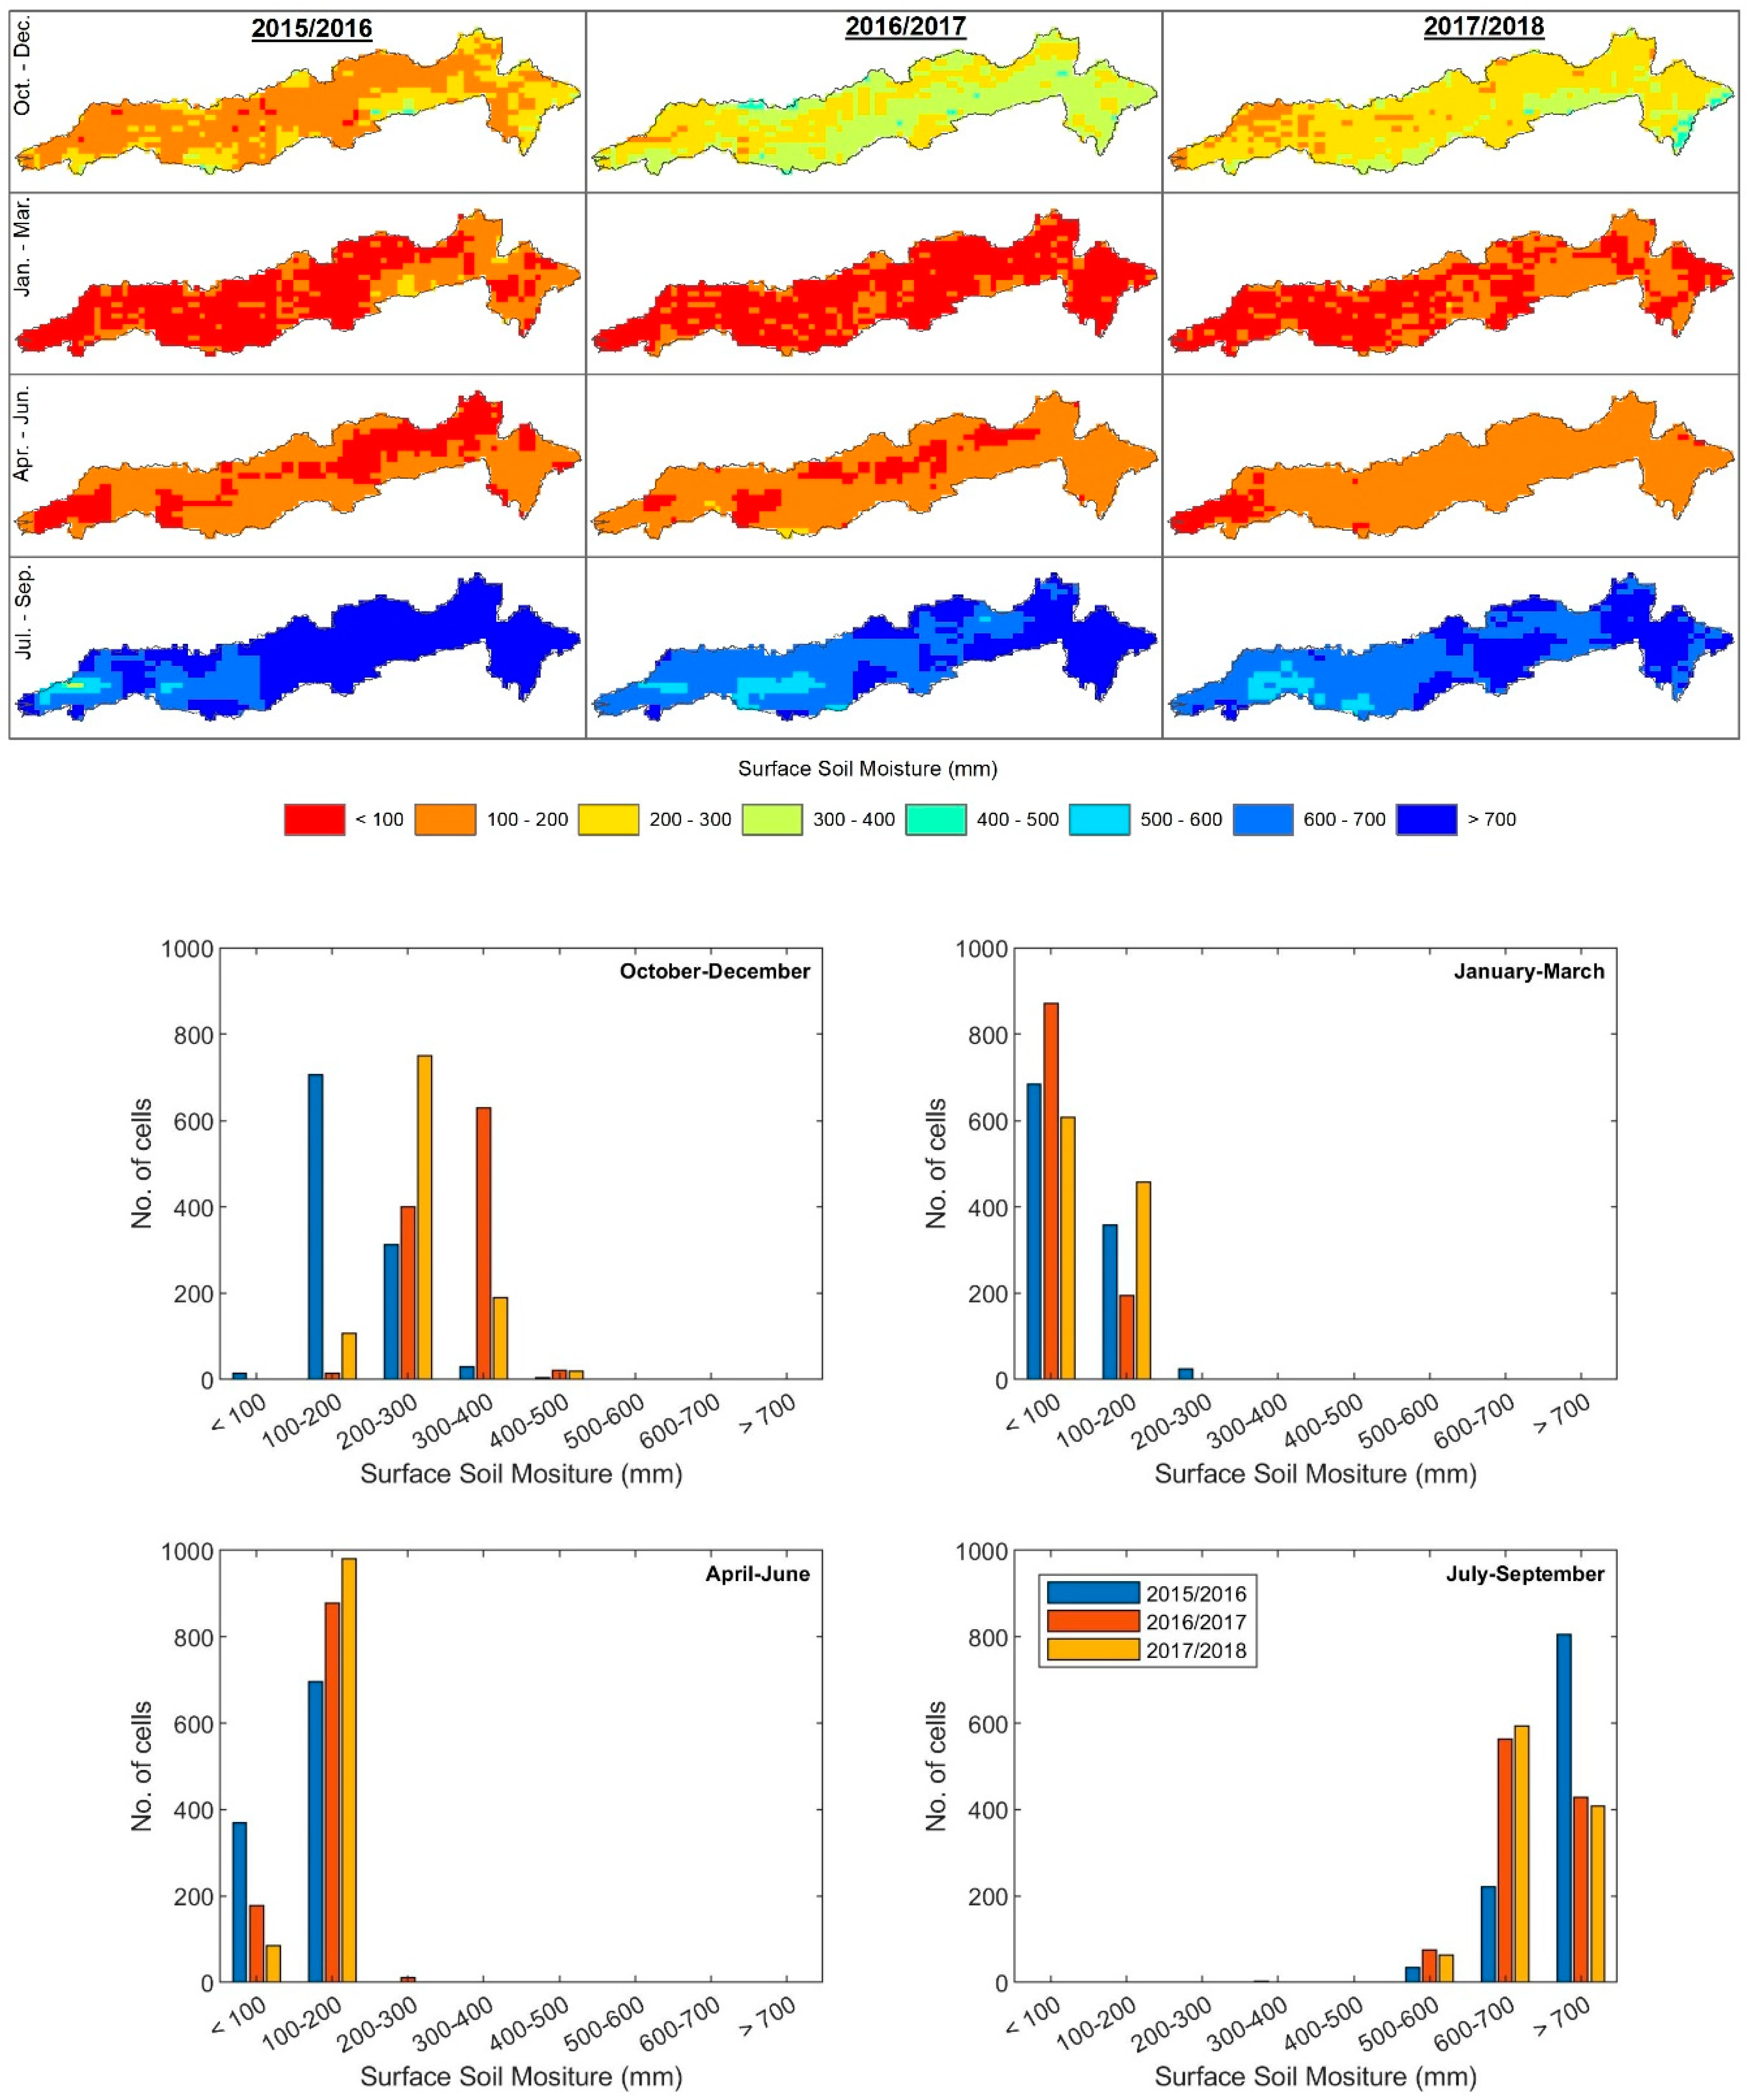
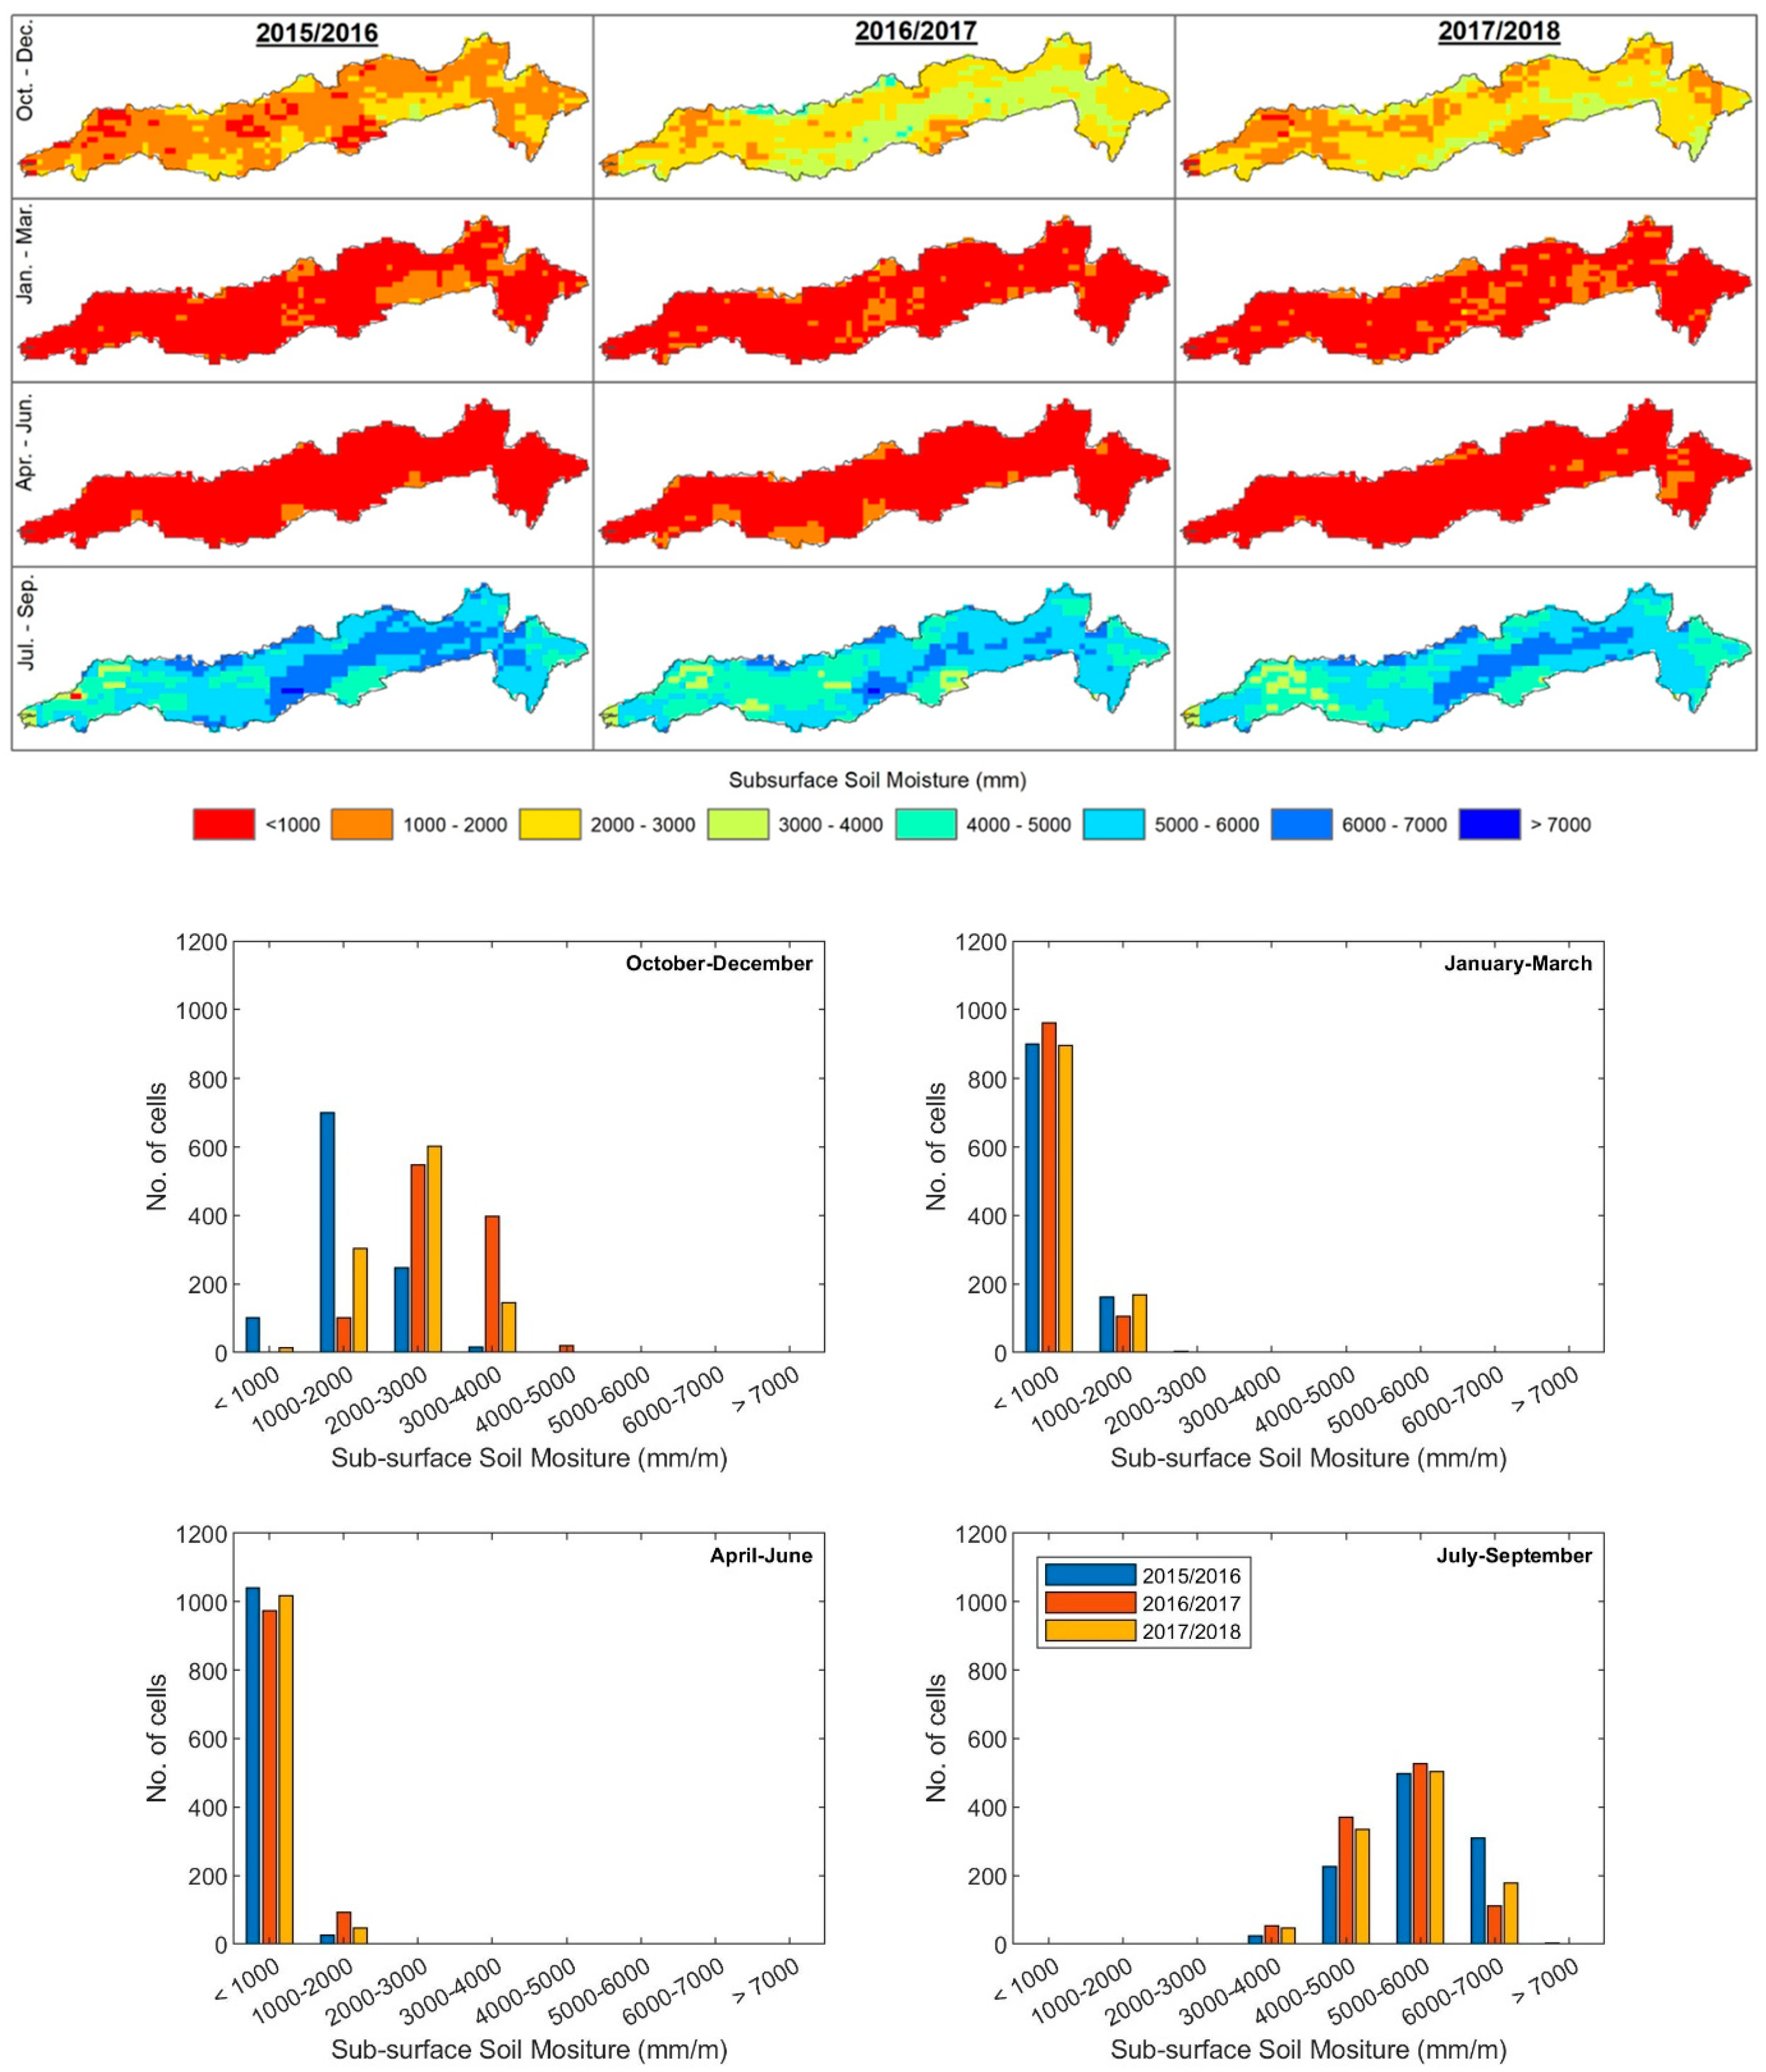
3.3. Changes in the Soil Moisture

Soil moisture is one of the critical factors affecting crop growth and productivity. Therefore, to further analyze the agricultural drought, the total soil moisture contents at the surface and sub-surface at a 10 km × 10 km spatial resolution were calculated over the basin for each quarter of the three hydrological years considered in the study.
The surface soil moisture (SM) represents the water content of a few centimeters of topsoil, which describes the wetness or dryness of the topsoil layer. Figure 8 shows that the cumulative surface soil moisture is minimal (<200 mm) during the dry period (January–March and April–June). The post-monsoon periods (October to December) of 2015 show the lowest surface soil moisture. According to the SPI-3 and SPI-6 analysis, the rainfall conditions in the preceding period were ‘near-normal’ but with the negative SPI values. This implies that even near-normal conditions (with a negative SPI) from the monsoon period in 2015 triggered a low soil moisture from October to December 2015. Following the monsoon period, the soil becomes dryer due to the limited rainfall, drainage and seepage, and evapotranspiration. The April-June period captures the start of the monsoon season, causing a slight increase in the soil moisture. The weakening of the monsoon precipitation is seen in the spatial distribution of the soil moisture from July to September of 2016/2017 and 2017/2018, where most of the land area shows less than 700 mm total water content in the topsoil layer (Figure 8). During the same period of 2015/2016, most of the basin area (~80% of the area) was in a very wet condition with more than 700 mm of the surface soil moisture content. The effects of the weakened monsoon of 2016/2017 can be seen in the post-monsoon months of October–December 2017/2018, which shows a lower soil moisture than in the same period in 2016/2017.
The sub-surface soil moisture (SSM) represents the water content of the plant root zone (up to ~1 m soil depth). In this analysis, the sub-surface soil moisture content shows a similar spatial distribution as the surface soil moisture (Figure 9). However, the values during the dry months (January to March and April to June) are almost similar (<1000 mm), whereas the surface soil moisture was almost double from April to June, compared to January to March (Figure 8). The possible reason could be the starting of the monsoon rainfall in mid of June, which may have wetted the top-soil layer but not reached deeper layers yet. Similar to the SPI and the surface soil moisture content, the sub-surface soil moisture shows a considerable deficit from October to December in 2015, than the other two years, indicating more drought. The sub-surface soil moisture content for the monsoon period in 2017 is slightly lower than in 2016. Similar to the surface soil moisture content, this trend continues during the dryer post-monsoon period (October–December) of the next hydrological year (Figure 8). The weakened monsoon of 2017/2018 also resulted in a slightly lower sub-surface soil moisture than in 2015/2016.

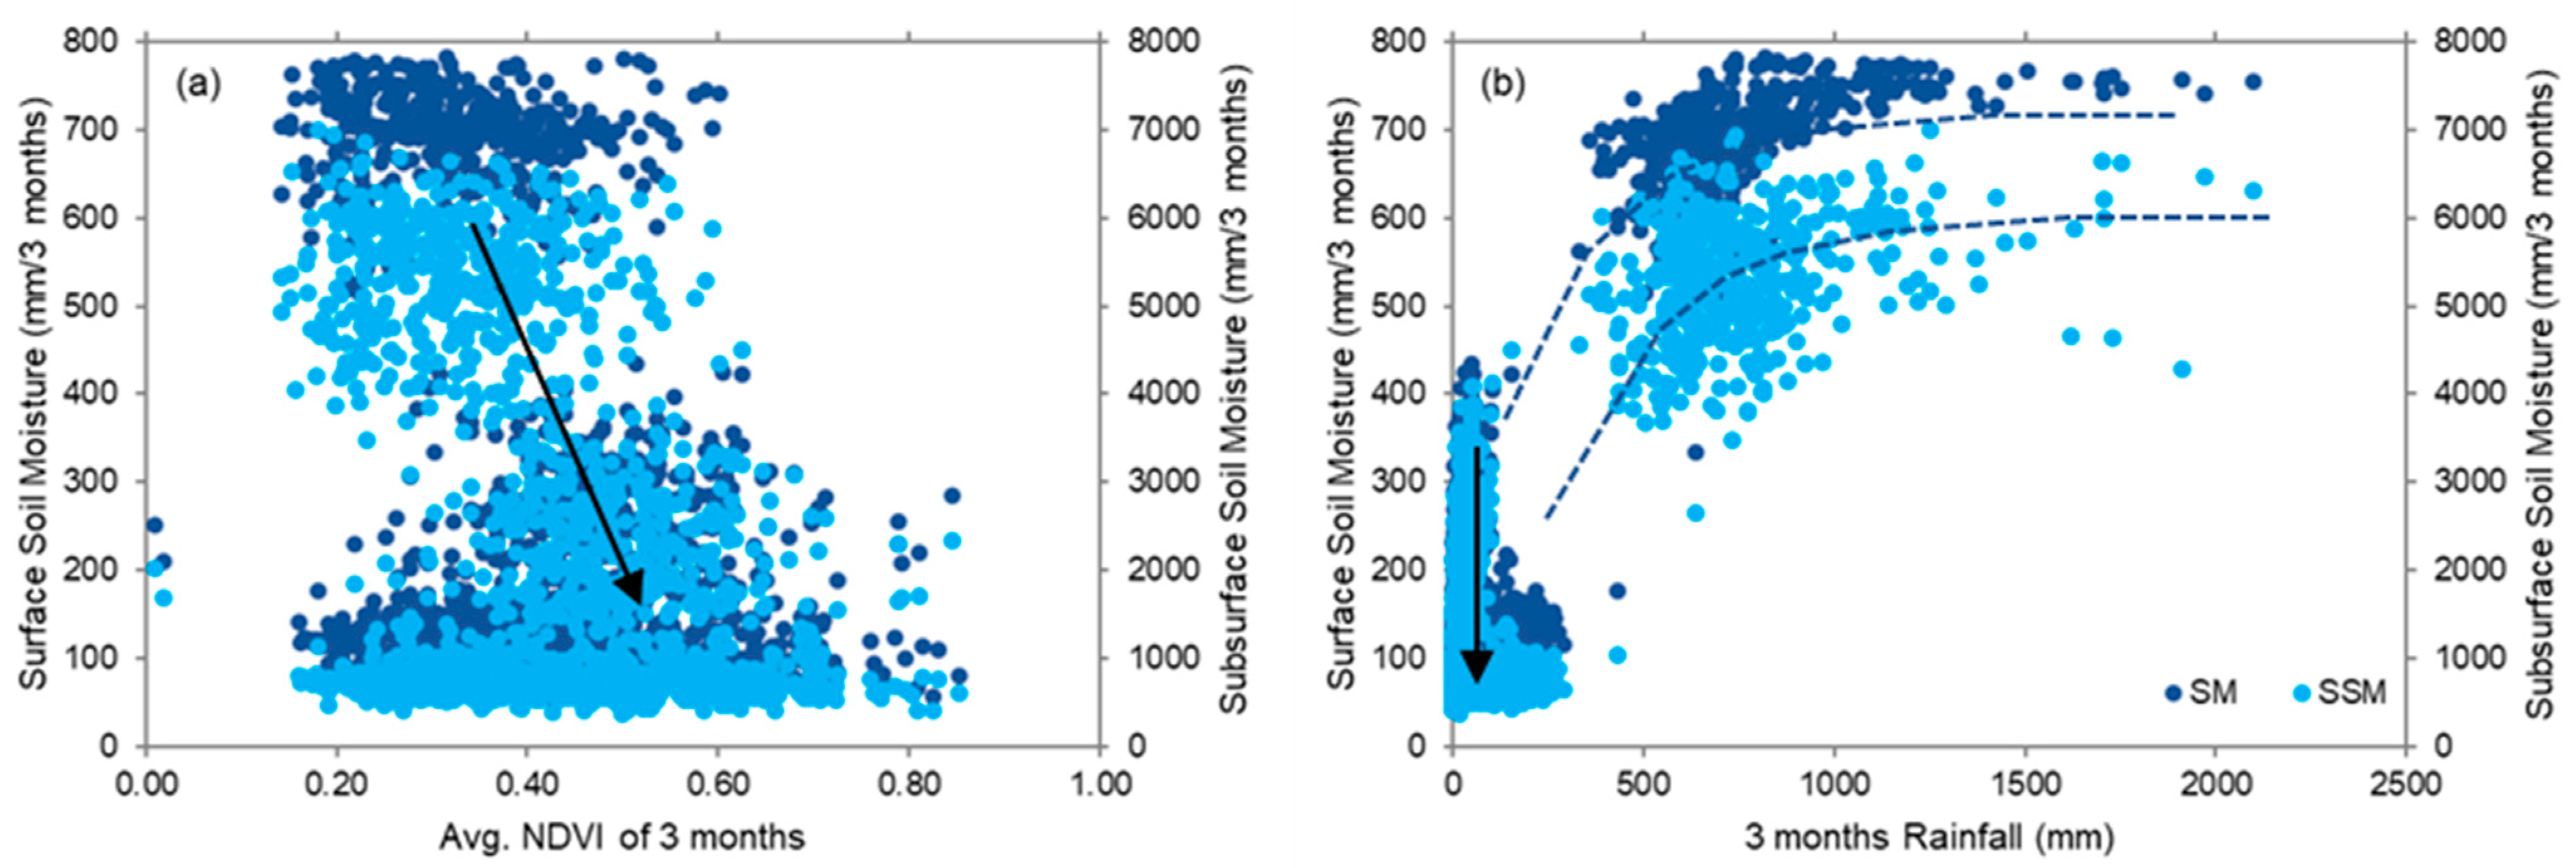
3.4. Relationship between the Rainfall, the NDVI, and the Soil Moisture

Since rainfall affects the soil moisture and plant growth, and vegetation health is related to the available water in the root zone, it is expected that there are relationships between the rainfall, the NDVI, and the soil moisture. Therefore, the correlations between the NDVI and the rainfall and the two soil moisture contents were analyzed over the basin, considering each grid cell (at 0.25° resolution), on a quarterly basis. Here, we analyzed the total soil moisture vs the average NDVI and the total rainfall for each period considered. Our results show that as a general trend with a large band with a higher soil moisture (>500 and 5000 mm for SM and SSM, respectively) corresponds to a lower NDVI (0.2–0.5), whereas a lower soil moisture (<300 and 3000 mm) corresponds to a higher NDVI (0.4–0.7) (Figure 10a). During the monsoon period, the soil moisture is high and marks the initiation of the growing season (high soil moisture, low NDVI). In the post-monsoon season, the vegetation further develops while the soil moisture decreases. Hence, the NDVI increases while the soil moisture gets lower (as indicated by the arrow in Figure 10a).
The relationship between the soil moisture and the rainfall shows a logarithmic shape (Figure 10b) as the soil moisture increases with the increasing rainfall but approaches a maximum. The cluster of points next to the y-axis indicates that the soil moisture can be high during low or no rainfall. Following the monsoon, the rainfall is nihil, but soils are still wet and gradually dry due to drainage, seepage, and evapotranspiration (indicated by the arrow in Figure 10b). In addition, the soil moisture content can be high in the dry period because of irrigation.

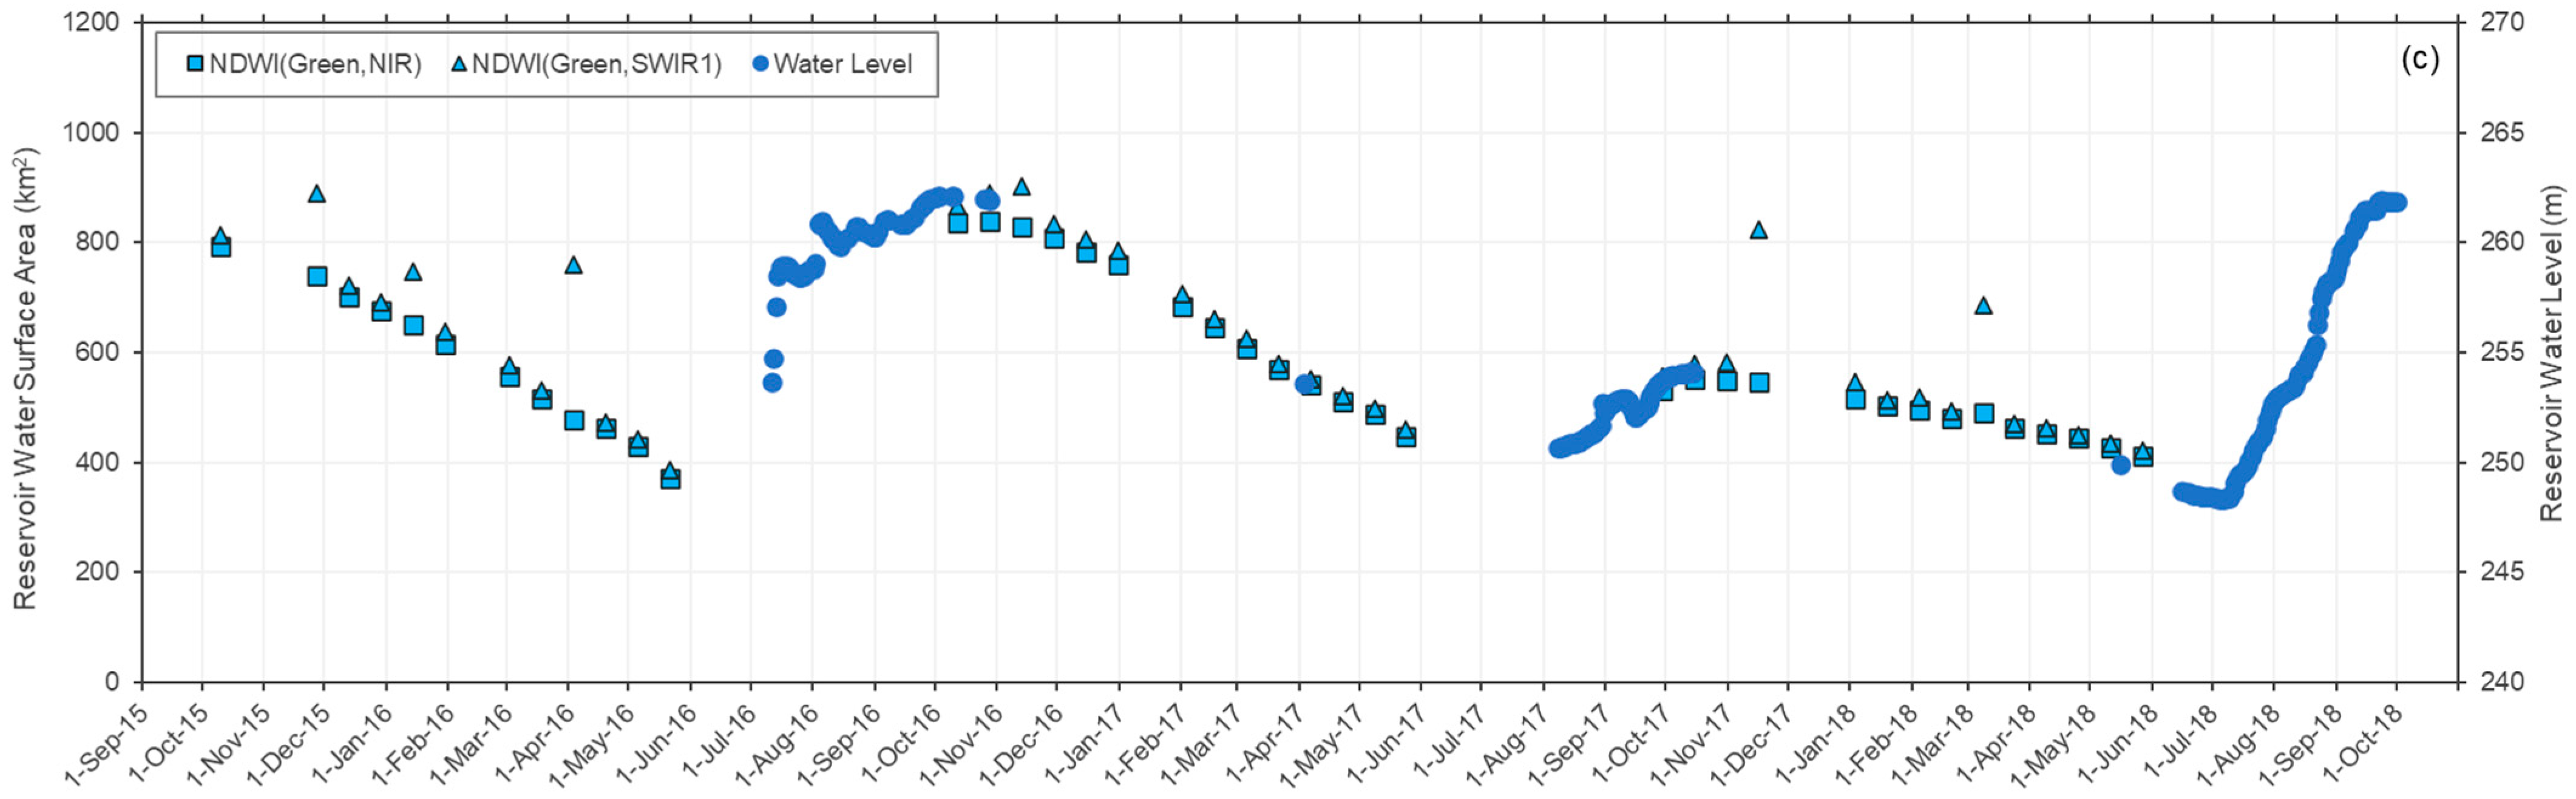
3.5. Reservoir Storage

We calculated the three reservoirs’ total surface water area and analyzed their changes over three years (Figure 11). The surface areas calculated from both NDWI analyses (NDWI(Green, NIR) and NDWI(Green, SWIR1)) do not show significant differences in the three reservoirs, except for a few cases in the Bargi and Indira Sagar dams. Therefore, both NDWI estimations can be used for the water body detection in the Narmada basin, although the NDWI(Green, NIR) seems more stable than the NDWI(Green, SWIR1). The reservoirs generally were at their highest level from late September to early October, and the surface areas narrowed towards the end of the dry period (the beginning of the monsoon). The dates belonging to the largest and smallest reservoir areas vary, but the months are always September and June, respectively. The area reductions from October to June are approximately 50%, 85%, and 50% in the Bargi, Tawa, and Indira Sagar dams, respectively.
The pattern in the reservoir surface area for 2015/16 and 2016/17 is similar for all reservoirs. At the end of the monsoon of 2017, the surface area recovered to the original value for the Bargi. However, for the Tawa and especially the Indira Sagar, the surface areas remained substantially smaller than the maximum value calculated in 2015. For the Tawa and the Indira Sagar, these deficits were about 20% and 30%, respectively. This reduction in water surface area might be an effect of the weakened monsoon in 2017/18, which is most pronounced in the middle part of the basin (see Figure 6) just upstream of the Indira Sagar. The minimum levels remain similar over the years to maintain the reservoir’s live storage and reduce the risk of a lack of water for the next cropping seasons. It can be assumed that the Tawa and the Indira Sagar operations might have changed. The calculated water areas followed the same pattern as the observed water level and the reservoir live storage (Figure 11 and Figure A2, respectively) in the three reservoirs. Therefore, the remote-sensing-based images can be effectively utilized for the water area estimated in the Narmada basin. Due to the lack of cloud-free images during the monsoon seasons and the lack of recorded water levels in the non-monsoon periods, the two data sources are complementary. Even though a water storage reduction is directly linked to monsoon rainfall, the daily storage changes depend on other hydro-meteorological factors (e.g., temperature and evapotranspiration) and human factors (e.g., irrigation, water supply, and dam operation).

4. Conclusions

This study aimed to use freely available local and global data to monitor the agricultural drought in the Narmada River Basin, where more than 50% of the land area is utilized for agriculture. The long-term rainfall and recently weakened monsoons in 2017 and 2018 were assessed using freely available local data, remote-sensing-based global data, and different drought indicators.
Rainfall over the Narmada River Basin shows a slight decreasing trend and an increase in the number of dry days over the last 30-year period (1989–2018). The simplified rainfall index varied over the basin and showed moderate and severe drought in 2016/2017 and severe drought in 2017/2018, particularly in the middle part of the basin. Prolonged droughts in the two consecutive years do not show a clear difference in the crop health in terms of the NDVI. However, the analysis revealed a slight decrease in the NDVI during the weakened monsoon of 2017/2018. The NDVI is not a reasonable indicator for agricultural drought assessment in places where irrigated agriculture is dominant. The surface and sub-surface soil moisture follow seasonal trends, with the lowest soil moisture values in January-March and the highest values during the monsoon. The effects of the weakened monsoon in 2017 can be observed in the lower soil moisture of the subsequent quarters. The water area detection via the NDWI analysis follows the actual water level changes in three reservoirs. The Tawa and Indira Sagar reservoirs were affected mostly by the prolonged drought in the middle part of the Narmada basin.
Although the weakened monsoons can be identified as meteorological droughts, it is hard to say whether it has led to agricultural droughts or even hydrological or socio-economical droughts. Even though the precipitation during the monsoon (in 2017 and 2018) was less, there was still a substantial amount of rainfall. At the same time, it is also not clear that the slight decline in the average annual rainfall is a serious problem for the socio-economic sector. The problems are more likely caused by the local deficiencies in rainfall. Since an already established irrigation system is functioning in the basin, the effects of the meteorological droughts may be compensated by the irrigation from the groundwater or reservoirs.
This study shows that freely available data can be successfully used to monitor drought indices, explain their behavior, and recognize the spatial and temporal extents. However, it is difficult to conclude that an agricultural drought occurred in 2017 and 2018 because large parts of the Narmada basin are irrigated. Information on irrigated and rain-fed areas is lacking for this study but would be required to assess an agricultural drought in more detail. Nevertheless, the monitoring indices (SPI, RIs, vegetation health, soil moisture, and storage) can be helpful to water managers to obtain an indication of the near real-time status of a basin. Such near-real-time information (i.e., status of water availability, precipitation) is useful when communicating to stakeholders in a meaningful manner to move forward with the proper management of water resources and timely decision-making.

Author Contributions

Conceptualization, J.S. and D.A.; methodology, J.S. and D.A.; formal analysis and data curation, J.S.; writing—original draft preparation, J.S.; writing—review and editing, D.A., A.N. and J.B.; visualization, J.S.; supervision, D.A. All authors have read and agreed to the published version of the manuscript.

Funding

This research received no external funding.

Institutional Review Board Statement

Not applicable.

Informed Consent Statement

Not applicable.

Data Availability Statement

Data used in this research is available on request.

Conflicts of Interest

The authors declare no conflict of interest.

Appendix A

Figure A1. Average daily maximum and minimum temperatures over the Narmada River Basin.
Sustainability 14 13050 g0a1
Figure A2. Calculated reservoir surface water areas and the recorded live capacity of three reservoirs. Rani Avanti Bai Sagar (top), Tawa (middle), and Indira Sagar (bottom).
Sustainability 14 13050 g0a2aSustainability 14 13050 g0a2b

References

  1. Dutta, R. Drought Monitoring in the Dry Zone of Myanmar using MODIS Derived NDVI and Satellite Derived CHIRPS Precipitation Data. Sustain. Agric. Res. 2018, 7, 46. [Google Scholar] [CrossRef] [Green Version]
  2. Wilhite, D.A. Drought as a Natural Hazard: Concepts and Definitions. Drought Mitigation Center Faculty Publications. 2000. Available online: http://digitalcommons.unl.edu/droughtfacpub/69. (accessed on 4 September 2022).
  3. Mishra, A.K.; Desai, V.R.; Singh, V.P. Drought Forecasting Using a Hybrid Stochastic and Neural Network Model. J. Hydrol. Eng. 2007, 12, 626–638. [Google Scholar] [CrossRef]
  4. Mishra, A.K.; Singh, V.P. A review of drought concepts. J. Hydrol. 2010, 391, 202–216. [Google Scholar] [CrossRef]
  5. Singh, O.; Saini, D.; Bhardwaj, P. Characterization of Meteorological Drought over a Dryland Ecosystem in North Western India. Nat. Hazards 2021, 109, 785–826. [Google Scholar] [CrossRef]
  6. Zhu, Y.; Liu, Y.; Wang, W.; Singh, V.P.; Ma, X.; Yu, Z. Three dimensional characterization of meteorological and hydrological droughts and their probabilistic links. J. Hydrol. 2019, 578, 124016. [Google Scholar] [CrossRef]
  7. Alahacoon, N.; Edirisinghe, M.; Ranagalage, M. Satellite-based meteorological and agricultural drought monitoring for agricultural sustainability in Sri Lanka. Sustainability 2021, 13, 3427. [Google Scholar] [CrossRef]
  8. Arshad, S.; Morid, S.; Mobasheri, M.R.; Alikhani, M.A. Development of agricultural drought vulnerability assessment model for Kermanshah Province (Iran) using remote sensing data. Option Mediterrianeennes Ser. A Sémin. Méditerr. 2008, 12, 303–310. [Google Scholar] [CrossRef]
  9. McFeeters, S.K. The use of the Normalized Difference Water Index (NDWI) in the delineation of open water features. Int. J. Remote Sens. 1996, 17, 1425–1432. [Google Scholar] [CrossRef]
  10. Van-Rooy, M.P. A Rainfall Anomaly Index (RAI), Independent of the Time and Space. Notos 1965, 14, 43–48. [Google Scholar]
  11. Tucker, C.J. Red and Photographic Infrared Linear Combinations for Monitoring Vegetation. Remote Sens. Environ. 1979, 8, 127–150. [Google Scholar] [CrossRef] [Green Version]
  12. Kogan, F.N. Application of vegetation index and brightness temperature for drought detection. Adv. Space Res. 1995, 15, 91–100. [Google Scholar] [CrossRef]
  13. Hao, Z.; AghaKouchak, A. Multivariate Standardized Drought Index: A parametric multi-index model. Adv. Water Resour. 2013, 57, 12–18. [Google Scholar] [CrossRef] [Green Version]
  14. Hasson, S.U.; Pascale, S.; Lucarini, V.; Böhner, J. Seasonal cycle of precipitation over major river basins in South and Southeast Asia: A review of the CMIP5 climate models data for present climate and future climate projections. Atmos. Res. 2016, 180, 42–63. [Google Scholar] [CrossRef] [Green Version]
  15. Mishra, V.; Thirumalai, K.; Jain, S.; Aadhar, S. Unprecedented drought in South India and recent water scarcity. Environ. Reserch Lett. 2021, 2, 56–61. [Google Scholar] [CrossRef]
  16. Mujumdar, M.; Bhaskar, P. Droughts and floods. In Assessment of Climate Change over the Indian Region; Krishnan, R., Sanjay, J., Gnanaseelan, C., Mujumdar, M., Kulkarni, A., Eds.; Springer: Singapore, 2021; pp. 118–141. ISBN 9789811543265. [Google Scholar]
  17. Amrit, K.; Pandey, R.P.; Mishra, S.K. Assessment of meteorological drought characteristics over Central India. Sustain. Water Resour. Manag. 2018, 4, 999–1010. [Google Scholar] [CrossRef]
  18. Udmale, P.; Ichikawa, Y.; Manandhar, S.; Ishidaira, H.; Kiem, A.S. Farmers’ perception of drought impacts, local adaptation and administrative mitigation measures in Maharashtra State, India. Int. J. Disaster Risk Reduct. 2014, 10, 250–269. [Google Scholar] [CrossRef] [Green Version]
  19. Kumar, K.N.; Rajeevan, M.; Pai, D.S.; Srivastava, A.K.; Preethi, B. On the observed variability of monsoon droughts over India. Weather Clim. Extrem. 2013, 1, 42–50. [Google Scholar] [CrossRef] [Green Version]
  20. Department of Agriculture and Farmers Welfare Rainfed Farming System. Available online: https://agricoop.nic.in/en/divisiontype/rainfed-farming-system (accessed on 2 December 2021).
  21. Pandey, R.P.; Pandey, A.; Galkate, R.V.; Byun, H.R.; Mal, B.C. Integrating Hydro-Meteorological and Physiographic Factors for Assessment of Vulnerability to Drought. Water Resour. Manag. 2010, 24, 4199–4217. [Google Scholar] [CrossRef]
  22. Shah, D.; Mishra, V. Drought Onset and Termination in India. J. Geophys. Res. Atmos. 2020, 125, e2020JD032871. [Google Scholar] [CrossRef]
  23. Bhardwaj, K.; Shah, D.; Aadhar, S.; Mishra, V. Propagation of Meteorological to Hydrological Droughts in India. J. Geophys. Res. Atmos. 2020, 125, e2020JD033455. [Google Scholar] [CrossRef]
  24. Vishwakarma, A.; Goswami, A. The dynamics of meteorological droughts over a semi-arid terrain in western India: A last five decadal hydro-climatic evaluation. Groundw. Sustain. Dev. 2022, 16, 100703. [Google Scholar] [CrossRef]
  25. Shah, D.; Mishra, V. Integrated Drought Index (IDI) for Drought Monitoring and Assessment in India. Water Resour. Res. 2020, 56, e2019WR026284. [Google Scholar] [CrossRef]
  26. Swain, S.; Mishra, S.K.; Pandey, A. A detailed assessment of meteorological drought characteristics using simplified rainfall index over Narmada River Basin, India. Environ. Earth Sci. 2021, 80, 221. [Google Scholar] [CrossRef]
  27. FAO. The Digital Soil Map of the World (Version 3.6); Land and Water Development Devision; FAO: Rome, Italy, 2003. [Google Scholar]
  28. Pandey, B.K.; Khare, D.; Kawasaki, A.; Mishra, P.K. Climate Change Impact Assessment on Blue and Green Water by Coupling of Representative CMIP5 Climate Models with Physical Based Hydrological Model. Water Resour. Manag. 2019, 33, 141–158. [Google Scholar] [CrossRef]
  29. FAO. World Reference Base for Soil Resources 2014: International Soil Classification System for Naming Soils and Creating Legends for Soil Maps; FAO: Rome, Italy, 2015. [Google Scholar]
  30. Roy, P.S.; Meiyappan, P.; Joshi, P.K.; Kale, M.P.; Srivastav, V.K.; Srivasatava, S.K.; Behera, M.D.; Roy, A.; Sharma, Y.; Ramachandran, R.M.; et al. Decadal Land Use and Land Cover Classifications Across India, 1985, 1995, 2005; ORNL DAAC: Oak Ridge, TN, USA, 2016. [Google Scholar] [CrossRef]
  31. Pai, D.S.; Sridhar, L.; Rajeevan, M.; Sreejith, O.P.; Satbhai, N.S.; Mukhopadhyay, B. Development of a new high spatial resolution (0.25° × 0.25°) long period (1901–2010) daily gridded rainfall data set over India and its comparison with existing data sets over the region. Mausam 2014, 65, 1–18. [Google Scholar] [CrossRef]
  32. Srivastava, A.K.; Rajeevan, M.; Kshirsagar, S.R. Development of a high resolution daily gridded temperature data set (1969–2005) for the Indian region. Atmos. Sci. Lett. 2009, 10, 249–254. [Google Scholar] [CrossRef]
  33. Didan, K.; Munoz, A.B.; Solano, R.; Huete, A. MODIS Vegetation Index User ’s Guide (MOD13 Series); University of Arizona: Tucson, AZ, USA, 2015. [Google Scholar]
  34. Didan, K. MOD13Q1 MODIS/Terra Vegetation Indices 16-Day L3 Global 250m SIN Grid V006 [NDVI]. Available online: https://lpdaac.usgs.gov/products/mod13q1v006/ (accessed on 10 August 2021).
  35. Mladenova, I.E.; Bolten, J.D.; Crow, W.; Sazib, N.; Reynolds, C. Agricultural Drought Monitoring via the Assimilation of SMAP Soil Moisture Retrievals Into a Global Soil Water Balance Model. Front. Big Data 2020, 3, 10. [Google Scholar] [CrossRef] [Green Version]
  36. Mladenova, I.E.; Bolten, J.D.; Crow, W.T.; Sazib, N.; Cosh, M.H.; Tucker, C.J.; Reynolds, C. Evaluating the Operational Application of SMAP for Global Agricultural Drought Monitoring. IEEE J. Sel. Top. Appl. Earth Obs. Remote Sens. 2019, 12, 3387–3397. [Google Scholar] [CrossRef]
  37. Sazib, N.; Mladenova, I.; Bolten, J. Leveraging the google earth engine for drought assessment using global soil moisture data. Remote Sens. 2018, 10, 1265. [Google Scholar] [CrossRef] [Green Version]
  38. Entekhabi, D.; Njoku, E.G.; Neill, P.E.O.; Kellogg, K.H.; Crow, W.T.; Edelstein, W.N.; Entin, J.K.; Goodman, S.D.; Jackson, T.J.; Johnson, J.; et al. The Soil Moisture Active Passive (SMAP) Mission. Proc. IEEE 2010, 98, 704–716. [Google Scholar] [CrossRef]
  39. McKee, T.B.; Dosken, N.J.; Kleist, J. The relationship of drought frequency and duration to time scales. In Proceedings of the Eighth Conference on Applied Climatology, Anaheim, CA, USA, 17–22 January 1993; pp. 1–6. [Google Scholar]
  40. McKee, T.B.; Doesken, N.J.; Kleist, J. Drought monitoring with multiple time scales. In Proceedings of the 9th Conference on Applied Climatology, Dallas, TX, USA, 15–20 January 1995; pp. 233–236. [Google Scholar]
  41. Gandhi, G.M.; Parthiban, S.; Thummalu, N.; Christy, A. Ndvi: Vegetation Change Detection Using Remote Sensing and Gis—A Case Study of Vellore District. Procedia Comput. Sci. 2015, 57, 1199–1210. [Google Scholar] [CrossRef] [Green Version]
  42. Souza, A.G.S.S.; Ribeiro Neto, A.; Souza, L.L. de Soil moisture-based index for agricultural drought assessment: SMADI application in Pernambuco State-Brazil. Remote Sens. Environ. 2021, 252, 112124. [Google Scholar] [CrossRef]
  43. Mananze, S.; Pôças, I. Agricultural drought monitoring based on soil moisture derived from the optical trapezoid model in Mozambique. J. Appl. Remote Sens. 2019, 13, 024519. [Google Scholar] [CrossRef]
  44. Zeri, M.; Williams, K.; Cunha, A.P.M.A.; Cunha-Zeri, G.; Vianna, M.S.; Blyth, E.M.; Marthews, T.R.; Hayman, G.D.; Costa, J.M.; Marengo, J.A.; et al. Importance of including soil moisture in drought monitoring over the Brazilian semiarid region: An evaluation using the JULES model, in situ observations, and remote sensing. Clim. Resil. Sustain. 2021, 1, e7. [Google Scholar] [CrossRef]
  45. Xu, H. Modification of normalised difference water index (NDWI) to enhance open water features in remotely sensed imagery. Int. J. Remote Sens. 2006, 27, 3025–3033. [Google Scholar] [CrossRef]
  46. Mbatha, N.; Xulu, S. Time series analysis of MODIS-Derived NDVI for the Hluhluwe-Imfolozi Park, South Africa: Impact of recent intense drought. Climate 2018, 6, 95. [Google Scholar] [CrossRef] [Green Version]
  47. Zhi, Z.; Yin, H.; Lu, N.; Zhang, X.; Yu, K.; Guo, X.; Qi, H. Spatial-Temporal Changes of Vegetation Restoration in Yan’an Based on MODIS NDVI and Landsat NDVI. In Proceedings of the 2019 IEEE International Conference on Signal, Information and Data Processing (ICSIDP), Chongqing, China, 11–13 December 2019; pp. 2–6. [Google Scholar] [CrossRef]
  48. CWC; NRSC. Narmada Basin; Central Water Commission: New Delhi, India, 2014. [Google Scholar]
Figure 1. The Narmada River Basin in India, (a) topography, (b) land use, (c) average annual rainfall (1989–2018) of IMD grids, and (d) linear trend of the annual rainfall over the same period. The numbers of land use units present the land use classification: 1: deciduous broadleaf forest, 2: cropland, 3: built-up land, 4: mixed forest, 5: shrubland, 6: barren land, 7: fallow land, 8: wasteland, 9: water bodies, 10: plantations, 14: grassland, and 16: deciduous needleleaf forest [30].
Sustainability 14 13050 g001
Figure 2. Annual rainfall (a) and the number of dry days (having <1 mm rainfall, (b)) over the Narmada River Basin. The red line in the (a) graph is the long-term average annual rainfall over the basin. The black dashed lines indicate the linear trend. This analysis is based on the daily rainfall data of 134 grids covering the basin.
Sustainability 14 13050 g002
Figure 3. The box plot of the monthly rainfall over the basin for the last 30 years. The boxes are limited to the 25th, and 75th percentiles of the sample, and the red line shows the median value. Whiskers are extended to the 1.5 times inter-quartile range to the top and bottom of the boxes. The red ‘+’s show the values beyond the whiskers.
Sustainability 14 13050 g003
Figure 4. The three selected reservoirs located in the basin and their characteristics. HP, WS, and IR denote hydropower, water supply, and irrigation, respectively.
Sustainability 14 13050 g004
Figure 5. SPI 3 (a), 6 (b), and 12 (c) variations from 1988/1989 to 2017/2018 in the Narmada River Basin.
Sustainability 14 13050 g005
Figure 6. Simplified rainfall index (RIs) for the annual scale.
Sustainability 14 13050 g006
Figure 7. Spatial changes in the NDVI for every three months (top) and the number of cells falling in each NDVI class (bottom) in three hydrological years (2015/2016 to 2017/2018).
Sustainability 14 13050 g007aSustainability 14 13050 g007b
Figure 8. Total surface soil moisture at an every three-month scale (top) and the number of cells that fall into each soil moisture class (bottom) in three hydrological years (2015/2016 to 2017/2018).
Sustainability 14 13050 g008
Figure 9. Total sub-surface soil moisture at an every three-month scale (top) and the number of cells that fall into each soil moisture class (bottom) in three hydrological years (2015/2016 to 2017/2018).
Sustainability 14 13050 g009
Figure 10. Correlation between the soil moisture content vs the NDVI (a) and vs the rainfall (b) for all quarters of 2015–2018 for each grid cell (in total 134 cells) covering the Narmada basin. SM means surface soil moisture, and SSM means sub-surface soil moisture.
Sustainability 14 13050 g010
Figure 11. Estimated surface water area and the recorded water level changes of the three reservoirs (a) Rani Avanti Bai Sagar (Bargi) Dam, (b) Tawa Dam, and (c) Indira Sagar Dam, from October 2015 to September 2018.
Sustainability 14 13050 g011aSustainability 14 13050 g011b
Table 1. Dry/wet severity categorization based on the SPI [40] and RIss [26].
SPIRIsCategory
SPI > 2RIs > 2Extremely wet
1.5 < SPI ≤ 21.5 < RIs ≤ 2Severely wet
1 < SPI ≤ 1.51 < RIs ≤ 1.5Moderately wet
1 < SPI ≤ −1−1 < RIs ≤ 1Near Normal
−1.5 < SPI ≤ −1−1.5 < RIs ≤ −1Moderate drought
−2 < SPI ≤ −1.5−2 < RIs ≤ −1.5Severe drought
SPI ≤ −2RIs ≤ −2Extreme drought
Publisher’s Note: MDPI stays neutral with regard to jurisdictional claims in published maps and institutional affiliations.

