Article

Comparative Study and Optimal Design of Subsynchronous Damping Controller in Doubly Fed Induction Generator

1
State Grid Inner Mongolia Eastern Electric Power Co., Ltd., Hohhot 010010, China
2
College of Electrical Engineering, Sichuan University, Chengdu 610065, China
*
Author to whom correspondence should be addressed.
Sustainability 2022, 14(20), 13095; https://doi.org/10.3390/su142013095
Submission received: 12 September 2022 / Revised: 9 October 2022 / Accepted: 10 October 2022 / Published: 13 October 2022

Abstract

:
The subsynchronous damping controller (SSDC) has been widely recognized for its excellent performance and low cost in subsynchronous oscillation (SSO) mitigation for the doubly fed induction generator (DFIG)-based wind power system. However, the existing SSDCs are various and lack a systematic comparison. To fill this gap, the structures and parameter design methods of common SSDCs are sorted and compared in this paper. It is found that the rotor-current-based method performs best in terms of dynamic performance and robustness, as it can mitigate SSO for all working conditions in the test, while the feasibility range of other methods is much smaller. Therefore, the influence of different parameters in a rotor-current-based SSDC on SSO mitigation is further researched, leading to a guideline for parameter selection. More importantly, to address the challenge of time-varying oscillation frequency, an adaptive frequency selection method is proposed based on the eigensystem realization algorithm, which can accurately track the SSO frequency within 5~45 Hz. The results of the root locus analysis and hardware-in-the-loop experiment demonstrate that the improved rotor-current-based SSDC performs better than other existing methods, and it does not affect the normal operation of the DFIG.

1. Introduction

In recent years, the increasing penetration of wind generation has raised the risk of subsynchronous oscillation (SSO) [1,2,3,4,5,6]. In real-life wind farms, SSO has been observed in many places around the world, such as the electric reliability council of Texas (ERCOT), USA and Hami, China [7,8,9,10,11]. Once SSO occurs, power systems will suffer from severe damage and huge economic losses. Therefore, researchers have put a lot of effort into finding cost-effective ways to mitigate SSO events fast and accurately.
At present, SSO mitigation strategies can mainly be divided into two types: grid-side strategies and DFIG-side strategies. The former can be realized by installing flexible AC transmission systems (FACTS) or special SSO mitigation devices [12]. However, the installation of compensation devices with a large capacity is relatively expensive. In contrast, the DFIG-side strategies only need some adjustments to the structures and parameters of DFIGs without installing extra devices. Therefore, this type of method has the advantages of a low cost and an easy implementation, making it more suitable for practical engineering applications [13].
According to the literature review, the mitigation strategies on the DFIG side can be further divided into three types: The first type is to adjust the converter parameters of the DFIG, which has been proved to be a feasible method via theoretical derivation and simulation [14]. Although it can be easily realized, it will also deteriorate the dynamic and fault ride-through performances of DFIGs simultaneously. The second type is to replace the PI controller with an advanced nonlinear controller, such as sliding mode control, H-∞, partial or full feedback linearization-based controllers [15,16,17]. However, these methods are limited by complex control structures and large computational burdens in practical applications. In addition, they also depend on the accurate modelling of wind generators and are highly sensitive to uncertainties [13]. The third type is to add a subsynchronous damping controller to the converter controller of DFIGs. The linear control structure is commonly adopted in this type of method, thus making it easy to be implemented and used in practical engineering. To further explain its principle, three typical SSDCs are introduced here. (1) In [18], the root mean square (RMS) of the compensation capacitor voltage VC is used as the input control signal of the SSDC, and it is embedded into the grid-side converter (GSC) of DFIGs. The result shows that the VC-based method performs well. (2) In [19], the rotor speed ωr is embedded in both the d-axis and q-axis loops of the rotor-side converter (RSC) of DFIGs. Then, the parameters of this controller are optimized by the improved particle swarm optimization algorithm. As a result, SSO can be mitigated in a variety of working conditions. (3) In [13], the rotor currents idr and iqr are used as the input control signal, and the RSC-side SSDC is designed for an actual system that has occurred SSO. The performance of the SSDC is verified by the hardware-in-the-loop experiment and the impedance model. According to the results in the paper, this method performs well and does not affect the steady-state operation, dynamic performance, or low voltage ride-through ability of DFIGs. The three aforementioned SSDCs all perform satisfactorily in theory, but their control structures are diverse and their performances have not been compared, which causes difficulties in selection in practical applications.
In this paper, a systematic comparison of three typical SSDCs is conducted. The results indicate that the SSDC based on the rotor currents idr and iqr shows the best mitigation performance. However, how to select the parameters of the rotor-current-based SSDC is unrevealed. Therefore, this paper investigates its mitigation mechanism and makes further improvements: (1) An optimal design scheme of controller parameters is proposed by studying the mitigation mechanism of the SSDC and the influence of controller parameters on the mitigation performance. (2) Furthermore, an adaptive oscillation frequency selection method based on the eigensystem realization algorithm (ERA) is proposed to avoid the offline determination of band-pass filter (BPF) parameters by historical experience or data. (3) The performance of the improved SSDC is verified by the root locus method and hardware-in-the-loop simulation. Through a comparison with the existing method, the superiority of the improved method is verified.

2. Comparison of Existing SSDCs

To evaluate the performances of the SSDCs, a wind farm connected to a series compensation system is considered in this paper, as shown in Figure 1. The system parameters are derived from the ERCOT wind power system [20]. The parameters of DFIGs, transformers, and transmission lines are given in Table A1 in the Appendix A. When the wind speed is 9 m/s and the compensation level of the equivalent model increases to 30%, SSO will occur in the system.
The structures and embedding points of the three SSDCs mentioned previously are shown in Figure 2. SSDC1 uses the RMS of the compensation capacitor voltage VC as the input control signal and is embedded into the GSC, and its control parameters are selected according to the operating condition. SSDC2 uses the rotor speed ωr as the input control signal. After a second-order filter, the SSO component is selected; then, the SSO signal is embedded into the RSC after amplitude gain and phase compensation. SSDC3 extracts the SSO component in the rotor currents idr and iqr by the second-order BPF, compensates the phase and amplitude through a PID controller, and then embeds the RSC.
In this paper, three SSDCs are comprehensively compared in terms of: (1) the mitigation performance and robustness of the SSDCs, (2) the application range of the SSDCs using one set of parameters, and (3) the accessibility of input control signals. It is worth mentioning that the parameters of three SSDCs are designed by the methods mentioned in their proposed literature.

2.1. Mitigation Performance and Robustness

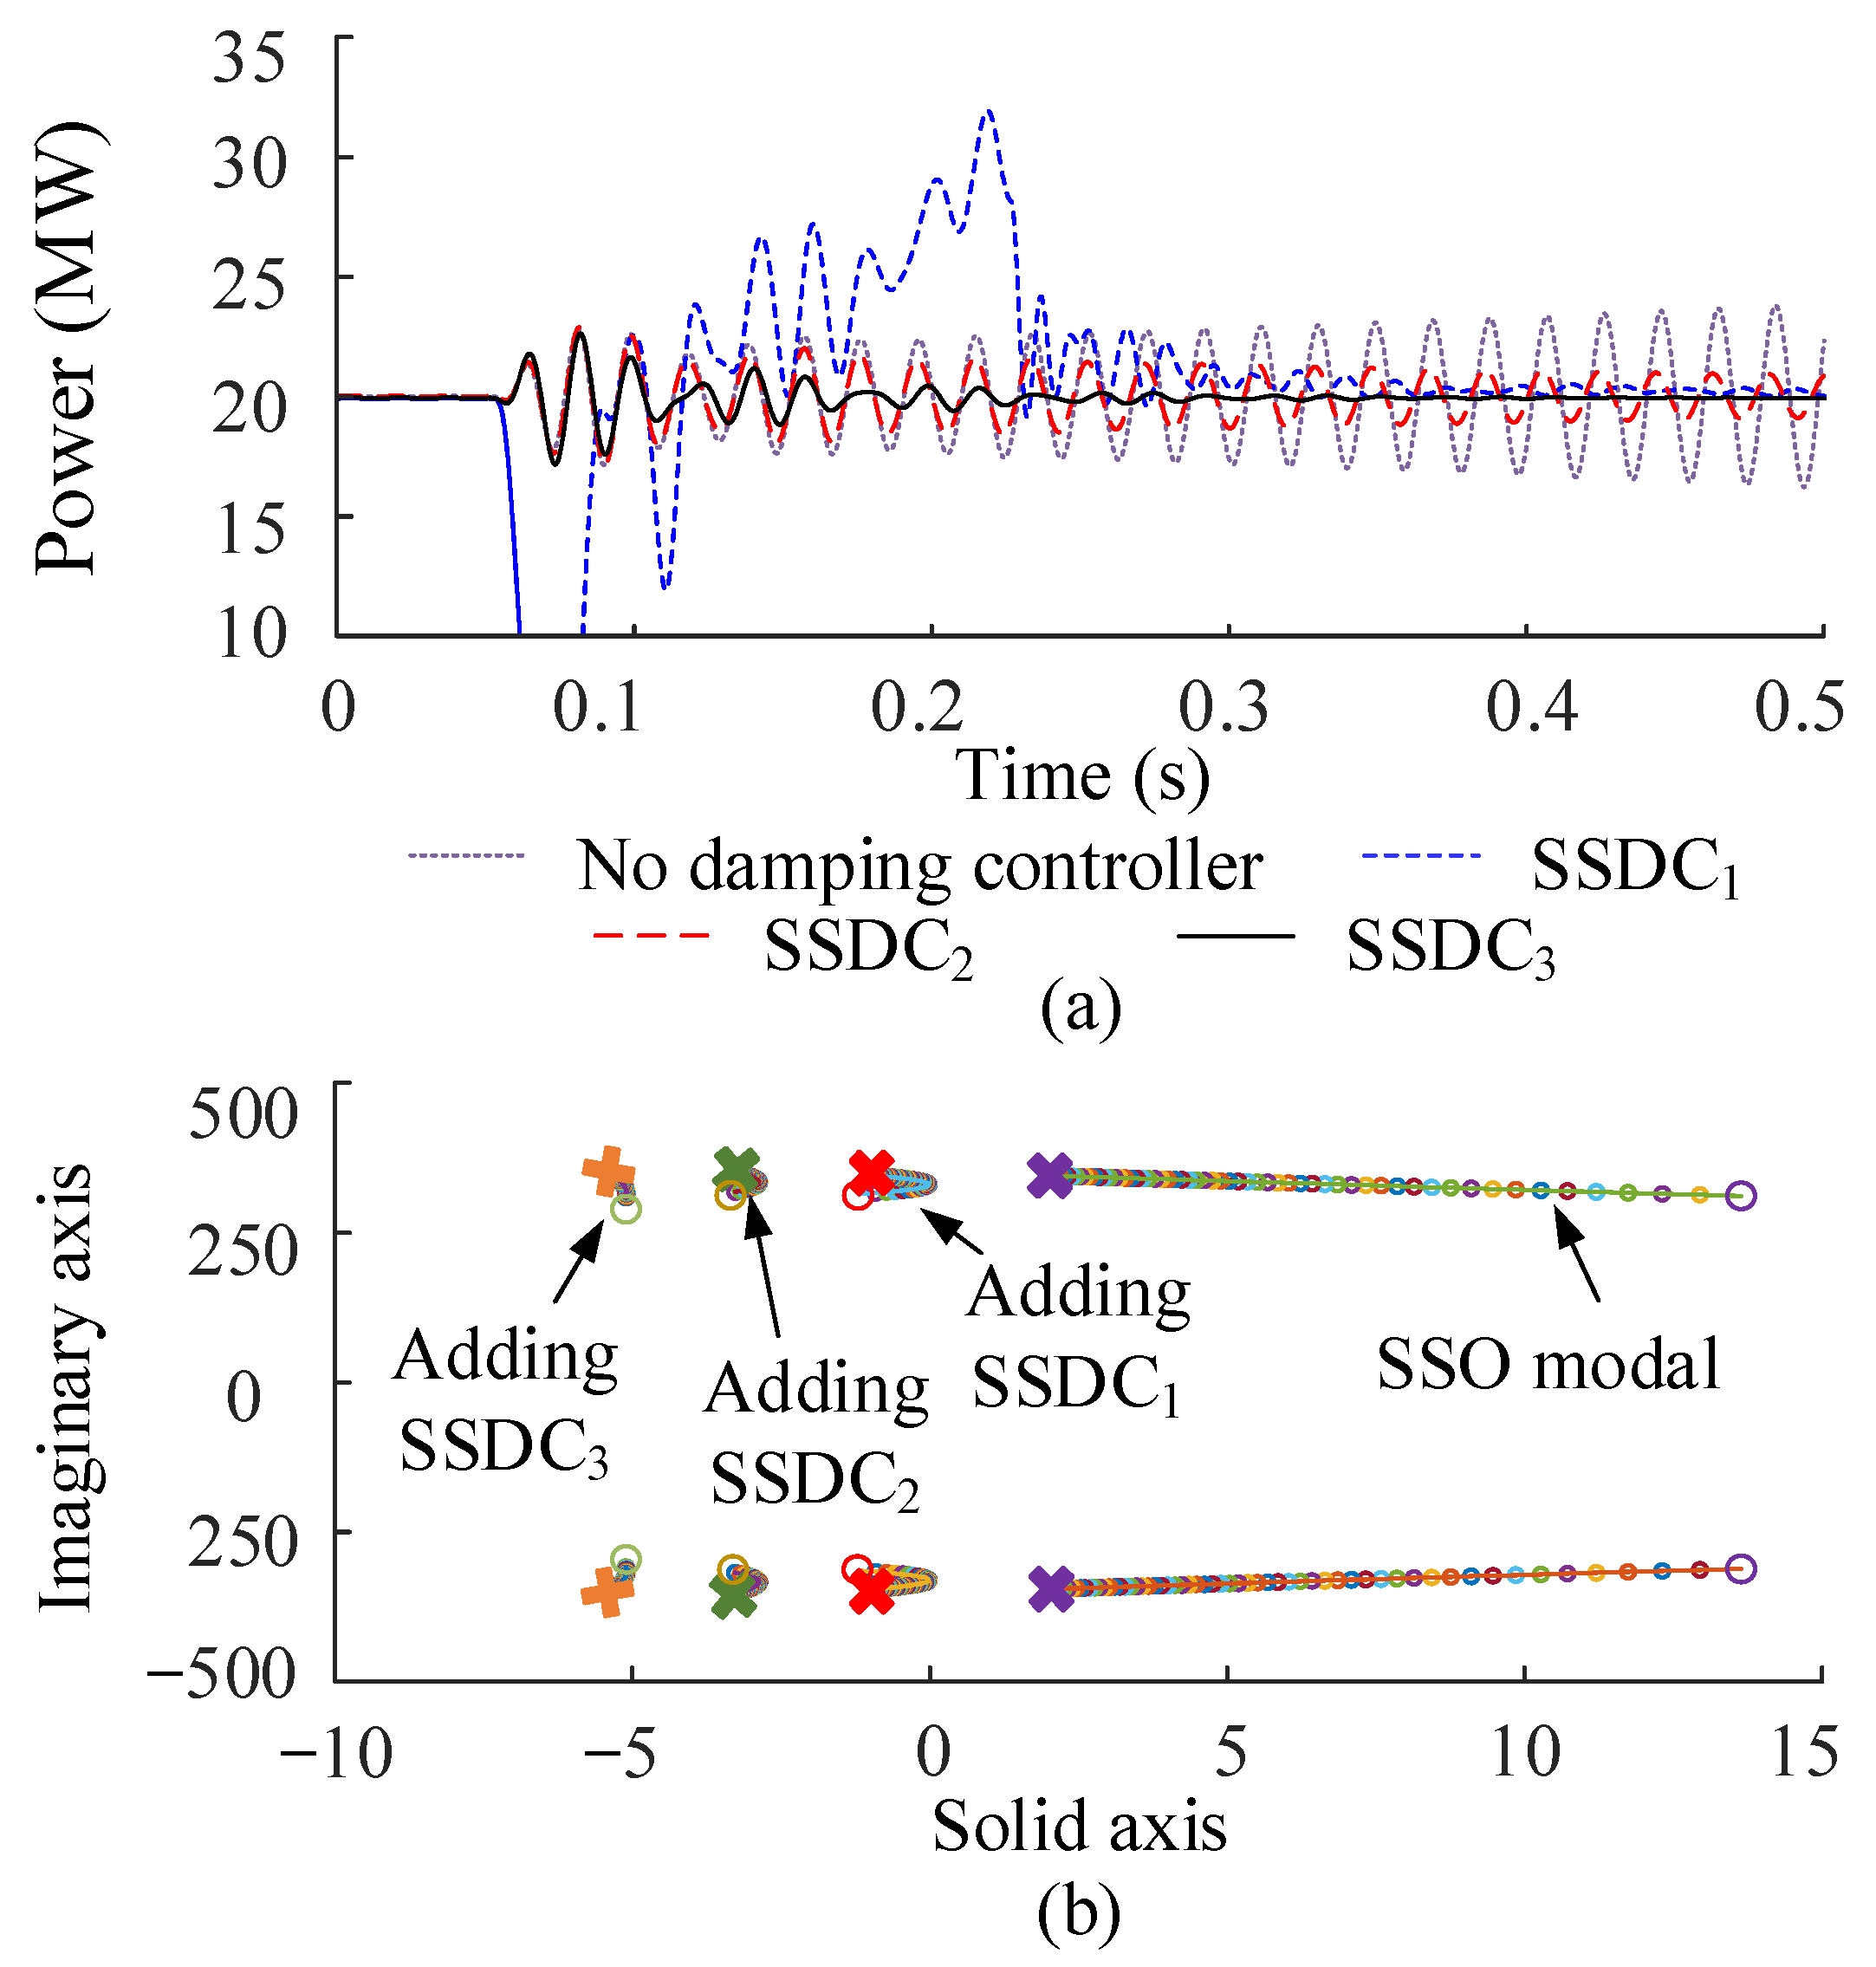
When mitigating SSO, the overshoot of the power waveform reflects the mitigation intensity of the SSDC, and the adjustment time reflects the mitigation speed. The smaller the overshoot and the shorter the adjustment time are, the stronger the mitigation ability is. Figure 3a shows the DFIG power waveform without the SSDC and with the three SSDCs, and Figure 3b shows the root locus of the dominant SSO mode when the compensation level increases. The results show that SSDC3 has the minimum overshoot and the shortest adjustment time. Meanwhile, its dominant SSO mode is the furthest from the imaginary axis, which means it provides the largest damping to SSO. Therefore, this method has the best mitigation ability and the best robustness.

2.2. Application Range of the SSDCs Using One Set of Parameters

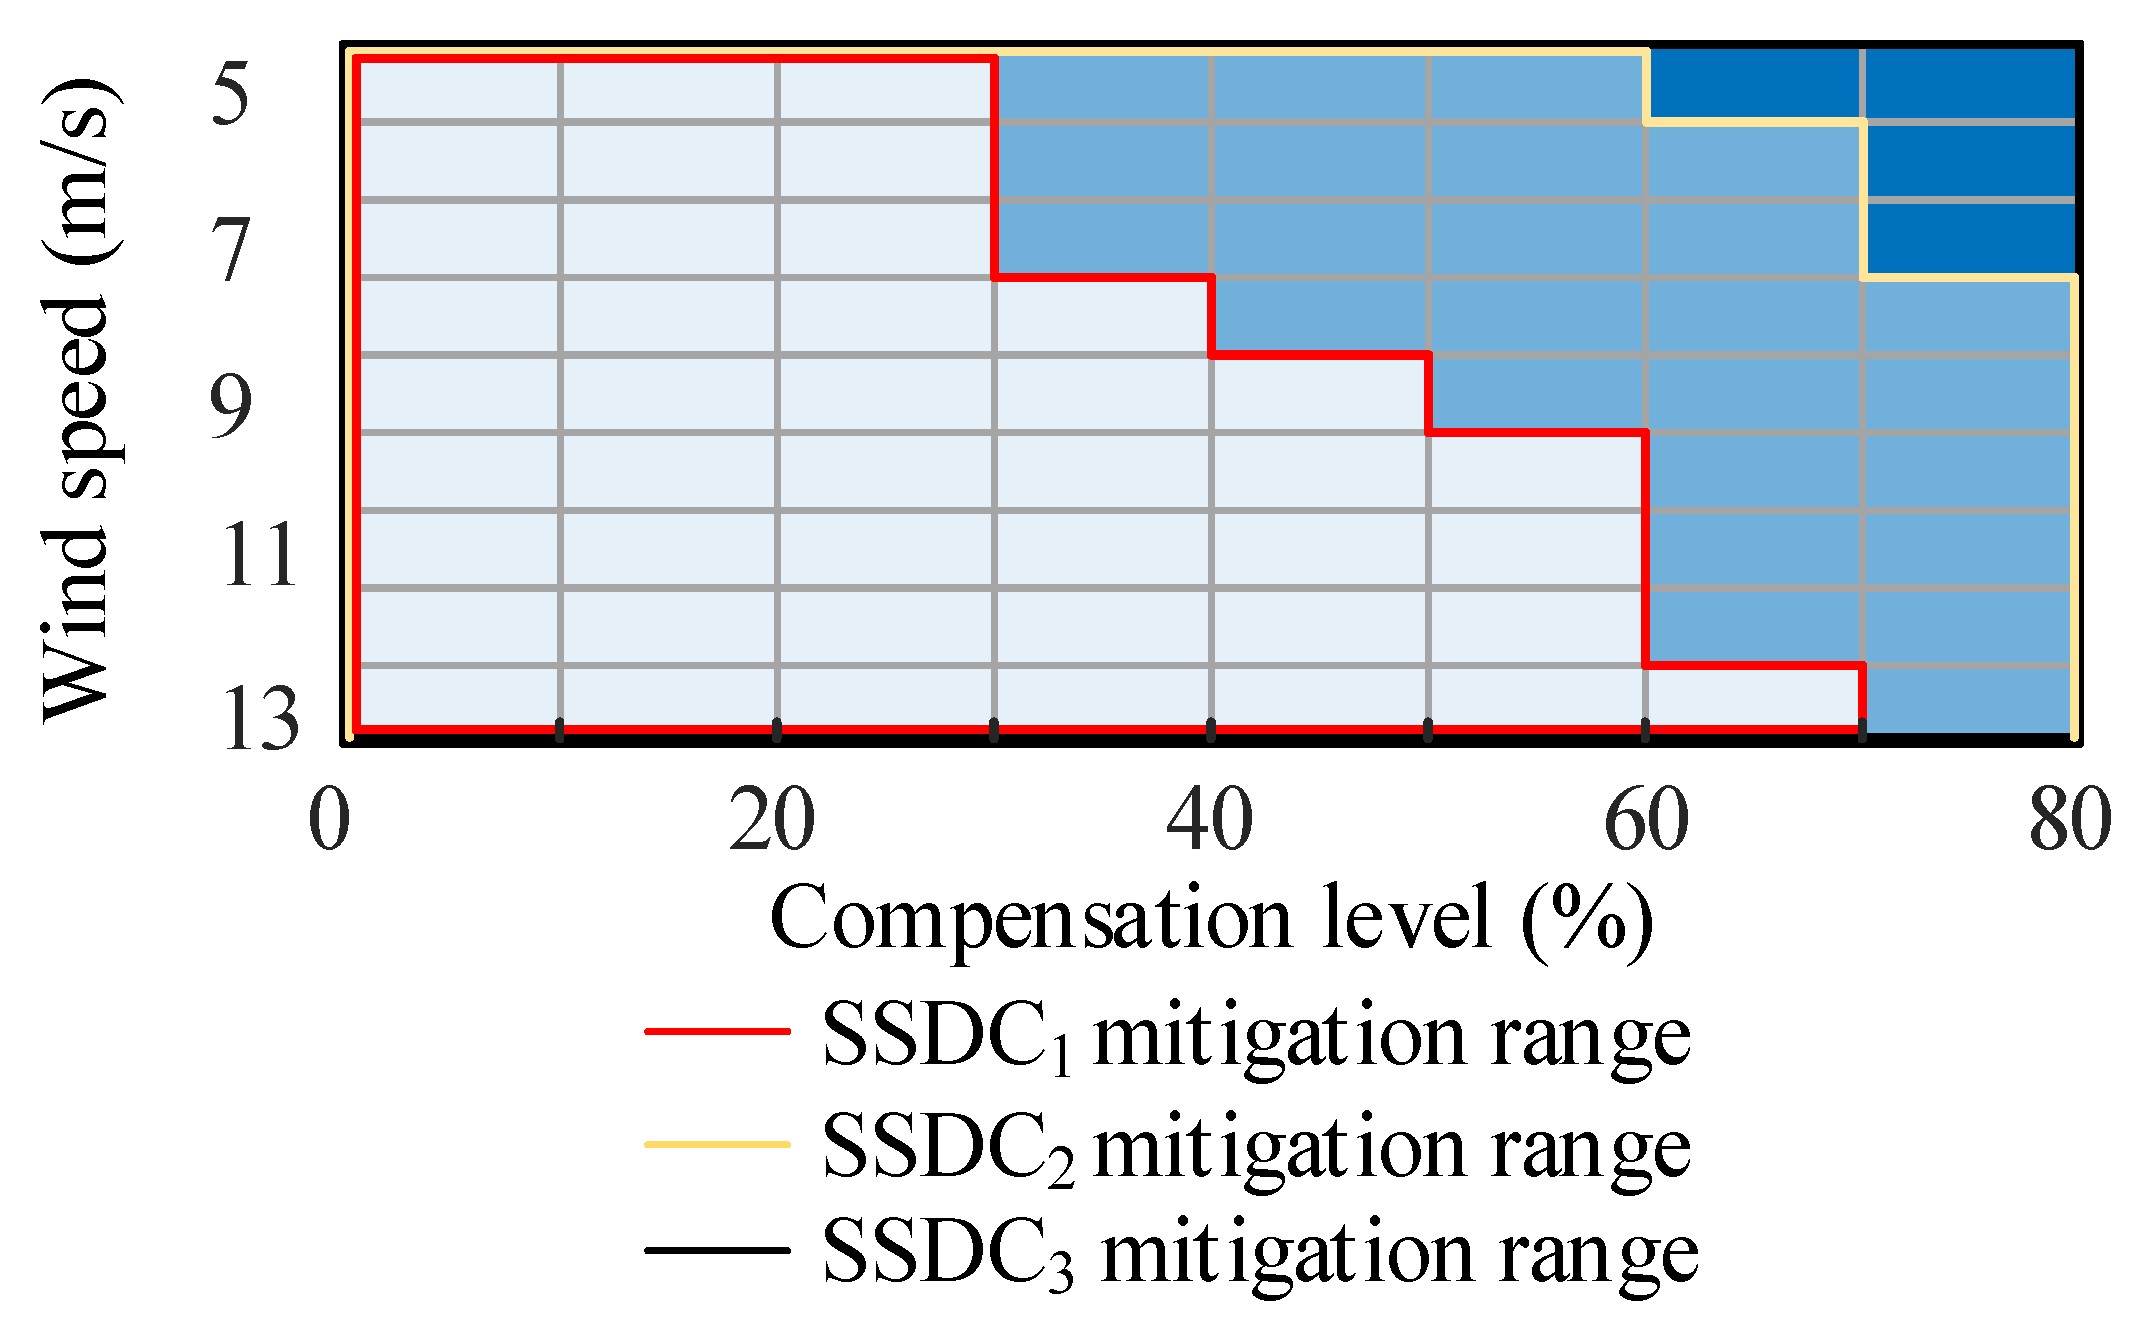
Considering the performance differences of the SSDCs, the mitigation range of some SSDCs are limited when fixed control parameters are used. Figure 4 shows mitigation ranges under 72 working conditions, of which the wind speed and the compensation level vary in a reasonable range and each SSDC’s parameters are fixed to the optimal value in the case of 9 m/s wind speed and 40% compensation level. The centre frequencies of the filters are adaptively chosen to be the SSO frequencies.
In Figure 4, each grid represents a working condition composed of a combination of the wind speed and compensation level. When a certain SSDC is used, the percentage of the number of grids surrounded by the line to the total number of grids indicates the range of working conditions that the SSDC can mitigate. Taking SSDC1 as an example, the red line surrounds 43 working conditions, so this SSDC can only mitigate SSO for 43 ÷ 72 = 59.7% ≈ 60% of working conditions. To deal with this problem, [21] designed an auxiliary controller for SSDC1 based on the multiple-model adaptive control (MMAC) approach and selected the optimal parameters according to the working condition table in real time to achieve mitigation over a wider range. On the other hand, SSDC2 can achieve mitigation under 94% working conditions, and SSDC3 can achieve mitigation under all working conditions. Considering that SSDC1 needs more real-time information, SSDC2 and SSDC3 have higher fault tolerance performance.

2.3. Accessibility of the Input Control Signal

The input control signal of SSDCs shall have the characteristics of easy acquisition and fast transmission, so as to reduce the delay caused by the signal acquisition. The collection and transmission of the compensation capacitor voltage require a special signal transmission channel, while the rotor speed and rotor current can be locally collected, which is more suitable for real-time control. Therefore, SSDC2 and SSDC3 are more suitable for practical projects.
In conclusion, SSDC3 has more advantages due to its stronger mitigation ability, wider mitigation range, and simpler signal collection. Therefore, the working mechanism of this method will be further studied in the following part.

3. Working Mechanism and Improvement of SSDC3

3.1. Working Mechanism of SSDC3

SSDC3 is mainly composed of an SSO extraction module and a control module. The SSO extraction module mainly uses a second-order BPF to extract the SSO component, and the control module uses a PID controller to compensate for the amplitude and phase of the extracted signal [13].
S = ω ω r ω
where ω represents the synchronous frequency of the asynchronous motor and ωr represents the rotor current frequency. The derivation process of this model is described in detail in [22].
The Figure 5 shows the equivalent mathematical model of DFIG. At the subsynchronous frequency fSSO, its angular frequency ωSSO = 2π × fSSO, s = (ωSSOωr)/ωSSO, and slip s < 0. Therefore, (kpR3 + rr)/s < 0. kpR3 + rr represents the sum of the proportional gain coefficient of the RSC and the DFIG rotor resistance at the subsynchronous frequency fSSO, and this is the resistance value provided to the system by the DFIG rotor. (kpR3 + rr)/s < 0 means that the DFIG presents negative damping at this frequency. If the negative resistance is large enough, then the total resistance in the circuit will be negative, i.e., R(ωSSO) = (kpR3 + rr)/s + rs + rT + rL < 0, and if the total reactance X(ωSSO) crosses zero at the frequency fSSO, then the system will oscillate. When SSDC3 is applied, the controller uses the proportional gain coefficient kp3 to reduce kpR3 + rr. Assuming that the BPF extracts the SSO component completely, that is, the filter does not provide amplitude gain and phase deviation, then RRSC = kpR3 + rrkp3, thus reducing the negative damping of the DFIG at the SSO frequency. It is shown in the simulation waveform that the extracted SSO mitigation signal is subtracted from the SSO component in the original RSC voltage vdr* at the subsynchronous frequency fSSO, which weakens the oscillation component in the RSC output voltage, as shown in Figure 6.
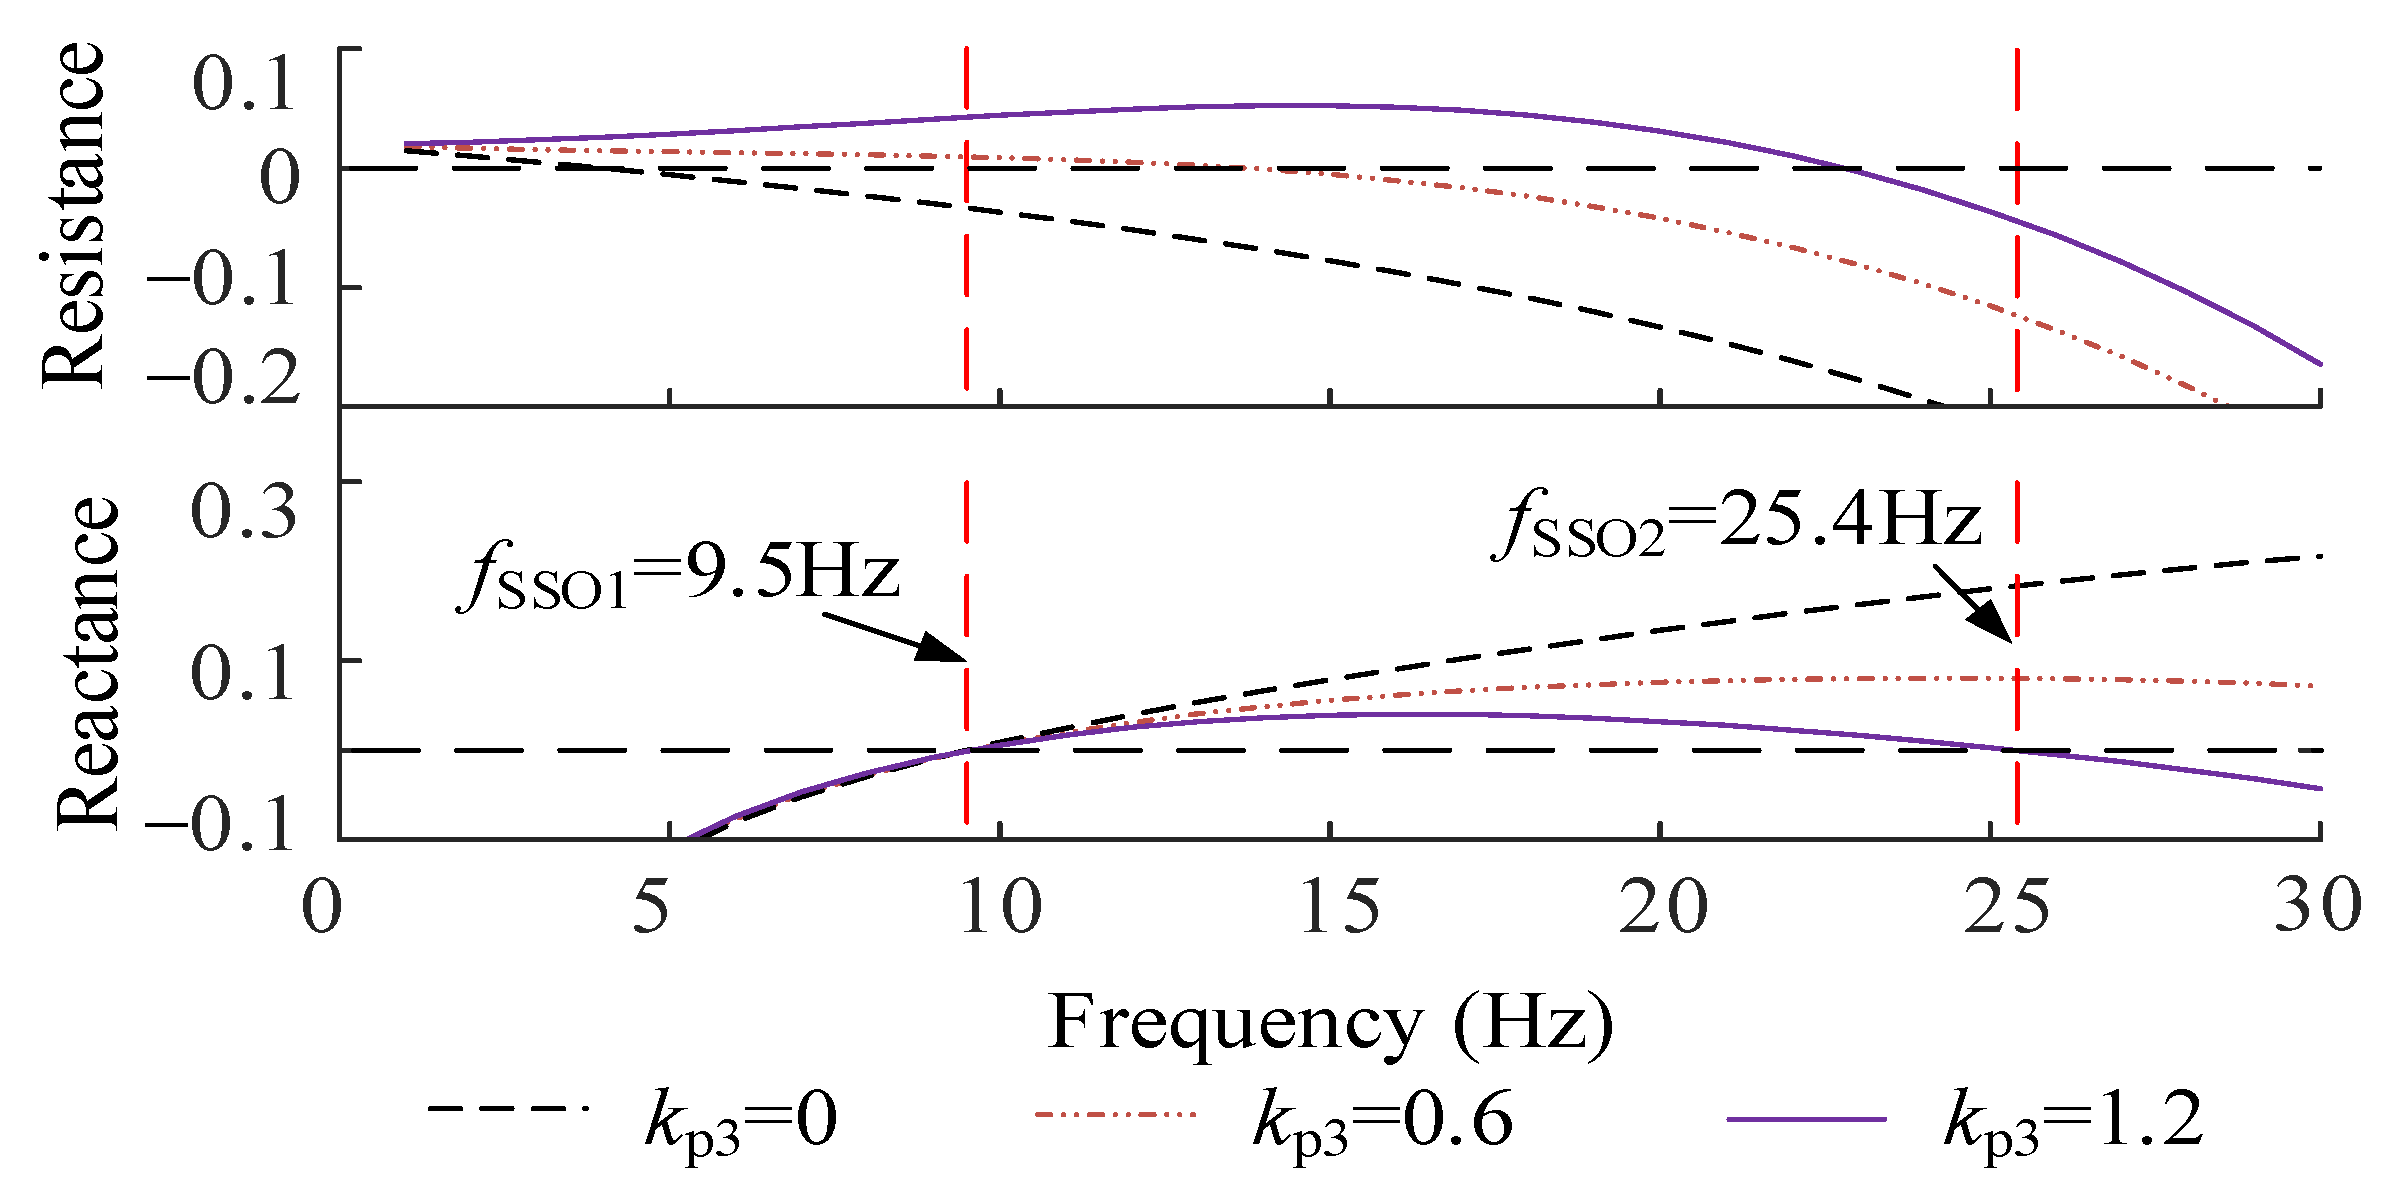
Figure 7 shows the impedance model of the system under the wind speed of 9 m/s and the compensation level of 50%, where kp3 is the proportional gain coefficient of the PID controller, and the resistance and reactance are expressed in unit values. The curve kp3 = 0 represents the impedance model without SSDC3. In this case, the resonance frequency fSSO1 = 9.5 Hz, and the curve kp3 = 0.6 represents the curve of SSDC3 control parameters after optimization, where the BPF centre frequency is fSSO1. It can be seen that after applying SSDC3, the resistance value of the system is increased from a negative value to a positive value under fSSO1, thus mitigating SSO.

3.2. Influence of SSDC3 Controller Parameters on Mitigation Performance

When eliminating the negative resistance that causes SSO, the greater the resistance value increment at the subsynchronous frequency, the stronger the damping to SSO. The increment of the resistance value is mainly determined by the proportional gain coefficient kp3 of the controller, as shown in Figure 3. However, excessive kp3 will lead to system instability, and the value should be controlled within a reasonable range during the design of parameters. The reasons are as follows:
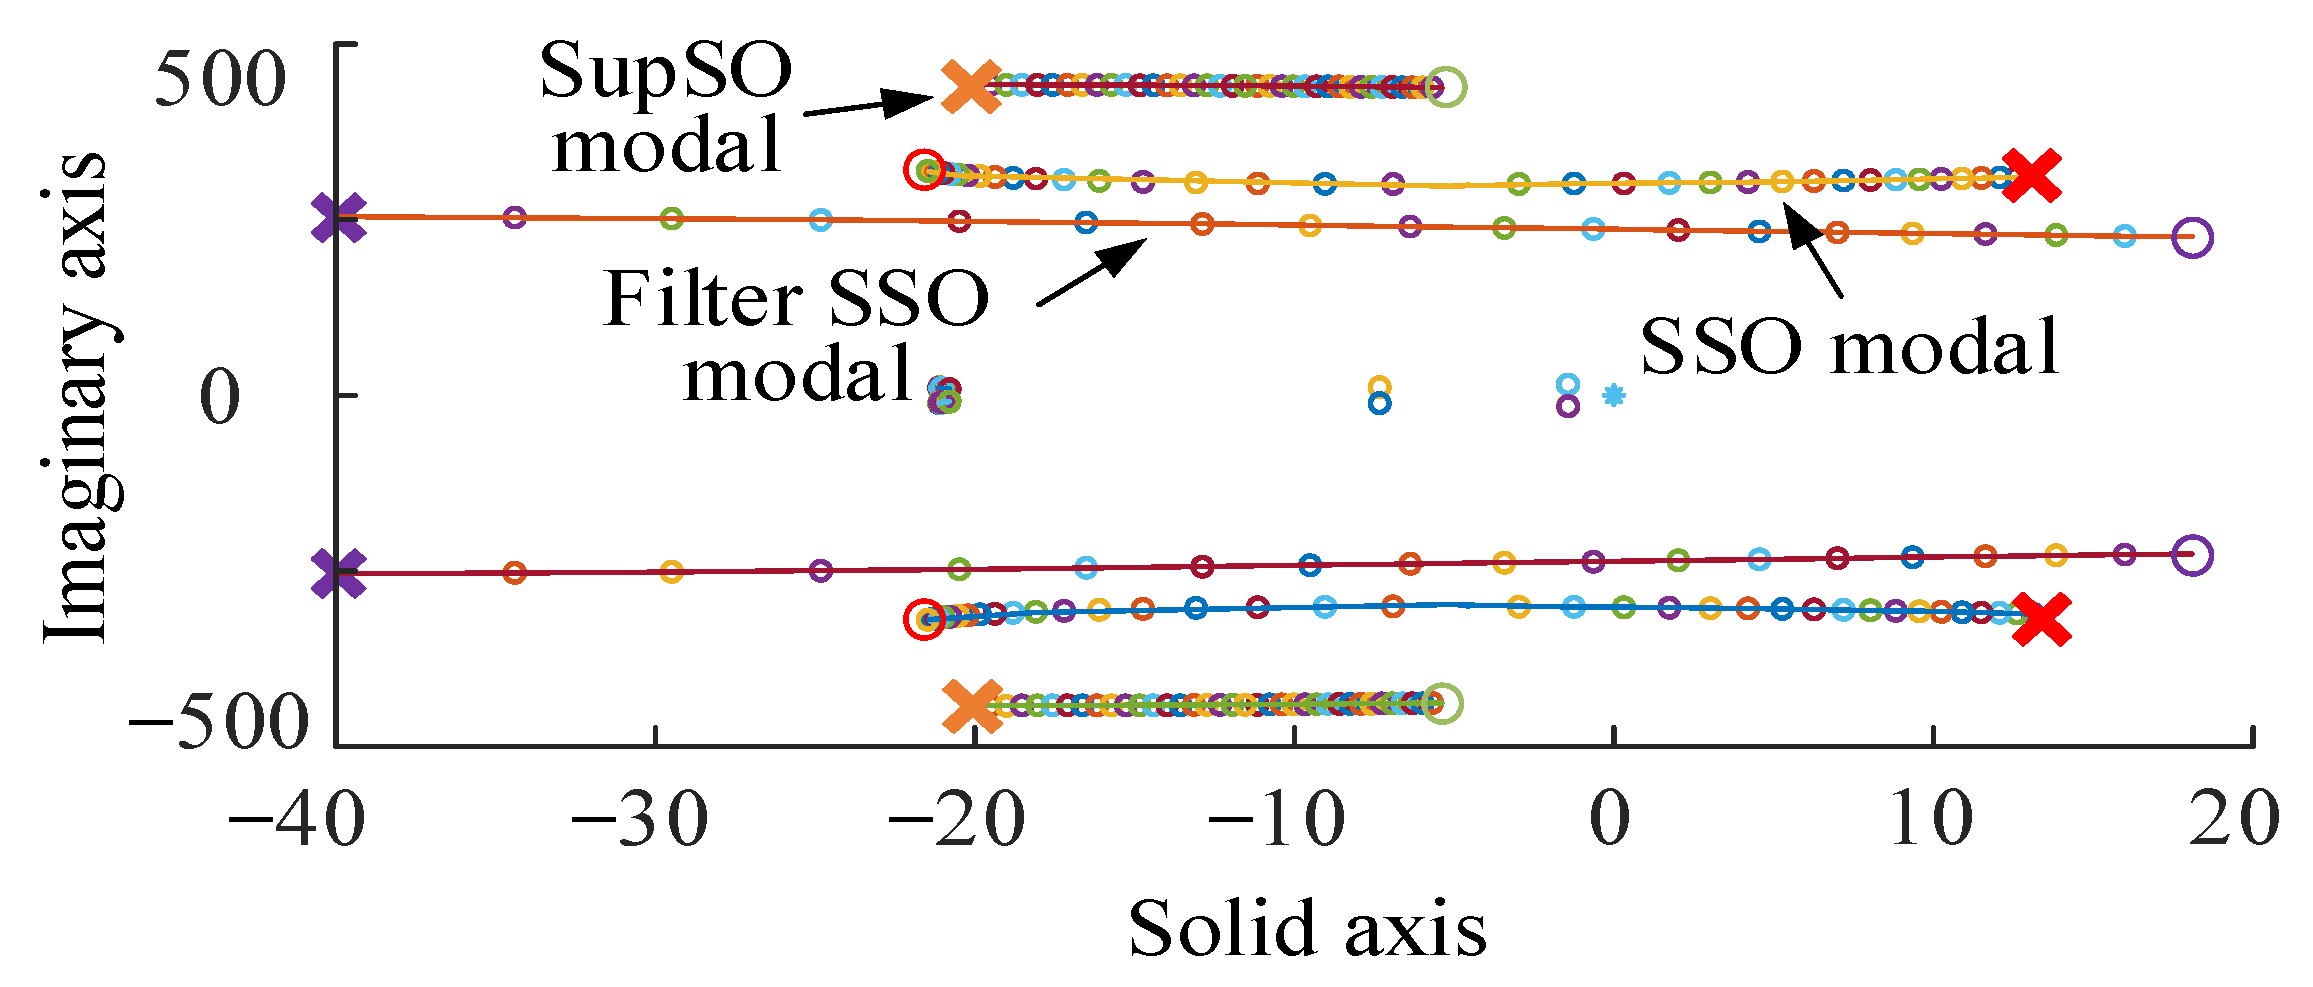
Figure 8 shows the root locus of the system with the increase in kp3 from 0 to 1.2 after the application of SSDC3 when the compensation level is 50%, where the SupSO mode is the supersynchronous mode caused by the frequency coupling effect [7], and its frequency is fSupSO = 2 × f0fSSO, where fSupSO, f0 and fSSO represent the frequencies of the supersynchronous, fundamental and subsynchronous modes, respectively. It can be seen that with the increase in kp3, the dominant SSO mode moves leftward from the right part of the coordinate axis and enters the left part by crossing the imaginary axis. Therefore, the larger the kp3, the stronger the mitigation ability of the system to SSO. However, an unexpected mode on the left part of the coordinate axis with a frequency slightly higher than that of SSO but still within the subsynchronous frequency range rapidly moves right with the increase in kp3 and finally crosses the imaginary axis and enters the right part. This mode appears after the addition of SSDC3 and is introduced by the filter. Table A2 in the Appendix A shows the state variables and their influence factors that dominate the mode when kp3 = 0.6, where Sfilter1~Sfilter4 are the four state variables of the second-order BPF in SSDC3, Δφds, Δφqs, Δφdr and Δφqr are the flux linkage of the stator and rotor, respectively, ΔVCd and ΔVCq are capacitor voltages, and ΔId and ΔIq are the output currents of the DFIG. It can be seen that this mode is mainly caused by the interaction between the filter and the induction generator. The larger kp3 is, the greater the influence factor of the BPF state variable is, and the easier the system will lose instability. In addition, this mode is also affected by the compensation level of the transmission line. In conclusion, the BPF in SSDC3 will lead to system instability, and the greater kp3, the greater the risk.
In order to study the physical significance of system instability when kp3 increases, the impedance model of the system at different kp3 is established, as shown in Figure 3. The centre frequency of the BPF in SSDC3 is the SSO frequency. When kp3 = 1.2, although the SSDC increases the resistance value of the system at the resonance frequency fSSO1 by a relatively large value, the BPF provides a large capacitive reactance at a point slightly higher than fSSO1, so that when fSSO2 = 25.4 Hz, the overall reactance of the system is zero. In this case, the resistance value at this frequency is negative, generating a new SSO mode, i.e., the SSO introduced by the filter.
In conclusion, the selection of kp3 in SSDC3 is particularly critical. When the value is too small, the resistance value provided for the system is insufficient to offset the negative resistance. When the value is too large, the controller will introduce new SSO. Therefore, these two aspects need to be considered comprehensively to keep the system stable. This paper proposes the following suggestions for parameter design:
(1)
When SSO is triggered, the negative resistance at the resonance frequency is mainly composed of the RSC current loop proportional gain coefficient kpR3 and rotor resistance rr [22]. When mitigating SSO, the resistance value provided by the SSDC needs to completely offset the negative resistance to keep the system stable. As shown in Figure 7, if the SSO component and rotor resistance in the rotor current reference values idr* and iqr* are ignored, then kp3 should not be less than kpR3.
(2)
When kp3 > kpR3, the system provides greater damping to SSO, but also increases the risk of instability caused by the filter. Therefore, keeping the safety and stability of the system under the premise of mitigating SSO, kp3 can be gradually increased from kpR3 until the system stability requirements are met.
(3)
The integral coefficient ki3 and the differential coefficient kd3 in SSDC3 are mainly used to adjust the phase of the SSDC3 output signal. If the BPF is designed accurately and there is no phase shift in the extracted oscillation component, then ki3 and kd3 can be designed as 0, that is, the output signal is in the same direction as the rotor current, so that the RSC presents the “virtual resistance” characteristic, thus mitigating SSO.
In reference [13], the centre frequency of SSDC3 is fixed. When the actual SSO frequency changes, the phase of the BPF output signal will change accordingly. Therefore, the filter in [13] is designed with a large bandwidth, and it corrects the phase of the mitigation signal through an integral or differential control so as to adapt to the complex and changeable working conditions. However, this solution not only complicates the controller design but can also only be applied when the operating condition slightly deviates from the expectation. To solve this problem, this paper proposes an adaptive BPF parameter design method based on the ERA algorithm to keep the BPF centre frequency tracking the actual SSO frequency in real time, which completely extracts the SSO component and avoids the phase offset. The specific algorithm will be presented in the next section.

3.3. Adaptive BPF Design Based on ERA

The BPF in SSDC3 plays an important role in oscillation mitigation. According to its transfer function (2), the filter parameters such as centre frequency fn and damping ζ determine the performance of the SSDC, where ωn = 2π × fn. The BPF centre frequency of an ideal SSDC should be designed to track the SSO frequency so that the oscillation component can be completely extracted without any amplitude gain or phase offset. In the original SSDC3, the centre frequency fn of the BPF is determined offline according to historical experience or data, which may lead to a deviation in practical application. To solve this problem, this paper proposes a method to extract the oscillation frequency based on real-time signal monitoring and the adaptive design of BPF parameters to make SSDC3 more robust in wind power systems with randomness and uncertainty.
G BPF = 2 ζ ω n S S 2 + 2 ζ ω n S + ω n 2
(1)
Adaptive frequency selection based on ERA
In this paper, the ERA is selected to monitor SSO and provide the oscillation frequency to the BPF. It is worth mentioning that the ERA is a mode parameter identification algorithm and was proposed by J. Juang and Richard S. Pappa in 1985, and it can identify the mode and reduce the order of the system model [23,24,25,26,27]. The specific introduction of the ERA is as follows:
For the sampled signal x(k), a Hankel matrix is constructed, as shown in (3):
H E ( k 1 ) = x ( k ) x ( k + 1 ) x ( k + s 1 ) x ( k + 1 ) x ( k + 2 ) x ( k + s ) x ( k + r 1 ) x ( k + r ) x ( k + s + r 2 )
where x(k) represents the kth point in the sampled signal.
Let k = 1 and k = 2 to obtain HE(0) and HE(1), respectively. Singular value decomposition (SVD) is performed on HE(0) to estimate the order of the signal, i.e., the mode number:
HE(0) = UVH
where the superscript symbol H represents conjugate transposition, ∑ represents the diagonal matrix of eigenvalues whose main diagonal elements are arranged in descending order, and U and V are left and right singular matrices, respectively. The mode number can be determined by the dominant eigenvalues, in this case 6 for the fundamental component, the subsynchronous and supersynchronous component, and their conjugate phasors.
The system matrix A of the signal can be obtained from Equation (5):
A = n 1 2 U n H H ( 1 ) V n n 1 2
The eigenvalue matrix λ of system A can be obtained by solving the eigenvalue of matrix A.
λ = [λ1, λ2, …, λ6]
The vector of each mode can be obtained by the least-squares method. The Vandermonde matrix V∈Cm×2q is constituted by the eigenvalues λ as:
V = λ 1 0 λ 2 0 λ 6 0 λ 1 1 λ 2 1 λ 6 1 λ 1 m - 1 λ 2 m - 1 λ 6 m - 1
where m is the sample number of the signal. In this work, the signal refers to the sampled current and voltage, i.e., YI∈Rm×1 and YV∈Rm×1, which are expressed as:
Y I = [ y I 1 , y I 2 , ... , y I m ] T
Y V = [ y V 1 , y V 2 , ... , y V m ] T
Based on the Euler equation, YI = VCI and YV = VCV [19], where CI and CV are the phasors of each mode for the current and voltage signals, respectively. Using the least-squares method, CI and CV can be obtained as:
C I = ( A T A ) 1 A T Y I
C V = ( A T A ) 1 A T Y V
For real-time SSO monitoring, a 40 m/s window is adopted considering the computational burden, the detection accuracy as well as the dynamic performance. As for the sampling rate, 250 Hz is chosen, i.e., there are 10 points in the sampling window. As in reference [27], such a setting will use as little data as possible to reduce the computational burden. In addition, the fitting error and the dynamic performance can achieve a good performance in the least-squares method.
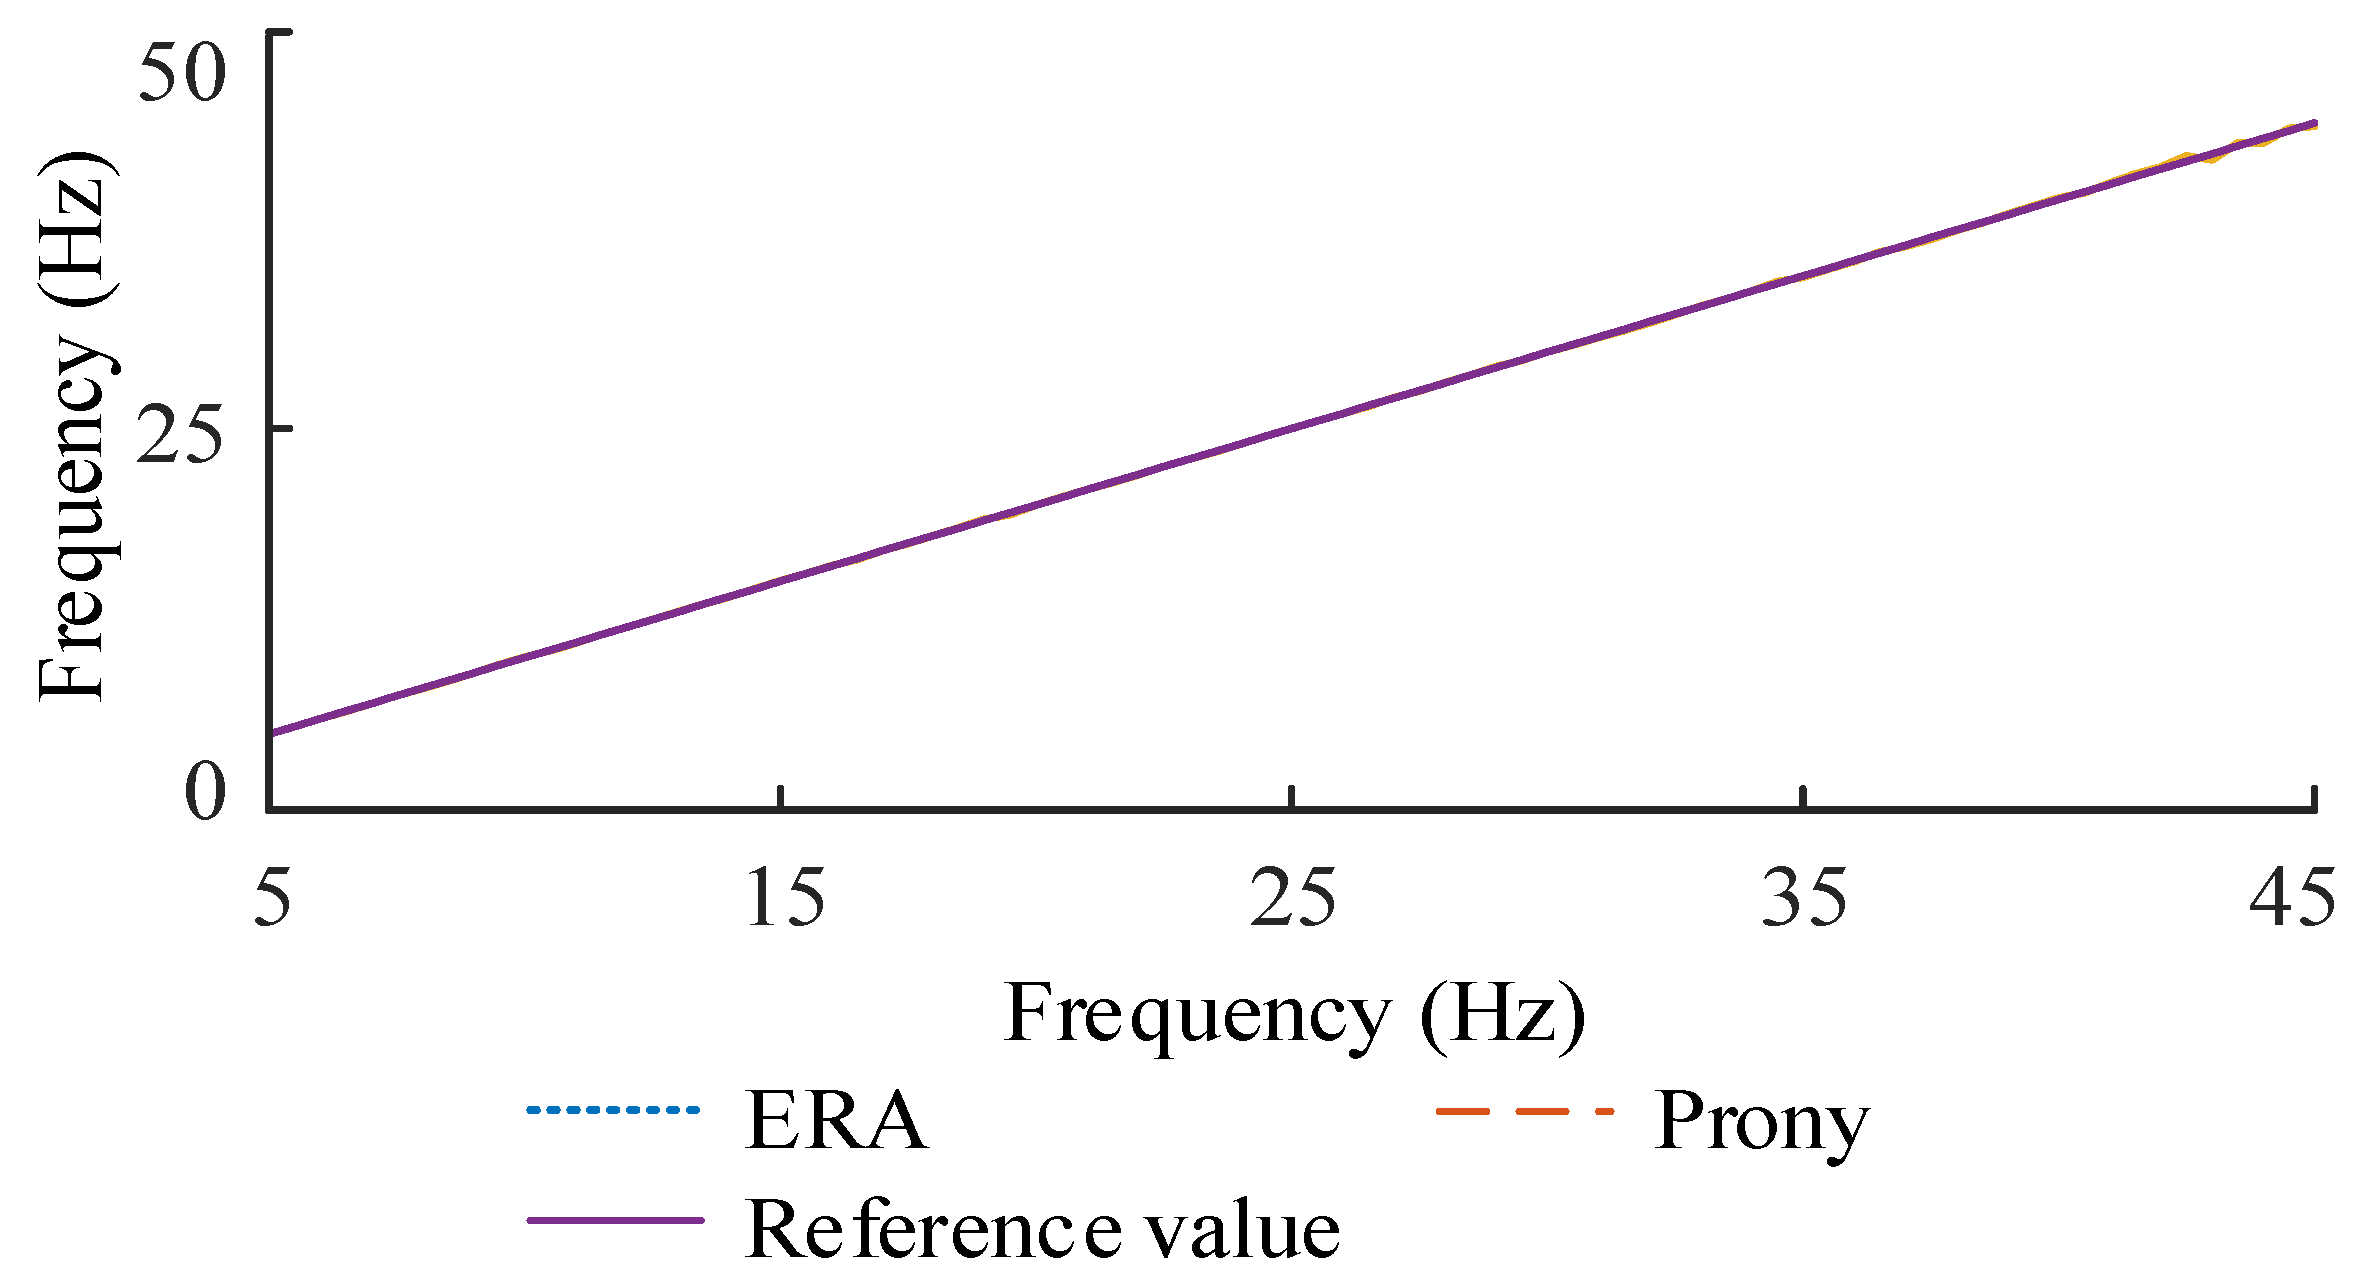
Compared with the commonly used oscillation detection methods such as Prony [28] and fast Fourier transform (FFT) [29], the ERA performs better in noise conditions than Prony [27]. Meanwhile, FFT needs a long detection window to maintain its resolution [30]. Therefore, the ERA is more suitable for real-time monitoring. The frequency detection performances of the ERA and Prony are shown in Figure 9. The window length of each algorithm is 40 m/s and the sampling rate is 250 Hz for a fair comparison. The tested signal is modelled as (12), where fre varies from 5 to 45 Hz. It can be seen that both methods can track the oscillation frequency accurately.
y = 100 cos ( 2 π × 60 t ) + 10 cos ( 2 π × f r e × t )
In practical implementation, before the ERA determines the oscillation frequency, the BPF operates according to the preset value, which can be obtained according to historical oscillation data or simulation results [13], and the working state is completely the same as the original SSDC3. After the ERA provides the real-time oscillation frequency, it adjusts the centre frequency of the BPF and the oscillation component is completely extracted, thus improving the mitigation effect of SSDC3.
Further, there may be weak fluctuations in the output current during the steady-state operation in the power system. Therefore, a dead band is added to prevent these fluctuations from interfering with the frequency selection of the filter, for example, by changing the centre frequency of the filter only if the amplitude of the oscillation signal Lt exceeds 10% of the amplitude of the fundamental wave Ht.
(2)
Design of damping ζ.
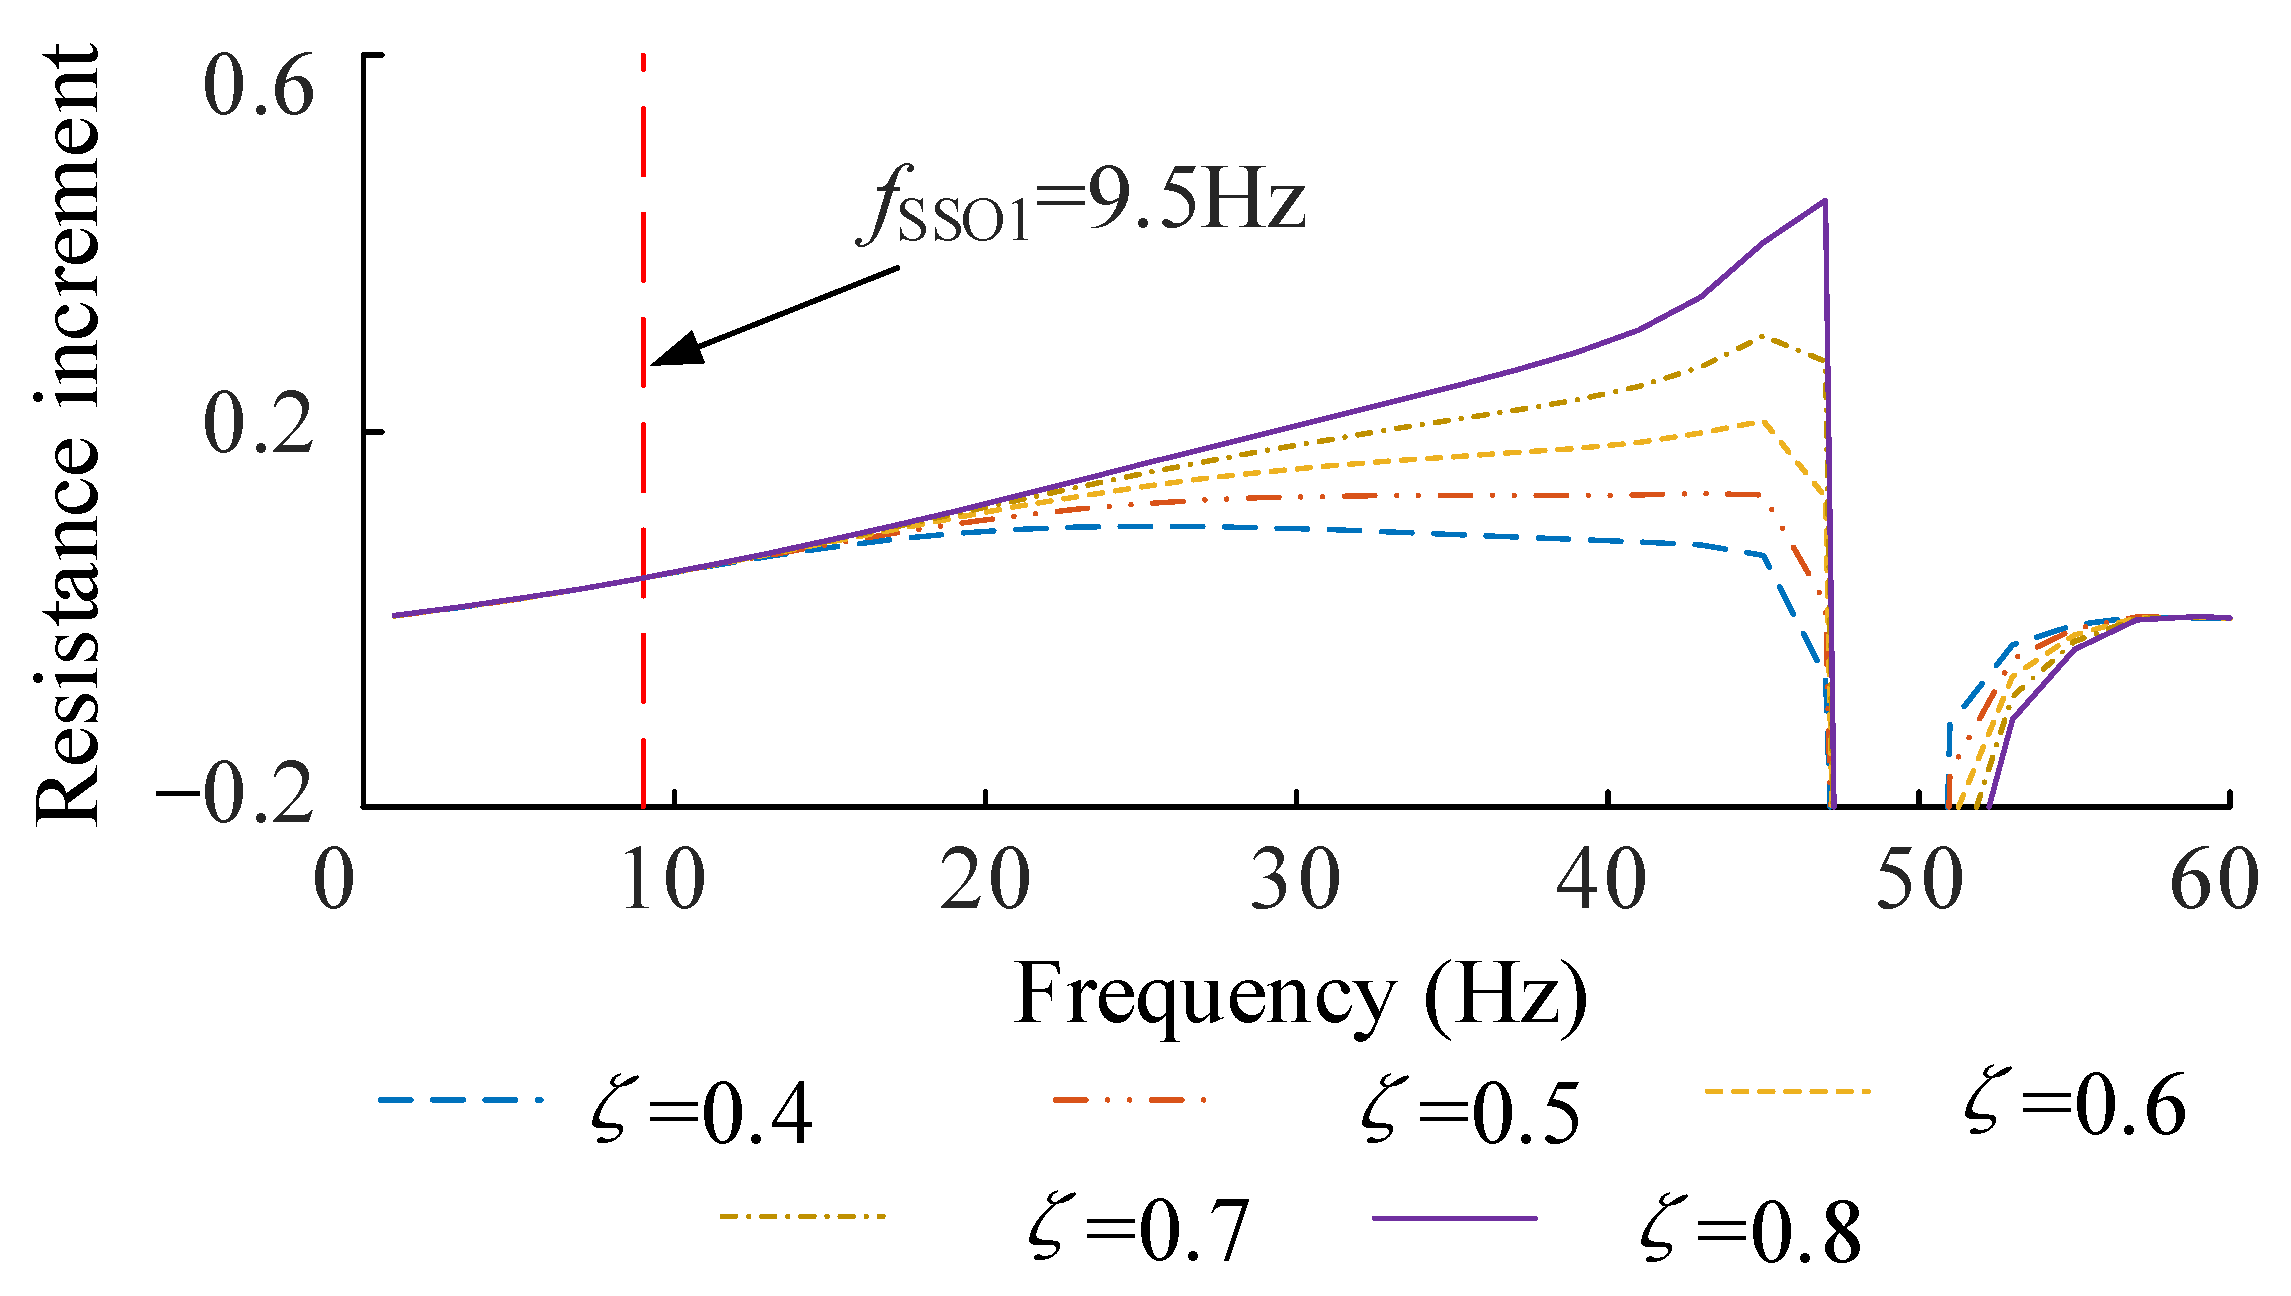
The smaller the damping ζ of the filter, the narrower the band pass, and the narrower the bandwidth that can improve the resistance value, which reduces the robustness in the wind power system. The larger the ζ, the higher the fault tolerance rate of the system, but it will cause a resistance increment in the 20~50 Hz frequency band. SSDC3 with adaptive frequency selection realizes accurate mitigation, and it no longer needs to provide damping to the system in the entire subsynchronous frequency band. Therefore, the influence outside the band shall be reduced.
In order to find out the optimal filter ζ, this paper compares and tests the results of the SSO mitigation performance at ζ = 0.1~2. As shown in Figure 10, ζ in the range of 0.4 to 0.8 has the best dynamic performance. Meanwhile, considering that the impact on the frequency outside of the target frequency band should be reduced after applying the SSDC, this paper tests the resistance value increment provided by the SSDC for ζ = 0.4~0.8. As shown in Figure 11, the oscillation frequency is fSSO1, and the resistance value increment is expressed in terms of the unit value. Obviously, each ζ provides almost the same resistance gain for the system at the oscillation frequency. However, ζ = 0.4 provides the smallest gain in the resistance value of the 20~50 Hz band, so in this paper, ζ = 0.4 is the recommended value. It is worth mentioning that ζ can be flexibly selected according to actual requirements to achieve ideal robustness and dynamic performance.
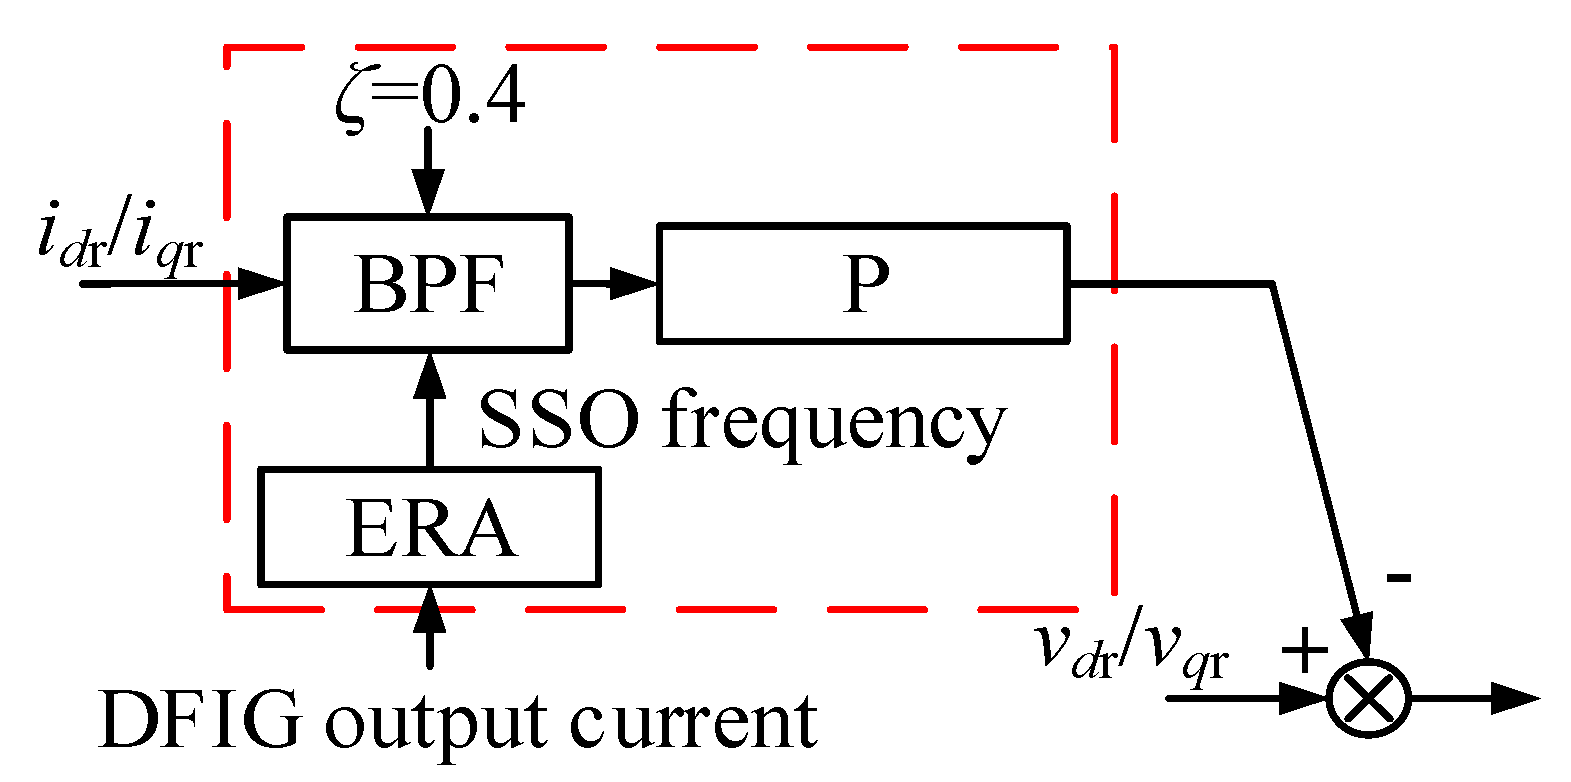
To sum up, the control structure of the improved SSDC3 is shown in Figure 12. It consists of a P controller, a BPF and a frequency extraction module, and its parameter selection guideline is summarized in Table A3 in the Appendix A. When the system is running, the centre frequency of the BPF is preset according to the historical oscillation data or simulation results. Once SSO is detected, the ERA frequency extraction module analyses the oscillation component in the signal and provides the real-time SSO frequency to the BPF. Through the BPF and P controller, idr and iqr are processed as mitigation signals and added to the RSC voltage. Figure 13 shows the output current waveform of the DFIG and the frequency signal detected by the ERA when SSO is triggered, where the ERA module monitors the oscillation component in real time. The SSO occurs at t1 = 10 s and the amplitude of the oscillation current immediately exceeds the threshold. As a result, SSDC3 sends the centre frequency to the BPF module. After SSO is mitigated, the centre frequency of the filter will not change anymore. In addition, the controller is only composed of a proportional controller, and its value should not be less than the proportional gain of the RSC inner loop.

4. Root Locus Analysis and Hardware-in-the-Loop Simulation Experiment

4.1. Root Locus Performance

The root locus analysis is used to compare the improved SSDC3 with the original one. The filter centre frequency of the original SSDC3 is fixed at the SSO frequency under 9 m/s of wind speed and a 40% compensation level. To improve the damping of the system in the whole subsynchronous frequency band, the damping ζ is fixed to 2 to ensure that the original SSDC3 has a wide oscillation mitigation range. The filter centre frequency in the proposed method is adaptively changed, and its ζ is fixed at 0.4.
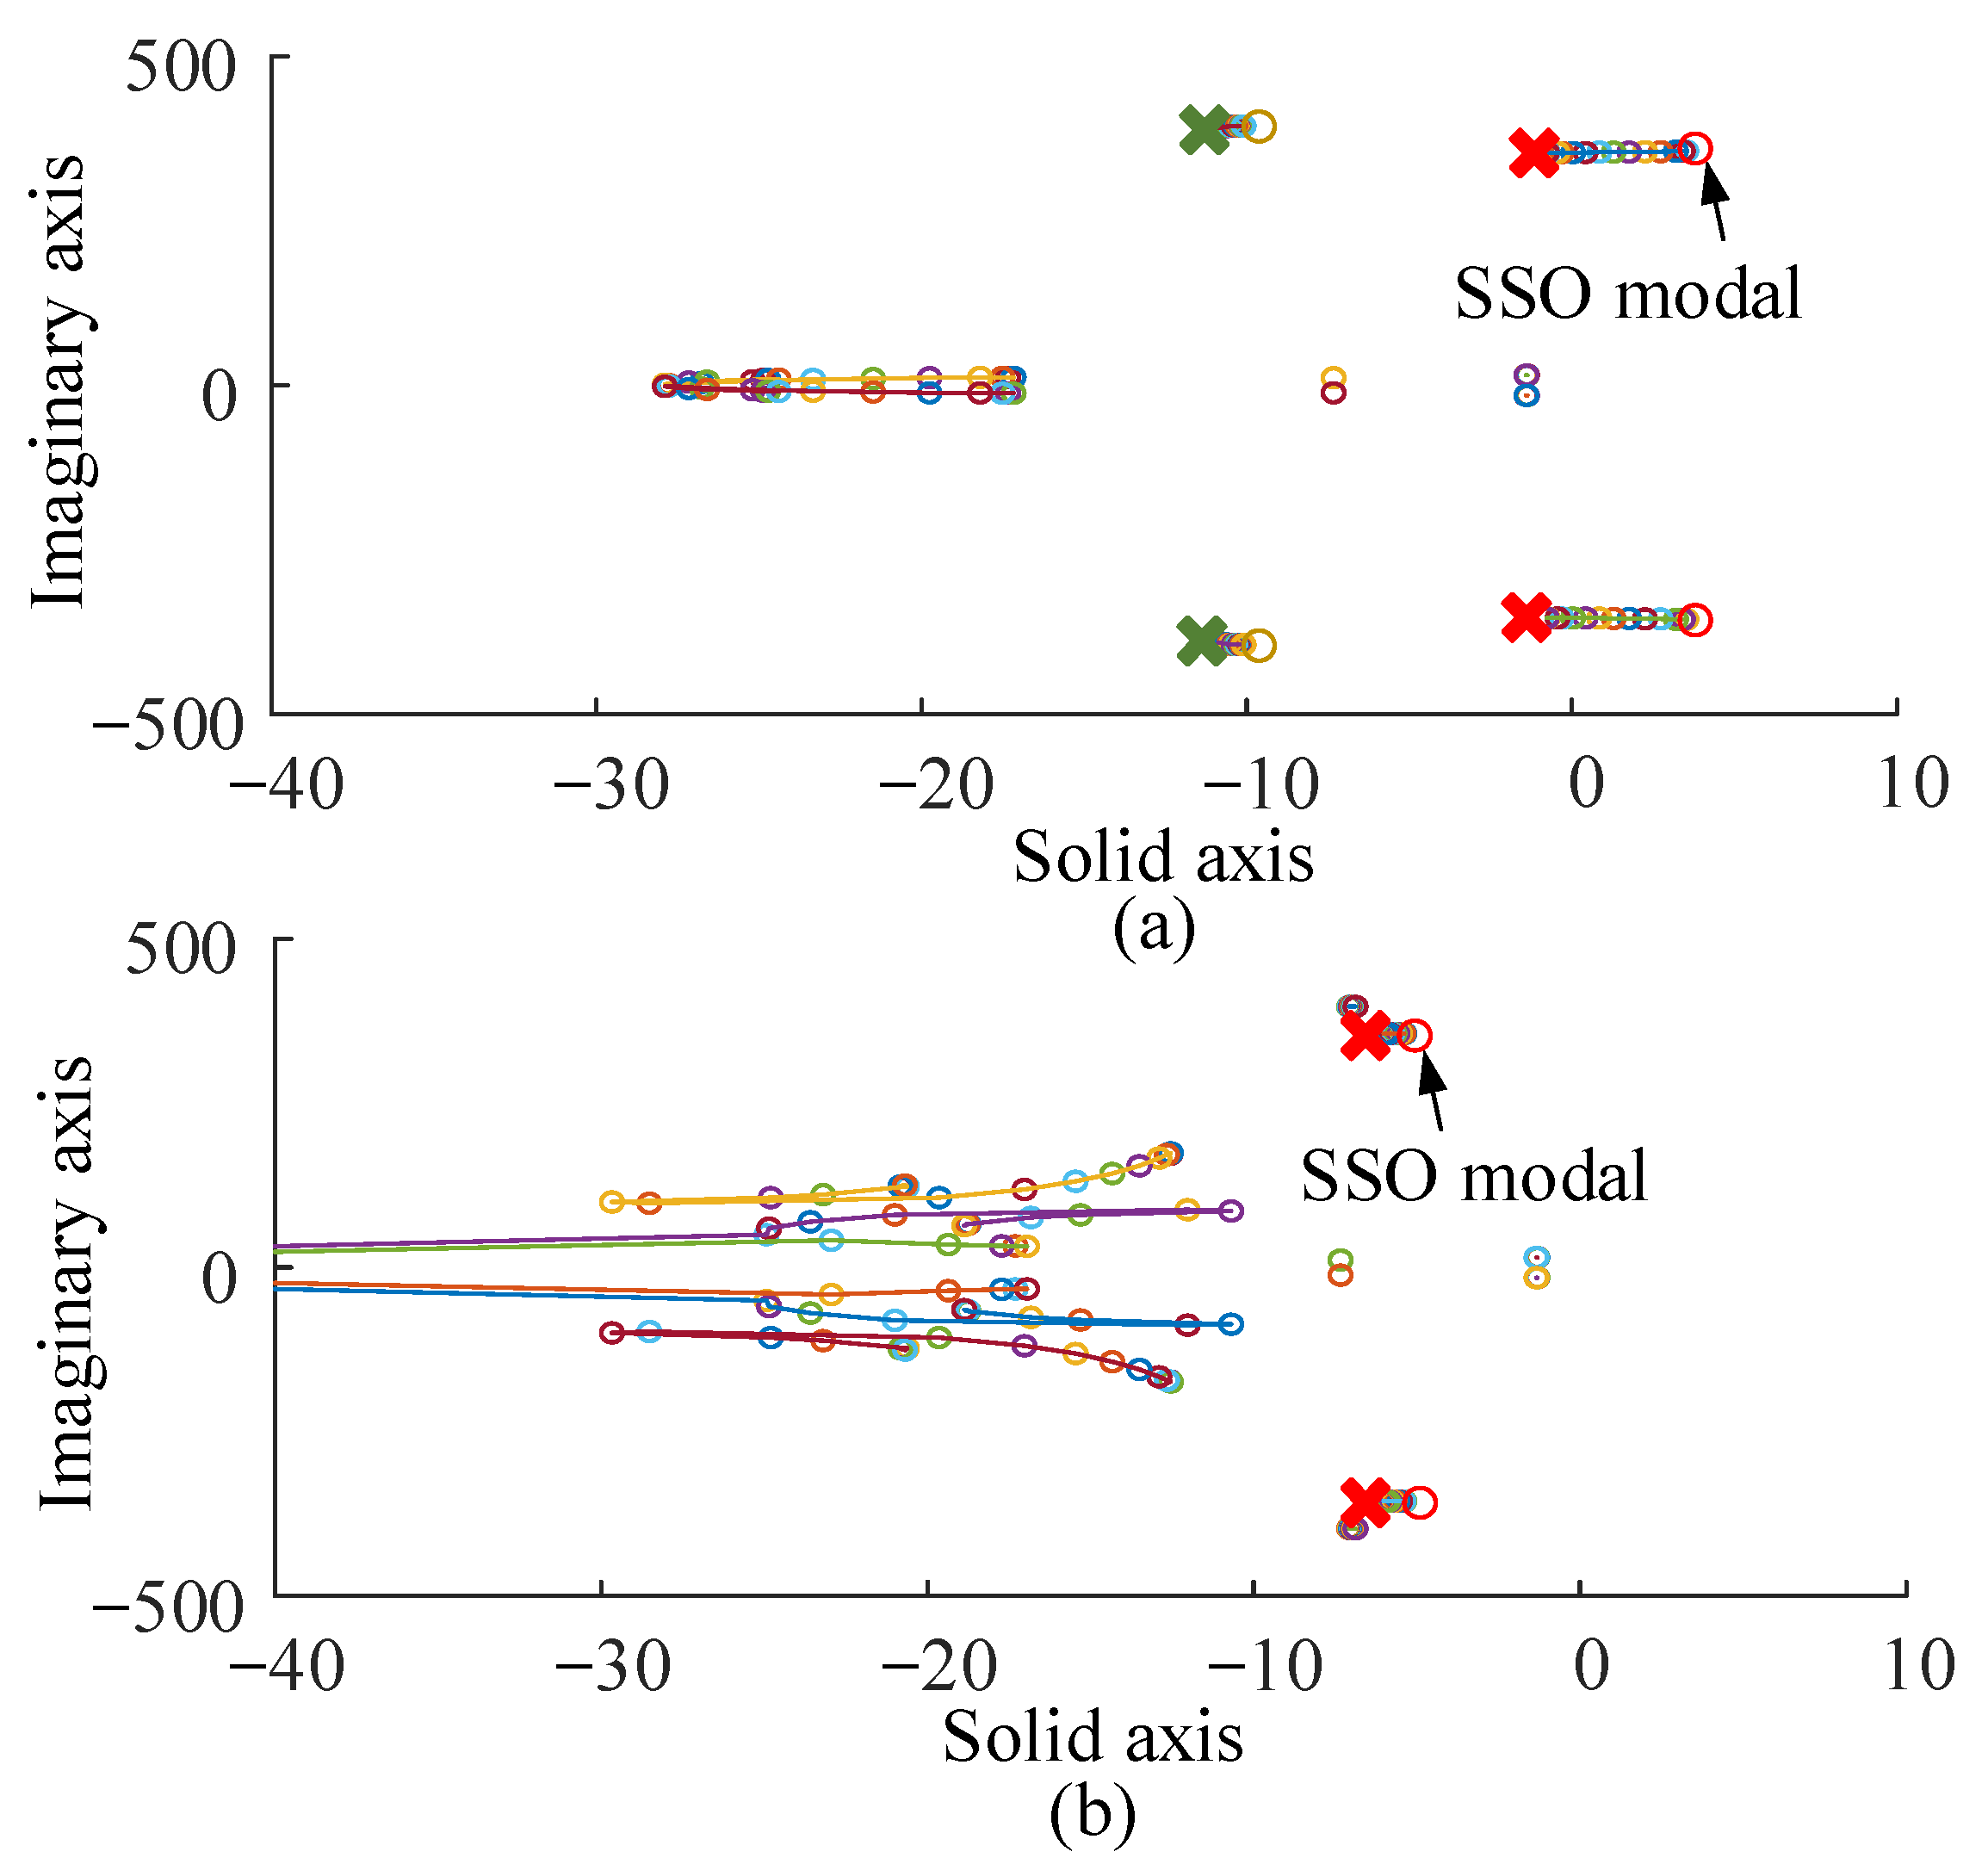
In order to verify the performance of the improved SSDC3, the DFIG connected series compensated transmission system in Figure 1 is used, the system is modelled in Matlab/Simulink, and the state space model of the system is established in the script file. As the system stability is closely related to the compensation level, the compensation level is gradually increased from 10% to 80% with the wind speed fixed at 5 m/s. Figure 14a shows the root locus of the system after applying the improved SSDC3, and Figure 14b shows the root locus of the original SSDC3. When the compensation level increases, the resonance frequency of the system changes and the SSO mode moves toward the right-half plane accordingly. Due to the application of SSDCs, the right-shift trends of the two root loci are suppressed. Although the original SSDC3 selects ζ = 2 to improve the damping in the entire subsynchronous frequency band, it still has limitations. That is because when the compensation level increases significantly, the oscillation frequency changes a lot, and the resistance increment at the oscillation frequency is low, which is insufficient to offset the negative resistance. In addition, the larger ζ changes the impedance characteristics of the system outside the target frequency band. When it comes to the improved method, the ERA frequency extraction module adaptively selects the real-time SSO frequency and the frequency is provided to the BPF; thus, it achieves accurate mitigation.
To study the influence of the wind speed, the compensation level is fixed at 40%, and the wind speed is decreased from 13 m/s to 5 m/s. Figure 15a shows the root locus of the system without the damping controller, and Figure 15b shows the root locus of the system with the improved damping controller. It can be seen that the SSO modes in both cases move toward the right-half plane; however, the root of the case with the improved damping controller moves slowly and does not enter the right-half plane, which indicates a stable condition. The result indicates that a lower wind speed will make the system more unstable and adding the proposed damping controller can improve the stability and robustness of the system.

4.2. Hardware-in-the-Loop Experiment

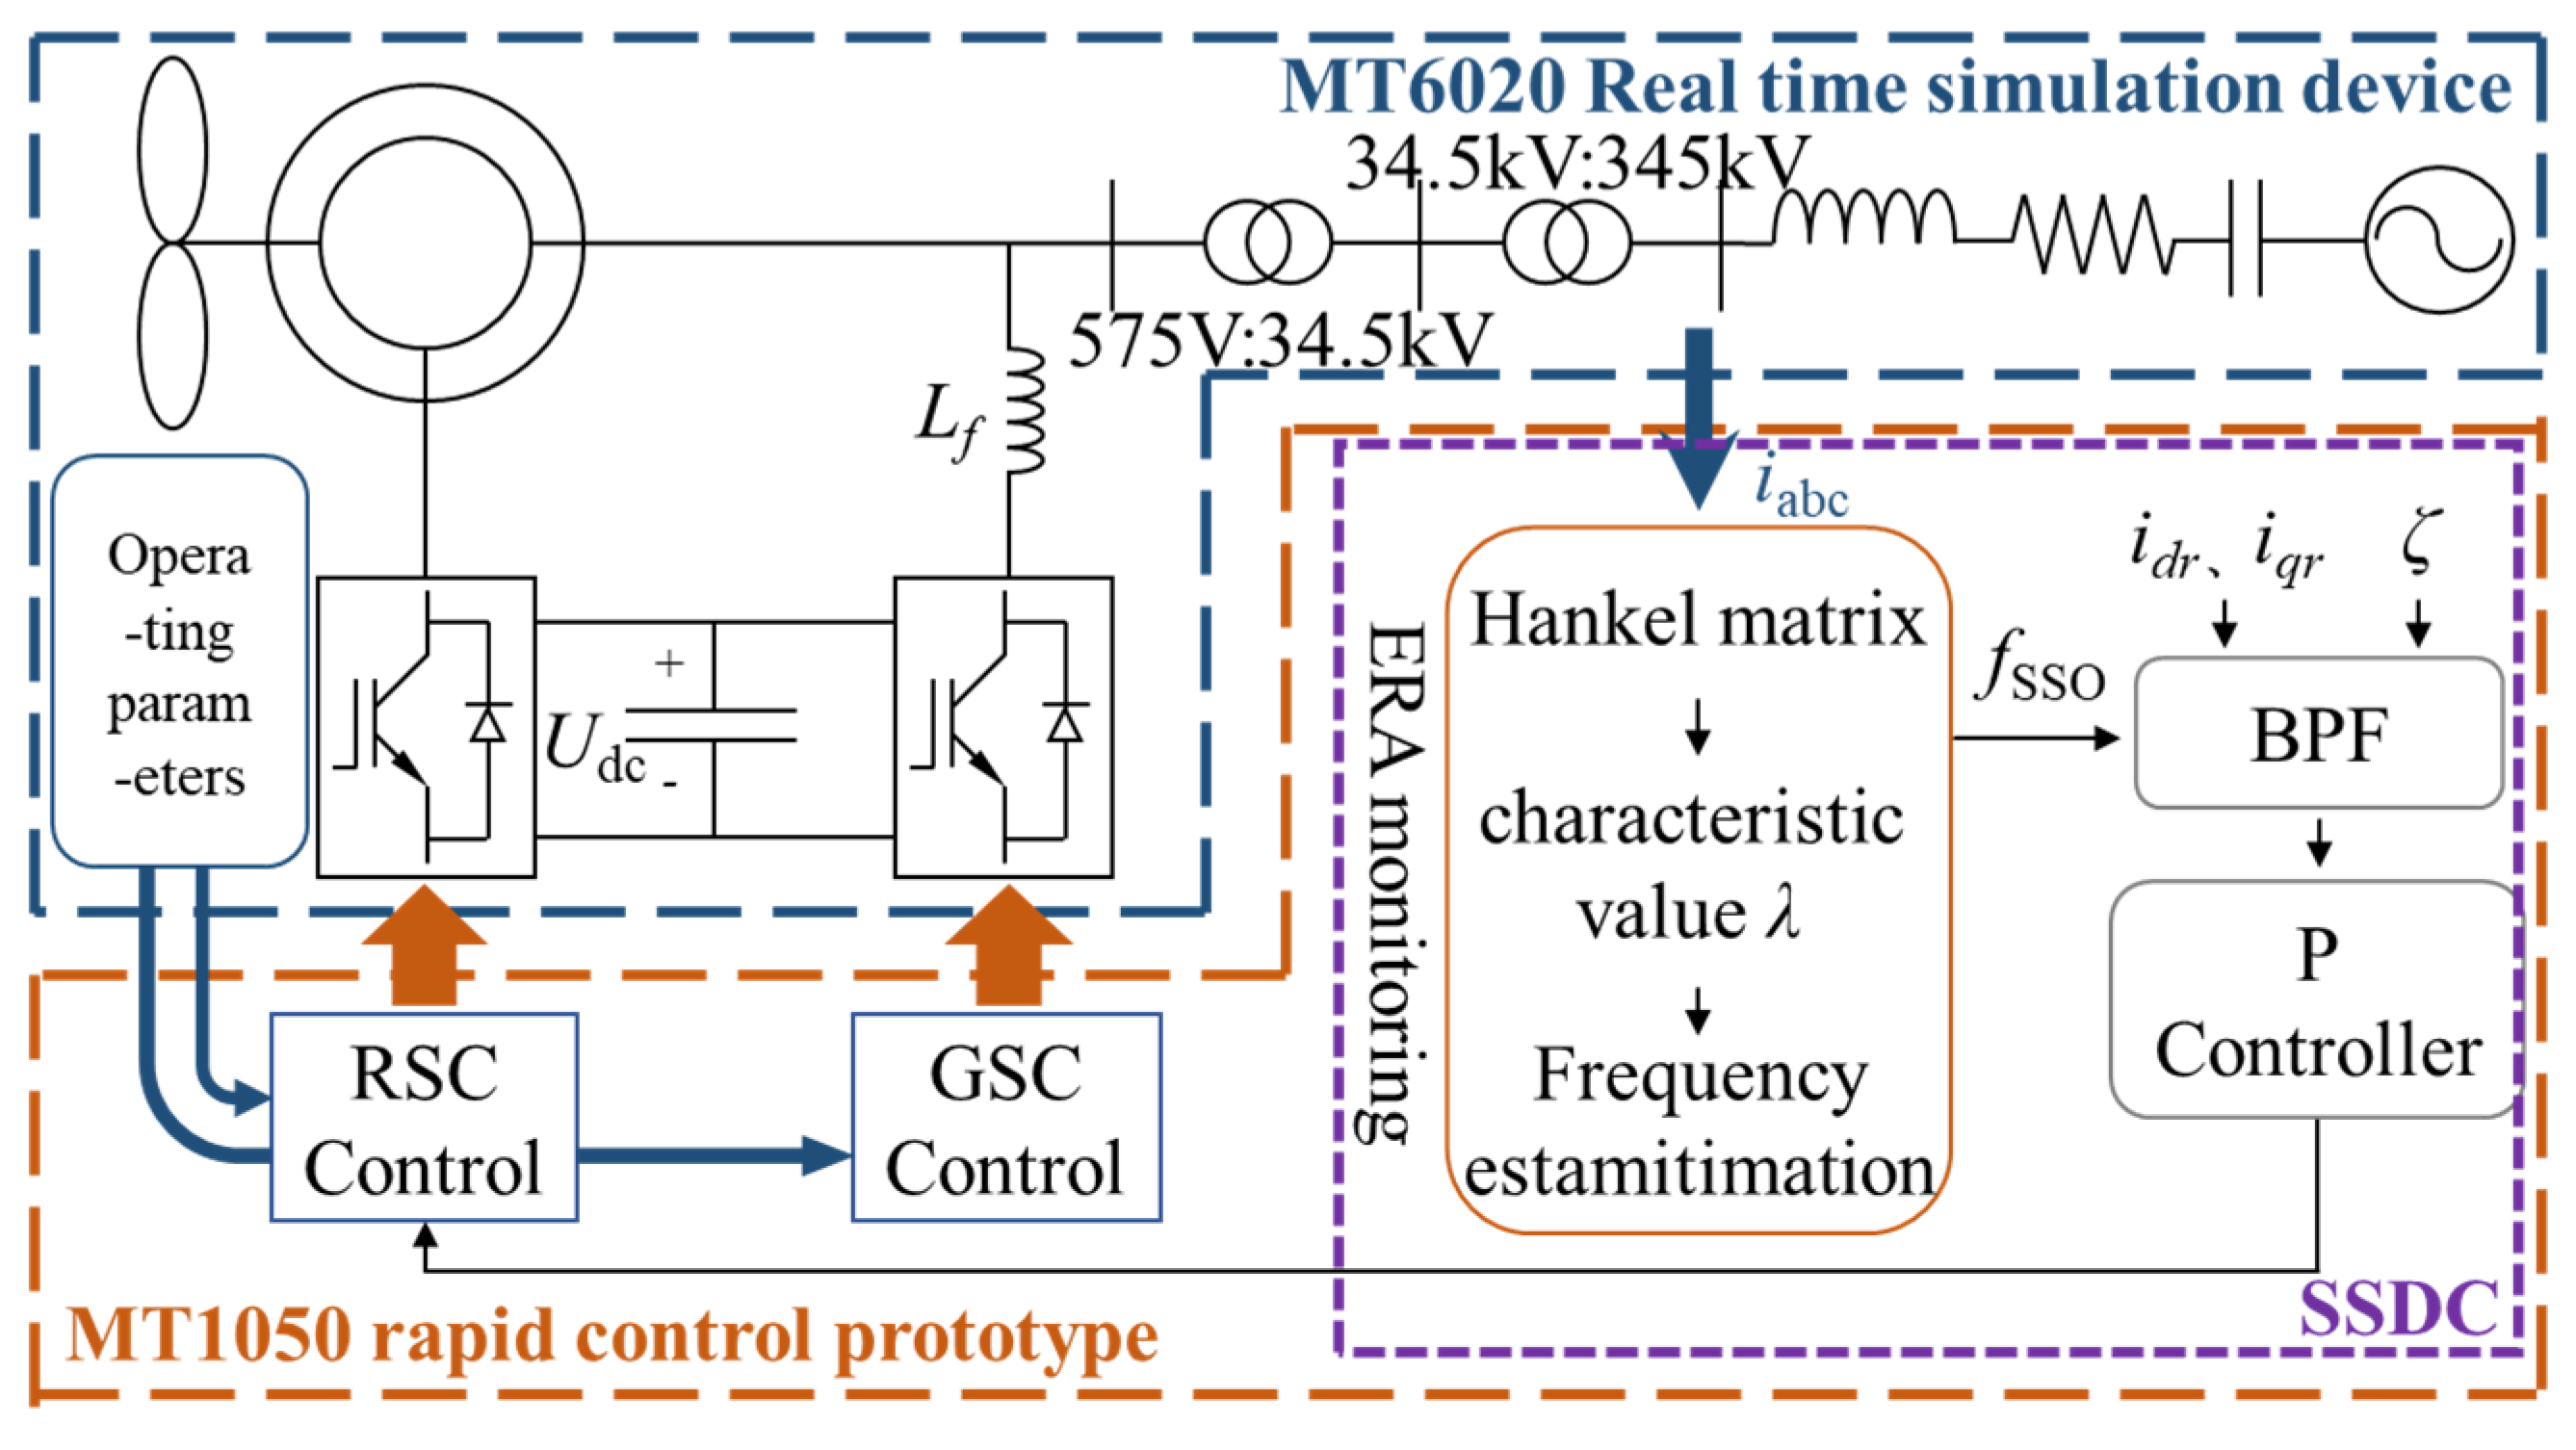
This section verifies the robustness and dynamic performance of the improved mitigation method through hardware-in-the-loop experiments, as shown in Figure 16.
The hardware-in-the-loop experiment is completed through the real-time information interaction between the MT6020 real-time simulation device and the MT1050 rapid control prototype (RCP). The schematic diagram is shown in Figure 17. The system model in Figure 1 is modelled in the MT6020 simulation device, while the RSC, GSC controller, and SSDC are modelled in the MT1050 RCP, where the step of the MT6020 is 1 μs and the step of the MT1050 is 50 μs. The models are converted to the C programming language and downloaded to the simulation devices mentioned above. The current and voltage analogue signals output from the MT6020 are sent to the MT1050 RCP, and the signals are fed back to the RSC and GSC to control the DFIG after processing. In the SSDC part, the ERA algorithm extracts the oscillation components in the three-phase voltage and current signals output by the DFIG in real time and transfers the frequency information to the BPF. The extracted oscillation signals are processed by the proportional controller and added to the RSC voltage loop.
(1)
SSO mitigation performance test
In this case, the wind speed is set at 8 m/s, the initial compensation level is 10%, and the DFIG operates normally and stably. At t2 = 8 s, the compensation level is increased to 60%, and SSO is triggered with a 19 Hz oscillation frequency. Figure 18 shows the DFIG power waveform after applying three kinds of mitigation methods. It can be seen that all methods are able to effectively mitigate SSO, while the proposed method has the minimum overshoot and the shortest adjustment time.
(2)
Dynamic performance test—three-phase fault test
The wind power generation system must keep online when a fault causes the voltage drop. When t3 = 8 s, the three-phase grounding short-circuit fault occurs on one of the double circuit transmission lines of the system, and the fault line is cleared after 100 ms. In this case, the three-phase voltage is reduced to 33% of the rated voltage. Figure 19 shows the waveforms of the phase A current, phase A voltage, and power. The simulation results show that SSDC2 and SSDC3 do not affect the low voltage ride-through capability of DFIGs, because they only work in the subsynchronous frequency range. As a result, they do not affect the dynamic characteristics of the fundamental frequency, while SSDC1 has a short power fluctuation during fault.

5. Conclusions

In this paper, three typical SSDCs are compared and the best SSDC is selected and further improved. The effectiveness of the improved SSDC is verified by a multi-dimensional analysis. The specific conclusions are summarized as follows.
(1)
Three widely accepted SSDCs are compared, and the results show that SSDC3 based on the rotor current feedback performs best regarding mitigation performance, robustness, application range, and accessibility. The verification study indicates that SSDC3 performs well for 100% of working conditions in the simulation, while for SSDC1 and SSDC2, the number is 60% and 94%, respectively.
(2)
This paper analyses the influence of the SSDC3 control parameters on its mitigation performance and system stability. The results show that the proportional gain coefficient kp3 plays an essential role in the SSO mitigation performance and system stability. Selecting too large or too small a kp3 can both lead to instability. Therefore, suggestions are provided for the design of the controller parameters.
(3)
An adaptive BPF frequency selection method based on the ERA algorithm is proposed, which can accurately track the SSO frequency within 5~45 Hz to make the BPF centre frequency consistent with the oscillation frequency, so as to completely extract the oscillation component and avoid phase compensation.
(4)
The performance of the improved SSDC is verified by the root locus analysis and hardware-in-the-loop experiment. The results show that the proposed method has the optimal performance in SSO mitigation and does not affect the normal operation of the DFIG.

Author Contributions

Methodology, S.X., P.S. and H.Y.; validation, S.X., X.W. and H.Y.; writing, S.X., P.S. and C.W.; funding acquisition, S.X. and X.W.; resources, P.S. and X.W.; data curation, S.X., P.S. and X.W. All authors have read and agreed to the published version of the manuscript.

Funding

This work is supported by Science and Technology Project of State Grid (52660021000P).

Institutional Review Board Statement

Not applicable.

Informed Consent Statement

Not applicable.

Data Availability Statement

The data are available upon request from the corresponding author.

Conflicts of Interest

The authors declare no conflict of interest.

Abbreviations

SSDCsubsynchronous damping controller
SSOsubsynchronous oscillation
SupSOsupersynchronous oscillation
DFIGdoubly fed induction generator
FACTSflexible AC transmission systems
ERCOTelectric reliability council of Texas
RMSroot mean square
GSCgrid side converter
RSCrotor-side converter
ERAeigensystem realization algorithm
BPFband-pass filter
MMACmultiple-model adaptive control
FFTfast Fourier transform
RCPrapid control prototype
Symbols
VCcompensation capacitor voltage
ωrrotor speed
idrd-axis rotor current
iqrq-axis rotor current
rrDFIG rotor resistance
xrDFIG rotor reactance
rsDFIG stator resistance
xsDFIG stator reactance
rTconverted resistance of transformers
rLconverted resistance of lines
xTconverted reactance of transformers
xLconverted reactance of lines
xmexcitation reactance
kpR3proportional gain coefficient of RSC
Δvsmall disturbance in RSC voltage
sslip of asynchronous motor
ωsynchronization frequency
vdr*d-axis original RSC voltage
vqr*q-axis original RSC voltage
fSSOsubsynchronous frequency
kp3proportional coefficient of controller
ki3integral coefficient of controller
kd3differential coefficient of controller
f0frequency of the supersynchronous mode
fSSOfrequency of the supersynchronous mode
Sfilterstate variable of the second-order BPF
Δφdsd-axis flux linkage of stator
Δφqsq-axis flux linkage of stator
Δφdrd-axis flux linkage of rotor
Δφqrq-axis flux linkage of rotor
fncentre frequency of BPF
ζDamping of BPF
ωnAngular frequency corresponding to the BPF center frequency

Appendix A

Table A1. Parameters of a DFIG wind turbine connected to the series compensated line.
ParameterValue (SI)Per-Unit (pu)
Rated power1.5 MW0.9
DC-link voltage1150 V
Rated voltage575 V1
Nominal frequency60 Hz1
Lls, rs134 μH, 3.25 mΩ0.2552, 0.01638
Llr, rr117 μH, 3.62 mΩ0.2222, 0.01827
Lm8.27 mH15.71
Inertial, friction factor, poles0.685 0.01 3
Lline, Rline69 mH, 2.26 Ω
Current control (GSC) Kpig = 0.2, kiig = 5
DC-link control Kpdc = 0.4, kidc = 5
Current control (RSC) Kpir = 0.6, kiir = 5
Q control Kpp = 0.02, kip = 0.08
Transformer T1(34.5kV)31.6 μH, 1.2 mΩ0.002, 0.0002
Transformer T2(345kV)3.16 mH, 0.12 Ω0.002, 0.0002
Table A2. State variables and their impact factors of dominant mode of filter–SSO when kp3 = 0.15.
ParameterValueParameterValueParameterValueParameterValue
Sfilter10.091Sfilter20.175Sfilter30.088Sfilter40.170
Δφds0.0335Δφqs0.0333Δφdr0.1388Δφqr0.1433
ΔVCd0.0374ΔVCq0.0374ΔId0.0123ΔIq0.0122
Table A3. Selecting guidelines of the SSDC parameters.
ParametersNotesOptimal Choice
kp3Setting kp3 too small will not provide enough damping
Setting kp3 too large will cause instability
Increasing from kpR3 until meeting the system stability requirements
ζζ = 0.4 is the recommended valueFixed at 0.4
SSO frequencyObtained by the adaptive frequency selectionAdaptive frequency selection

References

  1. He, Y.; Huang, P. Exploring the Forms of the Economic Effects of Renewable Energy Consumption: Evidence from China. Sustainability 2022, 14, 8212. [Google Scholar] [CrossRef]
  2. Alasali, F.; Salameh, M.; Semrin, A.; Nusair, K.; El-Naily, N.; Holderbaum, W. Optimal Controllers and Configurations of 100% PV and Energy Storage Systems for a Microgrid: The Case Study of a Small Town in Jordan. Sustainability 2022, 14, 8124. [Google Scholar] [CrossRef]
  3. Worku, M.Y. Recent Advances in Energy Storage Systems for Renewable Source Grid Integration: A Comprehensive Review. Sustainability 2022, 14, 5985. [Google Scholar] [CrossRef]
  4. Tummala, A.S. A robust composite wide area control of a DFIG wind energy system for damping inter-area oscillations. Prot. Control. Mod. Power Syst. 2020, 5, 260–269. [Google Scholar] [CrossRef]
  5. Xie, X.; Dong, Y.; Han, Y. Online estimation of turbine–generator shaft fatigue loss-of-life caused by subsynchronous resonance. Electr. Power Syst. Res. 2012, 192, 171–179. [Google Scholar] [CrossRef]
  6. Trevisan, A.; Mendonça, A.; Gagnon, R.; Fecteau, M.; Mahseredjian, J. Assessment of interactions involving wind farms in large-scale grids. Electr. Power Syst. Res. 2021, 196, 107220. [Google Scholar] [CrossRef]
  7. Liu, H.; Xie, X.; He, J.; Xu, T.; Yu, Z.; Wang, C.; Zhang, C. Subsynchronous Interaction Between Direct-Drive PMSG Based Wind Farms and Weak AC Networks. IEEE Trans. Power Syst. 2017, 32, 4708–4720. [Google Scholar] [CrossRef]
  8. Xu, S.; Wang, Y.; Xiao, X.; Wu, J.; Lv, W. Non-Characteristic Harmonic Resonance in LCC-HVDC Terminals: A Practical Case Study. Int. Trans. Electr. Energy Syst. 2021, 31, e12743. [Google Scholar] [CrossRef]
  9. Xie, X.; Zhan, Y.; Liu, H.; Li, W.; Wu, C. Wide-area monitoring and early-warning of subsynchronous oscillation in power systems with high-penetration of renewables. Int. J. Electr. Power Energy Syst. 2019, 108, 31–39. [Google Scholar] [CrossRef]
  10. Shim, K.S.; Kim, S.T.; Lee, J.H.; Choi, E.; Choi, J. Detection of low-frequency oscillation using synchrophasor in wide-area rolling blackouts. Int. J. Electr. Power Energy Syst. 2014, 63, 1015–1022. [Google Scholar] [CrossRef]
  11. Rauhala, T.; Gole, A.M.; Jarventausta, P. Detection of subsynchronous torsional oscillation frequencies using phasor measurement. IEEE Trans. Power Deliv. 2016, 31, 11–19. [Google Scholar] [CrossRef]
  12. Wu, X.; Wang, M.; Shahidehpour, M.; Feng, S.; Chen, X. Model-Free Adaptive Control of STATCOM for SSO Mitigation in DFIG-Based Wind Farm. IEEE Trans. Power Syst. 2021, 36, 5282–5293. [Google Scholar] [CrossRef]
  13. Shair, J.; Xie, X.; Li, Y.; Terzija, V. Hardware-in-the-Loop and Field Validation of a Rotor-Side Subsynchronous Damping Controller for a Series Compensated DFIG System. IEEE Trans. Power Deliv. 2020, 36, 698–709. [Google Scholar] [CrossRef]
  14. Ali, M.T.; Zhou, D.; Song, Y.; Ghandhari, M.; Harnefors, L.; Blaabjerg, F. Analysis and Mitigation of SSCI in DFIG Systems With Experimental Validation. IEEE Trans. Energy Convers. 2020, 35, 714–723. [Google Scholar] [CrossRef]
  15. Chowdhury, M.A.; Mahmud, M.A.; Shen, W.; Pota, H.R. Nonlinear Controller Design for Series-Compensated DFIG-Based Wind Farms to Mitigate Subsynchronous Control Interaction. IEEE Trans. Energy Convers. 2017, 32, 707–719. [Google Scholar] [CrossRef]
  16. Chowdhury, M.A.; Shafiullah, G.M. SSR Mitigation of Series-Compensated DFIG Wind Farms by a Nonlinear Damping Controller Using Partial Feedback Linearization. IEEE Trans. Power Syst. 2018, 33, 2528–2538. [Google Scholar] [CrossRef]
  17. Wang, Y.; Wu, Q.; Yang, R.; Tao, G.; Liu, Z. H∞ current damping control of DFIG based wind farm for sub-synchronous control interaction mitigation. Int. J. Power Energy Syst. 2018, 98, 509–519. [Google Scholar] [CrossRef]
  18. Fan, L.; Miao, Z. Mitigating SSR Using DFIG-Based Wind Generation. IEEE Trans. Sustain. Energy 2012, 3, 349–358. [Google Scholar] [CrossRef]
  19. Yao, J.; Wang, X.; Li, J.; Liu, R.; Zhang, H. Sub-Synchronous Resonance Damping Control for Series-Compensated DFIG-Based Wind Farm With Improved Particle Swarm Optimization Algorithm. IEEE Trans. Energy Convers. 2019, 34, 849–859. [Google Scholar] [CrossRef]
  20. Li, Y.; Fan, L.; Miao, Z. Replicating Real-World Wind Farm SSR Events. IEEE Trans. Power Deliv. 2020, 35, 339–348. [Google Scholar] [CrossRef]
  21. Ghaffarzdeh, H.; Mehrizi-Sani, A. Mitigation of Subsynchronous Resonance Induced by a Type III Wind System. IEEE Trans. Sustain. Energy 2020, 11, 1717–1727. [Google Scholar] [CrossRef]
  22. Wang, L.; Xie, X.; Jiang, Q.; Liu, H.; Liu, H.; Li, Y. Investigation of SSR in Practical DFIG-Based Wind Farms Connected to a Series-Compensated Power System. IEEE Trans. Power Syst. 2015, 30, 2772–2779. [Google Scholar] [CrossRef]
  23. Salehi, F.; Matsuo, I.B.M.; Lee, W.-J. Detection of Sub-Synchronous Control Interaction (SSCI) Using Modal Identification Analysis and FFT. In Proceedings of the 2018 North American Power Symposium (NAPS), Fargo, ND, USA, 9–11 September 2018; pp. 1–5. [Google Scholar]
  24. Salehi, F.; Matsuo, I.B.M.; Brahman, A.; Tabrizi, M.A.; Lee, W.-J. Sub-Synchronous Control Interaction Detection: A Real-Time Application. IEEE Trans. Power Deliv. 2020, 35, 106–116. [Google Scholar] [CrossRef]
  25. Beza, M.; Bongiorno, M. A modifified RLS algorithm for online estimation of low-frequency oscillations in power systems. IEEE Trans. Power Syst. 2016, 31, 1703–1714. [Google Scholar] [CrossRef]
  26. Gao, B.; Torquato, R.; Xu, W.; Freitas, W. Waveform-Based Method for Fast and Accurate Identification of Subsynchronous Resonance Events. IEEE Trans. Power Syst. 2019, 34, 3626–3636. [Google Scholar] [CrossRef]
  27. Wang, Y.; Yang, H.; Xie, X.; Yang, X.; Chen, G. Real-Time Subsynchronous Control Interaction Monitoring using Improved Intrinsic Time-Scale Decomposition. J. Mod. Power Syst. Clean Energy 2022. early access. [Google Scholar]
  28. Yang, W.; Jiang, X.; Xie, X.; Yang, X.; Xiao, X. Identifying Sources of Subsynchronous Resonance Using Wide-Area Phasor Measurements. IEEE Trans. Power Deliv. 2021, 36, 3242–3254. [Google Scholar]
  29. Yang, X.; Zhang, J.; Xie, X.; Xiao, X.; Gao, B.; Wang, Y. Interpolated DFT-Based Identification of Sub-Synchronous Oscillation Parameters Using Synchrophasor Data. IEEE Trans. Smart Grid 2020, 11, 2662–2675. [Google Scholar] [CrossRef]
  30. Chen, L.; Zhao, W.; Wang, F.; Wang, Q.; Huang, S. An Interharmonic Phasor and Frequency Estimator for Subsynchronous Oscillation Identification and Monitoring. IEEE Trans. Instrum. Meas. 2019, 68, 1714–1723. [Google Scholar] [CrossRef] [Green Version]
Figure 1. Topology of DFIG wind turbines connected to the series compensation line.
Sustainability 14 13095 g001
Figure 2. Structure and embedding points of three SSDCs: (a) RSC control loop and the structure of SSDC2 and SSDC3; (b) GSC control loop and the structure of SSDC1. Where, the signal with superscript * represents the reference value of the corresponding signal.
Sustainability 14 13095 g002
Figure 3. (a): Mitigation performances of three SSDCs when increasing compensation level from 10% to 50%; (b): root loci of three SSDCs when the compensation level increases from 10% to 50%, where the “+” denotes the starting point and the “O” denotes the ending point.
Sustainability 14 13095 g003
Figure 4. The mitigation range of three SSDCs.
Sustainability 14 13095 g004
Figure 5. Equivalent model of DFIG.
Sustainability 14 13095 g005
Figure 6. D-axis output signal and SSO component in vdr*.
Sustainability 14 13095 g006
Figure 7. Impedance model of the system at different kp3.
Sustainability 14 13095 g007
Figure 8. Root locus diagram when kp3 increases from 0 to 1.2, where the “+” denotes the starting point and the “O” denotes the ending point.
Sustainability 14 13095 g008
Figure 9. Frequency tracking performance of three oscillation monitoring algorithms.
Sustainability 14 13095 g009
Figure 10. Power oscillation waveform (ζ = 0.1~2).
Sustainability 14 13095 g010
Figure 11. Diagram of resistance increments of the system when ζ = 0.4~0.8.
Sustainability 14 13095 g011
Figure 12. The structure of the improved SSDC3.
Sustainability 14 13095 g012
Figure 13. The current waveform and SSO frequency.
Sustainability 14 13095 g013
Figure 14. Root locus diagram when the compensation level increases from 10% to 80%, where (a) and (b) represent the root loci of the added improved and original SSDC3, respectively, and the “+” denotes the starting point and the “O” denotes the ending point.
Sustainability 14 13095 g014
Figure 15. Root locus diagram when the wind speed decreases from 13 m/s to 5 m/s, where (a) and (b) represent the root loci without and with the improved SSDC3, respectively, and the “+” denotes the starting point and the “O” denotes the ending point.
Sustainability 14 13095 g015
Figure 16. The StarSim HIL hardware-in-the-loop experimental platform.
Sustainability 14 13095 g016
Figure 17. Schematic diagram of hardware-in-the-loop experiment of improved SSDC3 based on the ERA algorithm.
Sustainability 14 13095 g017
Figure 18. Mitigation performance of the three SSDCs.
Sustainability 14 13095 g018
Figure 19. Low voltage ride-through performance of DFIG with three SSDCs.
Sustainability 14 13095 g019
Publisher’s Note: MDPI stays neutral with regard to jurisdictional claims in published maps and institutional affiliations.