
Type Identification of Land Use in Metro Station Area Based on Spatial–Temporal Features Extraction of Human Activities

Abstract
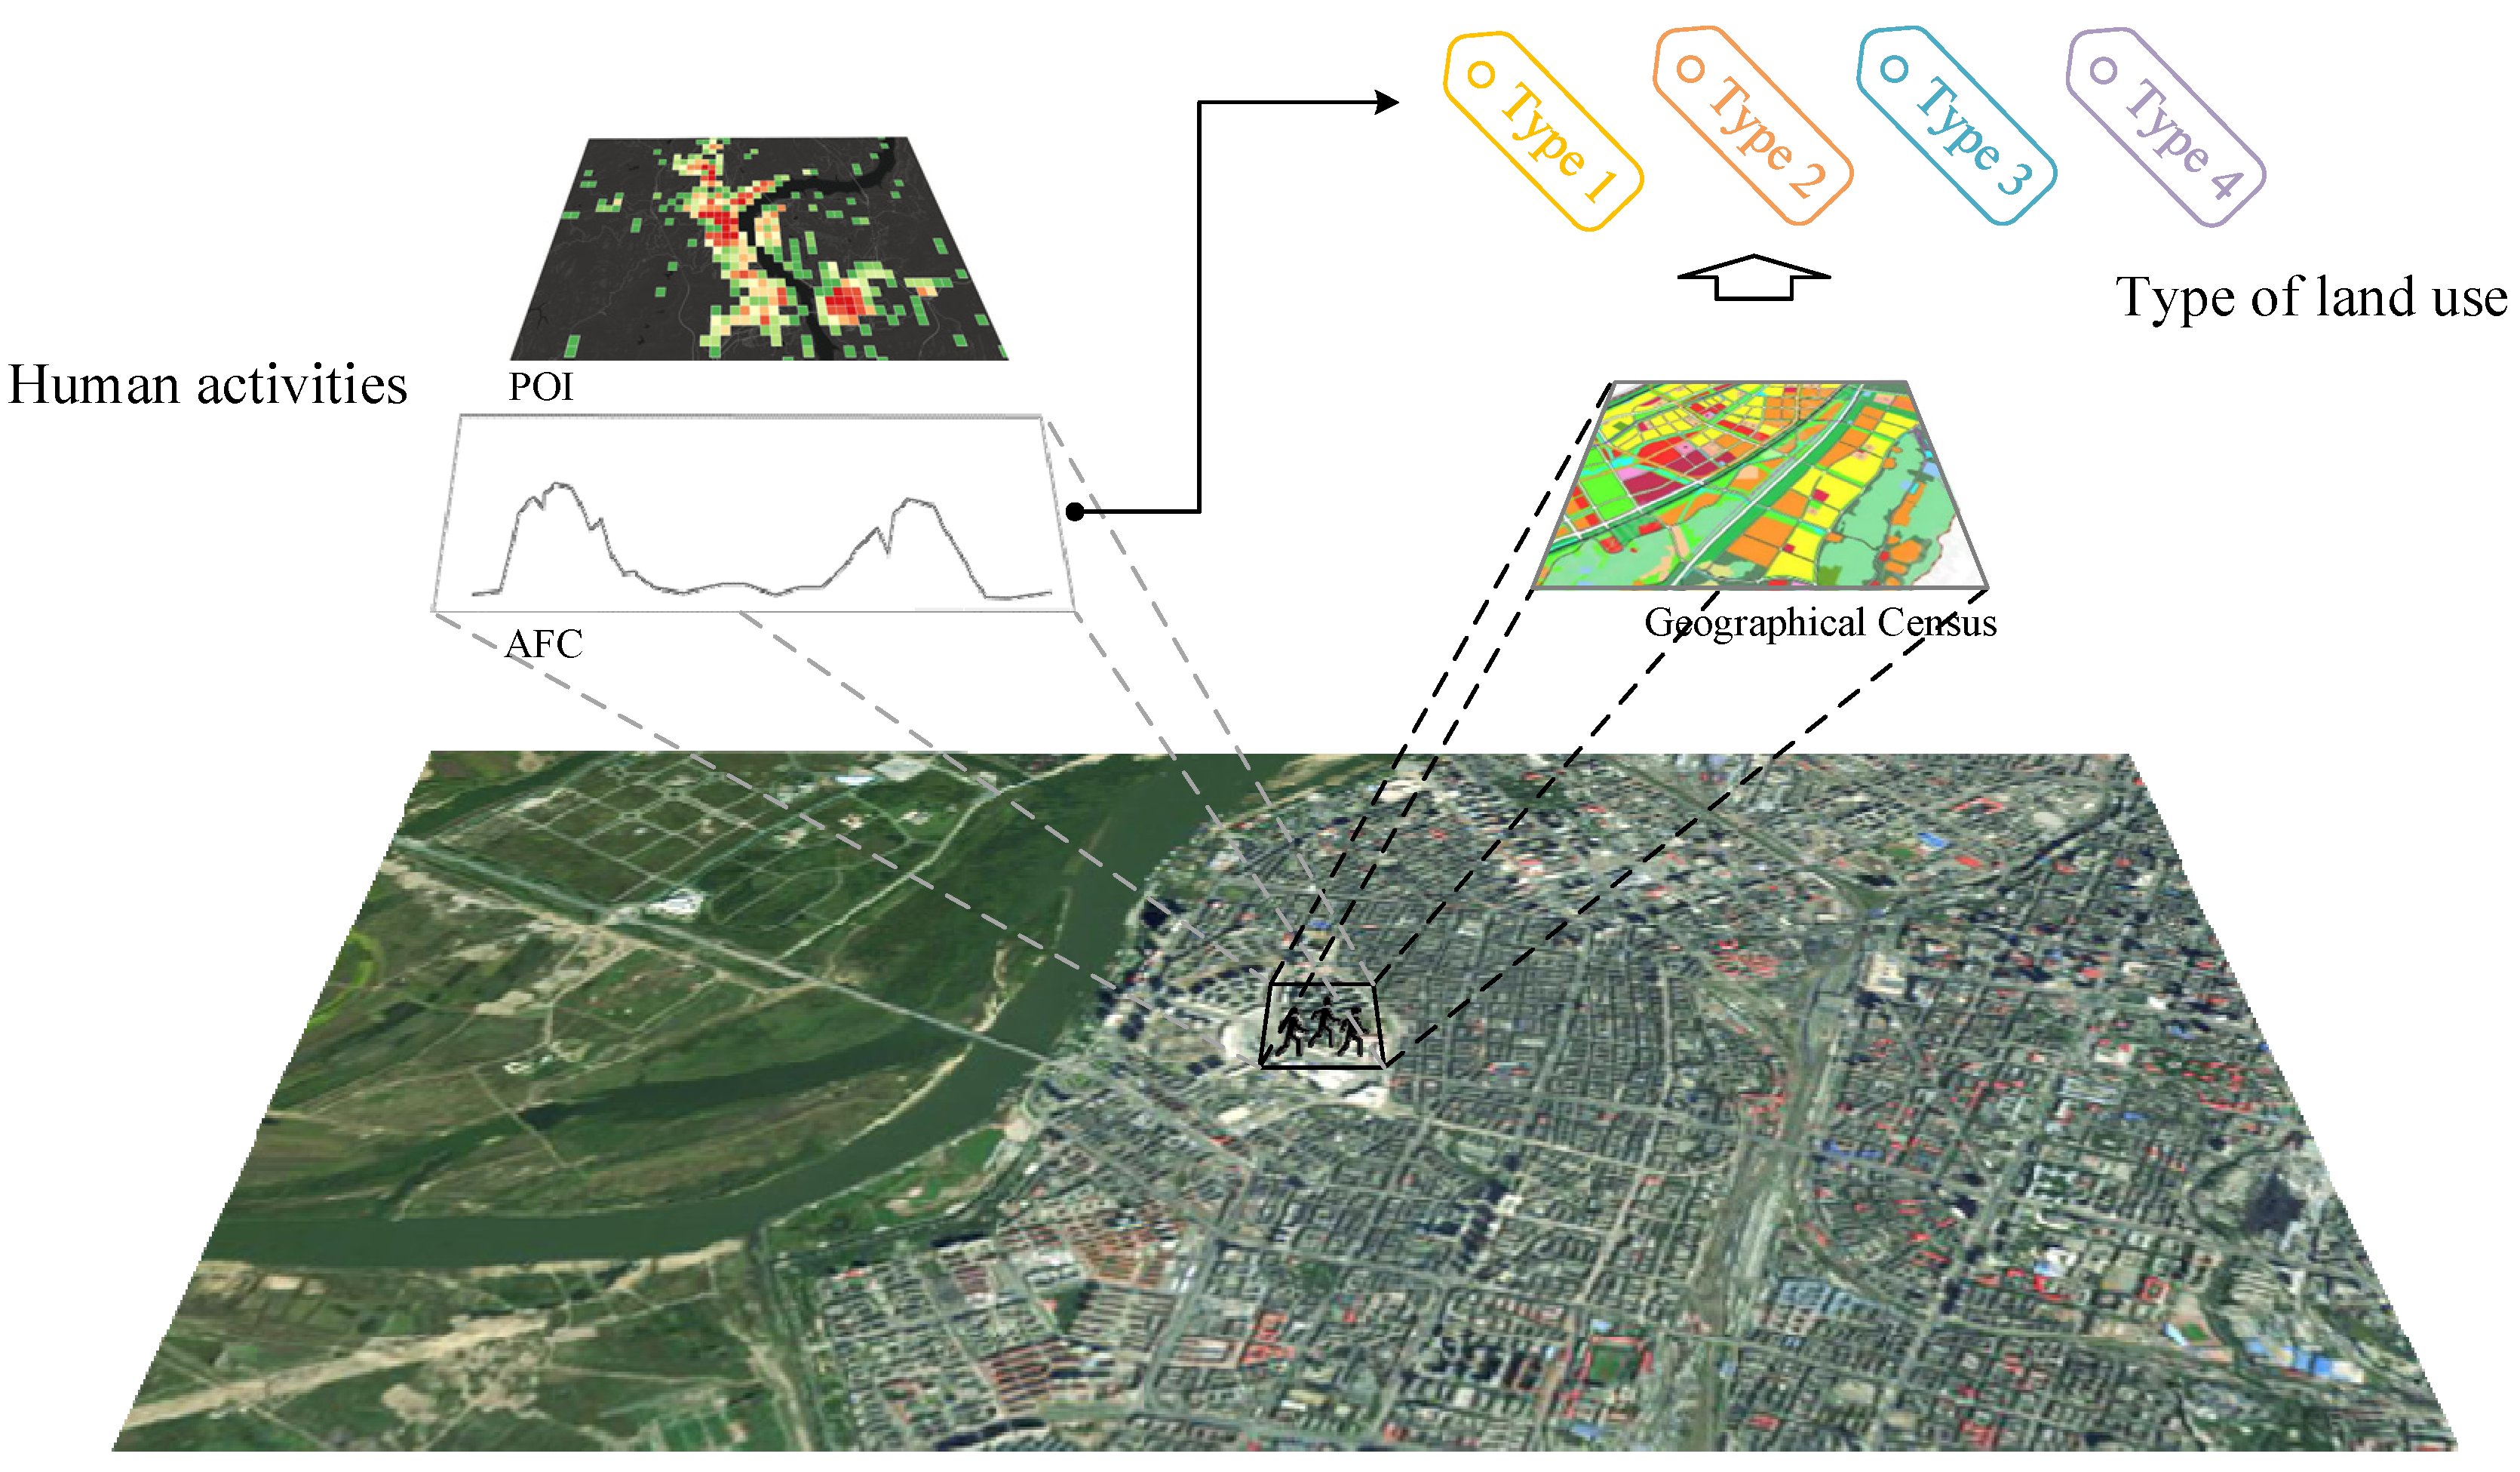
:1. Introduction
2. Data Collection
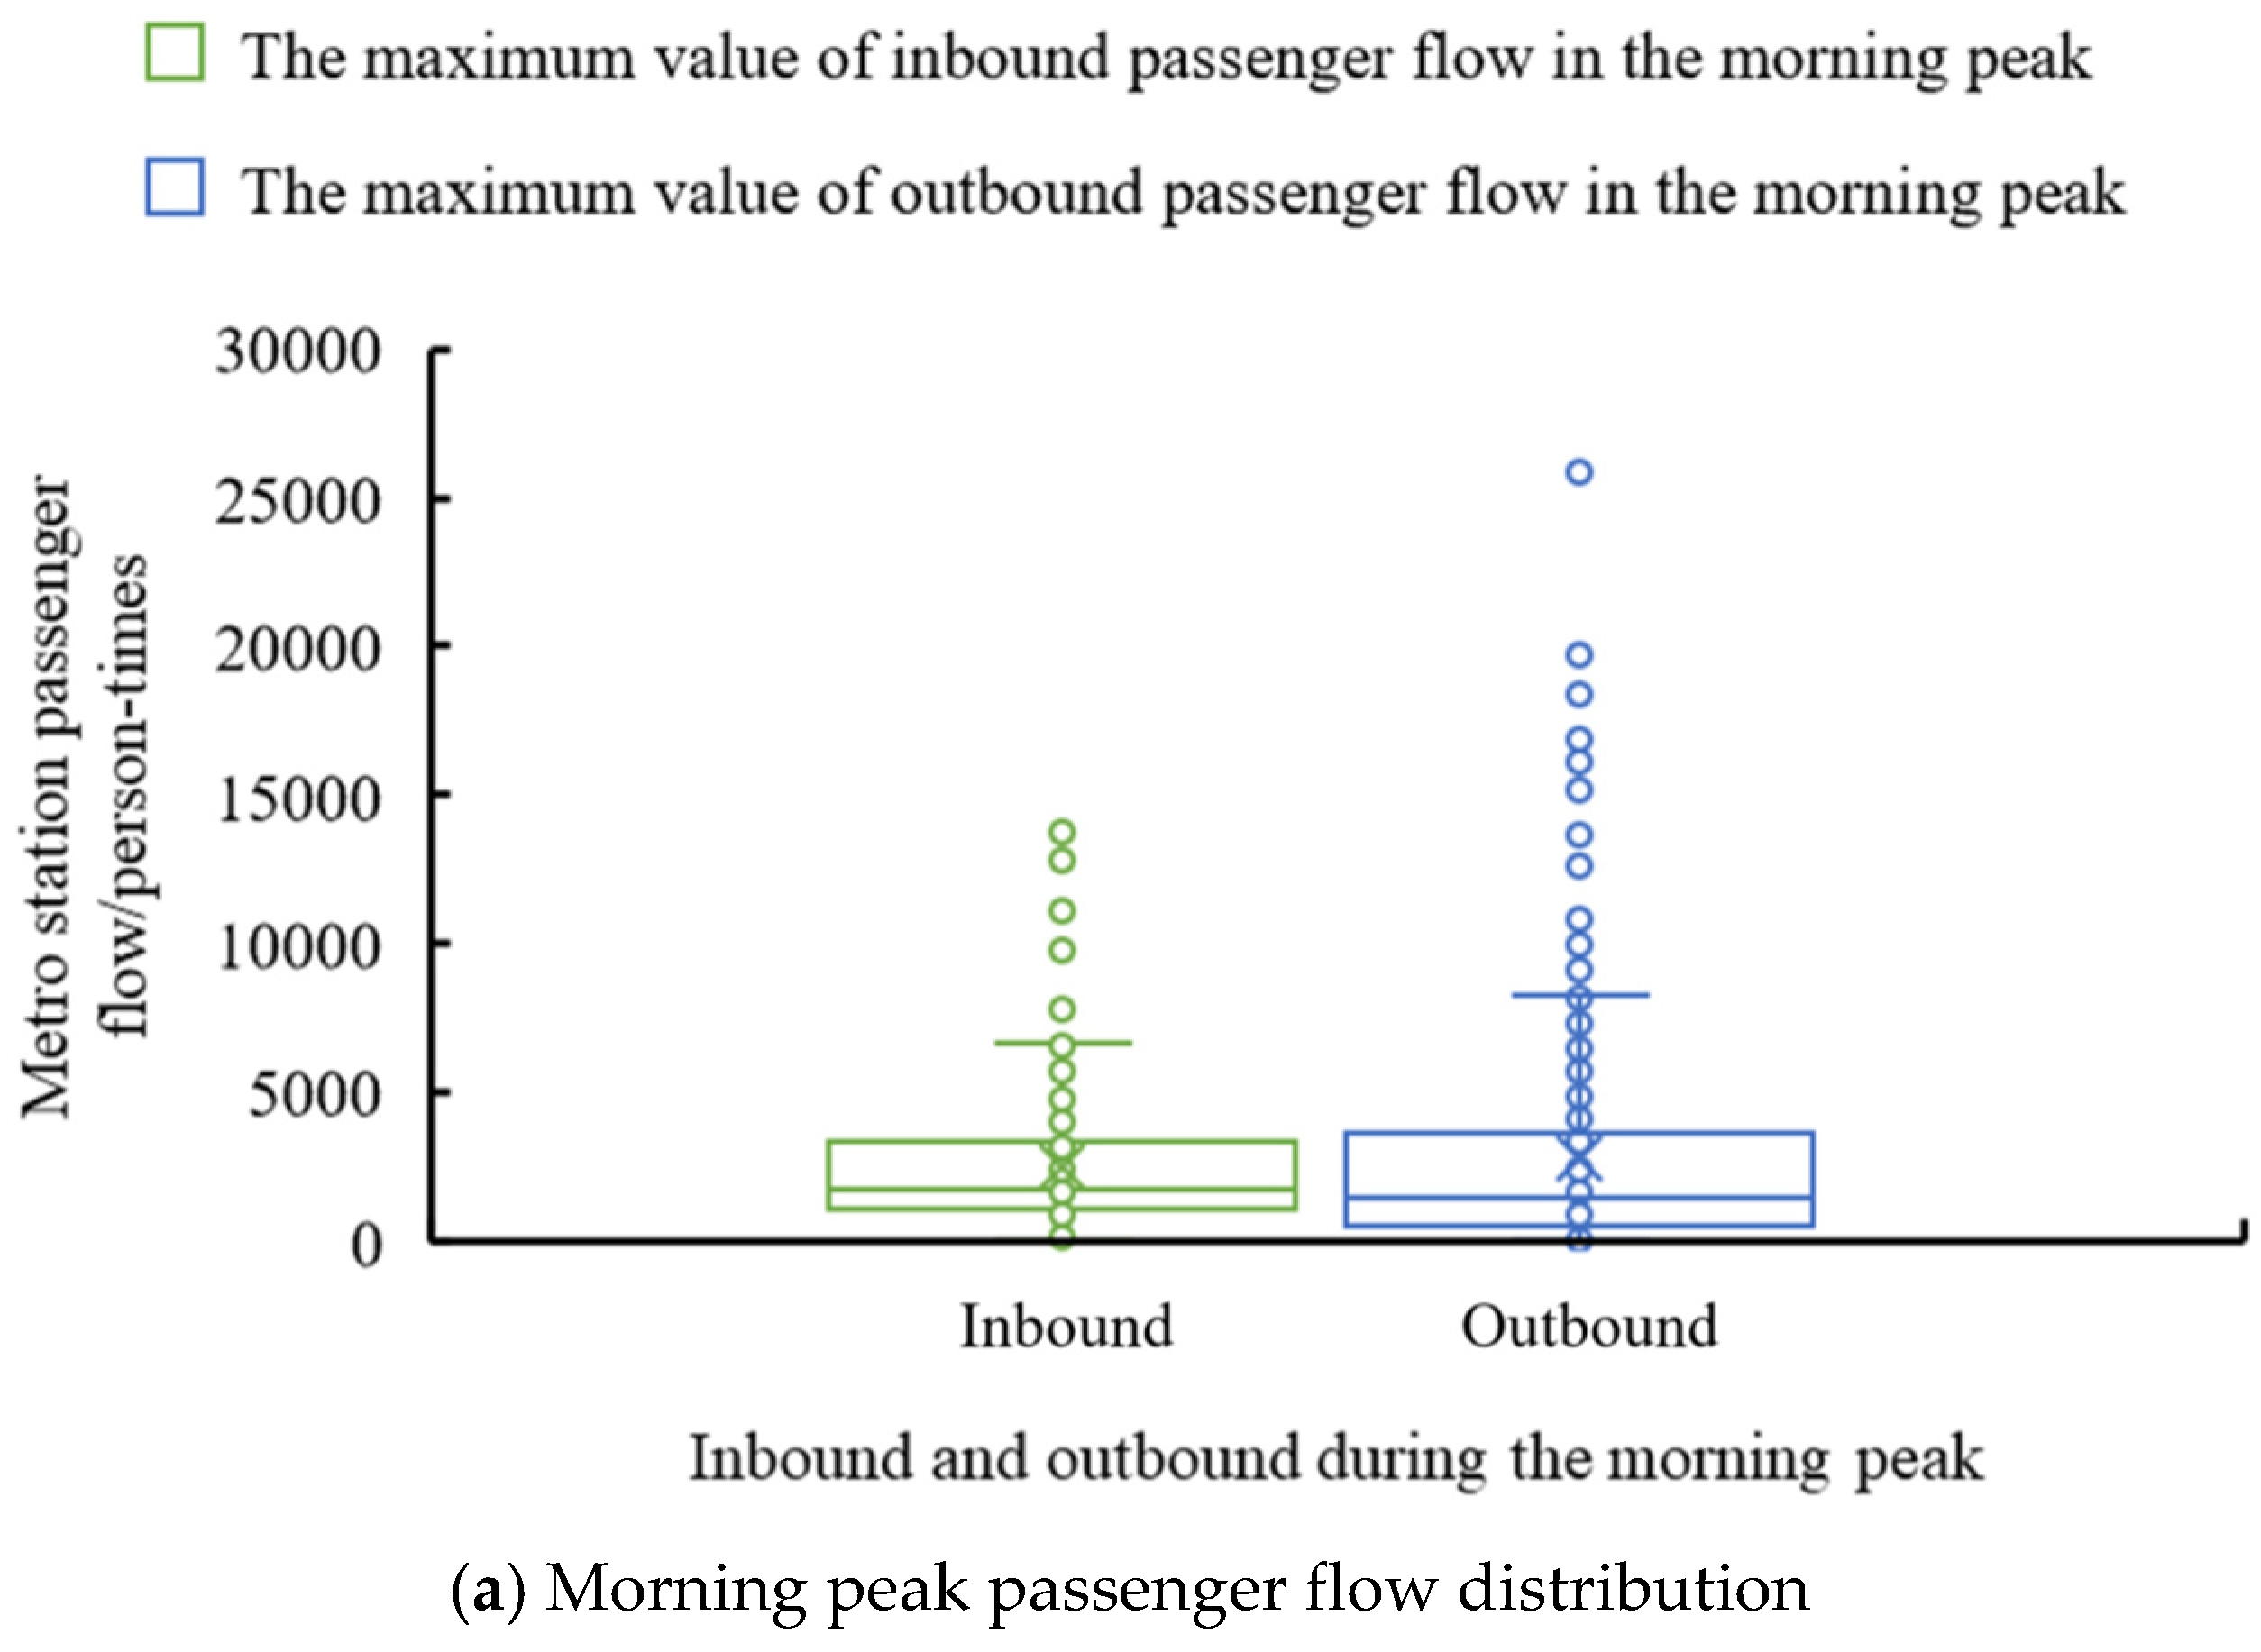
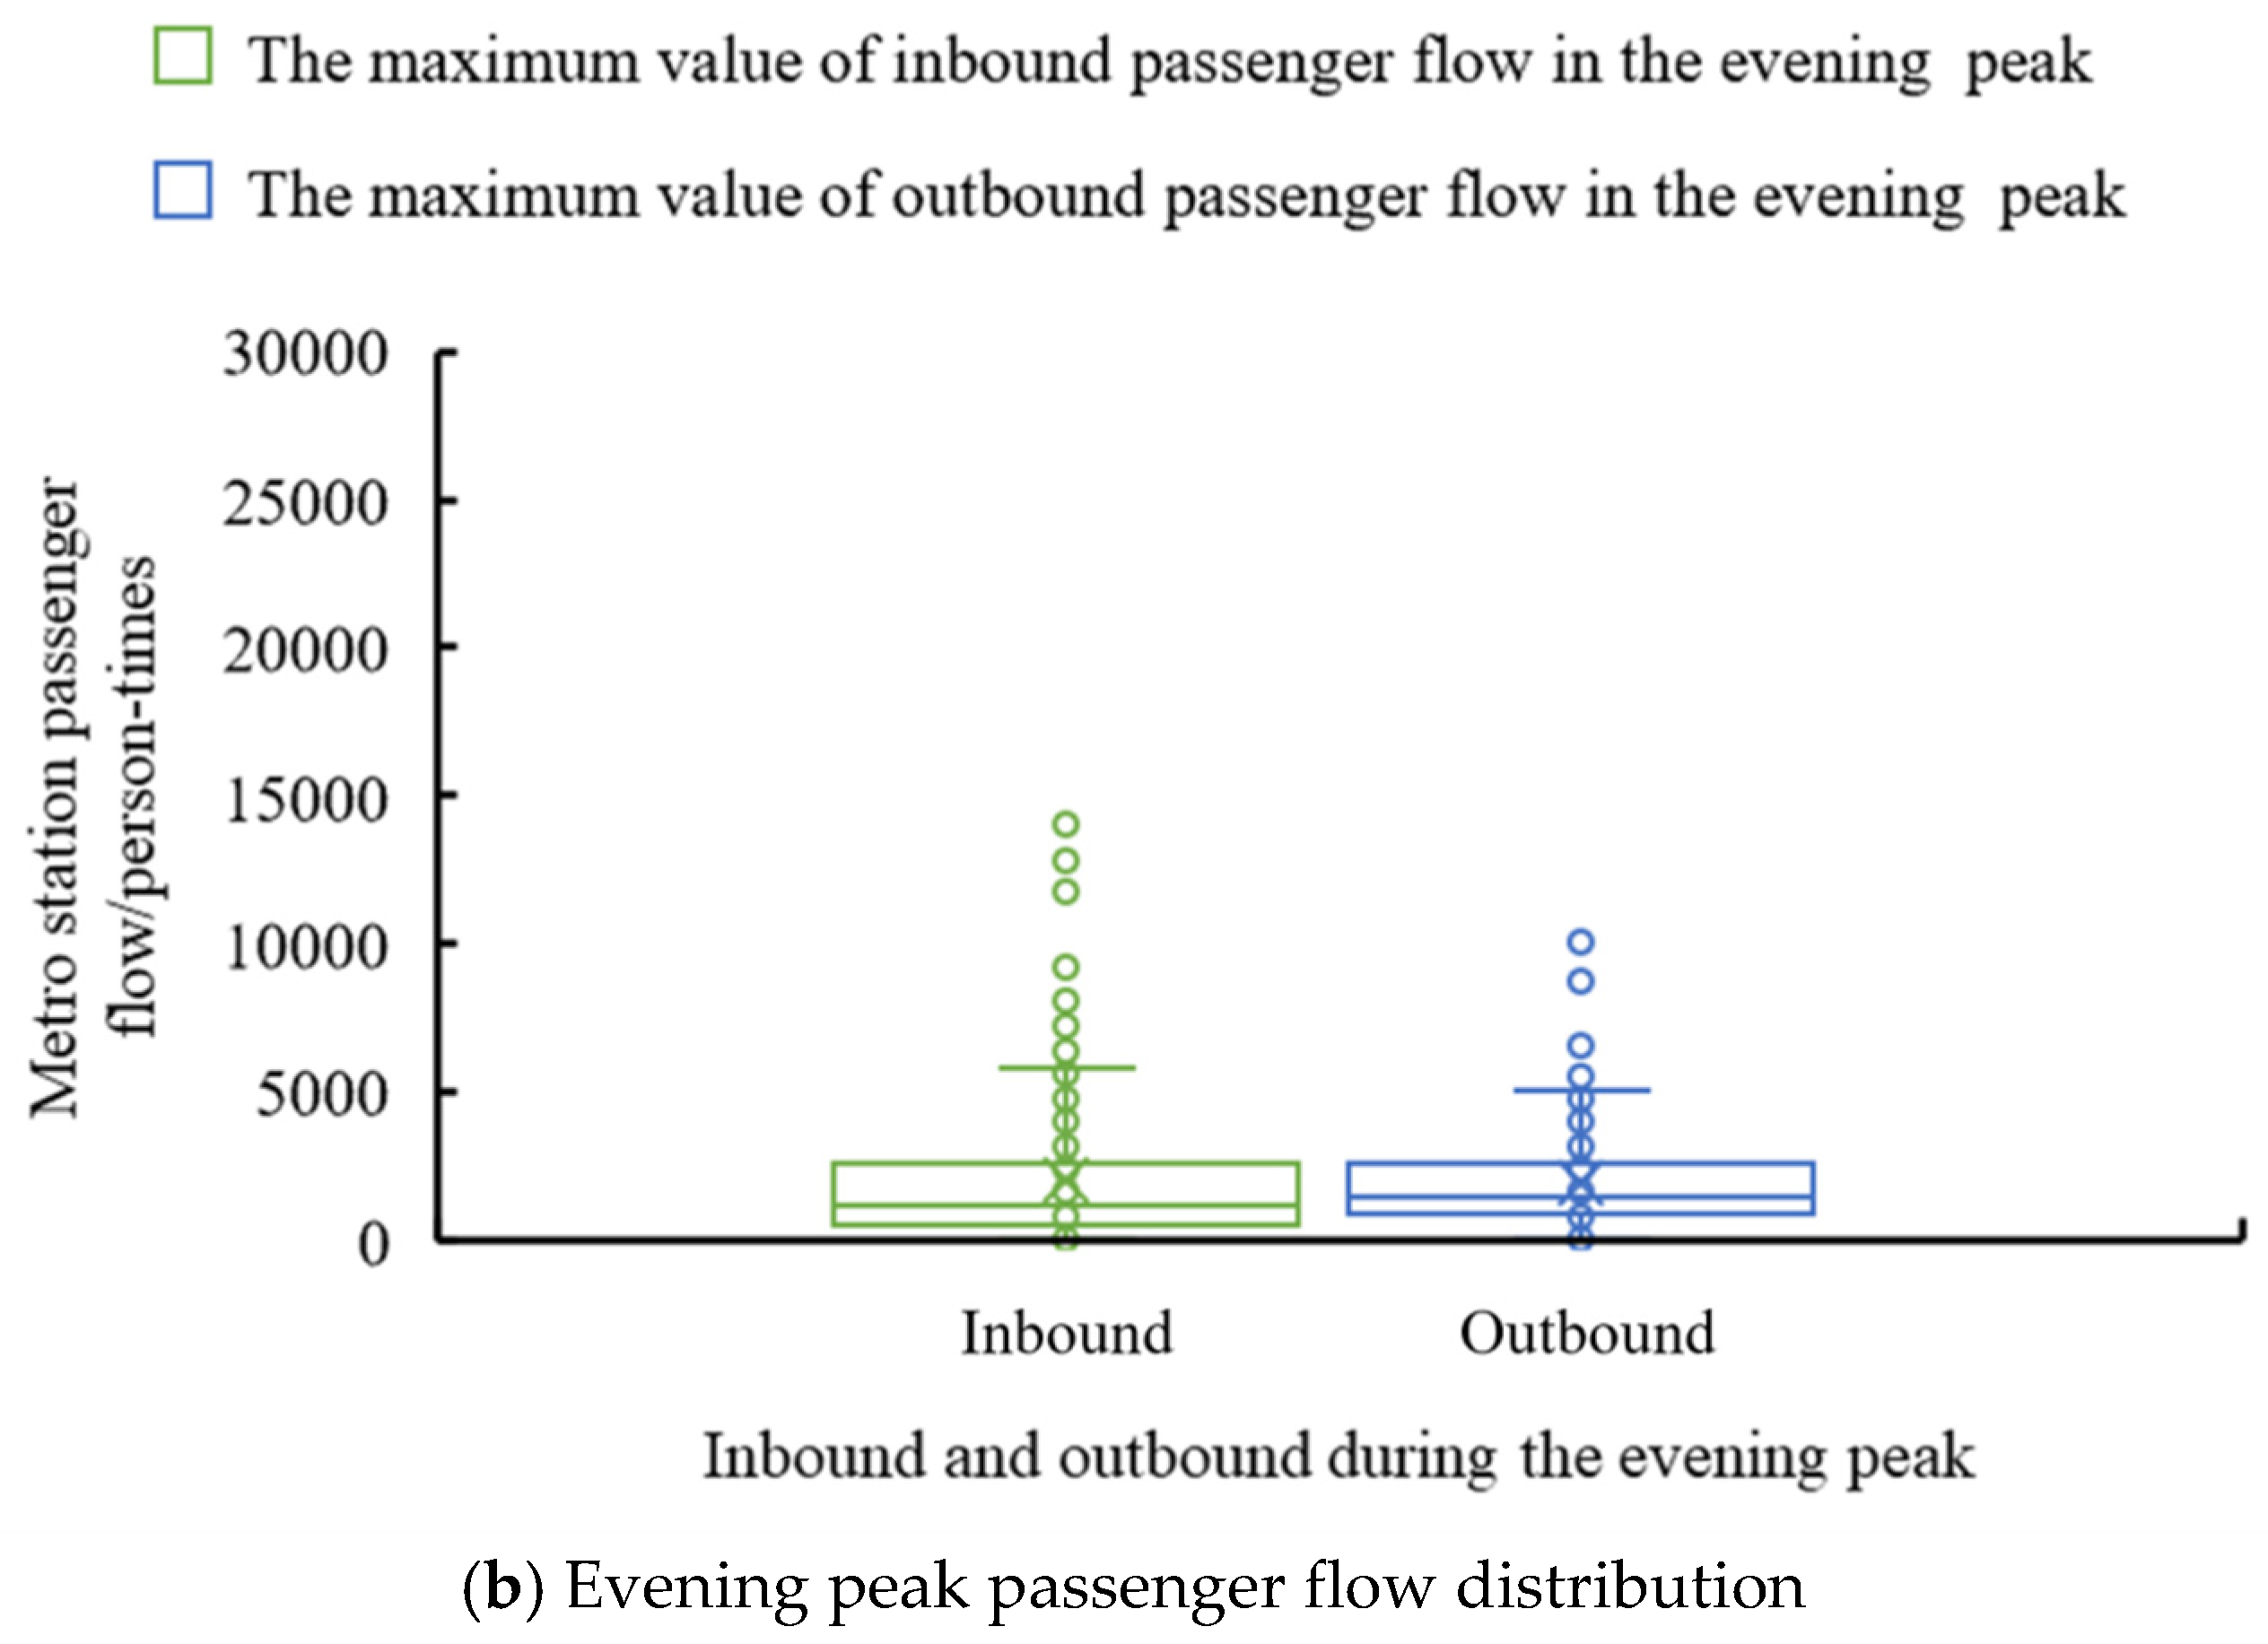
2.1. Auto Fare Collection Data
2.2. Point of Interest Data
3. Methodology
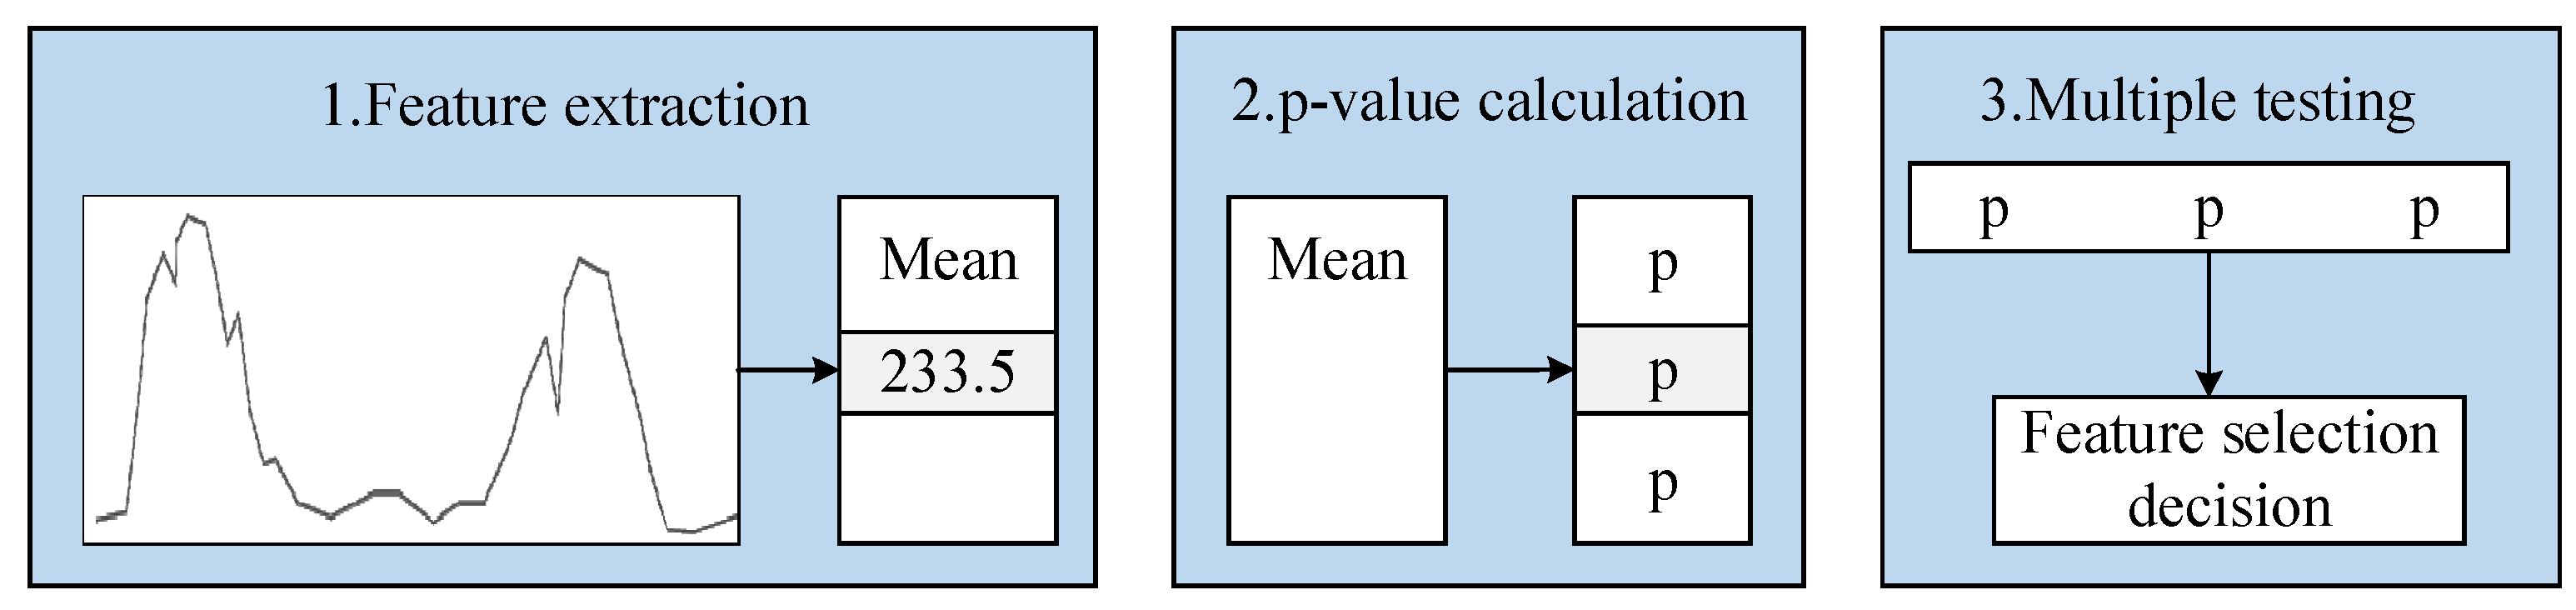
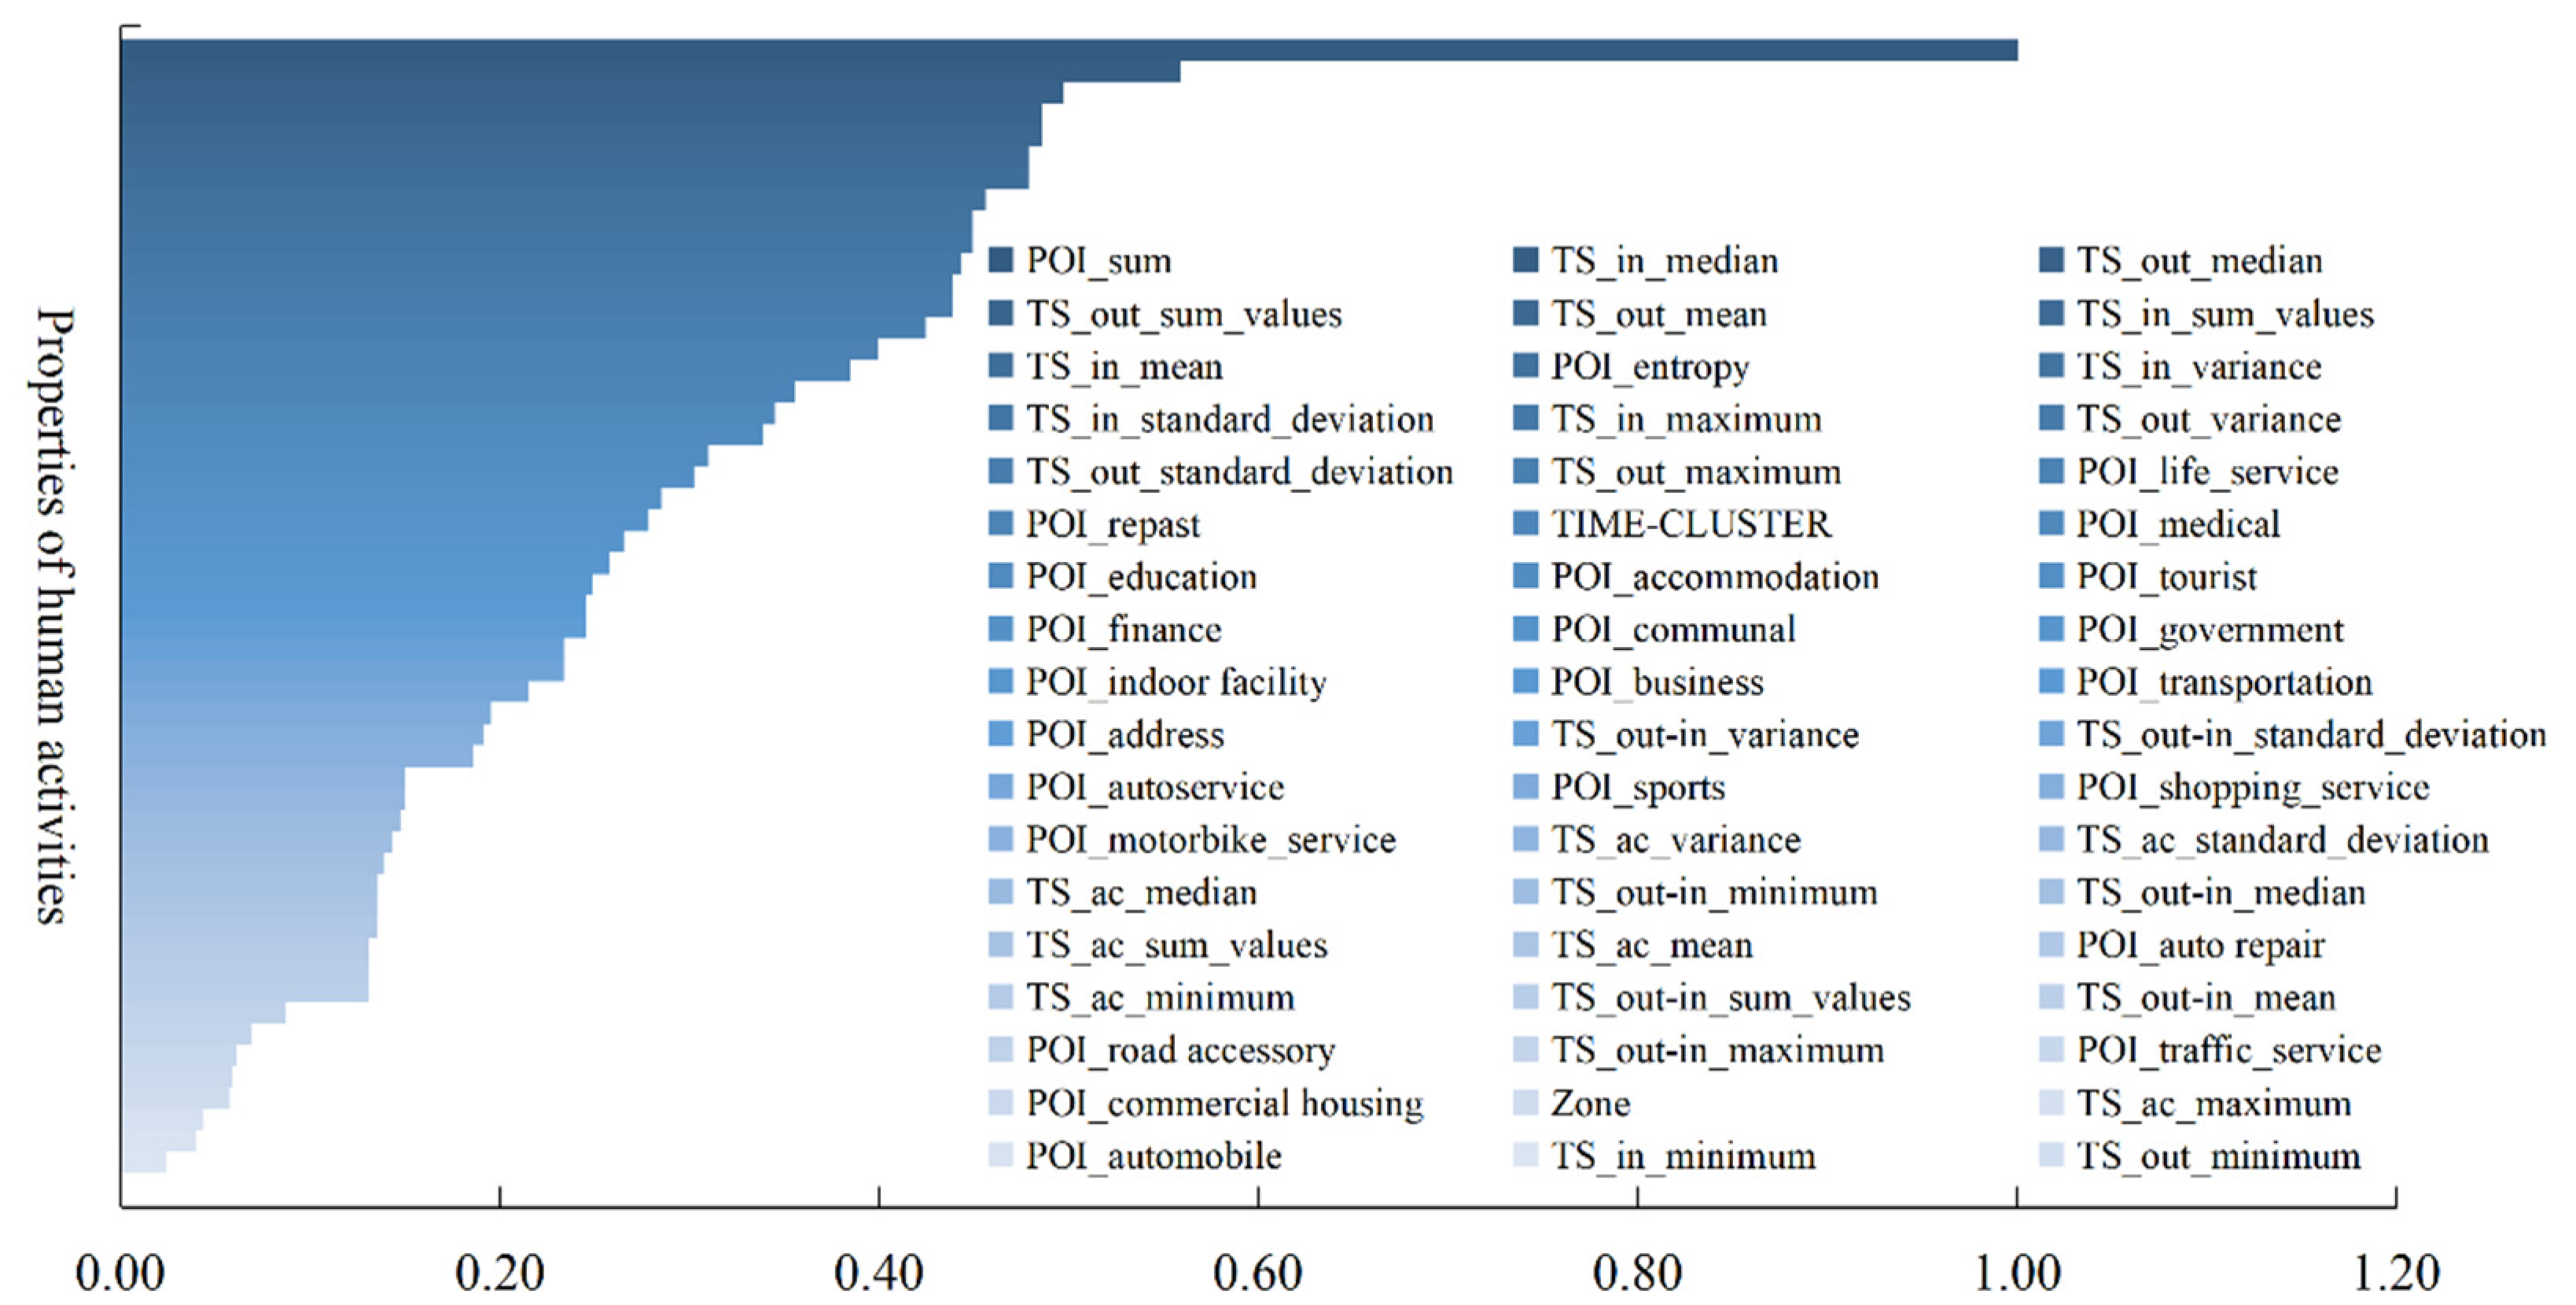
3.1. Tsfresh Method for Time Series Feature Extraction
3.2. Dynamic Time Warping Method for Time Series Clustering
4. Spatial and Temporal Characteristics of Human Activities
4.1. Feature Capture of AFC Time Series
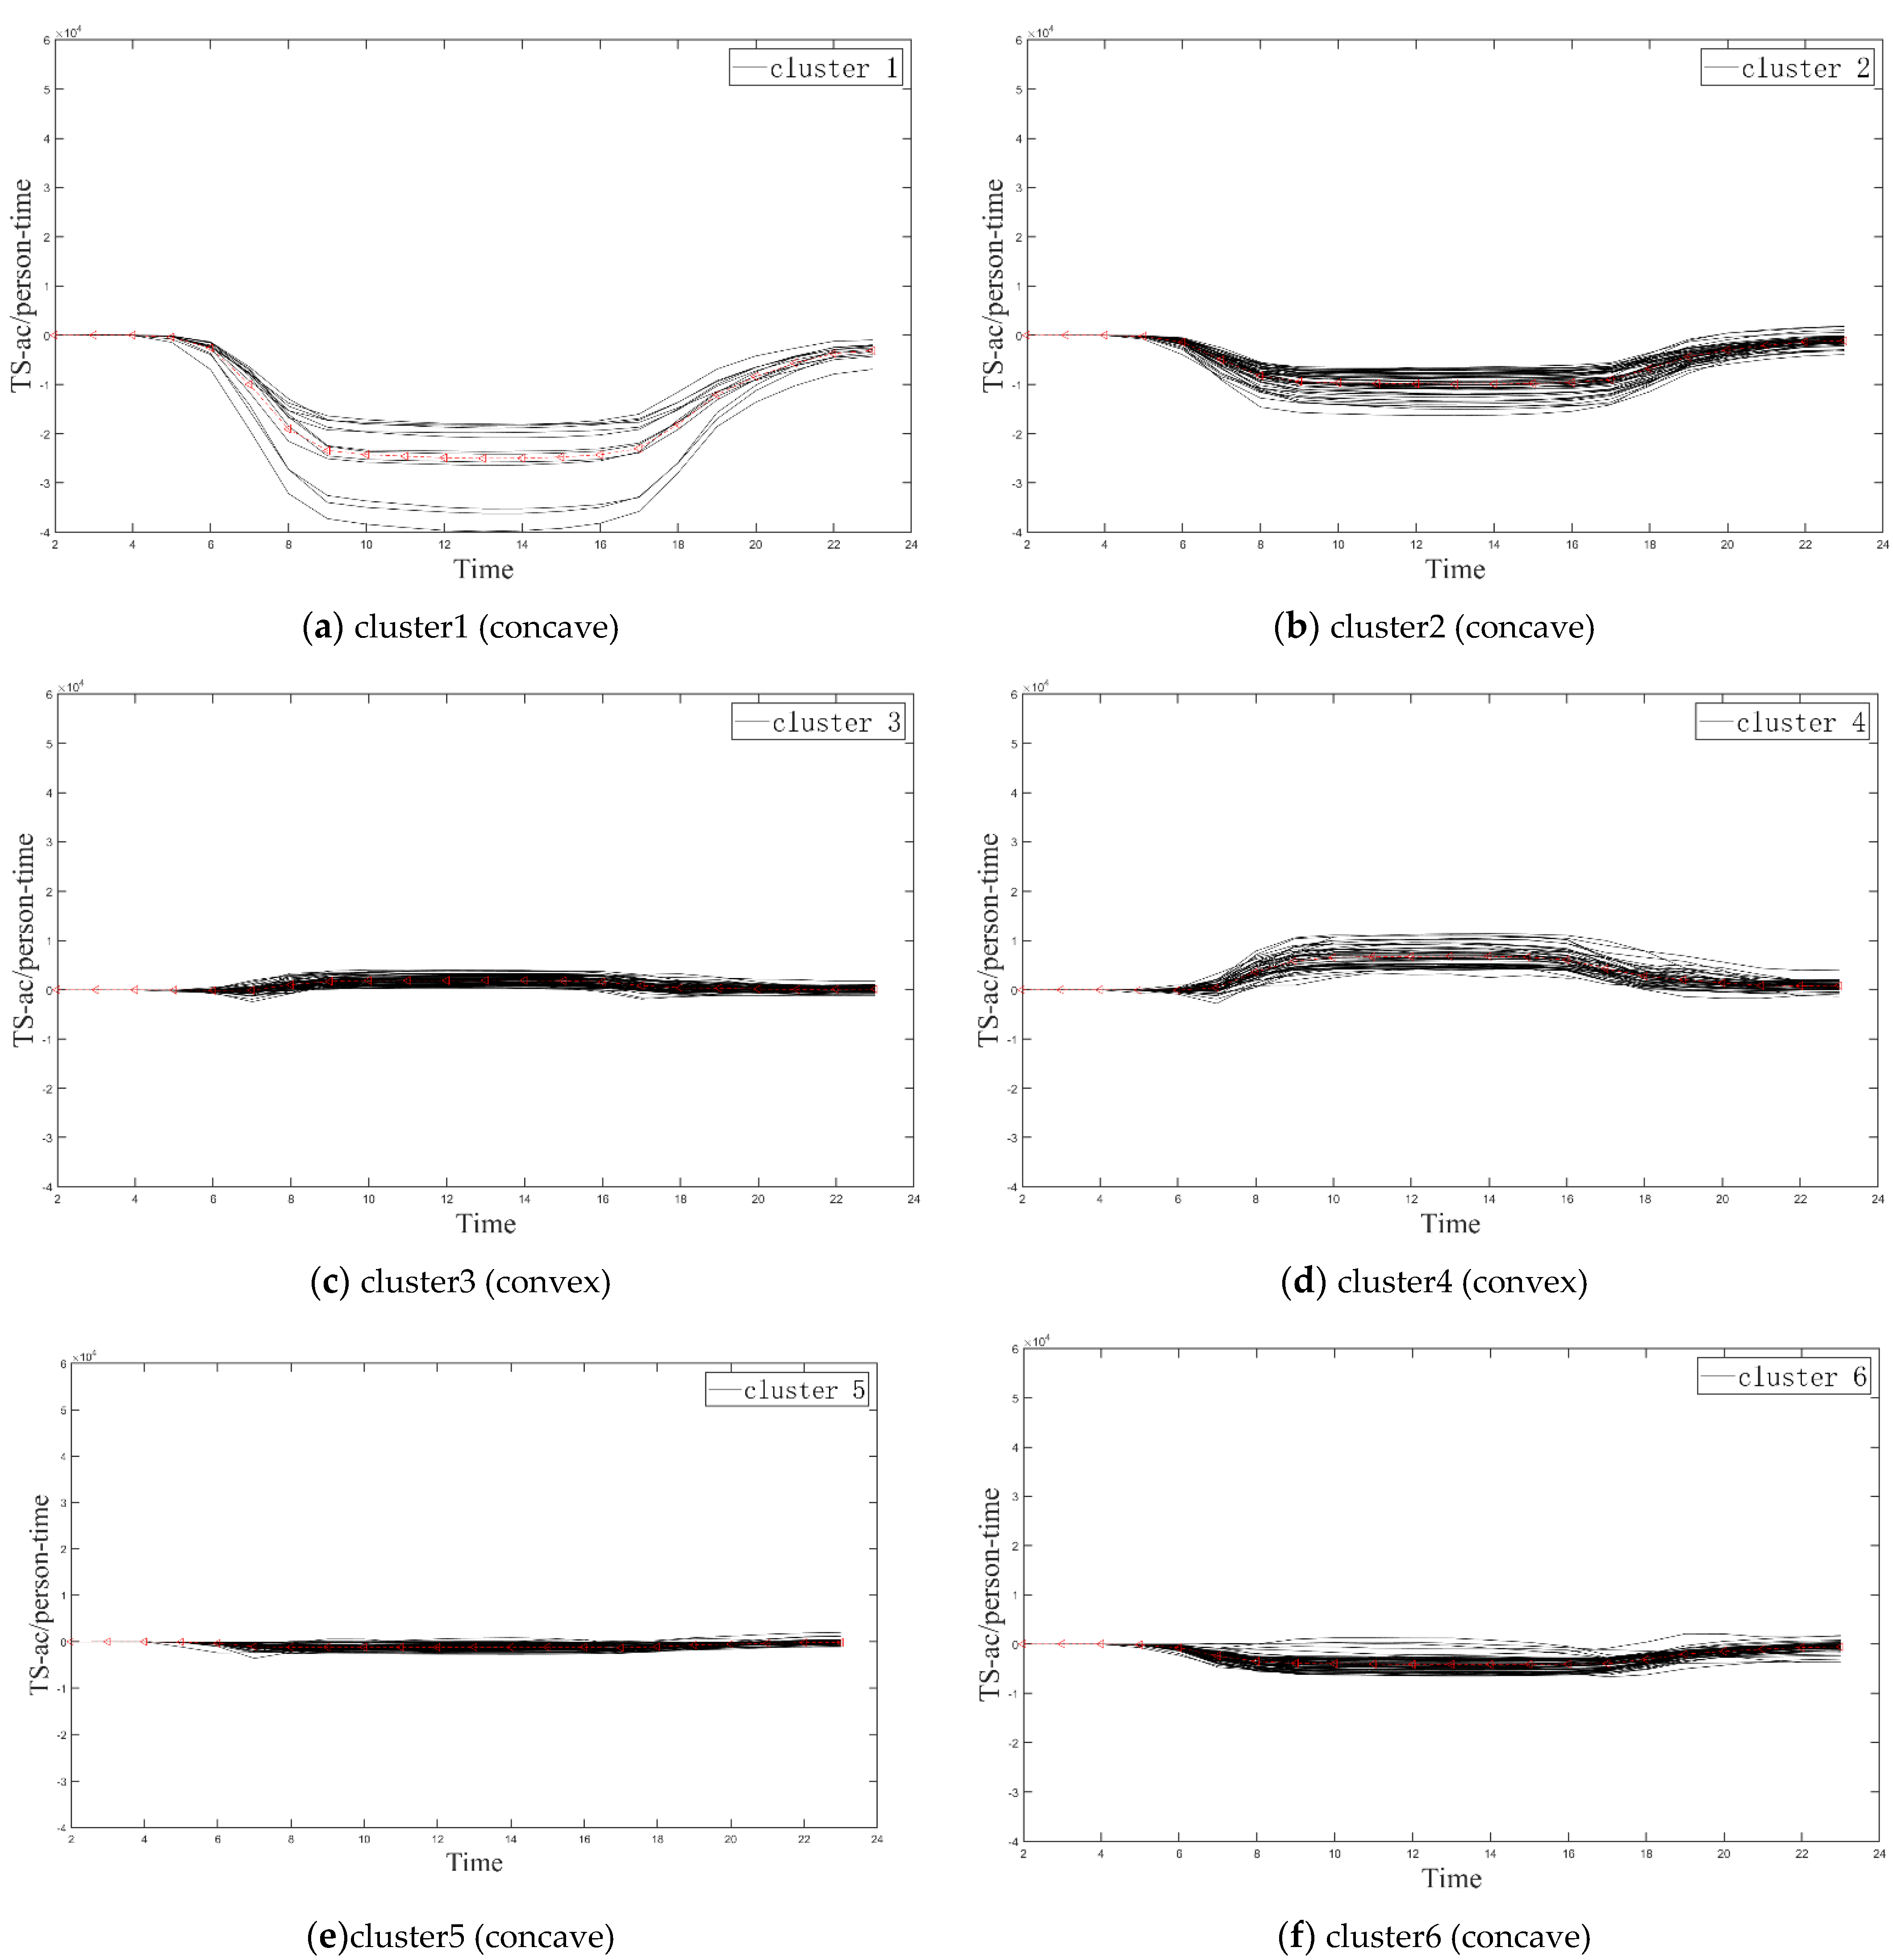
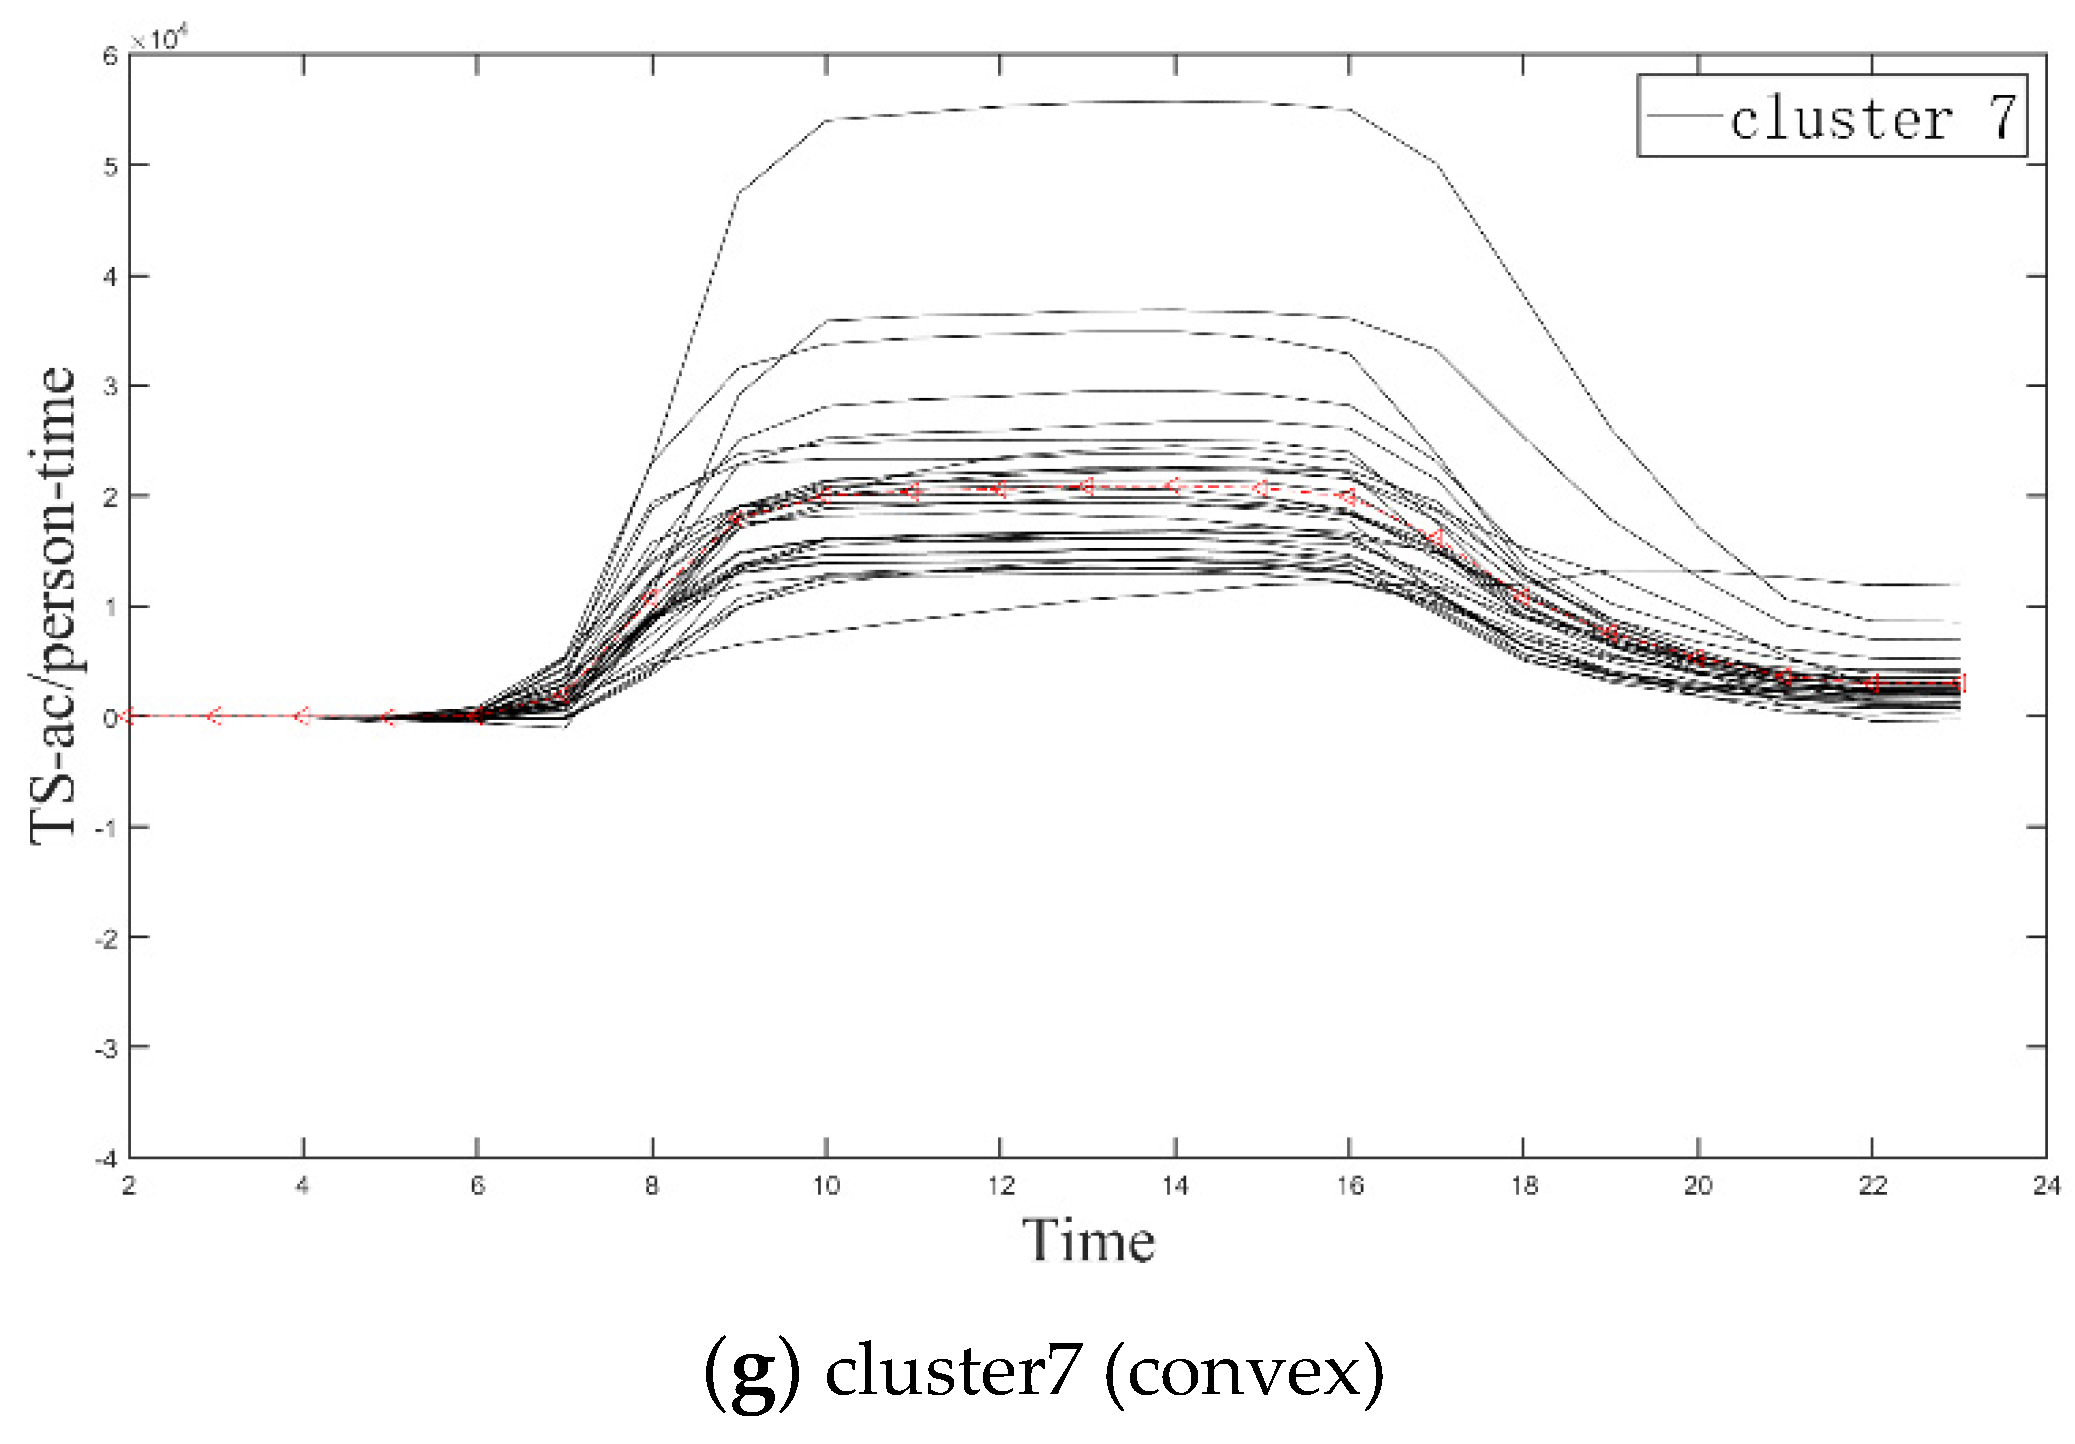
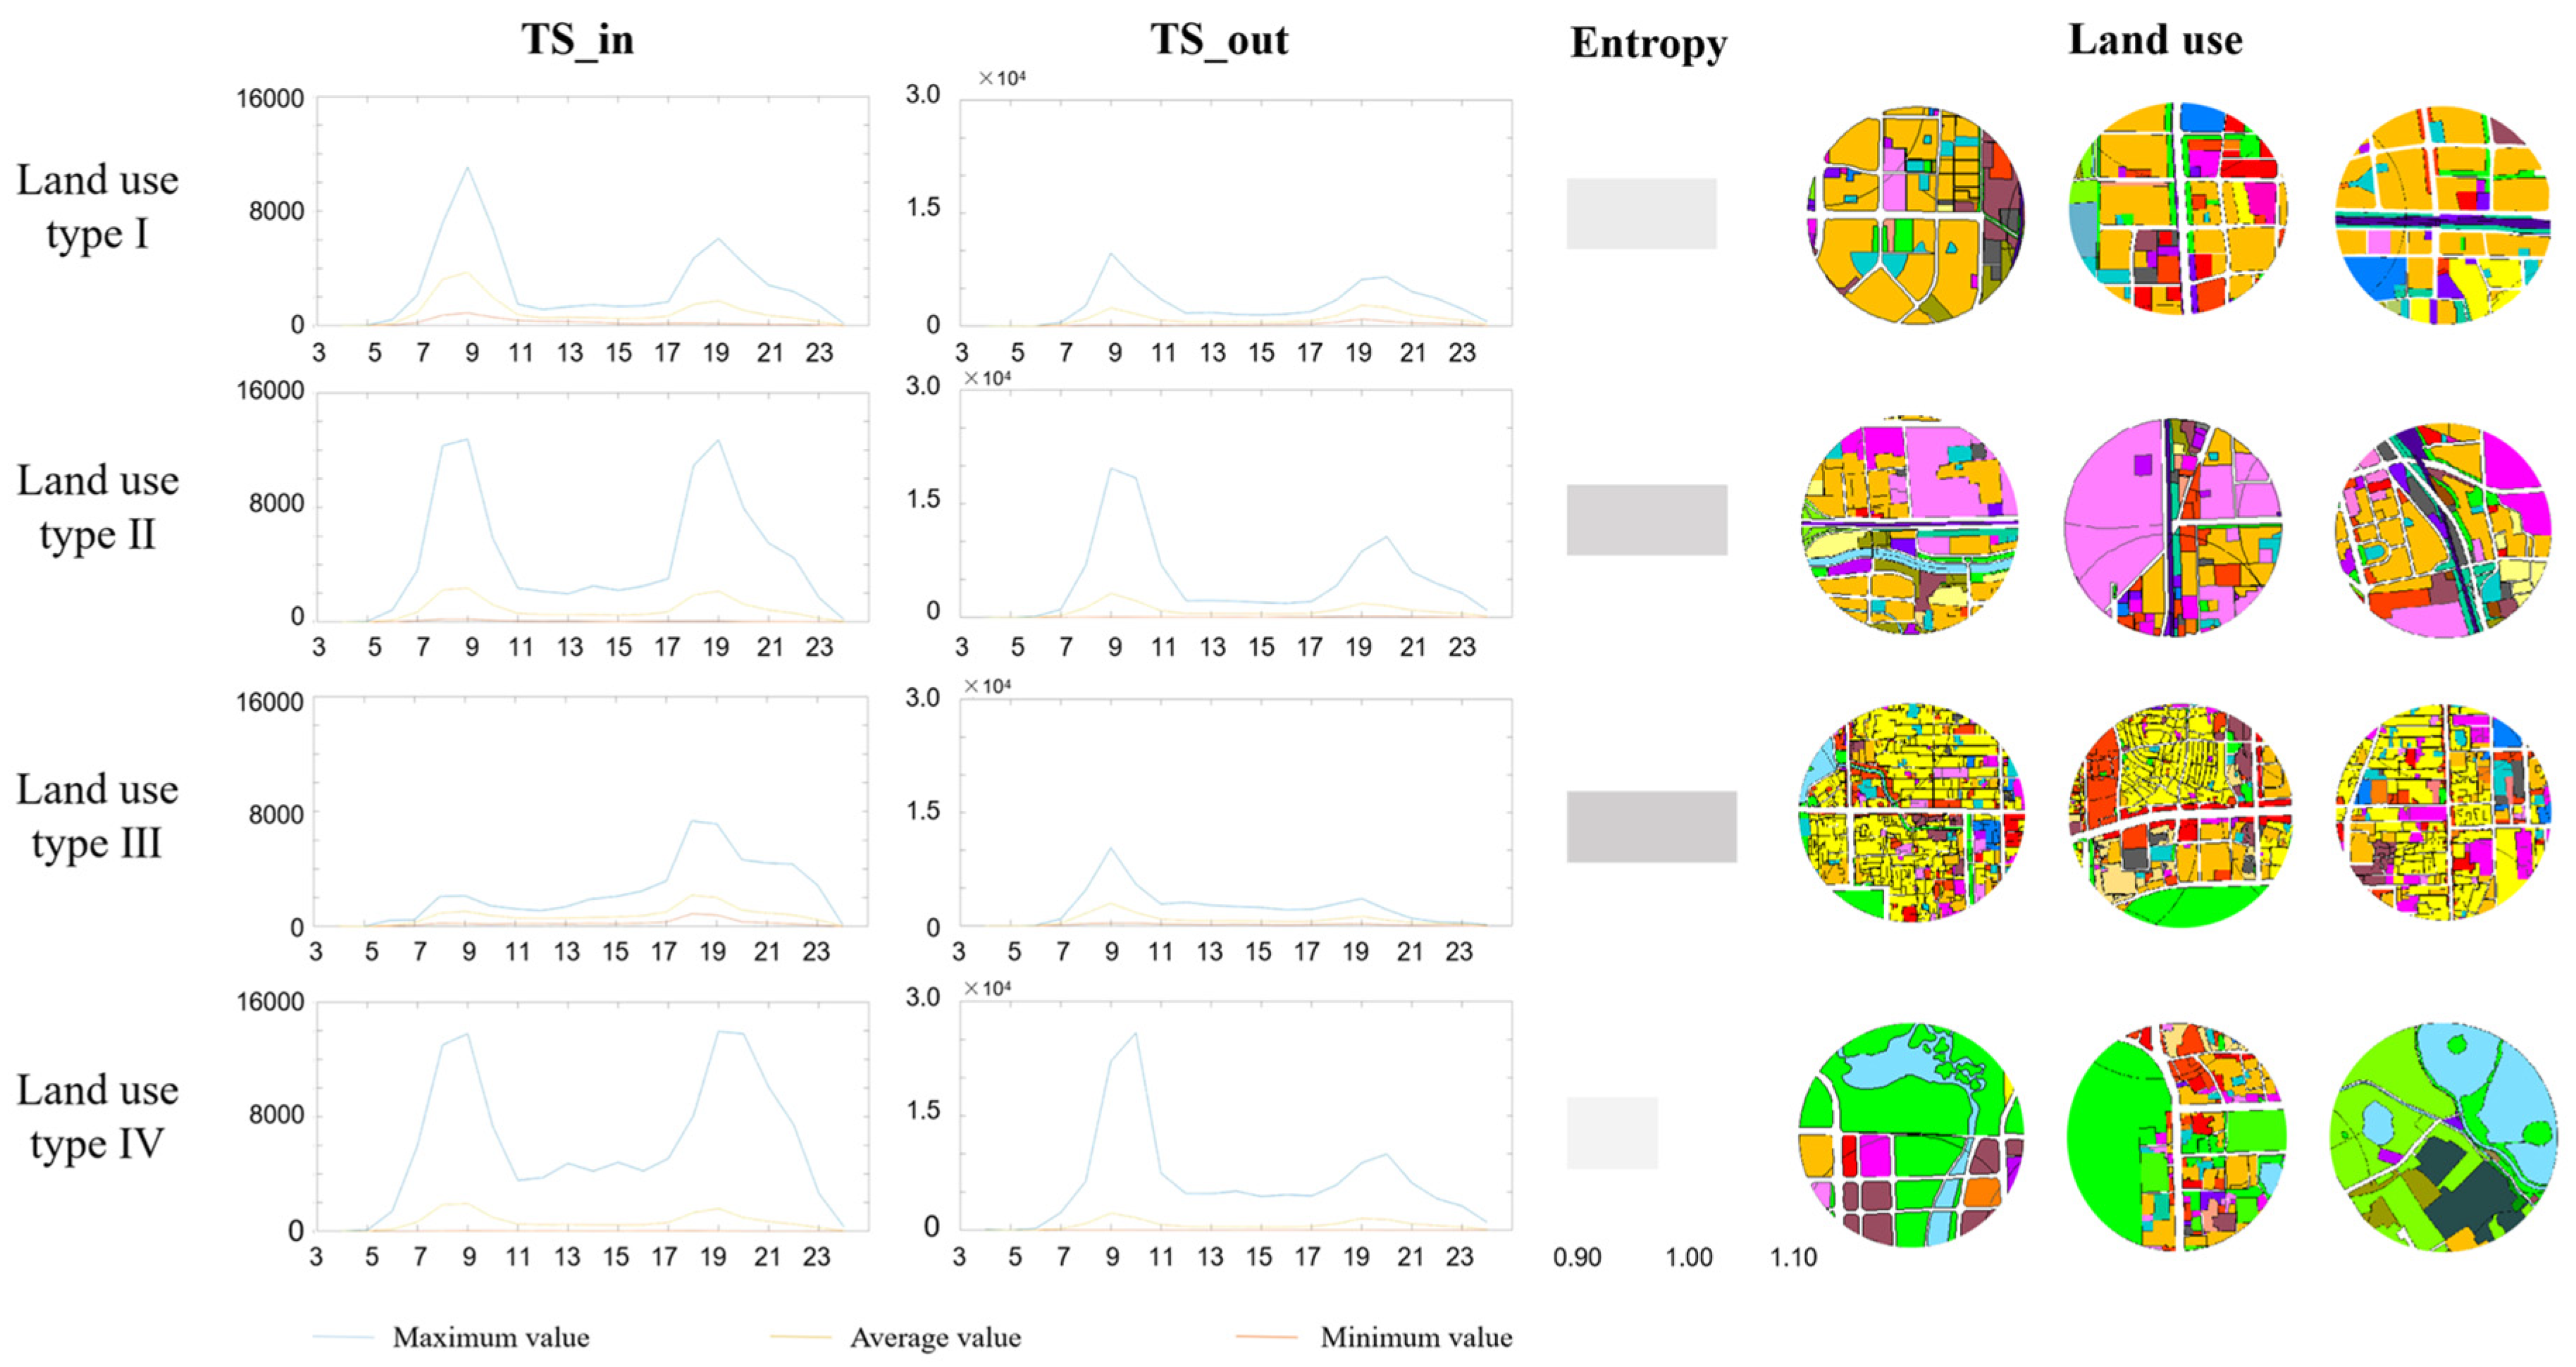
4.2. Classification of AFC Time Series
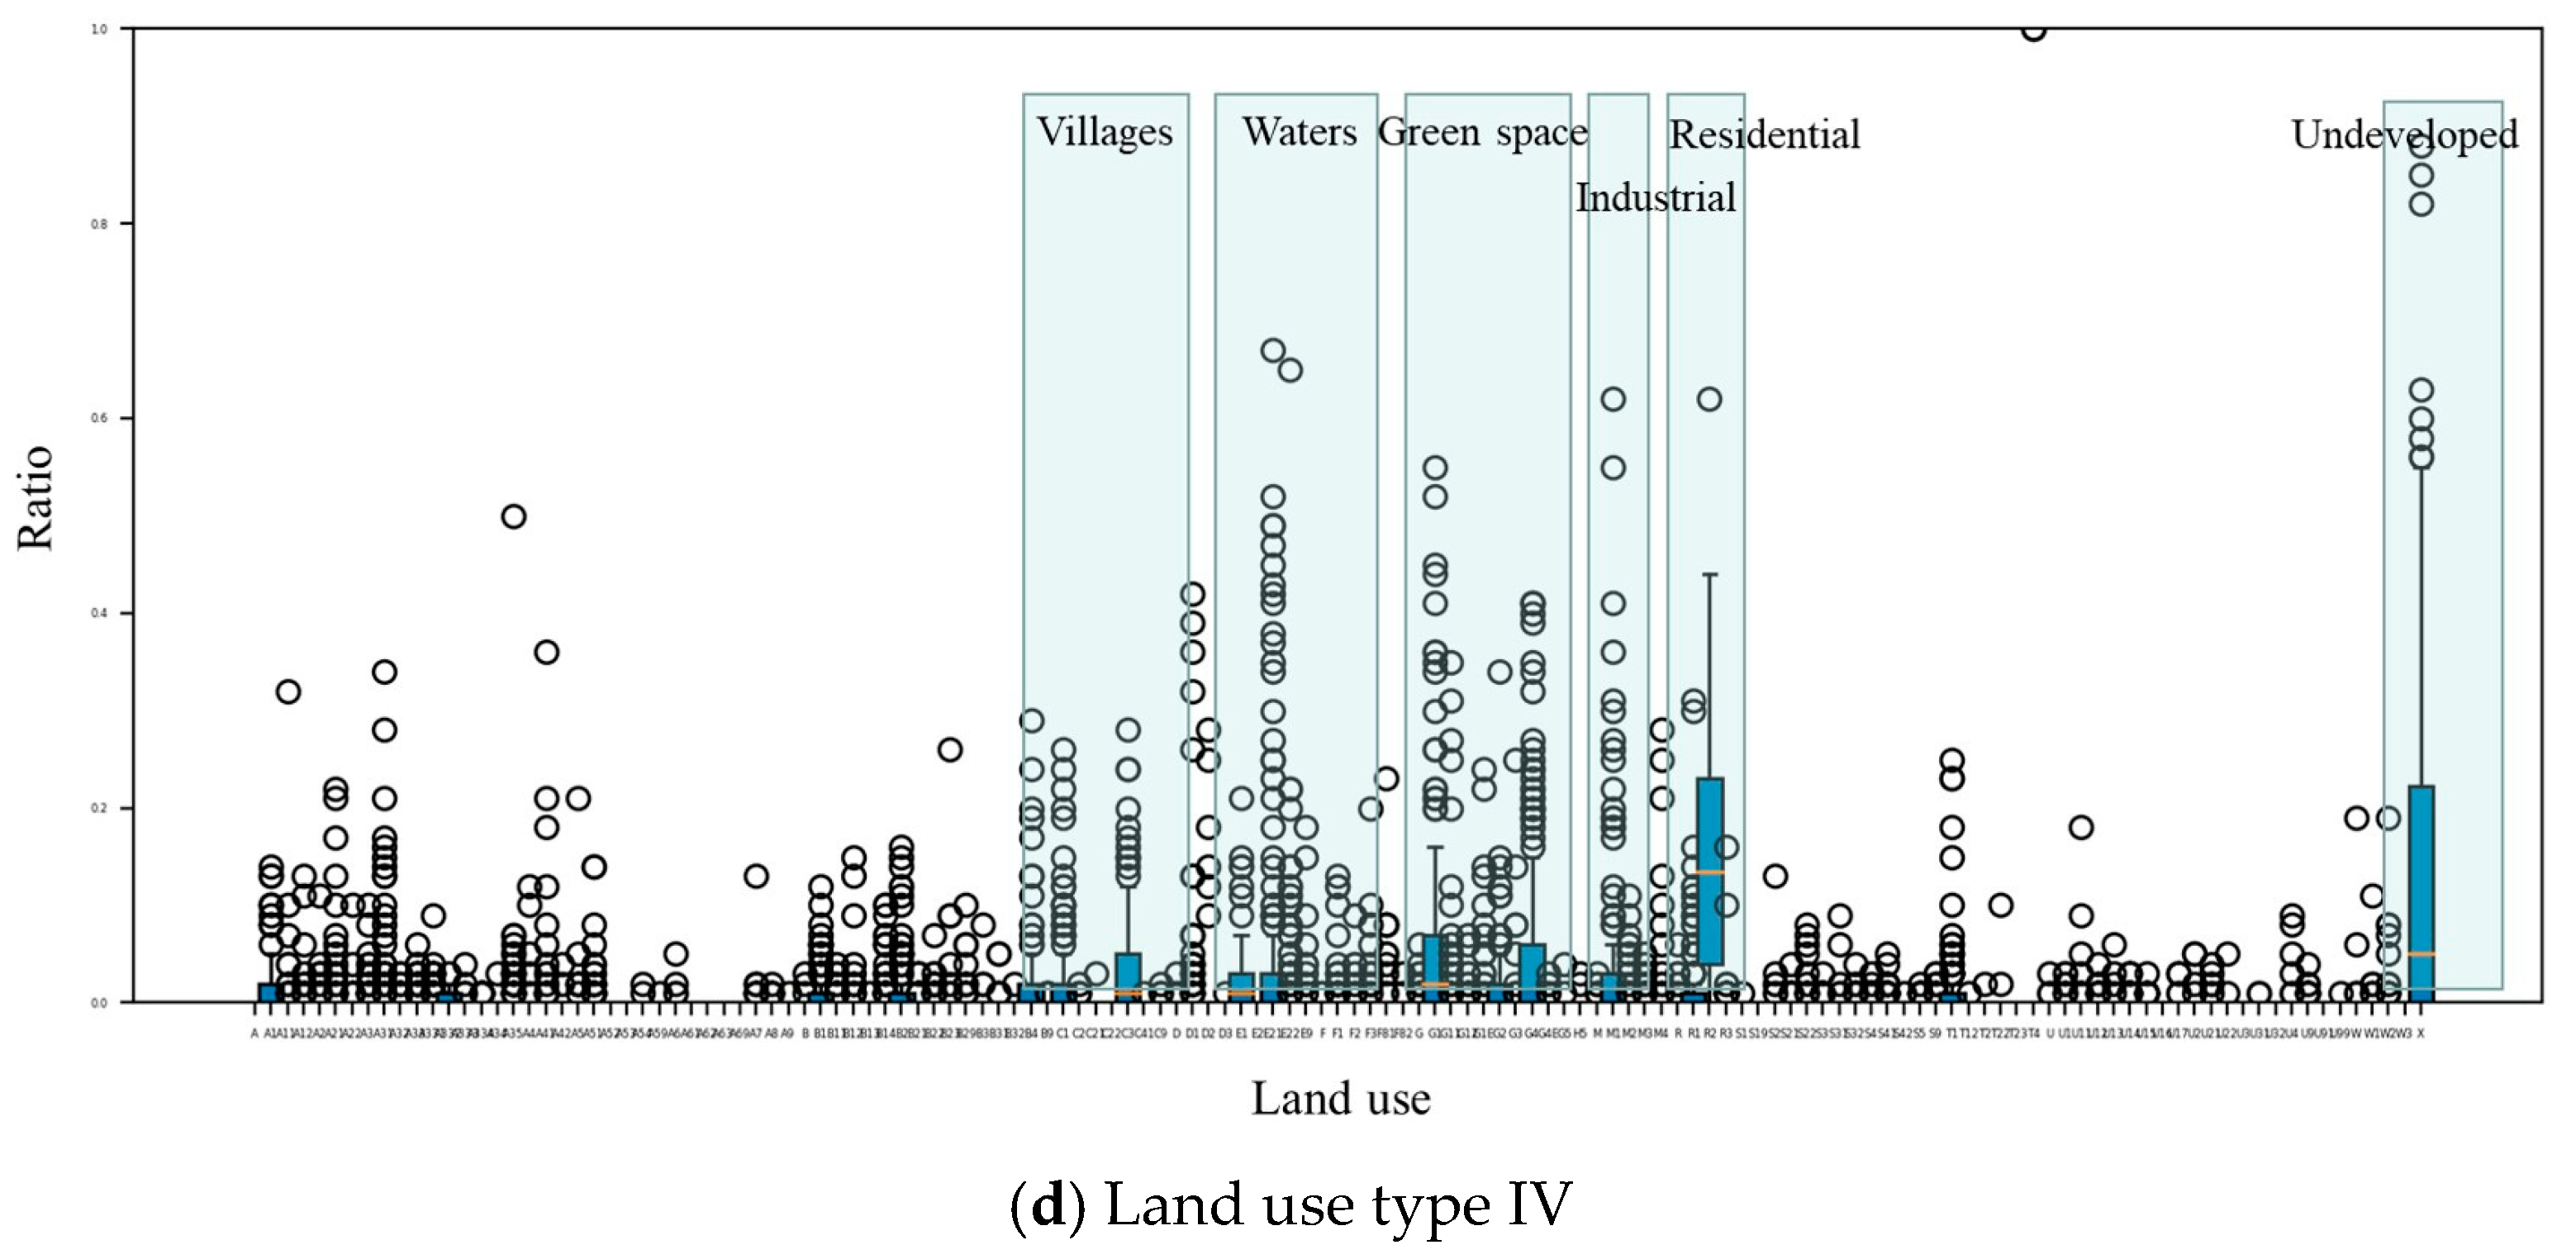
4.3. Spatial Distribution Feature Extraction of POI
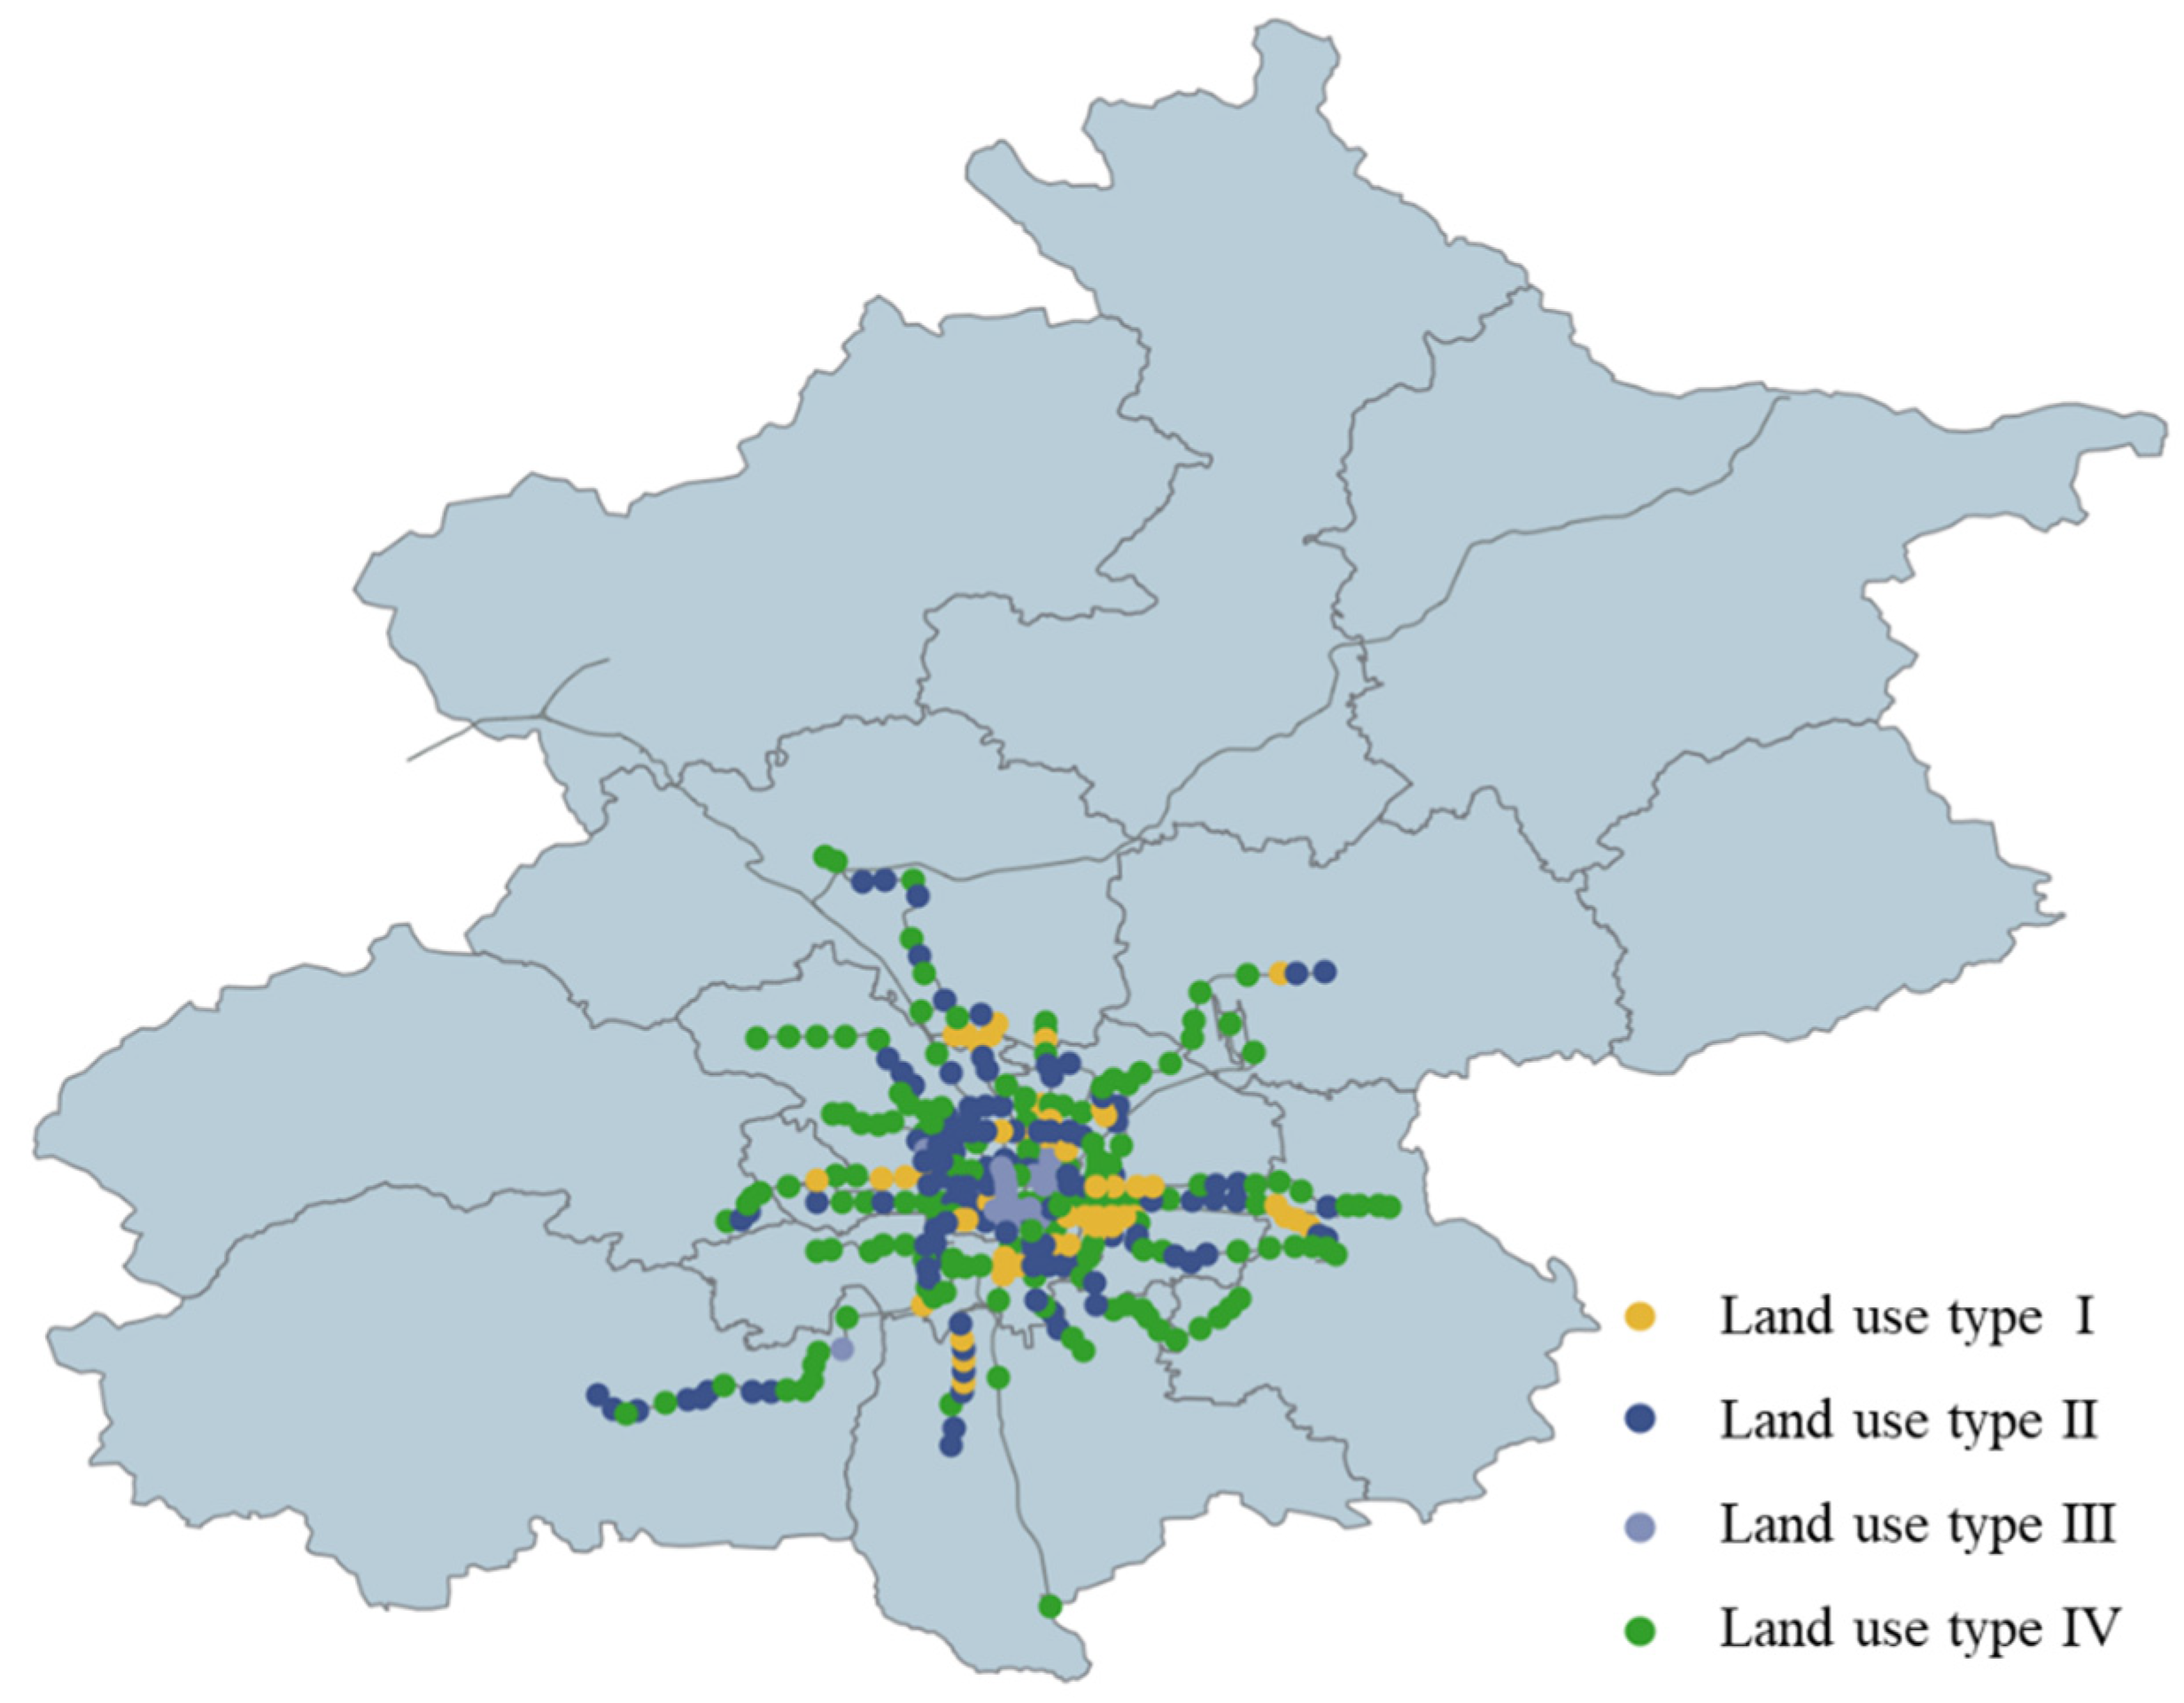
5. Land Use Types in the Metro Station Area
6. Predict Land Use Types in the Metro Station Area
6.1. Gradient Boosting Decision Tree Based Land Use Type Identification Model
6.2. Comparative Analysis of Different Classification Approaches
6.3. Discussion and Analysis
7. Conclusions
- (1)
- The demand for human activities brought about by different land use functions presents differences in the total amount, the degree of temporal dispersion, and the full day pattern of human activities, and such differences are widespread;
- (2)
- Based on the AFC time series data, the introduction of POI improves the accuracy of the model in identifying the cases where the temporal patterns of passenger flows are basically the same in terms of total volume, but different in types of demand (e.g., high-intensity mixed station area with a combination of employment and residence vs. ecologically-oriented station area with development potential). This indicates that the single time series data has limited expression of land use type, so the role of spatial distribution of points of interest needs to be considered comprehensively when modeling;
- (3)
- POI is a key element in forming and measuring urban vitality, and its mixing degree reflects the diversity of urban services. The higher the mixing entropy, the higher the chance of intra-regional supply and demand balance, and different POI trigger seemingly overall stable but internal random activity demand within the city.
Author Contributions
Funding
Institutional Review Board Statement
Informed Consent Statement
Data Availability Statement
Conflicts of Interest
References
- Chen, M.X.; Zhang, H.; Liu, W.D.; Zhang, W. The global pattern of urbanization and economic growth: Evidence from the last three decades. PLoS ONE 2014, 9, e103799. [Google Scholar] [CrossRef] [PubMed] [Green Version]
- United Nations. World Urbanization Prospects: The 2018 Revision, Key Facts; United Nations: New York, NY, USA, 2018. [Google Scholar]
- Jiang, S.; Alves, A.; Rodrigues, F.; Ferreira, J., Jr.; Pereira, F.C. Mining point-of-interest data from social networks for urban land use classification and disaggregation. Comput. Environ. Urban 2015, 53, 36–46. [Google Scholar] [CrossRef] [Green Version]
- Mao, L.D. Large-scale automatic identification of urban vacant land using semantic segmentation of high-resolution remote sensing images. Landsc. Urban Plan. 2022, 222, 104384. [Google Scholar] [CrossRef]
- Kuang, W.H.; Zhang, S.W.; Liu, J.Y.; Shao, Q. Methodology for classifying and detecting intra-urban land use change: A case study of Changchun city during the last 100 years. Can. J. Remote Sens. 2010, 14, 345–355. (In Chinses) [Google Scholar]
- Lu, B.Y.; Chen, Z.J.; Hou, C.H.; Wei, Q. Study on the spacial development of land urbanization in southern outskirts of Xi’an city based on GIS. Hum. Geogr. 2010, 25, 1003–2398. (In Chinses) [Google Scholar]
- Chi, J.; Jiao, L.M.; Dong, T.; Gu, Y. Quantitative identification and visualization of urban functional area based on POI data. J. Geomat. 2016, 41, 68–73. (In Chinses) [Google Scholar]
- Yu, B.B.; Wang, Z.B.; Chang, Y.B.; Han, J. Identify multi-level urban functional structures by using semantic data. Sci. Surv. Mapp. 2021, 46, 175–181. (In Chinses) [Google Scholar]
- Yang, J.Y.; Shao, D.; Wang, Q.; Zhang, Y.H. Exploration on a method for precision identification of urban land use type using artificial intelligence: Based on big data of building forms and business poi data. City Plan. Rev. 2021, 45, 46–56. (In Chinses) [Google Scholar]
- Cao, R.; Tu, W.; Yang, C.; Li, Q.; Liu, J.; Zhu, J.; Zhang, Q.; Li, Q.; Qiu, G. Deep learning-based remote and social sensing data fusion for urban region function recognition. ISPRS J. Photogramm. 2020, 163, 82–97. [Google Scholar] [CrossRef]
- Kurowska, K.; Adamska-Kmie, D.; Kowalczyk, C.; Leń, P. Communication value of urban space in the urban planning process on the example of a Polish city. Cities 2021, 116, 103282. [Google Scholar] [CrossRef]
- Toole, J.L.; Ulm, M.; Bauer, D. Inferring land use from mobile phone activity. In Proceedings of the 13th ACM SIGKDD International Workshop on Urban Computing, New York, NY, USA, 12 August 2012; p. 201. [Google Scholar]
- Noelia, C.; Beníteza, F.G.; Romeroa, L.M. Land use inference from mobility mobile phone data and household travel surveys. Transp. Res. Procedia 2020, 47, 417–424. [Google Scholar]
- Yong, J.; Zheng, L.; Mao, X.; Tang, X.; Gao, A.; Liu, W. Mining metro commuting mobility patterns using massive smart card data. Phys. A Stat. Mech. Its Appl. 2021, 584, 126351. [Google Scholar] [CrossRef]
- Cao, R.; Tu, W.; Chao, B.C.; Luo, N.X.; Zhou, M. Identification and analysis of home and work regions in the vicinity of metro stations using smart card data. J. Geomat. 2016, 41, 74–78. (In Chinses) [Google Scholar]
- Han, H.Y.; Yu, X.; Long, Y. Identifying urban functional zones using bus smart card data and points of interest in Beijing. City Plan. Rev. 2016, 40, 52–60. (In Chinses) [Google Scholar]
- Zhang, Z.; Chen, Y.Y.; Liang, T.W. Inferring land use characteristics using travel patterns. J. Transp. Syst. Eng. Inf. Technol. 2020, 20, 31–35. (In Chinses) [Google Scholar]
- Gao, D.H.; Xu, Q.; Chen, P.W.; Hu, J.; Zhu, Y. Spatial characteristics of urban rail transit passenger flows and fine-scale built environment. J. Transp. Syst. Eng. Inf. Technol. 2021, 21, 25–32. (In Chinses) [Google Scholar]
- Christ, M.; Braun, N.; Neuffer, J.; Kempa-Liehr, A.W. Time series feature extraction on basis of scalable hypothesis tests. Neurocomputing 2018, 307, 72–77. [Google Scholar] [CrossRef]
- Sang, A.; Li, S.Q. A predictability analysis of network traffic. Comput. Netw. 2002, 39, 329–345. [Google Scholar] [CrossRef]
- Eddy, S.R. Hidden Markov models. Curr. Opin. Struct. Biol. 1996, 6, 361–365. [Google Scholar] [CrossRef]
- Xu, D.; Bain; Rong, J.; Wang, J.; Yin, B. Study on clustering of free-floating bike-sharing parking time series in Beijing subway stations. Sustainability 2019, 11, 5439. [Google Scholar] [CrossRef]
- Koo, Y.Y.; Wu, X.Y.; Huang, Z.Q.; Feng, Y.C.; Fang, C.G. Rapid determination and validation of the status quo of urban parcel land types in Luzhou city aided by POI data. Chin. J. Agric. Resour. Reg. Plan. 2019, 40, 72–79. [Google Scholar]


| Field | Description | Example |
|---|---|---|
| USER_ID | Encrypted user ID | NVKR ******* |
| START_LINE | Starting Line | Line 7 |
| START_DIR | Starting direction | 0 |
| START_STATION | Inbound station ID | 43 |
| START_STATION_NAME | Inbound station name | Shuangjing |
| START_TIME | Entry time | 06:34:41 |
| START_LOG | Longitude coordinates of inbound station | 116.46315 |
| START_LAT | Start station latitude coordinates of inbound station | 39.893464 |
| END_LINE | Terminal line | Line 5 |
| END_DIR | Terminal direction | 0 |
| END_STATION | Outbound station ID | 53 |
| END_STATION_NAME | Outbound station name | Dongdan |
| END_TIME | Outbound time | 06:54:09 |
| END_LOG | Longitude coordinate of outbound station | 116.41848 |
| END_LAT | Latitude coordinate of outbound station | 39.908325 |
| TRIP_DISTANSE | Trip distance | 5156 |
| ID | Trip ID | 529360 |
| Field | Description | Example |
|---|---|---|
| CITY | Administrative District | Beijing |
| NAME | Location Name | Huajiadi Park |
| ADDRESS | Location Address | 150 m west of Huajiadi South Street |
| TYPE | POI Type | tourist attraction |
| LONGITUDE | Longitude | 116.4641084026119 |
| LATITUDE | Latitude | 39.97475432622309 |
| TIMESTAMP | Time | 2022-05-18 |
| True 4 | True 3 | True 1 | True 2 | Class Precision | |
|---|---|---|---|---|---|
| Pred. 4 | 117 | 1 | 4 | 34 | 75.00% |
| Pred. 3 | 3 | 19 | 1 | 4 | 70.37% |
| Pred. 1 | 5 | 0 | 22 | 10 | 59.46% |
| Pred. 2 | 25 | 2 | 23 | 72 | 59.02% |
| class recall | 78.00% | 86.36% | 44.00% | 60.00% |
Publisher’s Note: MDPI stays neutral with regard to jurisdictional claims in published maps and institutional affiliations. |
© 2022 by the authors. Licensee MDPI, Basel, Switzerland. This article is an open access article distributed under the terms and conditions of the Creative Commons Attribution (CC BY) license (https://creativecommons.org/licenses/by/4.0/).
Share and Cite
Xu, D.; Zhang, X.; Zhang, X.; Yu, Y. Type Identification of Land Use in Metro Station Area Based on Spatial–Temporal Features Extraction of Human Activities. Sustainability 2022, 14, 13122. https://doi.org/10.3390/su142013122
Xu D, Zhang X, Zhang X, Yu Y. Type Identification of Land Use in Metro Station Area Based on Spatial–Temporal Features Extraction of Human Activities. Sustainability. 2022; 14(20):13122. https://doi.org/10.3390/su142013122
Chicago/Turabian StyleXu, Dandan, Xiaodong Zhang, Xinghua Zhang, and Yongguang Yu. 2022. "Type Identification of Land Use in Metro Station Area Based on Spatial–Temporal Features Extraction of Human Activities" Sustainability 14, no. 20: 13122. https://doi.org/10.3390/su142013122