Early Warning for Manufacturing Supply Chain Resilience Based on Improved Grey Prediction Model


School of Management, Zhejiang University of Technology, Hangzhou 310023, China
*
Authors to whom correspondence should be addressed.
Sustainability 2022, 14(20), 13125; https://doi.org/10.3390/su142013125
Submission received: 3 September 2022
/
Revised: 10 October 2022
/
Accepted: 11 October 2022
/
Published: 13 October 2022
Abstract
:In a dynamic, uncertain environment, increased supply chain resilience can improve business quality. Predicting changes in enterprise supply chain resilience can help enterprises adjust their operational strategy timeously and reduce the risk of supply and demand interruption. First, a comprehensive resilience assessment framework for manufacturing enterprises was constructed from the perspective of the supply chain, and an improved technique for order of preference by similarity to the ideal solution (TOPSIS) method was used to quantify the resilience level. Considering that the resilience index is easily affected by uncertain factors, and this produces large fluctuations, the buffer operator and metabolism idea are introduced to improve the grey prediction model. This improvement can realize dynamic tracking of the enterprise resilience index and evaluate changes in the enterprise resilience level. Finally, through the analysis of the supply chain data of a famous electronic manufacturing enterprise in China over a two-and-a-half-year period, the results show that the improved TOPSIS method and the improved grey prediction model are effective in improving the supply chain resilience of manufacturing enterprises. This study provides a reference method for manufacturing enterprises to improve their supply chain resilience.
1. Introduction
High-quality development of the manufacturing industry plays an important role in promoting regional economic development and improving regional core competitiveness [1]. However, increasingly fierce international competition and a complex business environment make the supply chain of the manufacturing industry vulnerable to many uncertain factors. Natural disasters, political instability, public emergencies, and wars have a destructive impact on the production and operation of supply chain node enterprises [2]. Decision-makers attempt to reduce the impact of uncertain events through traditional risk management methods, such as interpretive structural models and event trees [3]. However, owing to the sudden occurrence and uncertainty of events, enterprises typically find it challenging to account for all risk events and respond in a timely manner. Without a proactive and comprehensive approach to improve the anti-risk capability of the system [4], enterprises will easily encounter difficulties, such as operational interruptions, which will affect the entire manufacturing supply chain.
In recent years, research on supply chain resilience and sustainability has received increasing attention. Resilience stresses a system’s ability to adapt to uncertain environments, respond quickly to sudden risks, and recover quickly after the occurrence of risks [5]. Having a high level of resilience can help companies achieve higher-quality operations and sustainability in an uncertain environment. Sustainability is defined as the management of materials, information, and capital flow in a system from the three dimensions of economy, environment, and society, to achieve sustainable development of the system [6]. Regarding the relationship between resilience and sustainability, Zavala-Alcivar et al. [7] believe that if a supply chain wants to meet the requirements of sustainability, its operational process must be resilient, and this resilience management will also affect the sustainability of the supply chain. Therefore, resilience management through quantitative and integrated analyses can effectively help supply chains improve sustainability.
Similar to research on risk management, the multi-attribute decision-making method (MCDM) can be used to measure the resilience level of enterprises during the operation process. Pournader et al. [8] constructed a supply chain risk resilience assessment model using data envelopment analysis (DEA) and fuzzy set theory. Pei et al. [9] used grey correlation analysis and a back propagation neural network to evaluate the safety of production resilience by considering the influence of recovery, self-organizing, and learning resilience to improve the safety production resilience of enterprises. However, these multi-attribute decision-making methods are easily restricted by the sample size and indicators, and their application scenarios are limited. TOPSIS can overcome these shortcomings and is suitable for comprehensive evaluation under various scenarios. The traditional technique for order of a preference by similarity to the ideal solution (TOPSIS) method cannot solve the problems of linear correlation among the indicators, and the setting of index weights is not acceptable. Therefore, researchers have improved the method from two different directions: one is to improve the distance formula, and the other is to combine the determination method of weights to make the evaluation results more scientific. Liu et al. [10] proposed a toughness evaluation model, MTS-GRA-TOPSIS, based on the weighted Mahalanobis distance and grey relational TOPSIS, aimed at the resilience of agricultural water and soil resources in the face of various disasters. Tadic et al. [11] combined the fuzzy analytic hierarchy process (FAHP) and the TOPSIS method to evaluate the factors influencing the organizational resilience of small and medium enterprises. Mohammed et al. [12] proposed the concept of green resilience and evaluated the resilience of a supply network by constructing a fuzzy multi-objective programming model (GR-FMOPM) combined with the FAHP and TOPSIS methods. In the quantification process of resilience, the linear correlation between resilience indicators was weak, but different indicator weights had a significant impact on the evaluation results. Therefore, by combining the FAHP to set the weights, the evaluation results can be made more convincing.
In addition, it is important to prevent supply chain disruptions and improve system resilience by improving the early warning capability of enterprises [13]. In an uncertain environment, supply chain resilience typically remains unstable for long periods. With knowledge of early warning signs, companies can make timely strategic changes and reduce the likelihood of disruptions. It is difficult to achieve accurate predictions using conventional quantitative analysis methods in uncertain environments, and the indicators related to enterprise resilience are greatly affected by recent events. Grey system theory has higher accuracy in predicting small samples of uncertain information [14]; therefore, it has been widely used. Traditional grey prediction methods require smooth data series. Therefore, the performance of the traditional prediction methods for series data with fluctuating characteristics is poor. To solve this problem, some scholars have introduce da method of weakening the buffer operator to modify the original sequence, so that the modified sequence is relatively smooth. Rajesh [15] analyzed enterprise resilience from the aspects of flexibility, responsiveness, and production efficiency, and used the improved grey forecasting model to measure resilience. According to the five evaluation dimensions of retail resilience, the grey model is used to predict resilience, and the Markov model based on movement probability is used to modify the prediction results, which can effectively help managers improve their decision-making abilities [16]. In addition, some scholars have introduced a metabolism theory into grey prediction to improve the accuracy of short-term prediction through iterative updating [17]. However, the advantages of these two methods have not been combined to improve the grey prediction model for improving the accuracy of short-term predictions of volatility series.
Abundant research has been conducted on the measurement, evaluation, and prediction of enterprise resilience in many industries. However, measuring the supply chain resilience of manufacturing enterprises and building a practical resilience early warning system requires further study. This study focuses on two aspects. First, based on relevant research and the investigation of manufacturing enterprises, an evaluation index system framework of supply chain resilience of manufacturing enterprises was constructed, and the resilience level was quantified. Second, by introducing a buffer operator and metabolism idea into grey theory, the supply chain resilience of manufacturing enterprises was dynamically predicted, and a resilience early warning system was constructed. By collecting the operational data of a large electronics manufacturing enterprise in China for two and a half years during the COVID-19 pandemic, this study monitored the resilience level, effectively helping enterprises adjust their production and operation strategies in a timely manner and improve their early warning capabilities.
2. Evaluation Index System of Supply Chain Resilience
2.1. Analysis of Indexes Affecting Resilience
Resilience can be measured using various methods. Existing studies on resilience evaluation are multifaceted, including collaboration, visibility, security redundancy, market location, and partnership [18]. For manufacturing companies, supply chain resilience is crucial for high-quality development. Supply chain resilience refers to the supply chain’s ability to prevent and respond to uncertain events, recover from disruptions, and maintain normal operational levels [5]. Therefore, when analyzing indicators of supply chain resilience, researchers primarily analyze the factors affecting resilience according to three factors: responsiveness, adaptability, and resilience [19]. Hosseini and Barker [20] drew on the ideas of Vugrin et al. [19] and used a Bayesian network model to evaluate the resilience of different suppliers in terms of absorption, adaptation, and resilience. Kazemian et al. [21] selected eight factors affecting supply chain resilience from three dimensions: supply network size, density, and proportion of suppliers.
Therefore, on the basis of our literature review and enterprise investigation, this study focuses on the perspective of the manufacturing enterprise supply chain and analyzes the indicators affecting the resilience level from three dimensions: responsiveness, adaptability, and resilience itself. These three dimensions target the stages before, during, and after the occurrence of uncertain events. Table 1 shows the current research on resilience dimensions and indicators selection.
- (1)
- Responsiveness. Responsiveness refers to an enterprise’s ability to perceive and predict the risks of external information in the operational process [22]. Agility and collaboration are key indicators that affect supply chain responsiveness. Agility requires enterprises to respond quickly to market demand or supply changes and to help them deal with uncertain risks in a timely manner [23,28]. Among these factors, an extended delivery lead time and slow order response speed indicate that the enterprise has a poor perception of production, demand, and other information. Collaborative capability emphasizes that enterprises and partners reduce uncertain risks and improve service levels through information-sharing and the application of information technology [4]. Reduced information-sharing, limited timely delivery of materials, and a qualified rate of material supply indicates that the production and delivery capacity of the cooperative enterprise cannot meet the requirements, or the organization and management of the production process cannot keep up with the requirements of the enterprise operation, and it is difficult for the enterprise to respond quickly to uncertain events.
- (2)
- Adaptability. Adaptability enables enterprises to maintain stable production and operation during emergencies and reduces the possibility of interruption risk, which can be reflected by two indicators: flexibility and security redundancy. Enterprise flexibility refers to the ability to quickly adjust production and operational plans according to demand and environmental conditions during emergencies [24]. The safety redundancy index reflects the strategic use of excess reserve resources by enterprises to improve their ability to cope with sudden risks [25].
- (3)
- Recovery. Recovery refers to the supply chain’s ability to quickly return to normal operations after the occurrence of disruption risk [26]. Emergency response capability refers to the establishment of an emergency mechanism by means of resource reallocation and information monitoring after an operational interruption to improve recovery capability [27]. The emergency capacity of an enterprise includes standby suppliers, on-time delivery of finished products, and a qualified rate of finished products. The higher these indicators, the higher the production and operation efficiency of an enterprise and the faster it can return to normal production and operation after interruption. In addition, logistics support can guarantee the transportation and distribution of goods under interrupted conditions.
2.2. Construction of Resilience Evaluation Index System
Based on the aforementioned analysis and discussion, we conducted field interviews to investigate a large electronics manufacturing enterprise. Based on a detailed understanding of the actual business process of the enterprise, several rounds of interviews were conducted with the relevant directors of the supply chain department of the enterprise. The departments interviewed include planning, production, storage, etc., and these were chosen mainly to understand the main factors affecting the resilience of the company’s supply chain and the corresponding adjustment strategies in the case of external interference. Subsequently, we also made a return visit to build and continuously optimize the evaluation hierarchy of the supply chain resilience of manufacturing enterprises. Finally, we obtained a hierarchical model of supply chain resilience evaluation, as shown in Figure 1. The construction of the three hierarchical models is beneficial for the quantification of indicators and the evaluation of resilience. These indicators can not only comprehensively reflect the current level of enterprise supply chain resilience but also analyze the changing trend of enterprise resilience through the real-time collection of enterprise operation data series at different moments of prediction.
3. Evaluation and Prediction of Supply Chain Resilience
3.1. Evaluation of Supply Chain Resilience
The evaluation of supply chain resilience requires comprehensive quantification of the indicators of each dimension. Combined with related research, we used FAHP and an improved TOPSIS to quantify the resilience level of the supply chain. Suppose that the data of j (j = 1,2,…,n) resilience evaluation indicators of an enterprise at i (i = 1,2,…,m) decision points are collected. First, the weights of the evaluation indicators are determined.
3.1.1. Determination of the Indicator Weight
In view of the shortcomings of the traditional analytic hierarchy process (AHP) method, this study extends the AHP method to a fuzzy environment by referring to the research of Jiet et al. [29].The FAHP method was used to construct a fuzzy consistency matrix to eliminate the consistency problem of experts in the process of weight assignment and make weight allocation more reasonable. The calculation steps of the FAHP method are as follows:
Step 1: According to the hierarchical structure of the evaluation index system of supply chain resilience, the evaluation factor sets at different levels were established, including three first-level indicators, six second-level indicators, and thirteen third-level indicators.
Step 2: Referring to the five-scale method [30] (as shown in Table 2), the importance degree (i,j = 1,2,…,n) between the two indicators is compared using expert scoring, and the fuzzy complementary judgment matrix is constructed.
Step 3: By summing each row of the fuzzy complementary judgment matrix , we obtain:
and the fuzzy consistency matrix is obtained.
Step 4: By normalizing the fuzzy consistency matrix, the weight W = (ω1,ω2,…,ωn) of each resilience indicator was obtained. The normalization formula is as follows:
among them, .
Step 5: The characteristic matrix of is constructed and the compatibility index of the matrix is calculated as follows:
If , it passes the consistency test.
3.1.2. Quantification of Resilience Level Based on Improved TOPSIS
TOPSIS is a ranking method for approximating ideal points in multi-objective decision analysis. This method quantifies the evaluation object by determining the Euclidean distance between each solution and the positive/negative ideal solution and has been widely used in manufacturing, medicine, risk management, and other fields with good evaluation effects [31]. The determination of a positive/negative ideal solution often depends on the optimal and the worst values of each index. As a result, the overall resilience level of the target cannot be evaluated in a more accurate way, owing to the influence of the current data characteristics during normalization. However, the evaluation results can be made more convincing by optimizing and adjusting the positive and negative ideal solutions [32,33].Considering that the indicators in the actual operation process of enterprises often cannot reach the ideal state, the model is improved by setting the optimal value and worst value by experts based on the investigation of enterprises so that the model can better reflect the current resilience level of enterprise operations.
The specific steps to improve the TOPSIS method are as follows:
Step 1: Determine the optimal and worst solution sets of the index according to the industry standards and expert opinions, denoted as follows:
where j = 1,2…, n. For the negative index, the optimal solution is smaller than the worst solution.
Step 2: Normalize the initial evaluation matrix to obtain the feature matrix :
where is the value of index jof the enterprise at time i.
Step 3: Using the index weight matrix Wn×n obtained using the FAHP method, the weighted feature matrix is calculated as follows:
Step 4: Calculate the Euclidean distance between each index and the positive and negative ideal solutions for decision time i:
where i = 1,2,…,m, and and are the maximum and minimum values of each column of the characteristic matrix , respectively.
Step 5: Score the resilience level of the enterprise at decision time i and obtain its value:
where . The higher is, the stronger the resilience of the enterprise at time i.
3.2. Prediction of Resilience Indicators Based on Improved Grey Prediction Method
The resilience of enterprises is relatively stable from a macro perspective, whereas from a micro perspective, the resilience of enterprises is more prone to fluctuations caused by unconventional factors, and distant historical data have a reduced impact on the future state. Therefore, traditional forecasting methods such as neural networks and support vector machines, which rely on a large amount of historical data to predict the future state, are seldom accurate. The grey prediction method with uncertain information and a small sample can predict the future state according to limited grey information [34].
The enterprise resilience index is disturbed by uncertain factors, which usually produce a fast or slow evolution trend, whereas the prediction accuracy of the grey forecasting method for non-smooth series is not high. Therefore, by introducing a buffer operator [15] to modify the original sequence, a sequence with random fluctuation characteristics can be predicted and the prediction accuracy can be greatly improved. The improved grey prediction method includes the following five steps:
- (1)
- Stepwise ratio checkout was used to analyze the feasibility of the model.
- The time series of the resilience index r is given as follows:where (i = 1,2…,n), and n denotes the number of prediction samples. To judge whether the grey prediction method can be used for sequence data by calculating the stage ratio:where k = 1,2,…,n. For , if , it passes a stepwise ratio checkout.
- (2)
- Weakening the buffer operator D.
If the index sequence fails to pass the stepwise ratio checkout, the average weakening buffer operator D(AWBO) is introduced to correct the original sequence. Let us set , where
and k = 1,2,…,n. The corrected sequence can be obtained, and Step (1) can be repeated for verification. If verified, we proceed to Step (3).
- (3)
- Establishmentof GM(1,1) model.
The modified sequence is accumulated once (1-AGO) to generate the sequence:
where . Let be the background value of , where
Then, the whitening differential equation of GM(1,1) is:
where a is the grey number for development and μ is the grey number for endogenous control. This simplifies to:
The leastsquares method is used to estimate the equation parameters, and the parameters a and μ to be estimated satisfy:
where:
To solve the parameters, we use , and the time response sequence of the grey differential equation can be obtained as follows:
where k = 1,2,…,n − 1. A cumulative reduction (IAGO) operation was performed on the obtained sequence to obtain the final prediction result as follows:
where k = 1,2,…,n.
- (4)
- Metabolism model for grey prediction.
The traditional grey model is based on past static data at time t for prediction; however, in an uncertain environment, new grey information will be added to the prediction system. As time passes, the older the data, the less information it contains, and the error accumulates when grey theory is used for prediction. The metabolism model can add the idea of a real-time dynamic update of information to the grey prediction to realize a dynamic prediction of the sequence, effectively reducing the prediction error [35].
If n original data are required for the prediction, the metabolism model selects the data in the time range t to predict the data at time t + 1 and then removes the oldest data , and adds the new data . Considering this, as the original series , where t = 1,2,…,n − 1, a new prediction model is obtained. Step (3) is repeated to achieve the desired metabolism. By constantly updating the data series and dynamically predicting the data at time t + 1, a new prediction series was obtained. When t + 1 = n, the predicted data are added to the original sequence, and the subsequent data are predicted. Therefore, the decision-maker can obtain the predicted value of the development trend according to existing information to help the enterprise make timely strategy adjustments.
- (5)
- Model verification.
Because the model requires multiple iterations, we selected the mean absolute percentage error (MAPE) to check the validity of the model:
where n is the number of predicted samples, the predicted value at time i, and the true value at time i.
3.3. Resilience Early Warning Process Based on TOPSIS-Grey Prediction
To quantify the resilience level of enterprise supply chains more accurately, this study proposes an improved FAHP-TOPSIS method that includes the processes of resilience indicators selection, designing an expert questionnaire, and TOPSIS evaluation. This study also used buffer operators for sequence correction, one-accumulation generation operation (1-AGO), predicted cumulative sequence, and inverse accumulated generation operation (IAGO) in order to construct an improved grey prediction method to predict the resilience characteristics of future times to achieve a better prediction effect. The method was combined with the improved grey prediction method to describe the resilience characteristics of future times to achieve a better prediction effect. By further analyzing the evolution of an enterprise’s supply chain resilience at different times, the enterprise’s resilience early warning ability is realized, and the supply chain interruption risk is reduced. The entire enterprise supply chain resilience warning process is illustrated in Figure 2.
4. Numerical Calculation and Analysis
4.1. Background and Data Description
As an example, a numerical calculation process was tested in a large electronic manufacturing enterprise in China. The company is a leading manufacturer of security products worldwide. However, in recent years, owing to the rapidly changing external environment, especially the impact of international supply chain disruptions and the COVID-19 pandemic, the daily operation of companies has encountered great challenges. The company urgently needs to establish an early warning mechanism for supply chain resilience, which can track and predict the changes in the company’s supply chain resilience indicators in real time, help decision-makers adjust the enterprise operation strategy in time, and reduce the risk of supply or production interruption.
In the course of interviewing the directors of the supply chain-related departments of the electronics manufacturing enterprise studied, we learned in detail about the availability of data on resilience indicators and the substitutability of the related indicators. All available and alternative indicator data were exported from the ERP system (SAP) used by the enterprise. Owing to the complexity of the company’s business process and product line, we selected a typical product line of the company and collected 13 resilience indicator data points from 30 monthly time nodes from January 2020 to June 2022. Considering the characteristics of the industry and the actual operation of the company, some resilience evaluation indicators were replaced by relevant indicators. For example, the order response speed is replaced by the 24 h order response ratio, and the on-time material delivery ratio is replaced by the material pickup achievement ratio. In addition, the optimal and worst solutions of each index are determined according to experts’ understanding of the industry and its competitors. The relevant data were preprocessed by normalization.
4.2. Quantification of Resilience Indicators
Because of the complexity of the three-level hierarchy, ignoring second-level indicators does not affect the results or presentation of the research. Therefore, this study simplifies the hierarchy of the evaluation index for enterprise supply chain resilience. Simultaneously, by comparing the importance of resilience indicators under the different dimensions according to the scoring rules given in Table 2, the expert questionnaire was designed and distributed to an expert group composed of 20 people. The expert group consisted of senior management of the supply chain department of the enterprise and professors from several local universities in the supply chain field, and a total of 18 valid questionnaires were collected. The FAHP method was used to calculate the weight of each index, all of which passed the consistency check, as presented in Table 3.
Different industries place varying emphasis on the dimensions of resilience. According to the weight calculation results above, the responsiveness of manufacturing supply chain resilience occupies a large weight in the three dimensions, which is consistent with Rajesh’s [15] conclusion in that responsiveness is the primary demand for gaining market share and achieving sustainable competitiveness. At the same time, Rajesh [36] evaluated the resilience level of manufacturing supply chain, and concluded that attributes such as demand risk, response speed, and information-sharing made significant contributions to supply chain resilience, which required special attention. These results also verify the above weight calculation results.
Thus, a weight coefficient matrix W was constructed, and the quantitative value of the company’s supply chain resilience was calculated using the improved TOPSIS method. The resilience distribution of the companies from 2020 to 2022 is shown in Figure 3.
As shown in Figure 3, the company’s supply chain resilience value is distributed between 0.45 and 0.70 from 2020 to 2022, with the majority greater than 0.5. However, the overall performance of the company’s supply chain resilience is not strong enough, and there are many time nodes with a resilience distribution between 0.55 and 0.60, accounting for 1/3 of the total sample number. Reflecting the double pressure of international supply chain interruption and the pandemic over the past two years, the influence of uncertain factors creates room for improvement in the company’s supply chain resilience.
4.3. Grey Prediction of Resilience Indicators
Some resilience indicators were relatively stable over time, whereas others were not. Therefore, we must select supply chain resilience indicators that are susceptible to external factors and predict future changes based on historical data from the past two years. According to the characteristics of the industry and the actual circumstances of the company, seven unstable forecasting indicators were selected, with a forecast period of three months. The selected resilience indicators and the corresponding original data are listed in Table 4.
Through the analysis of the original data series, it was found that the original data belong to the non-smooth series, which is impacted by external factors, the fluctuation range of the data is large, and the model cannot pass the stepwise ratio checkout. After introducing the weakening buffer operator to correct the original data sequence, it smoothly passed the stepwise ratio checkout. The traditional GM(1,1), AWBO buffer operator modified GM(1,1), and metabolism model modified GM(1,1) models were used to predict the seven selected resilience indicators. The metabolic cycle t was set to6 months, and the MAPE was used to check the accuracy of the prediction model. The prediction results are listed in Table 5.
By comparing the average MAPE of the prediction results of the seven resilience indicators using the different grey prediction methods, it can be observed that the traditional grey prediction method has a poor prediction effect on the non-smooth data series because of the volatility of the original series. However, the AWBO buffer operator can be used to improve the highly volatile indicator values according to the rules of the series information, which makes the modified original data series relatively smooth and reduces the prediction error to a certain extent. In addition, by using metabolism theory to predict the modified series, it can dynamically eliminate older data, so that the prediction results are greatly influenced by the more recent time series. This increased the accuracy of the prediction result, and the average error of the model prediction was reduced from 23.77% to 3.67%. For the prediction of resilience indicators of manufacturing enterprises in uncertain environments, the improved grey prediction method is significantly better than the traditional method, particularly for short-term prediction with high accuracy.
4.4. Evolutionary Analysis of Resilience Indicators
By analyzing the real evolution of data trends, enterprises can use the information gained to adopt change strategies and make decision-makers pay more attention to indicators with negative evolution paths [15,16]. To further analyze the future evolution trend of resilience indicators, this study predicts the resilience indicators from July to September 2022 based on the improved grey prediction model of metabolism and quantifies the future supply chain resilience of the company. The evolution of supply chain resilience from January 2020 is illustrated in Figure 4.
As shown in Figure 4, a company’s resilience is unstable due to uncertain factors such as technological competition between countries, economic fluctuations, and epidemic prevention and control, and resilience changes significantly at certain times. For example, the company’s supply chain resilience reached its lowest point in August 2021, which was mainly influenced by government demand within the security industry. However, overall, the company’s supply chain resilience showed an upward trend after the introduction of the supply chain resilience warning mechanism. For example, in March 2022, corporate resilience reached a record high, indicating that policymakers could effectively improve resilience and the ability to cope with uncertain risks through operational strategy adjustments.
From a recent perspective, the company’s resilience value is declining relatively rapidly after March 2022. This is because of further international policy sanctions and the interference and influence of domestic epidemic prevention and control strategies, which have affected the supply chain of key materials, capacity support, and sales to varying degrees. According to the prediction of resilience indicator data from July to September, if the company continues to develop according to the existing operational strategy, the resilience of the supply chain will be further reduced, which can easily lead to risk. Accordingly, the decision-maker should implement the operation strategy with a relatively large-scale adjustment in time. Therefore, we further analyzed the reasons for the continuous decline in supply chain resilience from three dimensions: responsiveness, adaptability, and recovery, and the results are shown in Figure 5.
From the evolution trend of the three dimensions in Figure 5, it can be seen that responsiveness is the main factor affecting changes in company resilience. Therefore, enhancing the perception of the external environment and improving early warning ability can effectively improve a company’s supply chain resilience. In addition, the adaptability performance was relatively stable. The company began to adjust its inventory strategy at the beginning of 2021 to buffer supply chain risks through high inventory, greatly improving its adaptive capacity. Figure 5b shows the changing trend of the adaptive capacity. By comparing Figure 4 and Figure 5c, it can be seen that when the company’s supply chain resilience begins to decrease, the level of recovery is often higher because the company’s recovery ability is in play after the occurrence of risks.
In the next three months, although the company’s ability to adapt and recover gradually improved, the impact of reduced responsiveness capacity also reduced supply chain resilience. At this time, the decision-makers of the company should focus on improving the response speed to changes in the external environment and adjust the operation strategy, for example, by improving the processing speed for orders, improving the degree of information sharing with suppliers, and improving the quality of materials and services of suppliers.
The aforementioned prediction results and strategy suggestions were also verified in follow-up enterprise visits. In the most recent return visit (26 September 2022), the company’s supply chain director gave feedback that due to the impact of epidemic prevention and control and international sanctions, the company is facing a trend of declining response speed on the supply and demand side of the supply chain. It was also noted that it is also actively changing through strategy adjustment. This further confirmed the feasibility and practicability of this study.
Cantini et al. [37] proposed a decision support system to help managers and practitioners design and configure the spare parts supply chain to determine whether it is necessary to switch from conventional manufacturing technology to additive manufacturing technology. Similarly, the application of supply chain resilience early warning also needs the support of a decision support system. As part of the intelligent factory construction project, the company’s supply chain resilience early warning system will continue to improve, deploy, and play an important role on the basis of further verification. A prototype system currently under testing includes a data mid-end, a library of evaluation and prediction algorithms, and applications that support the mobile side. Collecting, analyzing, and predicting the comprehensive supply chain resilience indicators’ data can provide early warning and decision support basis for the company’s supply chain managers, practitioners, and other decision-makers in real time. This means that intelligent factories will become smarter and more stable in the uncertain environment.
5. Conclusions
Resilience theory is an important supplement to traditional risk management and can be used to help enterprises identify potential supply chain risks in a timely manner. A quantitative calculation of enterprise supply chain resilience was performed by constructing an evaluation index system of supply chain resilience for manufacturing enterprises. Compared with relevant studies, this study not only evaluates the supply chain resilience of manufacturing enterprises and predicts the future resilience of enterprises based on historical data related to resilience, but also analyzes the resilience level and the evolution process of each resilience index across various dimensions. By constructing an early warning mechanism of supply chain resilience for manufacturing enterprises, the change in resilience and its causes can be grasped in real time, which provides a basis for decision-makers to adjust operational strategies timeously to improve the ability of enterprises to respond to market or environmental changes and reduce the risk of supply chain interruption.
Through the analysis of the actual operational data of a large electronic manufacturing enterprise, the results show that the enterprise is affected by many uncertain factors from 2020 to 2022, resulting in significant fluctuations in the supply chain resilience (the distribution of resilience value is between 0.4 and 0.7), indicating that there is considerable room for improvement in the supply chain resilience of the company. The numerical results also demonstrate that the proposed improved FAHP-TOPSIS method can accurately measure and reflect the supply chain resilience level during the enterprise operation process. The grey prediction method based on the AWBO buffer operator and metabolism model can better solve the problem of data fluctuation; therefore, it can be applied to the prediction of resilience indicator data.
This study enriches the application of the grey prediction method in the field of enterprise supply chain resilience and provides methods for relevant manufacturing enterprises to establish an early warning mechanism of supply chain resilience, maintain a high level of operational resilience, and reduce the risk of disruption. However, this study has some shortcomings. Owing to the difficulty of obtaining some data, some indicators such as visibility and risk prediction must be discarded while constructing the resilience evaluation system. This makes the evaluation of the supply chain resilience of manufacturing enterprises insufficiently comprehensive. Future research should consider two aspects. Resilience warnings in an uncertain environment can be studied from the perspective of general manufacturing companies rather than electronic manufacturing companies. Additionally, the interaction between risk and resilience under external disturbances can be explored by combining the relevant research on risk management.
Additive manufacturing is a disruptive digital technology in Industrial 4.0 technology, and it is also regarded as the next revolution in the field of spare parts [37]. Related research shows that the use of additive manufacturing will affect the resilience of the supply chain by affecting the state and structural dynamics of the supply chain [38]. As a large electronic manufacturing company, supply chain managers are also actively considering how to introduce the decision-making problem of additive manufacturing, in order to further effectively solve the impact of procurement interruption of some key spare parts, especially structural components, on the resilience of their supply chain. This is another important and interesting research direction for the future.
Author Contributions
Conceptualization, F.Q. and X.M.; methodology, F.Q., L.Z. and K.Z.; formal analysis, F.Q. and L.Z.; investigation, F.Q., L.Z., K.Z. and X.M.; resources, F.Q.; data curation, L.Z.; writing—original draft preparation, L.Z.; writing—review and editing, F.Q. and L.Z.; visualization, L.Z. and K.Z. All authors have read and agreed to the published version of the manuscript.
Funding
This research was funded by the National Social Science Foundation of China, grant number 18BJY148; the Philosophy and Social Science Program of Zhejiang Province, grant number 22NDYD040YB and the Humanities and the Social Sciences Project of Zhejiang University of Technology, grant numbers SKY-ZX-20210195 and SKY-ZX-20210161.
Data Availability Statement
The data presented in this study are available upon request from the corresponding author.
Acknowledgments
The authors thank the editor and anonymous reviewers for their constructive comments and encouragement, which have greatly improved our manuscript.
Conflicts of Interest
The authors declare no conflict of interest.
References
- Dou, Z.; Wu, B.B.; Sun, Y.; Wang, T.J.S. The Competitiveness of Manufacturing and Its Driving Factors: A Case Study of G20 Participating Countries. Sustainability 2021, 13, 1143. [Google Scholar] [CrossRef]
- Jabbarzadeh, A.; Fahimnia, B.; Sheu, J.-B.; Moghadam, H.S. Designing a supply chain resilient to major disruptions and supply/demand interruptions. Transp. Res. Part B Methodol. 2016, 94, 121–149. [Google Scholar] [CrossRef]
- Skipper, J.B.; Hanna, J.B. Minimizing supply chain disruption risk through enhanced flexibility. Int. J. Phys. Distrib. Logist. Manag. 2009, 39, 404–427. [Google Scholar] [CrossRef]
- Scholten, K.; Scott, P.S.; Fynes, B. Mitigation processes—Antecedents for building supply chain resilience. Supply Chain Manag. Int. J. 2014, 19, 211–228. [Google Scholar] [CrossRef]
- Ponomarov, S.Y.; Holcomb, M.C. Understanding the concept of supply chain resilience. Int. J. Logist. Manag. 2009, 20, 124–143. [Google Scholar] [CrossRef]
- Seuring, S.; Müller, M. From a literature review to a conceptual framework for sustainable supply chain management. J. Clean. Prod. 2008, 16, 1699–1710. [Google Scholar] [CrossRef]
- Zavala-Alcívar, A.; Verdecho, M.-J.; Alfaro-Saiz, J.-J. A Conceptual Framework to Manage Resilience and Increase Sustainability in the Supply Chain. Sustainability 2020, 12, 6300. [Google Scholar] [CrossRef]
- Pournader, M.; Rotaru, K.; Kach, A.P.; Hajiagha, S.H.R. An analytical model for system-wide and tier-specific assessment of resilience to supply chain risks. Supply Chain Manag. Int. J. 2016, 21, 589–609. [Google Scholar] [CrossRef]
- Pei, J.; Liu, W. Evaluation of Chinese Enterprise Safety Production Resilience Based on a Combined Gray Relevancy and BP Neural Network Model. Sustainability 2019, 11, 4321. [Google Scholar] [CrossRef] [Green Version]
- Liu, D.; Qi, X.; Fu, Q.; Li, M.; Zhu, W.; Zhang, L.; Faiz, M.A.; Khan, M.I.; Li, T.; Cui, S. A resilience evaluation method for a combined regional agricultural water and soil resource system based on Weighted Mahalanobis distance and a Gray-TOPSIS model. J. Clean. Prod. 2019, 229, 667–679. [Google Scholar] [CrossRef]
- Tadic, D.; Aleksic, A.; Stefanovic, M.; Arsovski, S. Evaluation and Ranking of Organizational Resilience Factors by Using a Two-Step Fuzzy AHP and Fuzzy TOPSIS. Math. Probl. Eng. 2014, 2014, 1–13. [Google Scholar] [CrossRef] [Green Version]
- Mohammed, A.; Harris, I.; Soroka, A.; Nujoom, R. A hybrid MCDM-fuzzy multi-objective programming approach for a G-resilient supply chain network design. Comput. Ind. Eng. 2019, 127, 297–312. [Google Scholar] [CrossRef]
- Ge, X.; Yang, J.; Wang, H.; Shao, W. A fuzzy-TOPSIS approach to enhance emergency logistics supply chain resilience. J. Intell. Fuzzy Syst. 2020, 38, 6991–6999. [Google Scholar] [CrossRef]
- Zhang, J.; Wang, T.; Chang, J.; Gou, Y. Forecasting the Number of the Wounded after an Earthquake Disaster Based on the Continuous Interval Grey Discrete Verhulst Model. Discret. Dyn. Nat. Soc. 2021, 2021, 1–11. [Google Scholar] [CrossRef]
- Rajesh, R. Forecasting supply chain resilience performance using grey prediction. Electron. Commer. Res. Appl. 2016, 20, 42–58. [Google Scholar] [CrossRef]
- Rajesh, R.; Agariya, A.K.; Rajendran, C. Predicting resilience in retailing using grey theory and moving probability based Markov models. J. Retail. Consum. Serv. 2021, 62, 102599. [Google Scholar] [CrossRef]
- Liu, H.; Song, W.; Zio, E. Metabolism and difference iterative forecasting model based on long-range dependent and grey for gearbox reliability. Isa Trans. 2022, 122, 486–500. [Google Scholar] [CrossRef]
- Singh, C.S.; Soni, G.; Badhotiya, G.K. Performance indicators for supply chain resilience: Review and conceptual framework. J. Ind. Eng.Int. 2019, 15, 105–117. [Google Scholar] [CrossRef] [Green Version]
- Vugrin, E.D.; Warren, D.E.; Ehlen, M.A. A Resilience Assessment Framework for Infrastructure and Economic Systems: Quantitative and Qualitative Resilience Analysis of Petrochemical Supply Chains to a Hurricane. Process Saf. Prog. 2011, 30, 280–290. [Google Scholar] [CrossRef]
- Hosseini, S.; Barker, K. A Bayesian network model for resilience-based supplier selection. Int. J. Prod. Econ. 2016, 180, 68–87. [Google Scholar] [CrossRef]
- Kazemian, I.; Torabi, S.A.; Zobel, C.W.; Li, Y.H.; Baghersad, M. A multi-attribute supply chain network resilience assessment framework based on SNA-inspired indicators. Oper. Res. 2022, 22, 1853–1883. [Google Scholar]
- Chowdhury, M.M.H.; Quaddus, M. Supply chain readiness, response and recovery for resilience. Supply Chain Manag. Int. J. 2016, 21, 709–731. [Google Scholar] [CrossRef]
- Cabral, I.; Grilo, A.; Cruz-Machado, V. A decision-making model for Lean, Agile, Resilient and Green supply chain management. Int. J. Prod. Res. 2012, 50, 4830–4845. [Google Scholar] [CrossRef]
- Stevenson, M.; Spring, M. Flexibility from a supply chain perspective: Definition and review. Int. J. Oper. Prod. Manag. 2007, 27, 685–713. [Google Scholar] [CrossRef]
- Ivanov, D.; Dolgui, A. Low-Certainty-Need (LCN) supply chains: A new perspective in managing disruption risks and resilience. Int. J. Prod. Res. 2019, 57, 5119–5136. [Google Scholar] [CrossRef] [Green Version]
- Hosseini, S.; Al Khaled, A. A hybrid ensemble and AHP approach for resilient supplier selection. J. Intell. Manuf. 2019, 30, 207–228. [Google Scholar] [CrossRef]
- Pavlov, A.; Ivanov, D.; Dolgui, A.; Sokolov, B. Hybrid Fuzzy-Probabilistic Approach to Supply Chain Resilience Assessment. Ieee Trans. Eng. Manag. 2018, 65, 303–315. [Google Scholar] [CrossRef]
- Carvalho, H.; Duarte, S.; Machado, V.C. Lean, agile, resilient and green: Divergencies and synergies. Int. J. Lean Six Sigma 2011, 2, 151–179. [Google Scholar] [CrossRef]
- Ji, D.-C.; Song, B.-F.; Yu, T.-X. FAHP and its application in the selection of design scheme. Syst. Eng. Electron. 2006, 28, 1692–1755. [Google Scholar]
- Wang, X.; Duan, Q.Q. Improved AHP-TOPSIS model for the comprehensive risk evaluation of oil and gas pipelines. Pet. Sci. 2019, 16, 1479–1492. [Google Scholar] [CrossRef] [Green Version]
- Hatami-Marbini, A.; Kangi, F. An extension of fuzzy TOPSIS for a group decision making with an application to Tehran stock exchange. Appl. Soft Comput. 2017, 52, 1084–1097. [Google Scholar] [CrossRef]
- Niu, D.; Wu, G.; Ji, Z.; Wang, D.; Li, Y.; Gao, T. Evaluation of Provincial Carbon Neutrality Capacity of China Based on Combined Weight and Improved TOPSIS Model. Sustainability 2021, 13, 2777. [Google Scholar] [CrossRef]
- Yu, X.; Suntrayuth, S.; Su, J.F. A Comprehensive Evaluation Method for Industrial Sewage Treatment Projects Based on the Improved Entropy-TOPSIS. Sustainability 2020, 12, 6734. [Google Scholar] [CrossRef]
- Xiao, Q.; Wang, H.S. Prediction of WEEE Recycling in China Based on an Improved Grey Prediction Model. Sustainability 2022, 14, 6789. [Google Scholar] [CrossRef]
- Li, S.Y.; Yang, X.; Li, R.R. Forecasting China’s Coal Power Installed Capacity: A Comparison of MGM, ARIMA, GM-ARIMA, and NMGM Models. Sustainability 2018, 10, 506. [Google Scholar] [CrossRef] [Green Version]
- Rajesh, R. A fuzzy approach to analyzing the level of resilience in manufacturing supply chains. Sustain. Prod. Consum. 2019, 18, 224–236. [Google Scholar] [CrossRef]
- Cantini, A.; Peron, M.; De Carlo, F.; Sgarbossa, F. A decision support system for configuring spare parts supply chains considering different manufacturing technologies. Int. J. Prod. Res. 2022, 60, 1–21. [Google Scholar] [CrossRef]
- Naghshineh, B.; Carvalho, H. The implications of additive manufacturing technology adoption for supply chain resilience: A systematic search and review. Int. J. Prod. Econ. 2022, 247, 108387. [Google Scholar] [CrossRef]
Figure 1.
The hierarchical model of enterprise supply chain resilience evaluation.
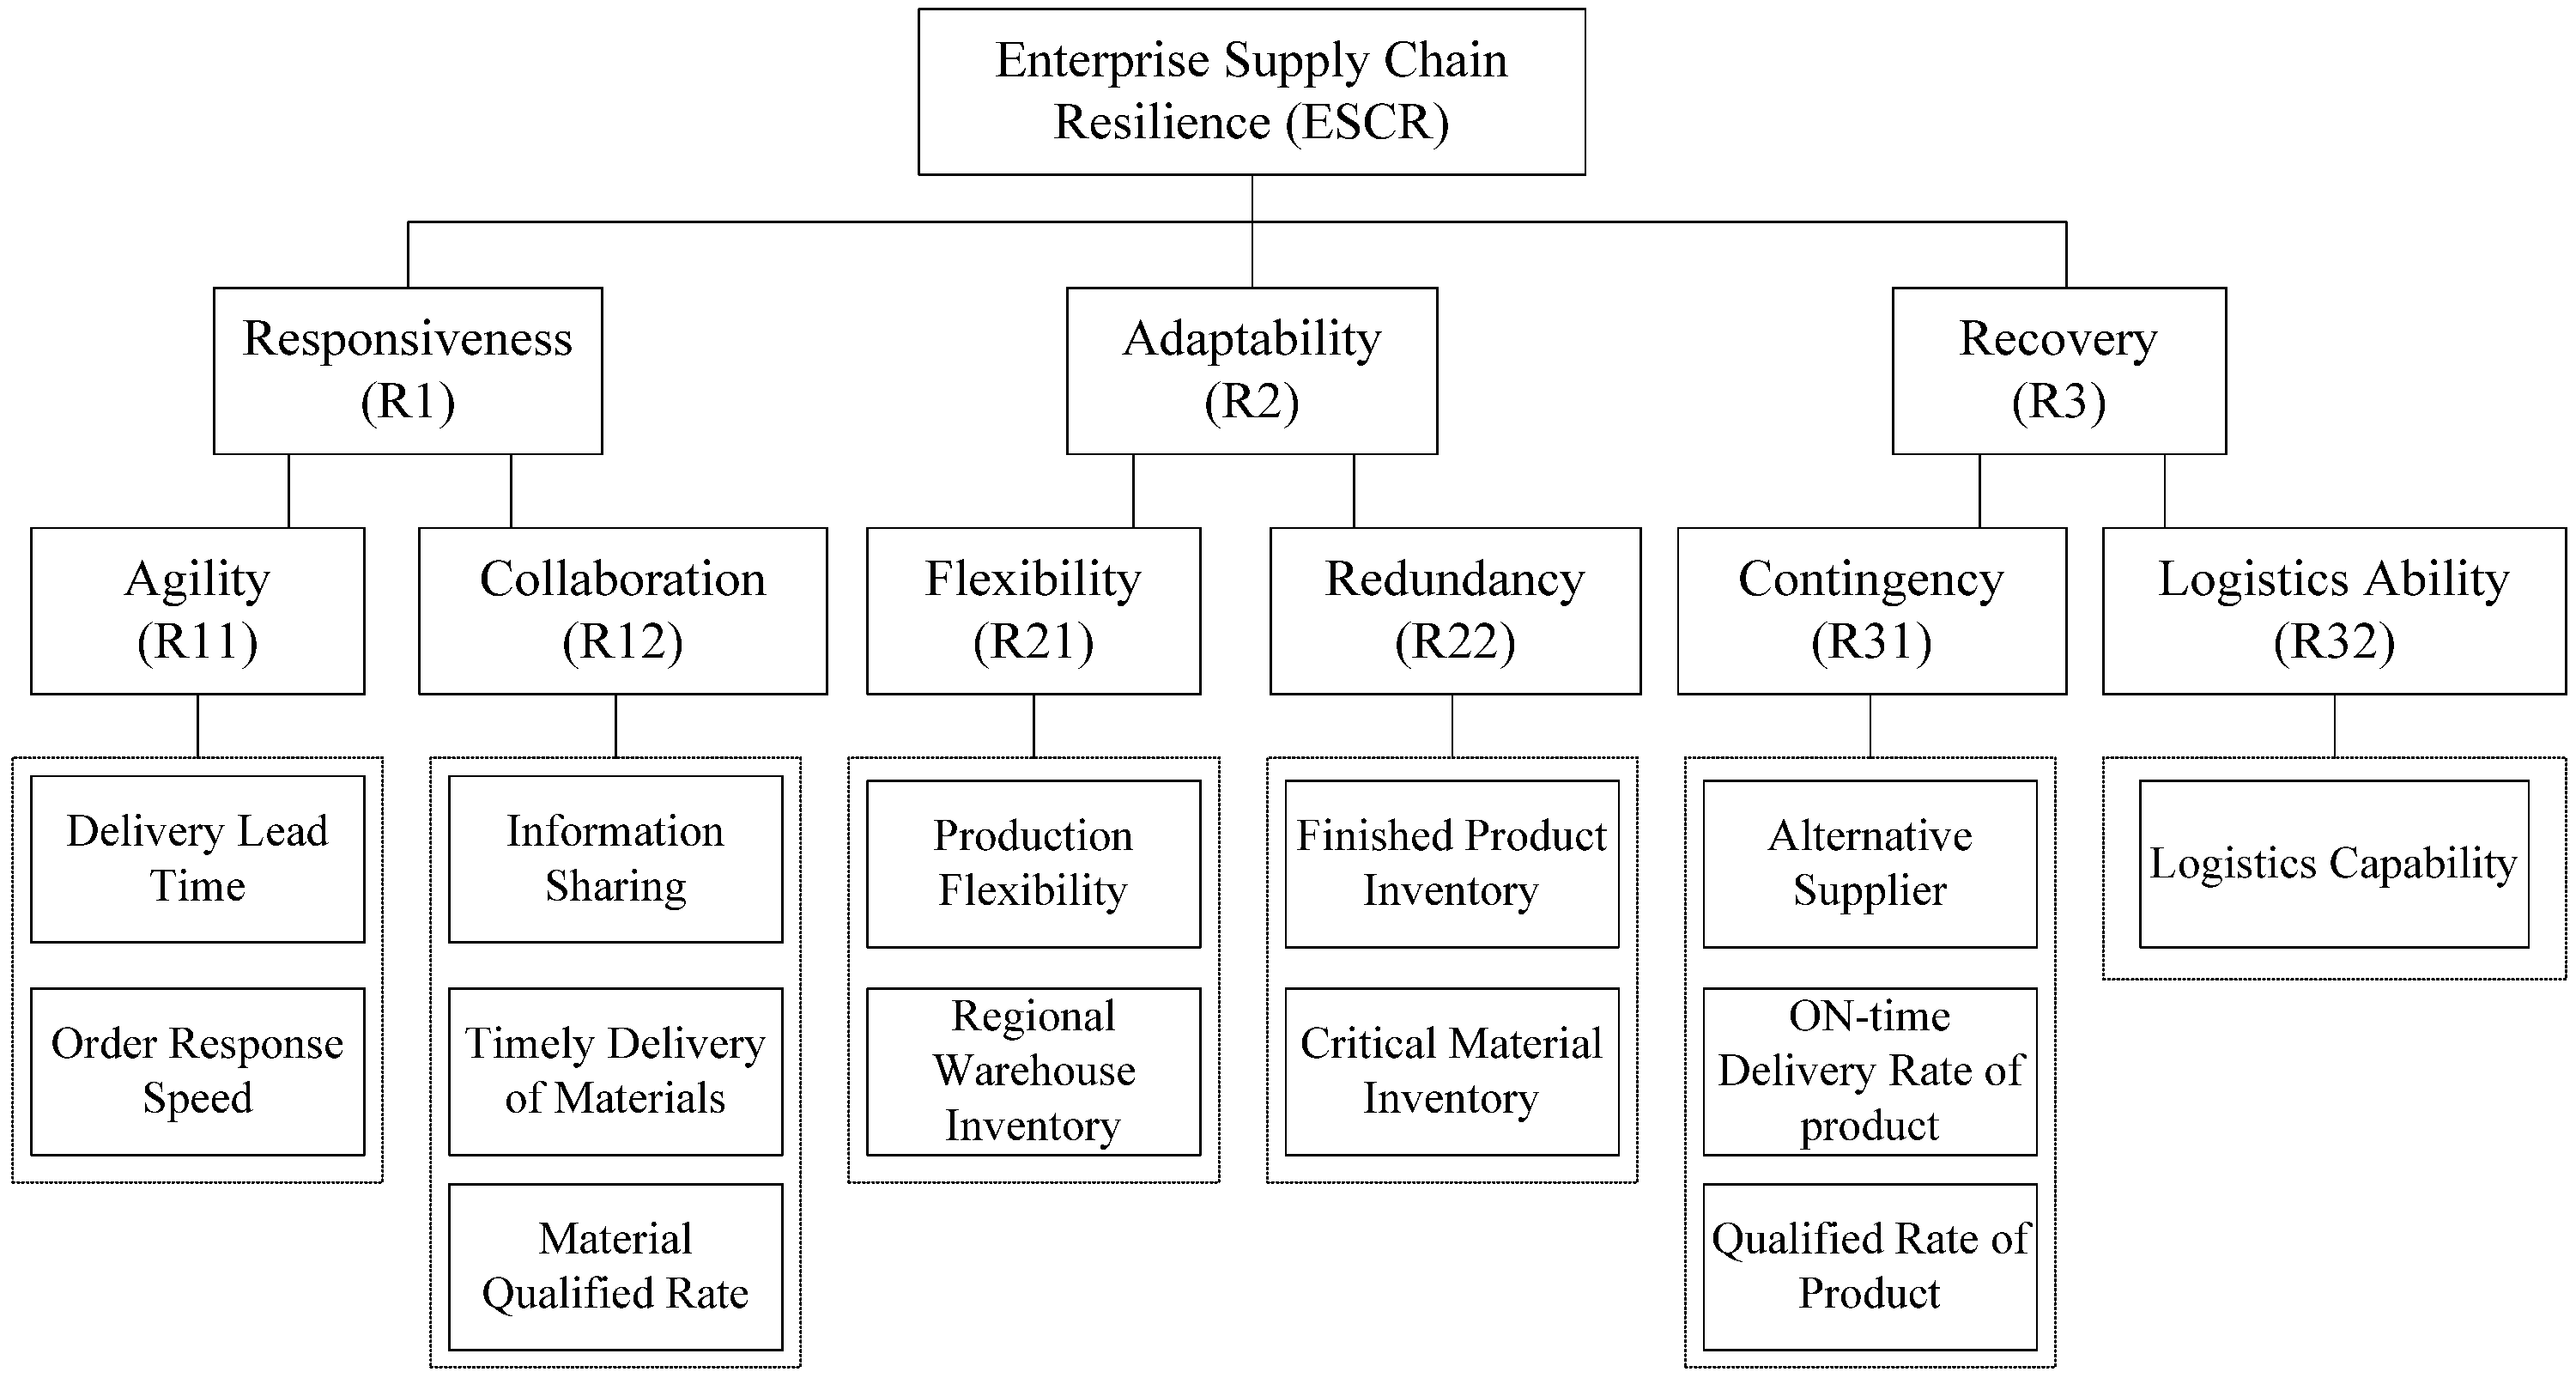
Figure 2.
Early warning process of enterprise supply chain resilience.

Figure 3.
Distribution of the company’s supply chain resilience from 2020 to 2022.
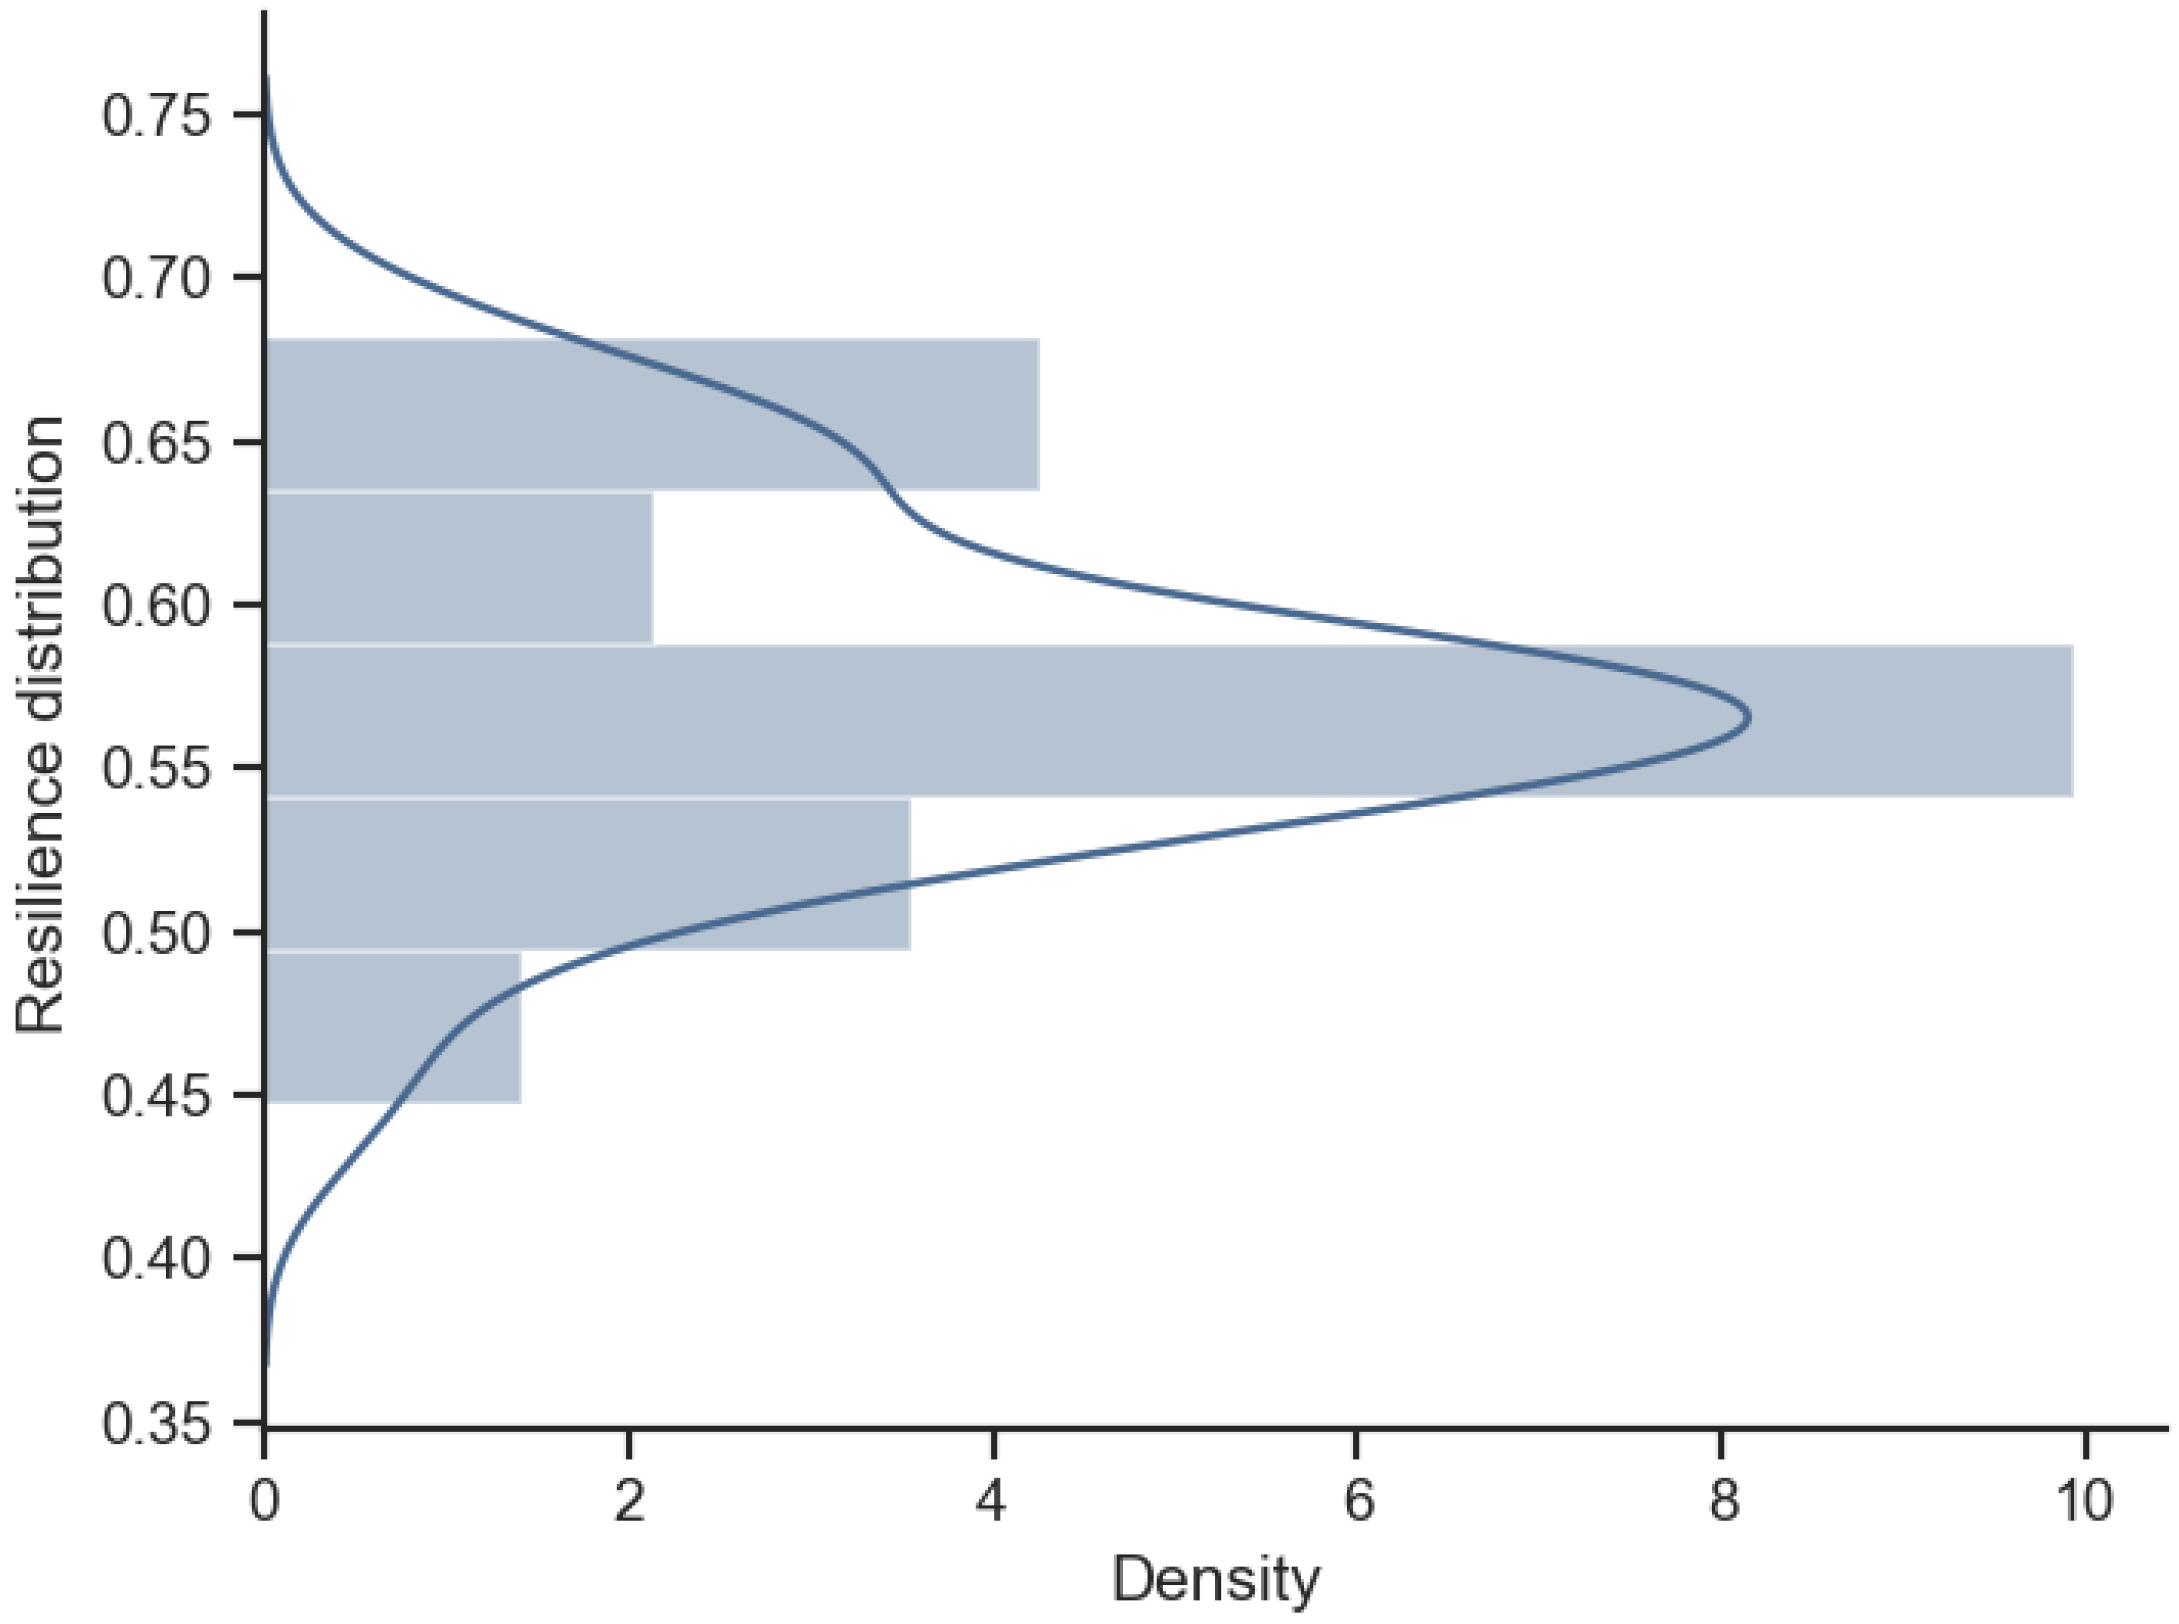
Figure 4.
The evolution trend of enterprise supply chain resilience.

Figure 5.
The evolution trend of each dimension of enterprise supply chain resilience.


Table 1.
The current research on resilience dimensions and indicators selection.
| Literature | Dimensions | Resilience Indicators | ||
|---|---|---|---|---|
| Responsiveness | Adaptability | Recovery | ||
| [4] | √ | √ | Supply chain (re)engineering, collaboration, agility, risk awareness/knowledge management | |
| [18] | √ | √ | Agility, collaboration, information-sharing, awareness, visibility, flexibility, redundancy, market position | |
| [19] | √ | √ | √ | Flexibility, redundancy, robustness, disruptive event, recovery effort |
| [20] | √ | √ | √ | Lead time, surplus inventory, backup supplier, physical protection, rerouting, technical resources, budget resources |
| [21] | √ | √ | √ | Supply network size, density, proportion of suppliers, overall clustering, flow complexity, centralization |
| [22] | √ | √ | Disaster preparation, flexibility, redundancy, visibility, collaboration, recovery time, cost, absorption of disruption | |
| [23] | √ | Lead time, capacity buffers, inventory, risk sharing, rapid configuration, flexible, demand visibility | ||
| [24] | √ | √ | Volume, delivery, production, robustness, re-configuration, relationship, logistics | |
| [25] | √ | √ | √ | Flexibility, decentralization, capacity reservations, risk mitigation inventory, lead time, backup suppliers |
| [26] | √ | √ | Surplus inventory, location separation, backup supplier, robustness, reliability | |
| [27] | √ | Supply chain structure reconfiguration | ||
Table 2.
The five-scale method.
| Intensity of Importance | Definition |
|---|---|
| 0.5 | The factor i is equally as important as factor j |
| 0.6 | The factor i is slightly more important than factor j |
| 0.7 | The factor i is obviously more important than factor j |
| 0.8 | The factor i is substantially more important than factor j |
| 0.9 | The factor i is tremendously more important than factor j |
| Reciprocal | The factor i is compared with factor j as aij. Then, comparison between factors j and i is aji = 1 − aij, aii = 0.5 |
Table 3.
Resilience indicator weight.
| The First Layer | The Second Layer | |||
|---|---|---|---|---|
| Dimension | Local Weights | Resilience Indicator | Local Weights | Global Weights |
| Responsiveness | 0.5102 | Delivery lead time | 0.2641 | 0.1348 |
| Order response speed | 0.2513 | 0.1282 | ||
| Information sharing | 0.1601 | 0.0817 | ||
| Timely delivery of materials | 0.1662 | 0.0848 | ||
| Material qualified rate | 0.1583 | 0.0808 | ||
| Adaptability | 0.2537 | Production flexibility | 0.2583 | 0.0655 |
| Regional warehouse inventory | 0.2509 | 0.0636 | ||
| Finished product inventory | 0.2417 | 0.0613 | ||
| Critical material inventory | 0.2491 | 0.0632 | ||
| Recovery | 0.2361 | Alternative suppliers | 0.2537 | 0.0599 |
| Qualified rate of product | 0.2500 | 0.0590 | ||
| On-time delivery of product | 0.2592 | 0.0612 | ||
| Logistics capability | 0.2371 | 0.0560 | ||
Table 4.
Original data for selected resilience indicators.
| Time | Order Response Speed | Timely Delivery of Materials | Actual Production Capacity | Finished Product Inventory | Critical Material Inventory | On-Time Delivery of Product | Logistics Capability |
|---|---|---|---|---|---|---|---|
| 2020/01 | 0.915 | 0.7009 | 2869 | 3981 | 253264 | 0.910 | 2786 |
| 2020/02 | 0.900 | 0.2091 | 758 | 5496 | 161576 | 0.810 | 1435 |
| 2020/03 | 0.900 | 0.6790 | 3070 | 2655 | 150364 | 0.848 | 2098 |
| 2020/04 | 0.920 | 0.9050 | 4473 | 2933 | 21980 | 0.824 | 2373 |
| 2020/05 | 0.925 | 0.8497 | 5558 | 2880 | 200357 | 0.871 | 2543 |
| 2020/06 | 0.920 | 0.8709 | 5611 | 2681 | 182800 | 0.921 | 2539 |
Table 5.
Comparison of prediction errors for each model (%).
| Indicators | Traditional GM(1,1) | AWBO Buffer Operator Modified GM(1,1) | Metabolic Method Modified GM(1,1) |
|---|---|---|---|
| Order response speed | 3.06 | 1.00 | 0.81 |
| Timely delivery of materials | 10.16 | 3.26 | 2.33 |
| Actual production capacity | 31.19 | 4.69 | 5.39 |
| Finished product inventory | 19.44 | 6.47 | 4.10 |
| Critical material inventory | 47.71 | 6.70 | 3.64 |
| On-time delivery of product | 16.22 | 4.60 | 3.18 |
| Logistics capability | 38.62 | 10.36 | 6.26 |
| MAPE | 23.77 | 5.30 | 3.67 |
Publisher’s Note: MDPI stays neutral with regard to jurisdictional claims in published maps and institutional affiliations. |
© 2022 by the authors. Licensee MDPI, Basel, Switzerland. This article is an open access article distributed under the terms and conditions of the Creative Commons Attribution (CC BY) license (https://creativecommons.org/licenses/by/4.0/).
Share and Cite
MDPI and ACS Style
Qi, F.; Zhang, L.; Zhuo, K.; Ma, X. Early Warning for Manufacturing Supply Chain Resilience Based on Improved Grey Prediction Model. Sustainability 2022, 14, 13125. https://doi.org/10.3390/su142013125
AMA Style
Qi F, Zhang L, Zhuo K, Ma X. Early Warning for Manufacturing Supply Chain Resilience Based on Improved Grey Prediction Model. Sustainability. 2022; 14(20):13125. https://doi.org/10.3390/su142013125
Chicago/Turabian StyleQi, Fangzhong, Leilei Zhang, Kexiang Zhuo, and Xiuyan Ma. 2022. "Early Warning for Manufacturing Supply Chain Resilience Based on Improved Grey Prediction Model" Sustainability 14, no. 20: 13125. https://doi.org/10.3390/su142013125
Note that from the first issue of 2016, this journal uses article numbers instead of page numbers. See further details here.