The Impact of Chinese Carbon Emissions Trading System on Efficiency of Enterprise Capital Allocation: Effect Identification and Mechanism Test


Abstract
:1. Introduction
2. Literature Review
3. Research Hypothesis
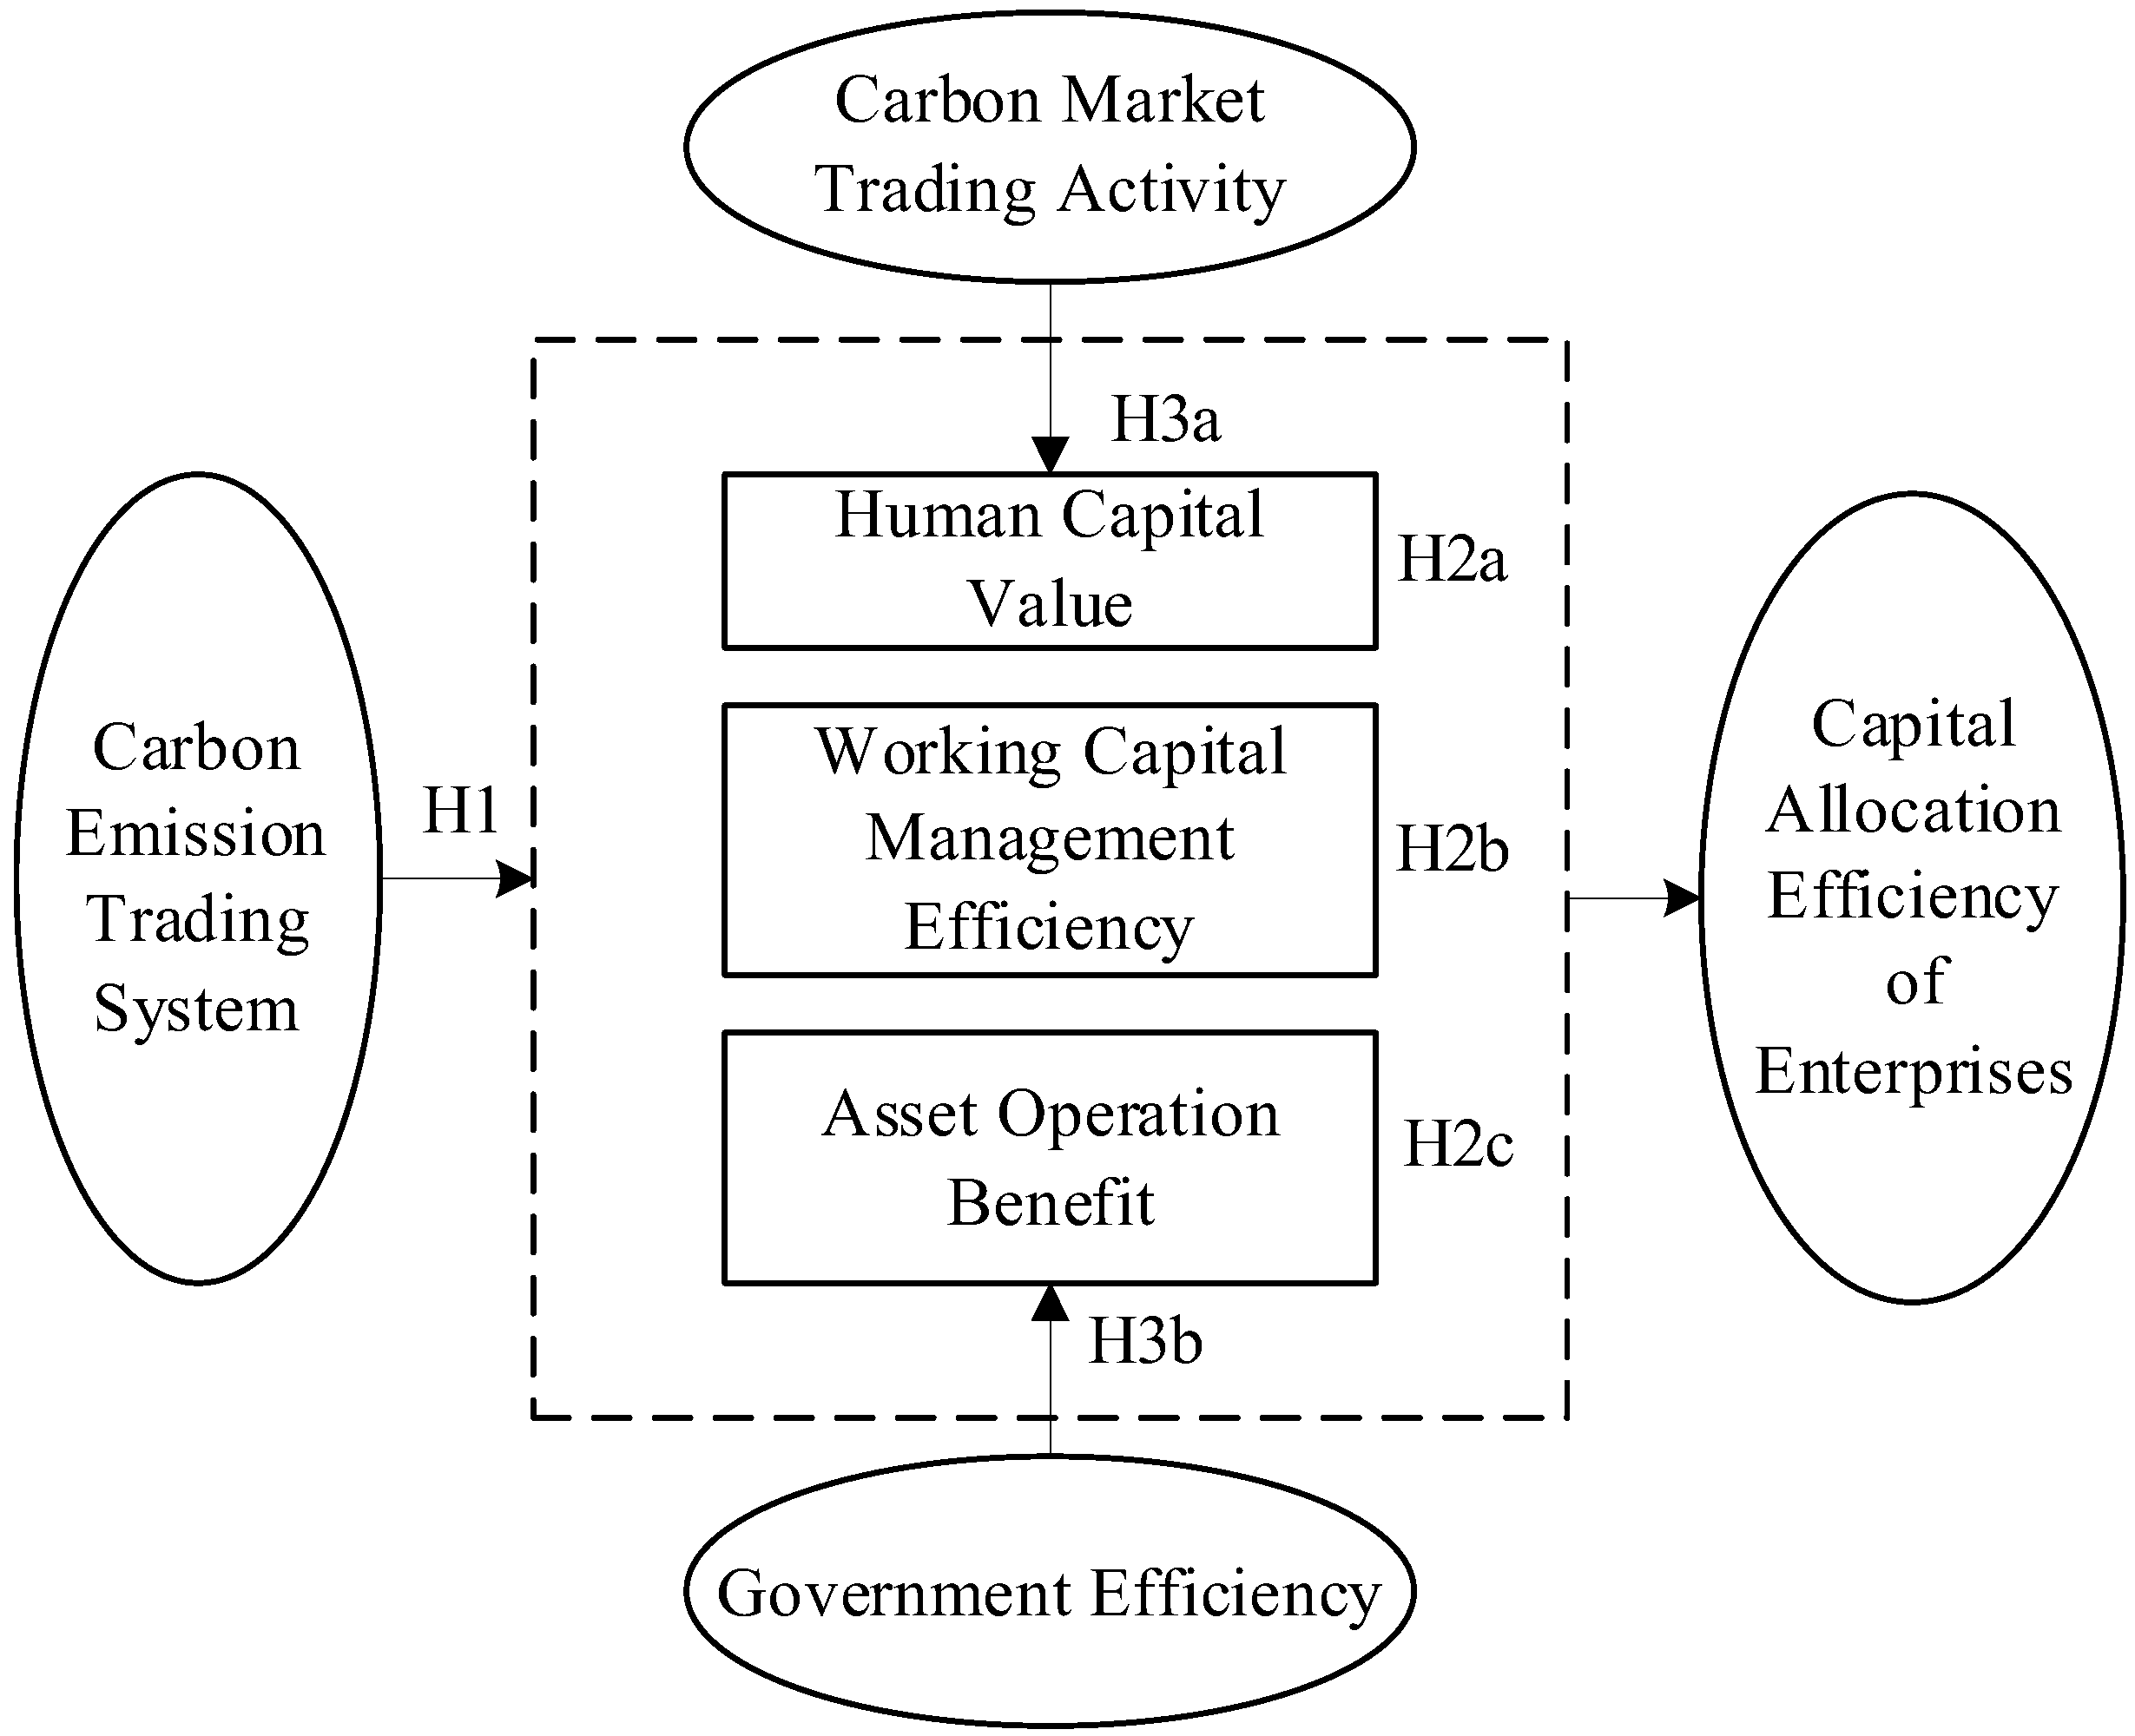
3.1. Impact of Carbon Emission Trading System on Capital Allocation Efficiency of Enterprises
3.2. Analysis of Intermediary Mechanism
- (1)
- The human capital value path. The carbon emission trading system forces firms to realize clean technology innovation to reduce carbon emissions. The complexity of technology innovation makes it difficult for low-quality human capital to match it. Therefore, it will increase the demand of enterprises for high-quality human capital, induce human capital premium and improve human capital value [33]. This will encourage enterprises to expand human capital investment, enhance the ability of employees to collect, mine and absorb knowledge, so as to strengthen the internal knowledge spillover effect and improve the level of enterprise innovation [40], which will help enterprises improve product quality, expand market share and cultivate competitive advantages, and ensure that enterprises further improve capital allocation efficiency.
- (2)
- The working capital management efficiency path. When included in the carbon emission rights trading list, it means that enterprises do not sufficiently utilize their energy, which shows their characteristics of large pollution emissions, high resource consumption and low operating efficiency [41]. In order to reduce environmental costs, enterprises seeking to maximize profits will take the initiative to improve the links with insufficient operational efficiency, scientifically formulate production plans, monitor production processes and optimize cost control in the daily production and operation process [42], and ultimately improve the efficiency of working capital management. Meanwhile, inclusion in the carbon emission rights trading list will encourage the external media to pay attention to the enterprise, so as to reduce the degree of information asymmetry inside and outside the enterprise, so as to improve the efficiency of enterprise project investment [35]. This will further optimize the working capital allocation of enterprises and improve capital allocation efficiency.
- (3)
- The asset operation benefit path. Under the pressure of carbon emission trading, enterprises will strengthen the technological transformation of existing assets to eliminate production units with high energy consumption, high pollution and massive discharge, and meet the environmental protection objectives of the environmental supervision department. Technological transformation makes the enterprise bear a certain production cost, which will reduce the level of equipment stock in the production line. However, the production efficiency of old equipment is low and it is sensitive to cost changes, so the stock of old equipment will decrease more [43]. This will increase the stock ratio of new equipment in the enterprise, improve the asset operation efficiency on the whole, and then make the enterprise assets reach the optimal output state, so as to improve the efficiency of enterprise capital allocation.
3.3. Analysis of Moderation Mechanism
- (1)
- Moderating effect of carbon market trading activity. The trading activity of the carbon market promotes market mechanism to play a positive role. Trading activity is the premise of the price discovery function and market effectiveness of the trading market, and provides an important basis for ensuring the pricing efficiency of the trading market [44]. Whether the trading entity actively participates in carbon trading depends largely on whether the market pricing is reasonable. The higher the trading activity, the more the carbon trading price can contain the real information of the current carbon emission rights trading, which reduces the transaction cost and return uncertainty of the emission control entity [8], so that the emission control enterprises have more power to take part in carbon trading. First, this strengthens the supervision effect of carbon trading on the production and operation of emission control enterprises, and promotes them to produce with equipment with lower energy consumption, less pollution and higher output efficiency, thus ameliorating the efficiency of enterprise asset and capital allocation; secondly, in the active carbon market, emission control enterprises can obtain relatively high income from carbon trading, which improves the output efficiency of financial assets of enterprises and strengthens the promotion of the efficiency of financial capital allocation; finally, the active participation of emission control subjects will enhance the improvement of carbon trading on regional environmental quality, which further enhances the attraction of the province to high-quality labor, and enables enterprises to improve their human capital allocation efficiency at a lower cost.
- (2)
- Moderating effect of government efficiency. Government with high efficiency provides the foundation for the standardized and orderly operation of the carbon market. During the actual operation of carbon trading, the government plays a role by strengthening carbon quota management, accelerating the speed of administrative examination and approval, and strengthening market supervision, so as to stabilize the carbon price and guarantee the quota performance of emission control enterprises, and make the carbon market operate smoothly to play the role of promoting emission reduction of emission control entities. The above effect relies on the efficiency of the government. The higher the efficiency of government, the more capable the government will be to stabilize the price of carbon emission rights within a reasonable range [45], thus greatly reducing the transaction cost of emission control enterprises, making them more willing to participate in market transactions, ultimately enhancing the role of carbon trading in forcing enterprises to improve technology, and further improving the efficiency of enterprise capital allocation. Meanwhile, the administration can improve relevant laws and regulations to strengthen the supervision and control of emission control enterprises, and formulate relevant laws and regulations to form a collaborative mechanism with carbon trading to enhance the implementation effect of carbon emission trading. In this regard, a government with higher administrative efficiency will formulate more targeted carbon emission rights trading regulations to enable enterprises to enhance the disclosure of carbon emission-related information [16], which is conducive to alleviating the information asymmetry between the market and enterprises, improving the efficiency of enterprise capital use and significantly improving capital allocation efficiency.
4. Research Design
4.1. Sample Selection and Data Source
4.2. Model Setting and Variable Descriptions
5. Empirical Results
5.1. Descriptive Statistics and Multicollinearity Test
5.2. Influence of Carbon Emission Trading System on Capital Allocation Efficiency of Enterprises
5.3. Robustness Test
5.3.1. Parallel Trend Test
5.3.2. Placebo Test
5.3.3. PSM-DID Test
5.3.4. Replace the Measurement Method of Efficiency of Enterprise Capital Allocation
5.4. Mechanism Analysis
5.4.1. Analysis of Intermediary Mechanism
5.4.2. Analysis of Moderating Mechanism
5.5. Heterogeneity Test
6. Research Conclusions and Policy Recommendations
Author Contributions
Funding
Institutional Review Board Statement
Informed Consent Statement
Data Availability Statement
Conflicts of Interest
References
- Grossman, G.M.; Krueger, A.B. Economic growth and the environment. Q. J. Econ. 1995, 110, 353–377. [Google Scholar] [CrossRef] [Green Version]
- Sadik-Zada, E.R.; Ferrari, M. Environmental policy stringency, technical progress and pollution haven hypothesis. Sustainability 2020, 12, 3880. [Google Scholar] [CrossRef]
- Panayotou, T. Demystifying the environmental Kuznets curve: Turning a black box into a policy tool. Environ. Dev. Econ. 1997, 2, 465–484. [Google Scholar] [CrossRef] [Green Version]
- Huang, X.; Zhang, X.; Liu, Y. Does China’s Carbon Emissions Trading Policy Fulfill the Environmental Dividend? Econ. Rev. 2018, 39, 86–99. [Google Scholar]
- Qin, J.; Yang, Y.; Wang, L.; Yang, X. Entrepreneurs’ Control Rights, Venture Capital and Capital Allocation Efficiency: Evidence from China’s Private Listed Companies. Econ. Res. J. 2021, 56, 132–149. [Google Scholar]
- Bai, X.; Song, P.; Wang, B. Energy Saving and Emission Reduction Path of Carbon Emission Trading System Efficiency Improvement or Structural Transformation?—Quasi Natural Experiments Based on Provincial Data in China. J. Bus. Econ. 2021, 41, 70–85. [Google Scholar]
- Hu, Y.-F.; Ding, Y. Can carbon emission permit trade mechanism bring both business benefits and green efficiency? China Popul. Resour. Environ. 2020, 30, 56–64. [Google Scholar]
- Fu, J.; Zhang, Y.; Xie, Z. Does the Mechanism Design Influence Carbon Market’s Liquidity?—A Research Basedf on China’s Pilot Regions. Financ. Trade Econ. 2017, 38, 129–143. [Google Scholar]
- Wu, Y.; Qi, J.; Xian, Q.; Chen, J. The Carbon Emission Reduction Effect of China’s Carbon Market—From the Perspective of the Coordination between Market Mechanism and Administrative Intervention. China Ind. Econ. 2021, 38, 114–132. [Google Scholar]
- Dales, J.H. Pollution, Property and Prices: An Essay in Policy-Making and Economics; University of Toronto Press: Toronto, ON, Canada, 1968. [Google Scholar]
- Abrell, J.; Ndoye Faye, A.; Zachmann, G. Assessing the impact of the EU ETS using firm level data. Bruegel Working Paper. 2011. [Google Scholar]
- Chan, H.S.; Li, S.; Zhang, F. Firm competitiveness and the European Union emissions trading scheme. Energy Policy 2013, 63, 1056–1064. [Google Scholar] [CrossRef] [Green Version]
- Zhou, C.; Cai, H.; Liu, M. Research on Enterprise Financial Effects of the Carbon Emission Trading—Based on the “Porter Hypothesis” &PSM-DID Test. Collect. Essays Financ. Econ. 2020, 36, 68–77. [Google Scholar]
- Liu, Y.; Zhang, X. Carbon Emission Trading System and Enterprise R&D Innovation—Empirical Research Based on Triple Difference Model. Econ. Sci. 2017, 39, 102–114. [Google Scholar]
- Ren, S.; Li, B. Research on the Influence of Emissions Right Trading on Corporate Labor Demands and Its Path: A Quasi-Natural Experiment Test Based on China Carbon Emission Right Trading Experiment. West Forum 2019, 29, 101–113. [Google Scholar]
- Chen, X. China’s carbon emission trading market: Effectiveness, reality and strategy. Southeast Acad. Res. 2022, 35, 167–177. [Google Scholar]
- Lo, A.Y. Carbon trading in a socialist market economy: Can China make a difference? Ecol. Econ. 2013, 25, 72–74. [Google Scholar] [CrossRef]
- Lyu, X.; Shi, A.; Wang, X. Research on the impact of carbon emission trading system on low-carbon technology innovation. Carbon Manag. 2020, 11, 183–193. [Google Scholar] [CrossRef]
- Biddle, G.C.; Hilary, G.; Verdi, R.S. How does financial reporting quality relate to investment efficiency? J. Account. Econ. 2009, 48, 112–131. [Google Scholar] [CrossRef]
- Bhandari, A.; Javakhadze, D. Corporate social responsibility and capital allocation efficiency. J. Corp. Financ. 2017, 43, 354–377. [Google Scholar] [CrossRef]
- Zeng, J.; Wu, Z.; Chen, G. IFRS, International Comparability of Accounting Information and Efficiency of Capital Allocation of Listed Companies. Account. Res. 2018, 19–25. [Google Scholar]
- Qin, J.; Shao, X. Cross-listings, Government Intervention, and Efficiency of Capital Allocation. Econ. Res. J. 2015, 50, 117–130. [Google Scholar]
- Wu, L.; Zhang, Y.; Zhang, T. Executive Tenure, R&D Expenditures and Enterprise Investment Efficiency: Empirical Evidence from China A-share Capital Market. J. Nanjing Audit. Univ. 2015, 12, 56–68+94. [Google Scholar]
- Belo, F.; Lin, X.; Bazdresch, S. Labor Hiring, Investment, and Stock Return Predictability in the Cross Section. J. Political Econ. 2014, 122, 129–177. [Google Scholar] [CrossRef] [Green Version]
- Ma, Z.; Li, Y.; Zeng, W.; Wang, Y. Is industrial policy enhancing capital allocation efficiency or disrupting market fairness? Sci. Res. Manag. 2016, 37, 79–92. [Google Scholar]
- Li, Y.; Ge, J.; Li, P. Does the Mixed Ownership Reform of State-Owned Enterprises Help to Alleviate Human Capital Allocation Distortion? J. Nanjing Audit. Univ. 2020, 17, 101–110. [Google Scholar]
- He, Q.; Shang, W. Study on the Impact of Product Market Competitionon the Investment of Enterprise Fixed Assets. J. Shanxi Univ. Financ. Econ. 2014, 36, 50–60. [Google Scholar]
- Marx, K. Capital. Social Theory Re-Wired; Routledge: London, UK, 2016; pp. 145–151. [Google Scholar]
- Fisher, I.; Biaoru, C. The Theory of Interest; Routledge: London, UK, 1930; pp. 134–156. [Google Scholar]
- Liu, C.; Sun, Z.; Zhang, J. Research on the effect of carbon emission reduction policy in China’s carbon emissions trading pilot. China Popul. Resour. Environ. 2019, 29, 49–58. [Google Scholar]
- Zhou, J.; Liang, W. Foreign Direct Investment and Haze Pollution Governance in China—Analysis from the Perspective of Factor Market Distortion. J. Guizhou Coll. Financ. Econ. 2020, 38, 88–99. [Google Scholar]
- Zhou, J.; Liu, S. The Mechanism and effect of Environmental Regulation on Smog Pollution—A Survey Based on the Perspective of Skill Premium. RD Manag. 2021, 33, 79–93. [Google Scholar]
- Yu, D.; Sun, T. Environmental Regulation, Skill Premium and International Competitiveness of Manufacturing Industry. China Ind. Econ. 2017, 35, 35–53. [Google Scholar]
- Wen, S. Research hotspot and future research prospect of management accounting. Res. Manag. Account. 2020, 3, 25–32+133. [Google Scholar]
- Ji, X. Does carbon emission trading promote the level of corporate environmental responsibility? Mod. Econ. Res. 2021, 40, 49–55. [Google Scholar]
- Zhang, P.; Wang, C.; Zhang, H. Can Promoting Environmental Information Disclosure Improve Investment Efficiency? Chin. J. Environ. Manag. 2020, 12, 110–114. [Google Scholar]
- Perino, G.; Requate, T. Does more Stringent Environmental Regulation Induce or Reduce Technology Adoption? When the Rate of Technology Adoption Is Inverted U-shaped. J. Environ. Econ. Manag. 2012, 64, 456–467. [Google Scholar] [CrossRef]
- Hu, H.; Tang, E. The Impact of Pollution Rights Trading on High Quality Production of Enterprises: Evidence from Carbon Emission Trading. J. Macro-Qual. Res. 2020, 8, 42–57. [Google Scholar]
- Dai, G. Discussion on measures to improve asset operation efficiency. Friends Account. 2011, 29, 54–55. [Google Scholar]
- Lenihan, H.; McGuirk, H.; Murphy, K.R. Driving innovation: Public policy and human capital. Res. Policy 2019, 48, 103791. [Google Scholar] [CrossRef]
- Hu, Y.; Ren, S.; Wang, Y.; Chen, X. Can Carbon Emission Trading Scheme Achieve Energy Conservation and Emission Reduction? Evidence from the Industrial Sector in China. Energy Econ. 2020, 85, 104590. [Google Scholar] [CrossRef]
- Aduda, J.; Ongoro, M. Working capital and earnings management among manufacturing firms: A review of literature. J. Financ. Invest. Anal. 2020, 9, 71–79. [Google Scholar] [CrossRef]
- Wan, P.; Yang, M.; Chen, L. How Do Environmental Technology Standards Affect the Green Transition of China’s Manufacturing Industry—A Perspective from Technological Transformation. China Ind. Econ. 2021, 38, 118–136. [Google Scholar]
- Zhang, X. Carbon Market Liquidity and Regional Low-carbon Economic Transition: An Analysis of Dual Mediation Effect Based on Low-carbon Technology Innovation. J. Nanjing Univ. Financ. Econ. 2021, 39, 88–98. [Google Scholar]
- Jia, Z.; Wen, S.; Zhu, R. Carbon Emission Trading and Total Factor Carbon Efficiency:Evidence from China’s Pilot Carbon Trading. J. Xiamen Univ. A Q. Stud. Arts Soc. Sci. 2022, 72, 21–34. [Google Scholar]
- Kumbhakar, C.A.; Subal, C.; Knox, L.A. Stochastic Frontier Analysis; Fudan University Press: Shanghai, China, 2007. [Google Scholar]
- Zhang, P.; Zhang, H. Research on the path of environmental regulation to improve total factor productivity of Enterprises—A Quasi natural experiment based on carbon emission trading pilot. Jianghuai Trib. 2021, 64, 44–51. [Google Scholar]
- Wen, Z.; Hou, J.; Zhang, L. A Comparison of Moderator and mediator and Their Applications. Acta Psychol. Sin. 2005, 50, 614–620. [Google Scholar]
- Wen, Z.; Zhang, L.; Hou, J.; Liu, H. Testing and Application of the Mediating Effects. Acta Psychol. Sin. 2004, 49, 614–620. [Google Scholar]
- Zhu, L.; Li, M. An Empirical Study on the Relationship between Equity Restriction and Intellectual Capital Value of the Listed Companies in Tibet. J. Tibet. Univ. Soc. Sci. 2020, 35, 167–171. [Google Scholar]
- Wang, Z.; Sun, Y.; Zhang, X.; Du, R.; Cheng, L. The Working Capital Management Survey of Chinese Listed Companies: 2014. Account. Res. 2015, 36, 67–73+97. [Google Scholar]
- Jin, B.; Gong, J. The Influence of Economic Growth and Policy Adjustment on Enterprise Competitiveness—Empirical Analysis on China’s Industrial Panel Data. China Ind. Econ. 2014, 31, 5–17. [Google Scholar]
- Xiong, J.; Ye, Y. Stock liquidity, enterprise investment and capital allocation efficiency—Empirical Evidence from Listed Companies in China. J. Jiangxi Univ. Financ. Econ. 2016, 18, 45–58. [Google Scholar]
- Richardson, S. Over-investment of free cash flow. Rev. Account. Stud. 2006, 11, 159–189. [Google Scholar] [CrossRef]
- Jie, M.; Wang, J.; Liu, D. Environment Regulation, Technological Innovation and Corporate Performance. Nankai Bus. Rev. 2014, 17, 106–113. [Google Scholar]
- Wang, S.; Xu, Y. Environmental Regulation and Haze Pollution Effect—Based on the Perpective of Enterprise Investment Preferences. China Ind. Econ. 2015, 32, 18–30. [Google Scholar]

| Variable Name | Variable Symbol | Definition |
|---|---|---|
| Efficiency of capital allocation | ECAi,t | Construction of stochastic frontier analysis model |
| Virtual variable of carbon emission trading system | Interacti,t | If the enterprise enters the list of carbon emission trading system in that year, it is 1; otherwise, it is 0 |
| Company size | Sizei,t | Natural logarithm of total assets |
| The beginning performance | Roai,t | The ratio of corporates’ annual EBIT to the total assets at the end of the year |
| Cash ratio | CashRatioi,t | Ratio of cash and cash equivalents held by enterprises to current liabilities |
| Tobin’s Q | TobinQi,t | Ratio of market value to total assets |
| Book to market ratio | BMi,t | Ratio of book value to market value |
| Earnings per share | EPSi,t | Ratio of the enterprise’s current year’s EBIT to the number of share capital |
| Sales growth rate | SalesGrowthi,t | Ratio of the difference between the total operating income of the enterprise in the current year and the total operating income of the previous year to the total operating income of the previous year |
| Variables | Observations | Mean Value | Median | Variance | Minimum | Maximum |
|---|---|---|---|---|---|---|
| ECAi,t | 5601 | 0.828 | 0.836 | 0.062 | 0.594 | 0.953 |
| Interacti,t | 5601 | 0.008 | 0.000 | 0.091 | 0.000 | 1.000 |
| Sizei,t | 5601 | 22.390 | 22.150 | 1.466 | 19.850 | 27.070 |
| Roai,t | 5601 | 0.067 | 0.057 | 0.054 | −0.077 | 0.272 |
| CashRatioi,t | 5601 | 1.118 | 0.433 | 1.993 | 0.035 | 12.670 |
| TobinQi,t | 5601 | 2.079 | 1.641 | 1.302 | 0.872 | 8.087 |
| BMi,t | 5601 | 0.551 | 0.519 | 0.262 | 0.099 | 1.174 |
| EPSi,t | 5601 | 0.440 | 0.307 | 0.512 | −0.590 | 2.896 |
| SalesGrowthi,t | 5601 | 0.195 | 0.118 | 0.412 | −0.419 | 2.796 |
| Variables | (1) | (2) | (3) | (4) |
|---|---|---|---|---|
| ECAi,t | ECAi,t | ECAi,t | ECAi,t | |
| Interacti,t | 0.0097 * | 0.0121 ** | 0.0082 * | 0.0098 * |
| (1.88) | (2.19) | (1.68) | (1.71) | |
| Sizei,t | −0.0023 | −0.0034 * | −0.0025 | −0.0081 *** |
| (−1.56) | (−1.75) | (−1.49) | (−2.93) | |
| Roai,t | 0.3831 *** | 0.3744 *** | 0.3784 *** | 0.3721 *** |
| (12.30) | (11.37) | (11.91) | (11.07) | |
| CashRatioi,t | 0.0042 *** | 0.0042 *** | 0.0044 *** | 0.0045 *** |
| (5.65) | (5.40) | (5.92) | (5.82) | |
| TobinQi,t | −0.0025 ** | −0.0026 ** | −0.0027 ** | −0.0032 *** |
| (−2.32) | (−2.33) | (−2.46) | (−2.86) | |
| BMi,t | −0.0023 | −0.0047 | −0.0247 *** | −0.0314 *** |
| (−0.38) | (−0.76) | (−3.20) | (−3.80) | |
| EPSi,t | 0.0080 ** | 0.0095 ** | 0.0067 * | 0.0079 ** |
| (2.18) | (2.39) | (1.83) | (1.97) | |
| SalesGrowthi,t | 0.0017 | 0.0015 | 0.0031 | 0.0037 * |
| (0.82) | (0.74) | (1.59) | (1.91) | |
| Constant | 0.8513 *** | 0.8788 *** | 0.8683 *** | 0.9947 *** |
| (27.26) | (20.42) | (25.05) | (16.78) | |
| Firm | NO | YES | NO | YES |
| Year | NO | NO | YES | YES |
| Observations | 5601 | 5601 | 5601 | 5601 |
| R2 | 0.231 | 0.231 | 0.266 | 0.267 |
| Variables | Parallel Trend Test | Placebo Test | PSM + DID | Variables Replacement |
|---|---|---|---|---|
| (1) | (2) | (3) | (4) | |
| 0.0034 | ||||
| (0.53) | ||||
| 0.0085 | ||||
| (1.56) | ||||
| 0.0008 | ||||
| (0.13) | ||||
| Interacti,t | 0.0157 * | 0.0172 | 0.0182 *** | −0.0258 * |
| (1.73) | (1.61) | (3.02) | (−1.91) | |
| Controlsi,t | YES | YES | YES | YES |
| Firm | YES | YES | YES | YES |
| Year | YES | YES | YES | YES |
| Constant | 0.9947 *** | 0.9950 *** | 1.1042 *** | −0.2054 *** |
| (16.77) | (16.79) | (14.63) | (−2.93) | |
| Observations | 5601 | 5601 | 3489 | 5164 |
| R2 | 0.267 | 0.267 | 0.317 | 0.114 |
| Variables | Sample | Difference Test of Means | Drop (%) | t Test | ||
|---|---|---|---|---|---|---|
| Treated | Untreated | t | p > t | |||
| Sizei,t | Matched | 22.487 | 22.409 | −54.4 | 0.37 | 0.715 |
| Unmatched | 22.487 | 22.366 | 0.53 | 0.597 | ||
| Roai,t | Matched | 0.068 | 0.065 | −212.2 | 0.37 | 0.713 |
| Unmatched | 0.068 | 0.059 | 0.82 | 0.413 | ||
| CashRatioi,t | Matched | 0.624 | 1.067 | 93.5 | −1.6 | 0.11 |
| Unmatched | 0.624 | 0.5957 | 0.21 | 0.83 | ||
| TobinQi,t | Matched | 2.074 | 2.090 | 19.5 | −0.08 | 0.933 |
| Unmatched | 2.074 | 2.061 | 0.07 | 0.948 | ||
| BMi,t | Matched | 0.521 | 0.553 | 66.3 | −0.81 | 0.416 |
| Unmatched | 0.521 | 0.532 | −0.23 | 0.822 | ||
| EPSi,t | Matched | 0.280 | 0.438 | 90.8 | −2.09 | 0.037 |
| Unmatched | 0.280 | 0.266 | 0.23 | 0.822 | ||
| SalesGrowthi,t | Matched | 0.148 | 0.196 | 93.4 | −0.78 | 0.433 |
| Unmatched | 0.148 | 0.152 | −0.06 | 0.955 | ||
| Variables | Human Capital Value | Working Capital Management Efficiency | Operating Efficiency of Assets | |||
|---|---|---|---|---|---|---|
| VAICi,t | ECAi,t | WCMEi,t | ECAi,t | ACRi,t | ECAi,t | |
| (1) | (2) | (3) | (4) | (5) | (6) | |
| Interacti,t | −0.1375 (−0.85) | 0.0107 ** (2.14) | −19.9268 ** (−2.02) | 0.0091 * (1.76) | 0.0052 ** (2.45) | 0.0066 * (1.88) |
| VAICi,t | 0.0070 *** (5.10) | |||||
| WCMEi,t | −0.0000 *** (−2.66) | |||||
| ACRi,t | 0.6176 *** (5.97) | |||||
| Controlsi,t | YES | YES | YES | YES | YES | YES |
| Constant | −2.6166 * (−1.73) | 1.0106 *** (18.15) | −94.8626 (−0.54) | 0.9846 *** (16.13) | 0.1579 *** (9.08) | 0.8972 *** (14.53) |
| Firm | YES | YES | YES | YES | YES | YES |
| Year | YES | YES | YES | YES | YES | YES |
| Observations | 5591 | 5591 | 5557 | 5557 | 5601 | 5601 |
| R2 | 0.296 | 0.290 | 0.278 | 0.102 | 0.929 | 0.292 |
| Sobel Test | α2 is insignificant, |Z| = 0.7514 <0.97, there is no intermediary effect | γ2 and γ6 is significant, there is no need for Sobel Test | θ2 and θ6 is significant, there is no need for Sobel Test | |||
| Variables | (1) | (2) |
|---|---|---|
| ECAi,t | ECAi,t | |
| Interacti,t | −0.0093 | −0.0209 |
| (−1.11) | (−1.10) | |
| Activityi,t | 0.0008 | |
| (1.11) | ||
| Activityi,t × Interacti,t | 0.0023 *** | |
| (2.85) | ||
| GEi,t | 0.0022 | |
| (0.10) | ||
| GEi,t × Interacti,t | 0.0607 * | |
| (1.78) | ||
| Sizei,t | −0.0079 *** | −0.0081 *** |
| (−2.79) | (−2.94) | |
| Roai,t | 0.3682 *** | 0.3727 *** |
| (10.62) | (11.05) | |
| CashRatioi,t | 0.0045 *** | 0.0045 *** |
| (5.69) | (5.81) | |
| TobinQi,t | −0.0035 *** | −0.0032 *** |
| (−2.93) | (−2.86) | |
| BMi,t | −0.0321 *** | −0.0314 *** |
| (−3.74) | (−3.80) | |
| EPSi,t | 0.0084 ** | 0.0079 * |
| (1.97) | (1.96) | |
| SalesGrowthi,t | 0.0043 ** | 0.0037 * |
| (2.10) | (1.91) | |
| Constant | 0.9828 *** | 0.9935 *** |
| (16.39) | (16.28) | |
| Firm | YES | YES |
| Year | YES | YES |
| Observations | 5601 | 5601 |
| R2 | 0.262 | 0.267 |
| Variables | Higher Level of Pollution (1) | Lower Level of Pollution (2) | Higher Level of Environmental Regulation (3) | Lower Level of Environmental Regulation (4) |
|---|---|---|---|---|
| Interacti,t | 0.0081 | 0.0091 ** | 0.0140 *** | 0.0113 |
| (1.29) | (2.47) | (4.28) | (1.59) | |
| Sizei,t | −0.0116 * | −0.0063 ** | −0.0166 *** | −0.0055 |
| (−1.93) | (−2.03) | (−4.21) | (−1.56) | |
| Roai,t | 0.2872 *** | 0.4167 *** | 0.3629 *** | 0.3348 *** |
| (5.31) | (10.16) | (6.58) | (7.68) | |
| CashRatioi,t | 0.0057 *** | 0.0041 *** | 0.0044 *** | 0.0038 *** |
| (3.54) | (4.80) | (3.20) | (3.95) | |
| TobinQi,t | −0.0017 | −0.0036 *** | −0.0014 | −0.0011 |
| (−0.88) | (−2.71) | (−1.23) | (−0.48) | |
| BMi,t | 0.0005 | −0.0457 *** | −0.0137 | −0.0364 *** |
| (0.03) | (−4.90) | (−1.36) | (−3.03) | |
| EPSi,t | 0.0154 *** | 0.0040 | 0.0085 | 0.0102 ** |
| (2.60) | (0.82) | (1.51) | (2.15) | |
| SalesGrowthi,t | 0.0046 | 0.0033 | 0.0037 | 0.0047 |
| (1.44) | (1.40) | (1.53) | (1.28) | |
| Constant | 1.0498 *** | 0.9669 *** | 1.1506 *** | 0.9415 *** |
| (7.69) | (14.75) | (13.13) | (12.46) | |
| Firm | YES | YES | YES | YES |
| Year | YES | YES | YES | YES |
| Observations | 1689 | 3912 | 2472 | 3129 |
| R2 | 0.284 | 0.272 | 0.254 | 0.245 |
Publisher’s Note: MDPI stays neutral with regard to jurisdictional claims in published maps and institutional affiliations. |
© 2022 by the authors. Licensee MDPI, Basel, Switzerland. This article is an open access article distributed under the terms and conditions of the Creative Commons Attribution (CC BY) license (https://creativecommons.org/licenses/by/4.0/).
Share and Cite
Wang, Z.; Guo, J.; Luo, G. The Impact of Chinese Carbon Emissions Trading System on Efficiency of Enterprise Capital Allocation: Effect Identification and Mechanism Test. Sustainability 2022, 14, 13151. https://doi.org/10.3390/su142013151
Wang Z, Guo J, Luo G. The Impact of Chinese Carbon Emissions Trading System on Efficiency of Enterprise Capital Allocation: Effect Identification and Mechanism Test. Sustainability. 2022; 14(20):13151. https://doi.org/10.3390/su142013151
Chicago/Turabian StyleWang, Zijin, Jitao Guo, and Gengyan Luo. 2022. "The Impact of Chinese Carbon Emissions Trading System on Efficiency of Enterprise Capital Allocation: Effect Identification and Mechanism Test" Sustainability 14, no. 20: 13151. https://doi.org/10.3390/su142013151