Abstract
This research sets its sights on producing a precise and meticulous analysis in order to identify critical success factors (CSFs) of behavioral intention to adopt performance-based budgeting (BIA) during the COVID-19 pandemic. The statistical data employed in this study were drawn from repeated cross-sectional samples of accountants within public sector organizations in relation to BIA, spanning 3 years. In order to bring forth the hypothesized interlinks, the analytical techniques used comprised structural equation modeling and mean comparisons. The analyses of the results substantiated the positive interconnections among CSFs in terms of significance and effect size. On the basis of the degree of stability of the obtained findings, the most stable CSFs of BIA were ascertained. Beyond widening the frontier of knowledge on the benefits of performance-based budgeting (PBB) in public sector organizations and the CSFs of BIA, the obtained findings can guide leaders in public sector organizations to sense and seize how they can become efficient and effective in the journey towards PBB implementation and how they can formulate intense strategies for successfully managing the transformation process. The advantages of a more fine-grained understanding in this research can allow policymakers to promulgate laws and rules for the implementation of PBB.
1. Introduction
Crises, notwithstanding their sources, can destabilize organizations [1] and confront leaders with challenges [2], thus compelling them to adopt proactive measures in response to tumultuous changes in the environment [3,4,5]. The COVID-19 pandemic has been shown to be one of the largest crises [6], and it exponentially proliferated across all regions of the world within a matter of months [7]. The precipitous outbreak of this ensuing world pandemic engendered unprecedented shockwaves in the global economy, which had devastating influences on the ways in which organizations could operate and thrive [8,9]. This also resulted in substantial transformations that featured vulnerability, uncertainty, complexity, and ambiguity [10]. Therefore, this has drawn urgent attention to the rapid response to extreme environmental alternations that could pose a threat to existence [11]. In response to these pivotal challenges, organizational resilience capacity has recently drawn growing concern (e.g., [12,13]), as it enables organizations to tackle unexpected events fruitfully, bounce back from crises that could probably endanger their survival [14], and even nourish future achievements towards sustainable development.
Sustainable development has been well-acknowledged as a catchphrase for international marketing organizations, a slogan for environmental activists, and, recently, a predominant theme of academic research [15]. The impacts of the COVID-19 pandemic on governments and all business operations across the globe have grievously challenged the accomplishment of the Sustainable Development Goals and have increased the complications in the interactions of the Sustainable Development Goals [16]. As such, the global crises induced by the COVID-19 pandemic could compromise the commitments of the world to the 2030 Agenda for Sustainable Development [17]. Several academic studies have focused on sustainability during the COVID-19 pandemic (i.e., [18,19,20]). Under these circumstances, budgeting would play a paramount role [21]. Admittedly, from the perspectives of the inclusive measures for the promotion of sustainability and resilience in the 2030 Agenda [22], budgets have been well-acknowledged as some of the most vigorous instruments made available to public sector organizations in order to push forward this contribution [23]. Of these, PBB has drawn great attention in public management research [24].
PBB might have first been recorded in the late 1940s [25], or it might date back to the early 1950s, where performance measures were calculated to accent efficiency [26]. Even though PBB has been determined to comprise a broad range of approaches by various academics, the initial idea was to produce an appropriate interconnection between budgets and program consequences [27]. It has been confirmed that PBB practices center on ascertaining program goals, formulating targeted objectives, and taking advantage of performance indicators to link a budget with outputs and outcomes [28]. PBB is considered an indispensable technique for establishing the association between the planning process and the control process in order to achieve organizational goals [29] in both the period of the pandemic and that of the “New Normal”.
There have long been attempts to investigate the determinants of intentions for PBB implementation. More particularly, the outcomes obtained by [30] substantiated the three ingredients: organizational ability, authority, and acceptance. The investigation of [31] illustrated that the relative advantages, organizational support, and readiness would lead to a marked influence on the intention for PBB adoption. However, [32] claimed that although PBB implementation was influenced by transformational leadership styles and the competence of human resources, the transformational leadership style and the competence of human resources demonstrated insignificant effects on the implementation of PBB according to organizational culture. While the environmental, administrative, and operational controls were reported to be requests for the deployment of PBB, non-compliance in organizations acts as an obstacle to deployment [33]. The abundant drivers of PBB implementation were chronicled in the investigation of [34] and were inherited by the study of [26], which ascertained the determinants driving PBB implementation in MOHME in Iran. Prominently, PBB implementation in non-American countries has simply been adopted as a tendency required by most governments worldwide [35]. As such, these adopting nations might still not be genuinely well-prepared for PBB implementation [36,37].
Building on the abovementioned analyses and the recognition that the success in confronting a crisis could be ameliorated through the achievement of the CSFs, this research concentrated on offering unique insights into the CSFs of BIA in the context of an emerging non-American country. In doing so, the first goal of the manuscript is to offer explicit insights into CSFs and to explain all of the aspects of CSFs and how they can demonstrate significant impacts on BIA. Furthermore, another goal of the current paper is to depict the significant impact of BIA on organizational resilience and organizational sustainability. Starting from these considerations, the intriguing research questions of the current research are formulated as follows:
RQ1.
What are the CSFs of BIA? How much do they impact BIA?
RQ2.
Does BIA impact organizational sustainability? How much does it impact organizational sustainability?
RQ3.
Does BIA impact organizational resilience? How much does it impact organizational resilience?
From the aspect of theorical contributions, first, this research broadened the frontiers of the PBB literature by empirically investigating the CSFs of PBB implementation and, more concretely, shed light on valuable insights into the under-explored issues in public sector organizations. The repeated cross-sectional design was leveraged in the current research and bridged the inherent gaps of numerous precedent works that are heavily based on a cross-sectional design (i.e., [24,38,39,40,41,42]). This form of data collection is the most commonly applied technique carried out during one-time data collection; consequently, it has broadly been disparaged by numerous academicians studying customer behavior [43]. This is because it is uncapable of depicting the complicated and dynamic facets of a market [43,44], as one-time data procurement only illustrates a snapshot of how consumers feel at a specific point in time. Remarkably, as the social and organizational impacts of the pandemic have been unclear, long-lasting, and complicated to address [17], its impacts should be supervised as well as managed rapidly and properly at a suitable time to assure fruitful progress towards sustainable development [45]. On the other hand, users might have disparate standpoints during different stages of PBB implementation. Against this backdrop, repeated cross-sectional research has been extremely helpful for management studies, as it enables database procurement over longer periods of time than classic longitudinal designs do and warrant valid causal inferences [46]. Repeated cross-sectional data refer to data in which the same information is captured from a number of participants each time. Accordingly, repeated cross-sectional data do not track participants but represent aggregate shifts in population parameters over time [47]. The feedback in a repeated cross-sectional design reflects transformation in the measurement items and shifts in the population over time [48]. In this regard, statistical data were drawn from repeated cross-sectional samples of accountants in public sector organizations in terms of BIA spanning 3 years, from 2020 to 2022. More importantly, the review of the burgeoning body of literature highlighted that no prior works connected the three primary dimensions of motivation, capability, and opportunity when investigating the CSFs of BIA in depth. Drawing upon capability, opportunity, motivation, and behavior systems; unified theory acceptance; and the use of technology theory and goal setting theory, the current research took a stab at determining the CSFs of BIA through empirically utilizing the structural equation modeling approach and mean comparison method to identify the differences in the levels of the constructs as well as to rank the relative significance of these constructs. In doing so, this manuscript contributes knowledge on the potential impacts of the antecedent determinants of BIA as well as on the outcome determinants of BIA during the COVID-19 pandemic and the new normal.
Regarding practical contributions, these findings provide leaders with valuable standpoints for taking advantage of budgeting as a coping strategy when attempting to accomplish organizational sustainability and organizational resilience. Strikingly, the present research represents a first step towards a more systematic investigation on how public sector organizations can succeed in PBB implementation through formulating and developing an adoption model that can be wielded to identify the CSFs and their interrelations in forecasting BIA. Moreover, the observations of current studies could act as guideposts to reinforce decision-making processes for those who have adopted or planned to apply them, as PBB is already a potentially helpful technique to orient how future programs evolve in terms of ameliorating and enhancing organizational performance. The observations presented here offer several valuable insights for advancing the interventions fostering BIA through a course of action that supports movement towards PBB awareness and PBB deployment. As public sector organizations begin to place more concerns on organizational sustainability, organizational resilience, and public value, they could leverage the outcomes of this study to establish and develop an effective plan for fruitful PBB implementation. Exceedingly, these findings are also beneficial for policymakers and to those who influence the government to deepen insight into the role of proper budgeting strategies to bridge the gaps pertaining to the institutional policies employed in public sector organizations.
In order to achieve the research objectives underlined above, the current manuscript is divided into the following parts: Section 2 briefly provides the theoretical underpinnings and develops this study’s hypotheses. Building on these points of views, the research methods and materials are delineated in Section 3, followed by Section 4, in which the research analyses are elaborated and interpreted, whilst Section 5 summarizes the academic and managerial implications as well as concludes the paper with drawbacks and directions further study.
2. Theoretical Apprehension and Corroboration of Research Hypotheses
This section is split into two sub-sections. The first sub-section focuses on underpinning the theoretical foundation of the topic, which is based on contingency theory, goal-setting theory, unified theory acceptance, and the use of technology and capability, opportunity, motivation, and behavior models, whereas the second sub-section comprises hypothesis corroboration and the research model. This division of information helps us to extract the required CSFs and points of view to determine the impact of the latter on the former. Meanwhile, the second sub-section emphasizes developing the hypotheses of the proposed model.
2.1. Theoretical Lenses Employed
2.1.1. Contingency Theory
Contingency theory was discovered by researchers from Ohio State University in 1950 [49,50] and is the primary theoretical lens leveraged to view organizations [51]. It offers fundamental insights into the situation of the organization and has numerous implications on organizational performance [52]. The principal affirmation of contingency theory is that the environment in which an organization has been operating determines the best way for it to exist and develop [53]. Building on the proposal of [54], there is no single form of organizational structure that is correspondingly appropriate to all organizations; rather, organizational effectiveness heavily rests on fitness between the form of advanced technologies, environmental volatility, the size of the organization, the idiosyncrasies of the organizational structure, and its information system. Hence, contingency theory studies have speculated that organizational outcomes are the result of a fitness between two or more determinants [55]. In addition, [56] advocated for the non-discriminative components of this type of theory to private-sector organizations and public sector organizations. Remarkably, how a budgetary system was set up and made use of was deemed as a complicated outcome of several contingent variables [57]. Numerous academicians have sustained contingency theory as a theoretical backdrop and have illustrated the existence of interconnections between the structural and contextual features of the organization and its utilization of budgetary participation [58]. In particular, [59] recommended that economic, technological, and sociological deliberations induce a substantial influence on the functioning of budgeting systems. According to [60], any certain responsibilities that an organization has to confront, for example, budget management during the period of pandemic, involves the interaction of tasks, human resources, the environment, organizational structure, and technology. On the other hand, it has been supposed that the volume of information that leaders claim to need for decision making largely relies on the external environment [61]. As such, when environmental uncertainty is enhanced, they seek more valuable information for planning [51]. In this vein, when the external environment is more uncertain, the organization responds by gaining distinction, which, in turn, demands the growing utilization of integrated mechanisms, namely budgetary participation to coordinate operations [62].
2.1.2. Goal-Setting Theory
Goal-setting theory is largely based on the suggestion of [63] that actions are profoundly impacted by conscious goals and was advanced by Locke and Latham after 35 years of empirical exploration [64]. As advocated by [65], the goals that are unmistakably ascertained and realized by an individual or a group of individuals lead to larger degrees of achievement when escorted by common approval. The presence of explicit goals and targets is recommended to lessen bewilderment, vagueness, and a dearth of orientation amongst subordinates [66]. Budgeting has been deemed as a type of goal set by entities and is requested for multitudinous reasons, such as the planning and allocation of organizational operations, distributing resources, fostering a labor force, and illustrating consonance with social norms [67]. In doing so, the paramount ingredient in state-of-the-art budgeting has been the interlink between organizational goals, organizational productivity, and the commitment of the labor force [68]. This conforms to the postulation of goal-setting theory that posits that complicated goals with marked targets, will bring about sharpened performance [69]. As PBB outcomes unambiguously depict the target outputs and the outcomes of planned operations and budgets, performance terms, and assessment schedules [41], PBB deployment was deemed to facilitate management to achieve the performance goals that have been determined [66].
2.1.3. Unified Theory Acceptance and Use of Technology
Unified theory acceptance and the use of technology is a theory concentrated on the acceptance of cutting-edge technologies that was first introduced by [70]. On the viewpoint of [71], this theory rests on the integration of eight precedent theories: the Theory of Reasoned Action, the Theory of Planned Behavior (TPB), the Technology Acceptance Model (TAM), the Motivational Model, Combined TAM-TPB (CTAM-TPB), the Model of Personal Computer Utilization, Innovation Diffusion Theory, and Social Cognitive Theory. The delineated analysis of these eight paradigms highlighted that performance expectancy, effort expectancy, social influence, and facilitating condition demonstrate considerable impacts on user intentions to adopt technology [70,72]. This type of framework was investigated in a staged longitudinal research design and generated vigorous empirical proof of reinforcement in the social influence domain [73]. The prevalence of unified theory acceptance and the use of technology do not negate its drawbacks, which stem from the deficiency of consisting of the all-inclusive determinants that instigate a substantial impact over a user’s acceptance of innovative technology. Succinctly put, unified theory acceptance and the use of technology investigate internal motivations rather than external ones and center on the use results of information technology and not the utilization process itself [74]. Concerning this, ref. [75] chronicled that the capability of unified theory acceptance and the use of technology to assess and forecast the CFSs of the latest system and technology acceptance could be advanced by external variables. Consequently, it was suggested to enlarge and add more determinants to increase the explanatory power of the model.
2.1.4. The Capability, Opportunity, Motivation, and Behavior Model
Given that undertaking variations in unexceptional actions requires alternations in the behavior of abundant agents [76] buttressed by theoretical knowledge of behavior [77,78], the theoretical paradigm of the capability, opportunity, motivation, and behavior model was constituted by [79] and used in the current study to picture BIA. This has been well-acknowledged as a dynamic and systematic framework of behavioral shift and could be valuable to delineate the enablers as well as the hurdles influencing actor behavior and why interference practices have or have not been accomplished [78,79]. Resting on this paradigm, the shift in behavior solely emerged when there was interplay between one or numerous capabilities, opportunities, and motivations to implement the behavior [79]. In this vein, the capability facets reflect the psychological and physical capacities of an individual to partake in the actions concerned [79]. While opportunity was determined to be all of the determinants that happen outside the individual and lead behavior to transpire or be intensified [79], the motivation pondered as the starting point for the capability, opportunity, motivation, and behavior framework refers to the brain processes that orient the behavior [79]. In addition, it is considered as an energizing process to construct individual behavior [80]. In a nutshell, individuals become more determined to undertake behavior at a specific period of time rather than not to perform it.
2.2. Corroboration of Research Hypotheses
The conceptualization of appropriateness is determined as the provision and utilization of what works [81]. Incontestably, appropriateness is the discernment and exclusionary criteria of a service that are inconsonant [82]. In the current study, the perceived appropriateness of PBB was identified as the degree to which an individual perceived the idiosyncrasies of PBB to be suitable in the context of a public sector organization. The COVID-19 pandemic is one of the greatest crises of our time [6] and has demonstrated no signs of stopping [83]. This pandemic has imposed numerous unprecedented challenges on all organizations [84], and public sector organizations are not an exception. As proposed by [85], PPB is the combination of budget planning and policy planning, in which there is enhanced concentration on value-for-money considerations, namely efficacy, effectiveness, and public satisfaction, with spending. Against this backdrop, PBB is capable of ascertaining the interconnections between organizational goals, targets, programs, operations, and key performance indicators in an explicit manner [37,86], enabling the creation of detailed steps to be effortlessly carried out in light of the persistent comparisons between the target and actual performance [87]. With PBB implementation, the available resources can be allocated between a wide range of operations pertaining to their relative significance owing to the deficiency of organizational funds, while superfluous operations can be eliminated [87]. In doing so, PBB is expected to offer information to all stakeholders about the targets that public sector organizations have tried to reach and the expenses involved [88]. Consequently, PBB has been well-recognized as an appropriate and transparent technique for allocating public resources related to budgets, programs, and performance by numerous public sector organizations [88]. On the basis of abovementioned rationales, the current study conjectured the first hypothesis as follows:
Hypothesis 1 (H1).
Perceived appropriateness is more likely to significantly and positively affect BIA.
According to [70], performance expectancy reflects the degree to which an individual admits that a certain system can facilitate them in ameliorating and improving their job performance. Moving to the context of the current study, performance expectancy was conceptualized as the level to which an individual expected that PBB implementation would enable them to achieve better performance in their job. Numerous academic studies have emphasized the benefits of PBB implementation within public sector organizations, such as enriched accountability as well as transparency [89,90,91] by means of shaping up the perspicuous interconnection between resources and outcomes; the creation of organizational efficiency and effectiveness [91] as well as organizational flexibility [92] through gauging and stimulating amelioration; and the accomplishment of flawless performance management [89,90] for evidence-based policy-making pertaining to a performance database. As proposed by [93], PBB has been deemed to make momentous contributions to the evolution of systematic budgeting processes with vigorous links to the anticipated consequences derived from the public policy process as well as organizational missions and expenditures. Doubtlessly, this deployment would facilitate public sector organizations to revamp resource allocation, the simultaneous inclusion of expenditure and performance, intensify the capacities to make comparisons between the departmental expenses, and buttress informed decisions in terms of organizational resources [89,90]. To that end, public funds would become managed in a more efficient and effective way [94]. Furthermore, PBB implementation would enable the entity to ameliorate the motivation of its human resources through boosting responsibilities [92]. Given that the consciousness of an individual on certain issues would engender their mindset and behavior about those issues, the advantages of PBB perceived by public sector organizations would result in BIA. Along a similar line of reasoning, the current study speculated the second hypothesis:
Hypothesis 2 (H2).
Performance expectancy is more likely to significantly and positively affect BIA.
Leaders are well-acknowledged as the paramount individuals within entities that are instrumental in determining modern trends in the environment and the demands within the entities for which innovation management might become desirable [95]. They are also imperative in undergirding initiatives in terms of changing operations, processes, or constitutions [96]. In management literature, leadership is distinguished [97]; this is known as the “leaders’ lure” power, which causes subordinates undertake particular activities freely [97]. The process of impacting a group’s activities toward the completion of a task is designated as leadership [98,99]. It is vital to mention that excellent leadership behavior allows organizations to integrate, exchange, and adopt knowledge in an innovative manner [100]. As proposed by [101], ethics-oriented financial management is promoted as being able to initiate performance budgeting. In this regard, leadership style has been pondered as playing a critical part in advancing the commitment of staff to partake in drafting and carrying out budgets so that the budget is more appropriate [102].
The flourishing body of extant literature on public leadership has cast light on the predominant role of leadership in intensifying public value in public sector organizations by deeming that public leaders committed to public value actions are upholders of democratic values, reinforcing public benefits and shaping residents’ trust in the government [103,104]. Against this backdrop, leadership could buttress the translation of normative anticipations into gratification with PBB [39] through inclining their human resources towards the requirements for transposition, executing a course of action, and formulating internal as well as external reinforcement to relegate outcry on PBB implementation and to govern organizational transformation [105] from traditional budgeting into PBB in a favorable manner.
Competence encompasses the idiosyncrasies of an individual in terms of understanding, skills, aptitude, or behavior as well as mindset, which are definitely different between individuals, particularly pertaining to job performance [106,107]. As proposed by [108], performance budgeting reflects on the integration between budget deliberations with performance information. Meanwhile, developing performance measurements has been supposed to be a complex process, as performance goals are not determined according to a particular indicator [109]. Hence, public officials should possess proficient understanding of administrative procedures to measure policy and program performance accurately [110]. This proficient understanding comprises understanding the performance assessment process determining how government goals are associated with performance indicators [111]. If performance indicators cannot capture actual program operations, the organization members might express dissent towards performance management in light of decreased incentives resulting from underestimated program performance [112]. A deficiency in professional insight might instigate evaluation troubles when performance indicators refer to biased public goals but not the actual achievement of public programs [113].
Performance management comprises a set of practices, techniques, and mechanisms [114] that target shaping up performance goals, planning the indispensable operations to reach these targets, supervising performance outcomes, analyzing gaps between objectives and outcomes, and utilizing performance information as a cornerstone for future planning and funding decisions [115]. Building on the perspective of [116], performance budgeting could not exist without performance management. The implementation of PBB is therefore appropriate for the performance management movement within public sector organizations [40]. As PBB put accent on how to leverage performance indicators and measurement information within the budgetary process to govern public resources more efficiently and effectively [117], there is a requirement for rigorous information and performance facts for ascertaining budget allocation to attain high budget quality. Consequently, the vigorous embeddedness of performance management paradigms and their excellent functioning could result in the accomplishment of PBB implementation.
In the nutshell, the above evidence results in a hypothetical statement that:
Hypothesis 3 (H3).
Internal dynamics are more likely to significantly and positively affect BIA.
The storm caused by COVID-19, which began in 2019, has not discriminated, as it has resulted in a trail of destruction, with more than a million deaths documented so far and with all of the countries around the world struggling in light of the deployment of containment policies, namely lockdowns and travel bans. Even when lockdowns have eased, travel bans have persisted, several industries have remained unopened, and others have been operating at less than their full capability owing to social distancing or a deficiency in requirements. Conspicuously, COVID-19 has caused palpable apprehension amongst investors that can be attributed not only to distress about health, but also distress about potential damage to livelihoods as well as a downturn in global economic activities. In a nutshell, uncertainty has abounded [118,119]. A burgeoning body of literature has illustrated that the COVID-19 pandemic has impacted various aspects of economies [120]. It should be undoubtedly emphasized that the COVID-19 virus has triggered uncertainty in terms of the private and public sector organizations, entrepreneurs, and the labor force [121]. In order to handle these challenges, the strategic implementation of budgeting and rebudgeting processes has been encouraged to promote larger flexibility as well as to pursue higher coordination across tiers of public sector organizations and to reinforce the growth of competencies that are consistent with the new tasks that public sector organizations must undertake. This contemporary crisis has underlined the magnitude of a proactive role of stakeholders and their engagement in the related budgeting cycle [122]. In order to implement performance budgeting, public sector organizations should attain consensus among their executives as well as from legislature about performance indicators [123]. To that end, a fruitful performance by a budgeting system rests on the level to which organizations formulate and evolve efficient and effective performance measures that completely mirror public goals according to stakeholder requirements and that are buttressed by stakeholders [113,124,125]. On the other hand, stakeholder participation could benefit governments to gain public service performance, with the expectation of diminishing spillover and clashes between stakeholders [126]. Even in these competing perspectives, it has been verified that stakeholder participation enables governments to make successful fiscal retrenchment decisions, enhance organizational performance [127], and gain the trust of stakeholders in the government [128].
On the basis of the abovementioned rationales, the current study posited the fourth hypothesis:
Hypothesis 4 (H4).
External motivation is more likely to significantly and positively affect BIA.
Sustainability is a prescriptive definition that suggests how human beings should behave with regard to the environment and sheds light on their responsibilities to each other as well as to future generations [129]. In this sense, any entity that yearns to be sustainable should ponder its future growth and to evaluate its sustainability performance in order to minimize risks and uncertainty as well [130]. As such, sustainability is considered as a determinant that makes huge contributions to the permanence and achievement of all entities [131]. In the current research, organizational sustainability focused on external sustainability and internal sustainability. In particular, external sustainability concentrates on attention to organizational operations formulated to benefit external stakeholders [132] and was constituted by two dimensions: an environmental dimension and a social dimension. The environmental dimension was specified as the organizational effects on nature, and the social dimension was determined as the organizational influence on external actors, whereby discernment could be implemented between the beneficiaries of the entity as well as the broader communities [133]. In this regard, PBB could act as a technique to warrant organizational accountability for organizational strategic planning procedures and to monitor expenditure [134], which should respond to the requests of stakeholders [135]. It is simultaneously a fruitful financial exhortation method for an entity to make plans for its future sustainability [136]. Meanwhile, internal sustainability reflects the managerial practices directly associated with the physical and psychological working environment of an organization’s staff. To put it differently, internal sustainability focuses on techniques to engage the organizational labor force, gratifying the fundamentally psychological requests of the staff for capabilities as well as autonomy [137,138]. The capability requirements were tackled through creating chances to improve internal sustainability [139]. Organizational considerations for the advancement of skills can upgrade the productivity of an organization’s human resources [140]. In addition, internal sustainability gratifies the requirements of autonomy of the labor force through generating an awareness of being in charge [141]. It could both enable them to be “in control” of their work–life balance as well as supply them with a consciousness of volition [142]. Moreover, flawless targets are leveraged to revamp effectiveness compared to unparticular targets, resulting in dissatisfaction and frustration among an organization’s human resource [143]. Against this backdrop, there has been immense consensus on the paramount part of budgeting to coordinate various organizational ingredients, such as controlling and evaluating the performance of the labor force, motivating personnel, and advancing communication [144,145]. Unquestionably, the implementation of PBB would offer detail regarding all of the precedence scales of the targets and outcomes to be obtained, the goals to be reached, programs, and the operations that must be executed [37,66]. Moreover, PBB was deemed as a strategic instrument that could make individual goals fit with the organizational goals [146]. Along a similar line of reasoning, the current study presumed the fifth hypothesis:
Hypothesis 5 (H5).
BIA is more likely to significantly and positively affect organizational sustainability.
Building on the recommendation of [11], resilience is well-recognized as coming from the words “resilire” as well as “resilio”, which mean “bounce back” or “jump back” in Latin. Resilience has been delved into in an enormous volume of disciplines, namely psychology, organization sciences, engineering, and ecology [147]. Hitherto, the consensus on the delineation of organizational resilience in the business and management field has not yet been achieved [11,148]. The conceptualization of resilience as applied to organizations has received intense interpretation [149] and a proactive capacity [150]. It has pondered whether an organization can take advantage of is circumstances [151,152], advance capacities, and enhance competences to supervise and even produce new chances [153,154]. Resilience has been considered to be revamped and intensified by the implementation of adequate anticipatory capabilities and coping capabilities and by diminishing prevailing vulnerabilities [21]. The paramount goal of budgeting is to enhance the pertinence of all organizational operations and the management system, predominantly by systematically instructing and governing all organizational operations, ascertaining internal and external ventures to lessen their influence, and producing flexible interconnections between all aspects of the economic entity [155]. Due to the momentousness of the budgeting system in any entity and its influence on organizational accomplishment or failure, it is well-acknowledged that an operational budgeting system and being ready to formulate one might become a step towards the proper utilization of internal resources [156]. As recommended by [41], PBB outcomes depict the target outputs and outcomes of planned operations and budgets, execution principles, and measurement schedules as well. Inevitably, this application facilitates a public sector organization to revamp resource allocation via simultaneous inclusion of expenditure and performance and to intensify competence to compare departmental expenses and buttress informed decisions in terms of organizational resources [90]. The above evidence has led to the hypothetical statement that:
Hypothesis 6 (H6).
BIA is more likely to significantly and positively affect organizational resilience.
Based on the above conversations, the research model is delineated in Figure 1, which maps the hypothesized interconnections among the CSFs of BIA as well as the interaction between BIA, organizational sustainability, and organizational resilience.
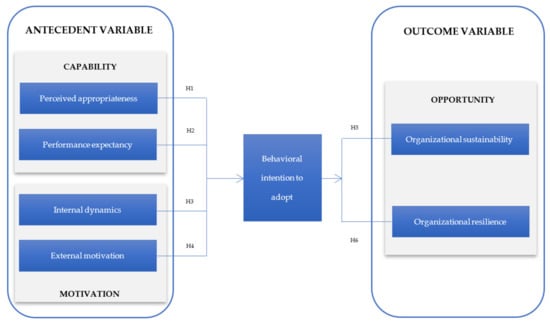
Figure 1.
Hypothesized model.
3. Research Method and Materials
According to perspectives of [157], the above research method offered a plan for carrying out the issue under investigation. This section concentrates on the investigation method and materials employed in this research, comprising the research design as well as the data procurement and data analysis procedures.
3.1. Operationalization of Variables for Measurement
The indicators for each construct of the currently hypothesized model stemmed from precedent literature and was subsequently self-developed in a partial manner from the qualitative phase to become appropriate for use in the present study setting. More concretely, semi-structured interviews were leveraged in this study, as this approach could facilitate open-ended data collection, exploration of respondent thoughts, specific feelings on the topic, and beliefs as well as in-depth investigation of personal and sensitive matters [158]. Purposive sampling [159] was selected to recruit an appropriate group of field participants, as it allows a wide range of viewpoints to be collected and for novel ideas to be procured and discussed [160]. The subjects of this research were represented by leaders of public sector organizations who could offer informed opinions and in-depth information about the related topic from the standpoints of their respective organizations [161]. Accordingly, the leaders of different public sector organizations were interviewed. The criteria for the interviewee selection comprised managerial seniority to ensure sufficient decision-making authority and at least 10 years of working experience in the organization they represented to ensure the individual’s engagement in the design of the performance measurement system and control system. Grounded on the requests of [162], the number of cases fluctuated from 4 to 10 or until the acceptable degree of saturation was reached wherein the data became redundant. As such, six interviews were undertaken with six lecturers within universities in the southern areas of Vietnam.
The questionnaire, which was based on scales that have been broadly explored and authenticated in the literature [163], was adjusted to meet the research objectives. The questionnaire was initially set up in English and subsequently translated to Vietnamese via a back-translation technique [164]. The content, textual, and semantic correspondence amendments were handled by the bilingual members of the research team [165]. As the questionnaire was established in divergent contexts (i.e., cultural and environmental), a pre-test was carried out in two phases to assure that there were no unforeseen complexities [166]. In the primary stage, a draft of the questionnaire was given to 10 experts to evaluate the issues from the angle of issue specificity and clearness of development. In light of the exploration, several issues were overhauled to increase their specificity and to make them less ambiguous. The second pre-test included administering the questionnaire to a handful of 30 willing participants prior to its field administration for integrity and validity assurance. As such, these participants were recommended to complete the changed poll and to express any equivocalness or other problems they encountered in responding to the questionnaire as well as to provide any suggestions that they deemed to be appropriate. Given that there were no items that needed to be refined, the final structured questionnaire was set up and administered.
3.1.1. Perceived Appropriateness
The scales for perceived appropriateness in this research were established as a first-order reflective construct using a six-item scale adapted from the works of [37,87,88,93,167,168].
3.1.2. Performance Expectancy
The scales for performance expectancy in this research were set up as a first-order reflective construct that included a nine-item scale adapted from [169].
3.1.3. External Motivation
The first-order construct of external motivation was shaped through the second-order constructs covering environmental uncertainty and stakeholder support. More instrumentally, environmental uncertainty comprised a four-item scale originating from the observations of [170,171,172,173,174,175]. The scales for stakeholder support consisted of a four-item scale generated from the works of [26,176,177,178].
3.1.4. Internal Dynamics
The first-order construct of internal dynamics was structured by the second-order constructs encompassing accountant competence, an effective performance management framework, and the commitment of the leader to public values. More particularly, accountant competence was measured with a four-item scale sourced from the findings of [179]. The effective performance management framework was measured by a four-item scale adapted according to the criteria for an effective performance management framework proposed by [180]. The commitment of the leader to public values was measured by a four-item scale that stemmed from [181].
3.1.5. Organizational Sustainability
The first-order construct of organizational sustainability was composed of three-order constructs reshaped according to the guideposts of [182]. Accordingly, employee sustainability was measured using an adjusted three-item scale based on the works of [134]. In the same vein, environmental sustainability and beneficiaries of sustainability were evaluated using an adapted three-item scale based on the findings of [134].
3.1.6. Organizational Resilience
The first-order construct of organizational resilience was constituted by five-order constructs inherited from the suggestions of [183]. More concretely, Capital resilience was assessed by four-item scale from the findings of [184,185]; strategic resilience was assessed using a five-item scale based on the observations of [186]. Cultural resilience was assessed using a five-item scale generated from the findings of [187]; the relationship resilience was assessed using a five-item scale based on the findings of [153,188]. Learning resilience was assessed by a five-item scale derived from [189,190].
3.1.7. Behavioral Intention to Adopt
The first-order reflective construct of BIA included a three-item scale adjusted from the contributions of [191,192,193,194,195].
A five-point Likert scale to evaluate the degrees of the respondents’ agreement with the statements (1 = “strongly opposed”, 5 = “strongly supported”) was employed for all measurements.
3.2. Target Population Selection of Context
Survey responses were collected via standard survey evolvement deliberations [196]. The unit of analysis was public sector organization, and the participants were accountants. This was because they are individuals in public sector organizations who handle the measuring, disclosing, and assuring of all organizational information and decision-making processes. The accountants were also the employees who were responsible for the organization’s planning and control system implementation. Taken together, this group of respondents was considered to be the most apposite individuals who were both representatives and related personals to take part in the survey. Moreover, in order to assure that those respondents were adequately knowledgeable to complete the questionnaire, the participants were recommended to respond to the questions about the extent of their awareness with PBB application. In doing so, the respondents who lacked awareness of this issue were excluded from the dataset.
3.3. Sampling Procedures and Data Collection
Building on the perceptions of [197], a consensus on the specific sample size for the application of covariance-based structural equation modeling has not yet been reached. Previous scholars have recommended that the minimum number of respondents be at least four times the total number of items in the questionnaire [198]. However, [199] requested a sample size varying from 30 to 460, and [200] argued that a sample size greater than 500 would be appropriate. Moreover, [201] advocated for a sample size ranging from 200 to 800 participants for the implementation of covariance-based structural equation modeling. It was recommended that sample selection be based on several criteria, namely effortless accessibility, geographical proximity, availability within a given period of time, and the willingness to be involved [202]. To that end, a combination of snowball and convenience sampling was employed in all three waves of data collection in this study, as this combination has been corroborated as being appropriate for the collection of a large volume of information from a population to produce statistical inferences. The first wave of data collection began at the peak of restrictive measures during the first lockdown in 2020 and lasted from March to October. As it would be difficult to administer paper-based questionnaires during the lockdown periods, telephone interviews were contemplated as a replacement. The same procedures were implemented during the second wave of data collection, which lasted from March to November 2021, with the most stringent lockdown occurring from July to October 2021. The ongoing restrictions in these two waves of data collection included the closure of schools and non-imperative service activities, restraining the movement of residents, and the cancellation of public transport. The third wave took place from January to May in 2022, a period of moderately lessened virus transmission and in which more restrictions were eased and society fully reopened. Paper-based questionnaires were directly circulated to enhance the response rate and to minimize sampling bias. It also produced valuable chances for the researchers to enlarge the sample size based on the sample of the first and second wave of database collection. After eliminating unusable responses due to excessive missing data as well as straight-lining the responses, the valid responses were 783, 623, and 812 for the first wave, the second wave, and the third wave of database collection periods, respectively. These scenarios triggered the constitution of partially overlapping samples, which, in turn, shaped the “partially paired data”. The socio-demographic profile of the respondents is depicted in Table 1.

Table 1.
Demographic information.
3.4. Statistical Analysis and Calculations
Regarding the relevant literature and explicit practicability of the research objectives, the current manuscript split models with constructs into different time periods. In the first phase of the analysis procedure, structural equation modeling analysis was carried out to estimate the hypothesized interlinks. More concretely, measurement model evaluation was implemented to investigate the reliability and validity of the measures, and the structural model was subsequently examined to determine the goodness of fit of the model. Hypothesis testing as also implemented. In the second phase, the shift in the level of the constructs over time was determined. Even though observations were procured at three periods of time when the samples changed over time, they still showed several commonalities. Thus, the one-way ANOVA test and paired samples t-tests were performed on the construct scores. SPSS version 26 and AMOS version 26 were used to carry out the database analysis in both phrases.
4. Results and Elucidation Analytical Observations
This section aimed to provide an overview of the result analyses carried out on the statistical data and to discuss the main outcomes to buttress the study’s goals.
4.1. Results Analysis of Proposed Models with Constructs at Different Times
4.1.1. Formulating Reliability and Convergent Validity
Reliability test: Given that the reliability of the measurement instrument was investigated to identify its capability to produce consistent measurements, the reliability evaluation of the scale principally comprised two facets, namely the general reliability of the scale and the reliability of the latent variables [203]. Accordingly, Cronbach’s α was employed to assess data reliability to reach a degree of confidence and to ascertain accuracy in the gathered data [204,205]. Given that numerous academic works have avoided utilizing Cronbach’s α unconditionally and researchers have added it to the reliability coefficients based on structural equation modeling [206,207], composite reliability was employed in this study. Composite reliability provided a more retrospective method of inclusive reliability and estimated the consistency of the construct itself, encompassing the steadiness and equivalence of the construct [208]. Based on the suggestions of [209], scores higher than a common acceptance degree of 0.70 were considered to be indicative of good scale reliability. In the outputs in Table 2, the composite reliability and Cronbach’s α of each construct were greater than the proposed thresholds of 0.7, underlining that the items achieved perfect reliability.
Table 2.
Summary of convergent validity results.
Validity test: Content validity and structural validity were applied to determine the validity of the scale. In this regard, content validity reflected a suitable level of sampling for the forecasted content. The questionnaire on intention to implement PBB was heavily based on in-depth interviews with experts. Additionally, in order to produce questionnaire content that was both complete and well-defined, several experts were recommended to be involved in designing the questionnaire after the first draft of the questionnaire was generated. In doing so, the measurement scales employed in this research were formulated in a rigorous manner, and the content validity of the scale was trustworthy.
Moving to the structural validity investigation, the convergence validity and discriminative validity were the two main issues on which we placed concern.
As proposed by [203], convergent validity reflected how many similar outcomes were generated by the different methods used to measure latent factors. Succinctly put, the convergent validity accented whether the interconnections between constructs and items were substantial [208,210,211]. The criteria for convergent validity were that average variance extracted (AVE) should surpass the threshold limit of 0.5 [208,211] and that the standardized loading of each item be higher than 0.6 [208]. The result analyses in Table 2 reveal evidence of good convergent validity.
4.1.2. Establishing Discriminant Validity
The discriminant validity investigation was performed to corroborate whether each construct was distinctive and captured disparate but theoretically linking variables [212]. Reinforcement of discriminant validity was achieved when the values of the arithmetically derived square roots of the AVE of a dimension were larger than the correlation coefficients between that dimension and others [213]. Moreover, this type of validity could be reached when the constructs’ correlation values were not excessively higher than 0.85 [214]. The outcomes of the comparisons illustrated in Table 3 demonstrate sufficient discriminant validity.
Table 3.
Summary of discriminant validity results.
In a nutshell, these values pinpoint that the three hypothesized models obtained perfect indicator reliability, construct reliability, convergent validity, and discriminant validity.
4.1.3. Fitting the Recommended Model
In order to further investigate for the fitness of the model, the indices employed for estimating the goodness of fit of the measurement and structural models was heavily based on commonly accepted standards [215]. Accordingly, the overall fit of these models was examined by following fit criteria: Chi-square/degree of freedom (Chi-square/df), the goodness-of-fit index (GFI), the comparative fit index (CFI), the Tucker–Lewis index (TLI), and root mean square error of approximation (RMSEA). It was recommended to split the values of χ2 by the degrees of freedom and that values should be lower than 2.5 [216,217] to underline an appropriate fit. Additionally, the values of GFI, CFI, and TLI were suggested to be larger than 0.08 to underscore marginal fit [218], whilst values greater than 0.9 demonstrated a good fit [219]. As recommended by [220], GFI scores could be lower than 0.95 in numerous studies and could vary from 0.774 to 0.923. The RMSEA (root mean square error of approximation) should be below the value of 0.07 to illustrate the good fit [221]. Concerning the pondered fit indices, it was unambiguously documented in the extant literature that not all of the fit indices have to be invariably fulfilled by the models [217]. More concretely, the fact that specific local criterion fell imperceptibly below the threshold value should not lead to a rejection of the model [216]. On the basis of the outcomes in Table 4, the measurement and structural models were authenticated to flawlessly fit the procured data, as all of the obtained indices were consistent with cut-off criteria requested by other researchers.
Table 4.
The outcomes of measurement and structural model analysis.
4.1.4. Investigating the Structural Model
Regarding the year 2020, the effect of PA (H1: β = 0.433, p = 0.000) illustrated a markedly significant interconnection with BIA, while the effect of PE (H2: β = 0.376, p = 0.000) highlighted a strictly significant association with BIA. The interlink between ID and BIA (H3: β = 0.343, p = 0.000) was staunchly supported, as was the relationship between EM and BIA (H4: β = 0.268, p = 0.014). The influence of BIA on OSU (H5: β = 0.227, p = 0.000) was strongly undergirded. Moreover, the effect of BIA was determined to positively influence ORE (H6: β = 0.356, p = 0.000). Therefore, H1, H2, H3, H4, H5, and H6 were accepted.
Concerning the year 2021, PA had a significantly positive association with BIA (H1: β = 0.419, p = 0.000). Moreover, PE was determined to be related to BIA (H2: β = 0.378, p = 0.000) in a significantly positive manner. The investigation of the relationship between ID and BIA (H3) denoted that the standardized path coefficient (β) was 0.329, with p = 0.008. As expected, the paths linking EM and BIA (H4: β = 0.205, p = 0.039) were significantly positive. Meanwhile, the interconnection between BIA and OSU (H5: β = 0.109, p = 0.003) was reported to be markedly significant. The last set depicted that BIA had a significant positive relationship with ORE (H6: β = 0.451, p = 0.002). Thus, H1, H2, H3, H4, H5, and H6 were accepted.
Moving to the year 2022, the effect of PA (H1: β = 0.418, p = 0.000) illustrated a markedly significant interconnection with BIA, while the effect of PE (H2: β = 0.386, p = 0.000) highlighted a strictly significant association with BIA. The investigation of the relationship between ID and BIA (H3) denoted that the standardized path coefficient (β) was 0.360, with p = 0.000. As predicted, the paths linking EM and BIA (H4: β = 0.329, p = 0.013) were significantly positive. The influence of BIA on OSU (H5: β = 0.349, p = 0.000) was strongly undergirded. The last set depicted that BIA had a significant positive relationship with ORE (H6: β = 0.493, p = 0.000). Hence, H1, H2, H3, H4, H5, and H6 were accepted.
The parameter estimates and outcomes of the model hypotheses are detailed in Table 5 and in Figure 2, Figure 3, and Figure 4, respectively.
Table 5.
Structural coefficients (β) of the model.
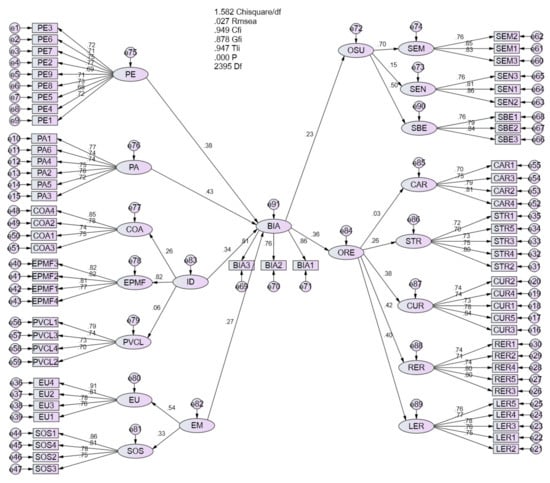
Figure 2.
Diagram of structural model; this figure was extracted from AMOS and shows the path directions for H1–H6 based on the empirical data collection in 2020.

Figure 3.
Diagram of structural model; this figure was extracted from AMOS and shows the path directions for H1–H6 based on the empirical data collection in 2021.

Figure 4.
Diagram of structural model; this figure was extracted from AMOS and shows the path directions for H1–H6 based on the empirical data collection in 2022.
4.2. Results Analysis of the Changes in the Degrees of the Constructs over Time
In addition to the shift in the path coefficients over time, the alternation in the degree of the constructs over time was the other concern of numerous scholars [222]. Regarding this, the one-way ANOVA test was performed in the current research to determine the differences in the degrees of the constructs. Based on the outcomes of the mean square and p-value in Table 6, there were significant improvements among a majority of the constructs during the period of 2020 to 2022.
Table 6.
The summary results of the one-way ANOVA test.
As the statistical data in this research were drawn from partially overlapping samples, this, in turn, resulted in “partially paired data”. The paired sample t-test was executed to examine the differences in the levels of the constructs.
The means (M), standard deviations (SD), and the mean differences of the constructs from one point in time to another point in time are tabulated in Table 7. Building on the mean differences and the paired sample t-test, there were significant improvements among the majority of the constructs between the year 2020 and the year 2021.
Table 7.
Summary of the results of the paired sample t-test.
The means (M), standard deviations (SD), and the mean differences of the constructs from one point in time to another point in time are tabulated in Table 8. Building on the mean differences and the paired sample t-test, there were significant improvements among the majority of the constructs between the year 2020 and the year 2022.
Table 8.
Summary of the results of the paired sample t-test.
4.3. Discussion and Interpretation
The acquired evidence advocates that perceived appropriateness is a robust predictor of BIA. This observation is in line with the findings of several academic works focusing on the impact of perceived appropriateness on the BIA (i.e., [223,224,225,226,227,228]). Building on this evidence, public sector organizations are more likely to adopt PBB when they perceive the higher appropriateness of PBB for their organization. The COVID-19 pandemic has proliferated rapidly around the world and indicates no signs of coming to a halt [84]. Moreover, the epidemic has instigated a gloomy influence on all fields of economics and politics [229]. PBB is capable of ascertaining the interconnections between organizational goals, targets, programs, and operations as well as key performance indicators in a concrete manner [37,87] to enable accurate steps to be taken owing to the incessant comparisons between the target and actual performance [88]. Performance information is considered to be the center of PBB and is used to embellish policy decision making and arguments, to offer budgetary options to decision-makers at all phases of the budget process, to revamp communications and transparency, to increase accountability, to enhance public services, and to endorse deeper and more informed civic engagement [230,231]. On the other hand, performance auditing can be conducted through performance budgeting; objectives can be accomplished scientifically; performance amelioration can be stimulated owing to the maintenance of the input–output interlink [232]; available resources can be allocated between a wide range of operations pertaining to their relative magnitude owing to the deficiency of organizational funds; and unnecessary operations can be annihilated [88]. As such, PBB is supposed to be a public sector funding mechanism buttressing the interconnection between funding and outcomes through the systematic use of formal performance information [233].
In accordance with the researchers’ expectations, performance expectancy was underlined to have marked impact on BIA. Performance expectancy demonstrated a significant impact on adoption intention [234]. This finding was in consonance with observations reported in numerous prior studies investigating the impact of performance expectancy on the BIA (i.e., [235,236,237,238,239,240]). There has been intense reinforcement in the literature on the multitudinous advantages of PBB implementation within public sector organizations, namely the amelioration and enhancement of accountability and transparency [90,91,92] through establishing explicit interconnection between resources and outcomes; the production of organizational efficiency and effectiveness [92] as well as organizational flexibility [93] by means of assessing and stimulating amelioration; and the achievement of optimal performance management [90,91] for evidence-based policymaking in relation to performance data. This infers that public sector organizations would be willing to adopt PBB on account of their perceptions that PBB would act more as a strategic management or decision-making instrument to integrate publicly desirable results with funding by means of budget processes [230].
The statistical outcomes of the current research shed light on the paramount role of internal dynamics and external motivation in determining BIA This evidence buttresses and broadens the obtained findings of [39] as well as [241], which highlighted that the internal dynamics were the determinants of the institutionalization of PBB. To put it differently, PBB could be leveraged and effective based on the internal dynamics [241]. Moreover, this enriched the viewpoint of precedent works indicates that a qualified and trained labor force is one of the predominant drivers in the deployment process of PBB [26,32]. The accomplishment of novel organizational policies rests heavily on an organization’s human resources’ capabilities [106,242,243]. This is because PBB implementation has been a complicated process in which organizations must recruit and retain qualified staff who are capable of procuring and analyzing data [111,116,244]. As such, highly qualified human resource capabilities would instigate a positive impact on PBB implementation [32]. Simultaneously, the observations of this research fortified and enlarged the recommendations of previous works (i.e., [26,32,41,117]) on the principal role of leadership in BIA. Indubitably, leadership style was substantiated to have an impact on participation in budgeting so that the budgeting quality would be advanced; as such, it conclusively influenced outcomes [245]. The academic studies on public leadership have underscored the predominant roles of leadership in boosting public value in public sector organizations by considering public leaders who are committed to public values as defenders of democratic values, assisting in conserving public benefits and shaping residents’ trust in the government [103,104]. Consequently, BIA is dependent on leaders committed to public values—leaders who are capable of generating a vision, translating it into action, and sustaining it through inspiring an organizational culture that is supportive of change. The result analyses in the current study attuned to those in extant literature (i.e., [26,178]) on the interconnection between an effective performance management framework and BIA. Since PBB places its focus on how to leverage performance indicators and measurement information within the budgetary process to govern public resources more efficiently and effectively [117], there is a demand for precise and detailed information and performance facts to ascertain budget allocation to acquire high budget quality. As such, an effective performance management framework would pronouncedly produce trustworthy performance information and performance monitoring to make appropriate budget allocation decisions [178] as well as validity and reliability of measurements [112].
Additionally, external motivation was determined to induce a marked influence on BIA. The obtained outcomes were in line with the findings of [39], who underscored that external pressure was a determinant of the institutionalization of PBB. More particularly, environmental uncertainty can enormously influence BIA [246,247]. The COVID-19 pandemic has been recognized as a global crisis that has resulted in more short-term catastrophes than any precedent endogenous or extreme incident [248]. It could be probable to acknowledge that the instable environment and economic as well as social uncertainty were the underlying idiosyncrasies of the pandemic context [249,250]. As suggested by [248], budgeting would be valuable for organizational strategic modification in the face of an uncertain environment. On the other hand, it is sagacious that stakeholder support be noticed in light of its influence on BIA. This increases the standpoints of precedent investigations and infers that the requests of all of stakeholders plays a significant role in PBB implementation (i.e., [26,30,176,177,178], as stakeholders are a paramount resource of an organization [251]. Needless to say, public sector organizations have multiple goals and stakeholders [252]. As a consequence, the efficiency and effectiveness of PBB implementation would benefit from the highest level of public and political reinforcement [176], the support of main budget actors [177], and executive and legislative encouragement [176].
This research also reported similar findings to previous explorations in terms of the role of budgeting in facilitating organizations to obtain resilience (i.e., [253,254,255]). The tenable interpretation contributing to this discussion was that budgeting was substantiated to undergird an organizations anticipatory and coping capabilities [21,255]. On the other hand, PBB implementation facilitates public sector organizations to revamp and enhance resource allocation and the simultaneous inclusion of costs and performance; intensify the capacity to compare departmental expenses; and support informed decisions in terms of organizational resources [90]).
In conformity with our predictions, the statistical evidence propped up and extended similar reported outcomes pertaining to the role of budgeting in assisting organizations to achieve sustainable development (i.e., [256]). A plausible explanation of this argument is that PBB implementation would help public sector organizations to acquire the internal sustainability through making individual goals align with the organizational goals [146]. Moreover, PBB is a technique that warrants organizational accountability for organizational strategic planning procedures and supervision of expenditures [134] that sufficiently respond to the claims of stakeholders [135].
5. Concluding Remarks
This section ends the current research through putting forward the implications for theory and practice along while summarizing several inherent drawbacks that leave room for future work.
5.1. Conclusions
The issues in relation to PBB and its implications have garnered attention in the literature, as PBB is considered to be an indispensable technique to establish the association between the planning process and the control process to achieve organizational goals [29]. PBB implementation among non-American countries has largely been adopted because it is a requirement of governments around the world [35] (16). These adopting nations might still not be genuinely well-prepared for PBB implementation [36,37]. In addition, the vast majority of researchers and practitioners have employed cross-sectional data to investigate the determinants of PBB implementation intention (i.e., [24,38,39,40,41,42]). This form of data collection is considered to be the most commonly applied technique carried out during one-time data collection; consequently, it has broadly been disparaged by numerous academicians studying customers behavior [43]. This is because it is uncapable of depicting the complicated and dynamic facets of a current market [43,44], as one-time data procurement only illustrates a snapshot of consumer standpoints at a specific point in time. Remarkably, as the impacts of the pandemic on society and organizations have been unclear, long-lasting, and complicated to address [17], its impacts should be supervised as well as managed rapidly and properly to assure fruitful progress towards sustainable development [45]. Filling this void, the principal objective of the current research was to formulate and develop a model exhibiting the CSFs of BIA in the context of an emerging non-American country through samples of accountants in public sector organizations in terms of BIA spanning 3 years, from 2020–2022.
5.2. Implications
5.2.1. Implications for Theory
The current research distinguishes itself from other academic works on the CSFs of PBB implementation. Accordingly, it enriches theory through recommending a conceptual model that integrates several contributions from the goal-setting theory; contingency theory; unified theory acceptance and use of technology; and the capability, opportunity, motivation, and behavior model to deeply investigate the antecedents and consequences of PBB implementation. On the other hand, the originality of this research lies in demonstrating a worthwhile direction through leveraging the repeated cross-sectional design to delve into to the CSFs of PBB implementation. In doing so, the observations from this work generated rigid cornerstone for follow-up studies as well as constructive insights for PBB implementation in light of its infancy in emerging economies. More concretely, the current study produces a basis for the further refinement of PBB acceptance models and enriches the PBB literature through suggesting the perceived appropriateness in the PBB adoption context. This study also reported on the formerly unreported role of performance expectancy towards PBB implementation. Indeed, PBB has been acknowledged as a budgeting technique for organizations to generate an interlink between any expenditure pertaining to operations and the advantages produced [257]. Apart from controlling, managing, and planning budgetary targets, PBB also directs to two further objectives, namely transparency and communication [258]. Against this backdrop, PBB practices place their concentration on ascertaining program goals, shaping targeted objectives, and making use of performance indicators to connect the budget with outputs and outcomes [28].
This manuscript added value to the prevailing literature through broadening the frontiers of understanding on the marked impacts instigated by external motivation and internal dynamics on PBB implementation. Concerning external motivation, the main contribution of the current research lies in supplying comprehensive understanding of the impact of environmental uncertainty and stakeholder support on PBB implementation. Indeed, it is possible to recognize that instable environments and economic as well as social uncertainty were considered to be the main idiosyncrasies of the pandemic context [259]. As such, there was much more encouragement pertaining to engaging in organizational planning to minimize uncertainties [260,261] to meet the proliferated demands for information given the vague future [262,263]. On the other hand, public sector organizations have numerous goals and stakeholders [252]. To that end, the harmony between the budgeting process and perspectives among key stakeholders have been deemed as salient points of the accomplishments that would be performed as well as the confirmation that there is an interlink between organizational goals and disparate programs to be conducted [264].
Moving to the internal dynamics, the findings offered interesting perspectives on the role of accountant competence, the commitment of leaders to public values, and an effective performance management framework. Indeed, the role of highly qualified accountants is also paramount to keep up with existing shifts [32], especially shifts in the form of budgeting, that is, PBB. More notably, the flourishing body of literature analyzed the influence of past crises on leadership [3], searching to determine crisis leadership capacities [265]. Leadership decisions have been delved into during financial crises [266], such as the pandemic crisis [267] and the first SARS virus [268]. There is already a burgeoning body of evidence related to leadership during the COVID-19 pandemic [6,269]. Contemporary studies have authenticated the magnitude of appropriate leadership in periods of crisis [6]. Public leaders committed to public value actions have been considered as defenders of democratic values, assisting in safeguard public benefits and shaping residents’ trust in the government [103,104]. In a nutshell, the intention of PBB implementation might bank on the commitment of a leader to public values—leaders who are capable of generating a vision, translating it into action, and sustaining it through inspiring an organizational culture supportive of change. In addition, an effective performance management framework offers trustworthy performance information and performance monitoring to release suitable budget allocation decisions [178] as well as validity and reliability of measurements [112].
This paper also acted as pioneer investigation on the interconnection between organizational sustainability, organizational resilience, and PBB implementation within public sector organizations in a developing country. More pointedly, the study added to the burgeoning literature on PBB implementation, obtaining deeper insights into how PBB implementation creates organizational resilience. Admittedly, resilience can be improved and increased through deploying adequate anticipatory competence, namely planning, information exchange, reallocating financial and nonfinancial resources based on emerging demands in a timely and transparent manner [21]. Moreover, the culmination of the study formulated an interlink of PBB implementation with organizational sustainability. Doubtlessly, budgeting would facilitate organizations in strategic planning for future performance in a prudent manner [270] that works towards efficient and effective resource allocation in consideration of stakeholder interests. Simultaneously, appropriate budgeting could act as a fruitful approach to produce a financial incentive for public sector organizations to prepare for their future sustainability [136].
5.2.2. Implications for Practice
The emergence of the COVID-19 pandemic has had an adverse impact on the ordinary operations of organizations and their staff [271]. The global pandemic has forced organizational leaders to respond efficiently and effectively to a period of uncertainty and threat [272]. Given that numerous academic works have highlighted leadership as one of the organizational attributes underlying transformation and innovation [96,273,274], leaders might influence innovation management by minimizing the uncertainty and complicatedness in terms of its pursuit [274,275] through ameliorating the innovation work behavior of the labor force [95] by means of communicating a shared vision, undergirding shift, and innovation climate [276] to improve and increase the awareness of staff of the benefits of PBB implementation. The leaders of public sector organizations are encouraged to strive to recognize and tackle the demands of their employees as well as to formulate stimulating and achievable goals for employees. Simultaneously, appropriate support and the development of professional skills should be offered through selecting courses for training on the effective implementation of PBB for accounting staff. This is because the accountants in public sector organizations must have a well-qualified understanding and appropriate skills to address PBB implementation. In this vein, accountants are inspired to be proactive and to keep advanced or ameliorated skills and understanding abreast to broaden their proficiency in a series of tasks through partaking in proper training, as financial and managerial accountants should be considered a paramount part of organizational human resources and a dearth of knowledge or poor understanding of budgeting should be surmounted [277].
The propounded model also underscored that role of leader was the other indispensable ingredient which needed to be considered by public sector organizations. Undeniably, accumulated evidence revealed that insufficient leadership competences and irrelevant leadership decisions resulted in several serious troubles during the COVID-19 pandemic [278]. As such, when leaders are more mindful of benefits and committed to their responsibility to sustain and produce public value, they become more obligated fulfill public values and are more likely to engage in BIA. Consequently, public sector organizations are encouraged to direct and support their leaders and to think through strategies to ameliorate the consciousness of decision makers towards public value issues and intrigue the moral obligation of leaders to undertake PBB in a sustainable manner. On the other hand, the leaders in public sector organizations are suggested to be proficient at coordinating a wide range of cultures and structures, weighing the conflict between short-term productivity and long-term adaptability, and continuously modify the leadership practices to be match the internal and external environment [147]. On the other hand, given that the development of human competences is requested to be at the top of the agenda of management teams [279], all of the leaders in public sector organizations are encouraged to upgrade their capabilities through continuous learning and the training demanded for specific fields [280].
Drawing on the obtained findings of this research, an effective performance management framework was authenticated, representing a vital component in pursuing PBB implementation. Thus, an effective performance management framework and a suitable training program pertaining to performance management and measurement should be considered. Against this backdrop, a public sector scorecard is a fruitful option for almost all of public sector organizations to take notice of, as it has been corroborated as a potentially effective framework to instruct the development of an organization in a sustainable manner [281,282]) through ameliorating consequences for service users and stakeholders in an economic manner and fostering measures of performance that enable them to revamp and assure quality without galvanizing staff to reap arbitrary objectives following expenditure leading to poor service [180]. Moreover, public sector organizations are advised to take advantage of the reinforcements of key stakeholders, as they represent imperative motivation for PBB implementation. Therefore, public sector organizations should set up more social interaction communities to frequently obtain the support of their key stakeholders to accomplish better organizational performance based on effective budget allocation.
From this standpoint, policy makers are requested to perform and advance policy activities directed at minimizing the environmental certainty induced by the COVID-19 crisis. Moreover, the government agencies and the undertakings of public sector organizations should remain cognizant of PBB implementation issues regarding intentions for implementation and continual implementation. To do so, governments should bridge institutional gaps and overcome financial hurdles by offering ample reinforcement for public sector organizations in all operations in terms of the PBB implementation. Outstandingly, the training programs in relation to management accounting offered by governments or institutions should be regularly and cautiously supervised to assure that these programs are appropriate for the idiosyncrasies of public sector organizations. Simultaneously, a vigorous support system supplied by the government and the leaders of public sector organizations is advised to formulate and facilitate the labor in public sector organizations and to involve an appropriate training program.
5.3. Drawbacks and Future Lines of Study
In the current research, numerous endeavors were conducted to provide valuable insights into the understanding of the extended literature on BIA for implementation. there were several limitations which should be recognized, and these might give rise to the starting points of a departure for future research. Firstly, care should be exercised when generalizing, as the obtained observations might be limited by the specificity of the study context. As all the samples were from Vietnam, the generalization of the findings requires further cross-regional investigations to corroborate them. More specifically, more evidence could be captured from other emerging economies and developed markets to obtain more valuable insights. Furthermore, scholars are advised to perform comparative explorations between emerging and developed countries to seek more useful results. Secondly, the statistical data in this research are heavily based on a self-report design. As such, the survey forms were circulated to only one individual per public sector organization. The feedback from single participants might be biased because people with more positive attitudes towards the PBB may be more willing to complete and return their survey forms. Thus, future investigations might also consider collecting the perspectives of other relevant stakeholders in this context. The third bottleneck came from the convenience and snowball sampling approaches, which might influence the generalizability of the study. Future works are suggested to employ a quota sampling method for sample data procurement, so the obtained findings can be representative and scientific [283]. The third drawback of this study was due to the comparatively small sample size, which prompts follow-up studies. Hence, more geographical coverage would be useful. Moreover, the incorporation of more constructs into the model in future studies is recommended to generate a more meaningful picture of the situation. Fourthly, although the current research contributed a methodologically rigorous assessment of a PBB adoption model through the combination of covariance-based structural equation modeling implementation and mean evaluation, partial least square path modeling is greatly appropriated to analyze evolution and change in constructs in longitudinal research since it offers several favorable methodological idiosyncrasies [284]. From the aforementioned limitation, follow-up studies could take partial least square path modeling into consideration in analyzing the behavioral intention of adoption at individual and organizational levels to produce a more unimpeachable picture of the situation.
Author Contributions
Conceptualization, P.Q.H.; methodology, P.Q.H. and V.K.P.; software, V.K.P.; validation, P.Q.H. and V.K.P.; formal analysis, P.Q.H. and V.K.P.; investigation, P.Q.H. and V.K.P.; writing—original draft preparation, P.Q.H.; writing—review and editing, P.Q.H.; offering final approval of the version to publish, P.Q.H. All authors have read and agreed to the published version of the manuscript.
Funding
This article was processed and completed as an output of a research project that is registered and funded by University of Economics Ho Chi Minh City (UEH) under the registration number CS-2020-50.
Institutional Review Board Statement
Not applicable.
Informed Consent Statement
Informed consent was attained from the primary data.
Data Availability Statement
Data will be available on request due to privacy.
Conflicts of Interest
The authors declare no conflict of interest.
References
- Dirani, K.M.; Abadi, M.; Alizadeh, A.; Barhate, B.; Garza, R.C.; Gunasekara, N.; Ibrahim, G.; Majzun, Z. Leadership competencies and the essential role of human resource development in times of crisis: A response to Covid-19 pandemic. Hum. Resour. Dev. Int. 2020, 23, 380–394. [Google Scholar] [CrossRef]
- Ansell, C.; Boin, A. Taming Deep Uncertainty: The Potential of Pragmatist Principles for Understanding and Improving Strategic Crisis Management. Adm. Soc. 2017, 51, 1079–1112. [Google Scholar] [CrossRef]
- Bhaduri, R.M. Leveraging culture and leadership in crisis management. Eur. J. Train. Dev. 2019, 43, 554–569. [Google Scholar] [CrossRef]
- Bowers, M.R.; Hall, J.R.; Srinivasan, M.M. Organizational culture and leadership style: The missing combination for selecting the right leader for effective crisis management. Bus. Horiz. 2017, 60, 551–563. [Google Scholar] [CrossRef]
- Carter, T. Crisis Management for Sales Force Managers. J. Prof. Serv. Mark. 1997, 15, 87–103. [Google Scholar]
- Pounder, P. Responsible leadership and COVID-19: Small Island making big waves in cruise tourism. Int. Public Manag. J. 2021, 17, 118–131. [Google Scholar] [CrossRef]
- Yıldırım, M.; Geçer, E.; Akgül, Ö. The impacts of vulnerability, perceived risk, and fear on preventive behaviours against COVID-19. Psychol. Health Med. 2020, 26, 35–43. [Google Scholar] [CrossRef] [PubMed]
- Neumann, K.; van Erp, T.; Steinhöfel, E.; Sieckmann, F.; Kohl, H. Patterns for Resilient Value Creation: Perspective of the German Electrical Industry during the COVID-19 Pandemic. Sustainability 2021, 13, 6090. [Google Scholar] [CrossRef]
- Sarkis, J. Supply chain sustainability: Learning from the COVID-19 pandemic. Int. J. Oper. Prod. 2020, 41, 63–73. [Google Scholar] [CrossRef]
- Jinil Persis, D.; Venkatesh, V.G.; Raja Sreedharan, V.; Shi, Y.; Sankaranarayanan, B. Modelling and analysing the impact of Circular Economy; Internet of Things and ethical business practices in the VUCA world: Evidence from the food processing industry. J. Clean. Prod. 2021, 301, 126871. [Google Scholar] [CrossRef]
- Williams, T.A.; Gruber, D.A.; Sutcliffe, K.M.; Shepherd, D.A.; Zhao, E.Y. Organizational Response to Adversity: Fusing Crisis Management and Resilience Research Streams. Acad. Manag. Ann. 2017, 11, 733–769. [Google Scholar] [CrossRef]
- Salvato, C.; Sargiacomo, M.; Amore, M.D.; Minichilli, A. Natural Disasters As A Source Of Entrepreneurial Opportunity: Family Business Resilience After An Earthquake. Strateg. Entrep. J. 2020, 14, 594–615. [Google Scholar] [CrossRef]
- Ngoc Su, D.; Luc Tra, D.; Thi Huynh, H.M.; Nguyen, H.H.T.; O’Mahony, B. Enhancing resilience in the Covid-19 crisis: Lessons from human resource management practices in Vietnam. Curr. Issues Tour. 2021, 24, 3189–3205. [Google Scholar] [CrossRef]
- Hillmann, J.; Guenther, E. Organizational Resilience: A Valuable Construct for Management Research? Int. J. Manag. Rev. 2020, 23, 7–44. [Google Scholar] [CrossRef]
- Ukaga, O.; Maser, C.; Reichenbach, M. Sustainable Development: Principles, Frameworks, and Case Studies; CRC Press: Boca Raton, FL, USA, 2010. [Google Scholar]
- Ameli, M.; Esfandabadi, Z.S.; Sadeghi, S.; Ranjbari, M.; Zanetti, M.C. COVID-19 and Sustainable Development Goals (SDGs): Scenario analysis through fuzzy cognitive map modeling. Gondwana Res. 2022, in press. [Google Scholar] [CrossRef]
- Shulla, K.; Voigt, B.-F.; Cibian, S.; Scandone, G.; Martinez, E.; Nelkovski, F.; Salehi, P. Effects of COVID-19 on the Sustainable Development Goals (SDGs). Adv. Sustain. Syst. 2021, 2, 15. [Google Scholar] [CrossRef]
- Alsharif, H.Z.H.; Shu, T.; Obrenovic, B.; Godinic, D.; Alhujailli, A.; Abdullaev, A.M. Impact of Entrepreneurial Leadership and Bricolage on Job Security and Sustainable Economic Performance: An Empirical Study of Croatian Companies during COVID-19 Pandemic. Sustainability 2021, 13, 11958. [Google Scholar] [CrossRef]
- Kabbout, R.E.; Zaiter, R. Covid-19 Related Stressors and Performance: The Case of Lebanese Employees During the Pandemic. Int. J. Manag. Sci. Bus. Adm. 2022, 8, 14–25. [Google Scholar] [CrossRef]
- Su, R.; Obrenovic, B.; Du, J.; Godinic, D.; Khudaykulov, A. COVID-19 Pandemic Implications for Corporate Sustainability and Society: A Literature Review. Int. J. Environ. Res. Public Health 2022, 19, 1592. [Google Scholar] [CrossRef] [PubMed]
- Anessi-Pessina, E.; Barbera, C.; Langella, C.; Manes-Rossi, F.; Sancino, A.; Sicilia, M.; Steccolini, I. Reconsidering public budgeting after the COVID-19 outbreak: Key lessons and future challenges. J. Public Budg. Account. Financ. Manag. 2020, 32, 957–965. [Google Scholar] [CrossRef]
- Etzion, D. Management for sustainability. Nat. Sustain. 2018, 1, 744–749. [Google Scholar] [CrossRef]
- Sisto, R.; García López, J.; Quintanilla, A.; de Juanes, Á.; Mendoza, D.; Lumbreras, J.; Mataix, C. Quantitative Analysis of the Impact of Public Policies on the Sustainable Development Goals through Budget Allocation and Indicators. Sustainability 2020, 12, 10583. [Google Scholar] [CrossRef]
- Mauro, S.G.; Cinquini, L.; Grossi, G. Insights into performance-based budgeting in the public sector: A literature review and a research agenda. Public Manag. Rev. 2016, 19, 911–931. [Google Scholar] [CrossRef]
- Goldstein, L. College and University Budgeting: An Introduction for Faculty and Academic Administrators; NACUBO: Washington, DC, USA, 2005. [Google Scholar]
- Amirkhani, T.; Aghaz, A.; Sheikh, A. An implementation model of performance-based budgeting. Int. J. Product. Perform. 2019, 69, 382–404. [Google Scholar] [CrossRef]
- De Vries, M.S.; Nemec, J. Dilemmas in Performance-Based Budgeting. In Performance-Based Budgeting in the Public Sector; Palgrave Macmillan: Cham, Switzerland, 2019; pp. 3–25. [Google Scholar] [CrossRef]
- Mikesell, J.L. Fiscal Administration: Analysis and Applications in the Public Sector, 10th ed.; Thompson, Wadsworth: San Francisco, CA, USA, 2014. [Google Scholar]
- Suwanda, D.; Moenek, R.; Lukman, S.; Syaifullah, M. The Implementation of Performance-Based Budgeting through a Money Follow Program in Impressing Budget Corruption. J. Teknol. 2021, 21, 871–878. [Google Scholar] [CrossRef]
- Andrews, M. Authority, acceptance, ability and performance-based budgeting reforms. Int. J. Public Sect. Manag. 2004, 17, 332–344. [Google Scholar] [CrossRef]
- Ehsein, A.J. Factors Influencing the Readiness to Adopt Performance-Based Budgeting System (PBBS) among Libyan Institutions of Higher Learning. Ph.D. Thesis, University Malaya, Kuala Lumpur, Malaysia, 2014. [Google Scholar]
- Putri, D.K. The Influence of Transformational Leadership Style, Human Resources Competency Towards Implementation Performance Based Budgeting and Organization Culture (Study on Government Working Unit of Situbondo Regency, East Java). Inf. Technol. Manag. 2021, 2, 28–34. [Google Scholar]
- Pakmaram, A. Identifying and prioritizing effective factors in the performance-based budgeting in telecommunications company with TOPSIS method. Afr. J. Bus. Manag. 2012, 6, 7344–7353. [Google Scholar]
- Lu, E.Y.; Mohr, Z.; Ho, A.T.-K. Taking Stock: Assessing and Improving Performance Budgeting Theory and Practice. Public Perform. Amp. Manag. Rev. 2015, 38, 426–458. [Google Scholar] [CrossRef]
- Ohemeng, F.K. Reforming Ghanaian budget system from activity-based budgeting to performance-based budgeting: Eureka or another reform illusion? In Public Budging in African Nations: Fiscal Analysis in Development Management; Routledge: New York, NY, USA, 2016; pp. 114–138. [Google Scholar]
- Andrew, M. The Limits of Institutional Reforms in Development: Changing Rules for Realistic Solutions; Cambridge University Press: Cambridge, MA, USA, 2013. [Google Scholar]
- Robinson, M.; Last, M.D. A Basic Model of Performance-Based Budgeting; International Monetary Fund: Washington, DC, USA, 2009. [Google Scholar]
- Friyani, R.; Hernando, R. Determinants of The Effectiveness of Implementation Performance Based Budgeting and Budget Absorption in Local Government (Study on Jambi City Government). Sriwijaya Int. J. Dyn. Econ. Bus. 2019, 3, 213–226. [Google Scholar] [CrossRef]
- Mauro, S.G.; Cinquini, L.; Grossi, G. External Pressures and Internal Dynamics in the Institutionalization of Performance-Based Budgeting: An Endless Process? Public Perform. Amp. Manag. Rev. 2018, 41, 224–252. [Google Scholar] [CrossRef]
- Mauro, S.G.; Cinquini, L.; Sinervo, L.-M. Actors’ dynamics towards performance- based budgeting: A mix of change and stability? J. Public Budg. Account. Financ. Manag. 2019, 31, 158–177. [Google Scholar] [CrossRef]
- Pratolo, S.; Sofyani, H.; Anwar, M. Performance-based budgeting implementation in higher education institutions: Determinants and impact on quality. Cogent Bus. Manag. 2020, 7, 1–23. [Google Scholar] [CrossRef]
- Mauro, S.G.; Cinquini, L.; Pianezzi, D. New Public Management between reality and illusion: Analysing the validity of performance-based budgeting. Br. Account. Rev. 2021, 53, 100825. [Google Scholar] [CrossRef]
- Davis, D.F.; Golicic, S.L.; Boerstler, C.N. Benefits and challenges of conducting multiple-methods research in marketing. J. Acad. Mark. Sci. 2010, 39, 467–479. [Google Scholar] [CrossRef]
- Stewart, D.W. The role of method: Some parting thoughts from a departing editor. Acad. Mark. Sci. Rev. 2009, 37, 381–383. [Google Scholar] [CrossRef][Green Version]
- Ranjbari, M.; Shams Esfandabadi, Z.; Zanetti, M.C.; Scagnelli, S.D.; Siebers, P.-O.; Aghbashlo, M.; Peng, W.; Quatraro, F.; Tabatabaei, M. Three pillars of sustainability in the wake of COVID-19: A systematic review and future research agenda for sustainable development. J. Clean. Prod. 2021, 297, 126660. [Google Scholar] [CrossRef]
- Taris, T.W.; Kompier, M. Challenges in longitudinal designs in occupational health psychology. Scand. J. Work Environ. Health 2003, 29, 1–4. [Google Scholar] [CrossRef] [PubMed]
- Duncan, G.J.; Kalton, G. Issues of Design and Analysis of Surveys across Time. Int. Stat. Rev. 1987, 55, 97–117. [Google Scholar] [CrossRef]
- Doering, T.; Suresh, N.C.; Krumwiede, D. Measuring the effects of time: Repeated cross-sectional research in operations and supply chain management. Int. J. Supply Chain Manag. 2019, 25, 122–138. [Google Scholar] [CrossRef]
- Donaldson, L. The Contingency Theory of Organizations; Sage Publications, Inc.: New York, NY, USA, 2001. [Google Scholar]
- Nohria, N.; Khurana, R. Handbook of Leadership Theory and Practice; Harvard Business School Press: Boston, MA, USA, 2010. [Google Scholar]
- Dakhli, A. Budget behaviour and cultural contingencies: Case study in a Tunisian company. Int. J. Contemp. Manag. 2021, 57, 19–30. [Google Scholar] [CrossRef]
- Shonhadji, N.; Maulidi, A. Is it suitable for your local governments? J. Financ. Crime 2020, 29, 770–786. [Google Scholar] [CrossRef]
- Luo, N.; Donaldson, L. Misfits in organization design: Information processing as a compensatory mechanism. J. Organ. Des. 2013, 2, 2–10. [Google Scholar]
- Nkundabanyanga, S.K.; Jayasinghe, K.; Abaho, E.; Mugambe, K. Contingency factors and budget actors’ behaviour during COVID-19: The case of Uganda. J. Public Budg. Account. Financial Manag. 2022. ahead of print. [Google Scholar] [CrossRef]
- Islam, J.; Hu, H. A review of literature on contingency theory in managerial accounting. Afr. J. Bus. Manag. 2012, 6, 5159–5164. [Google Scholar]
- Weber, M. The Theory of Social and Economic Organization; Oxford University Press: New York, NY, USA, 1947. [Google Scholar]
- Fuadah, L.; Safitri, R.H.; Yuliani, Y.; Arisman, A. Determinant Factors’ Impact on Managerial Performance through Management Accounting Systems in Indonesia. J. Asian Financ. Econ. Bus. 2020, 7, 109–117. [Google Scholar] [CrossRef]
- Chenhall, R. Management control systems design within its organizational context: Findings from contingency-based research and directions for the future. Account. Organ. Soc. 2003, 28, 127–168. [Google Scholar] [CrossRef]
- Hofstede, G.H. The Game of Budget Control; Tavistock: London, UK, 1967. [Google Scholar]
- Leavitt, J.H. Managerial Psychology, 3rd ed.; University of Chicago Press: Chicago, USA, 1972. [Google Scholar]
- Sofyani, H.; Santo, M.F.I.; Najda, T.; Almaghribi, M.S. The Role of Budgetary Participation and Environmental Uncertainty in Influencing Managerial Performance of Village Government. J. Account. Econ. 2020, 21, 258–276. [Google Scholar] [CrossRef]
- Widiawati, D.; Tantri Yanuar, R.S. Effect of budget participation on managerial performance mediated by job satisfaction and organizational commitment. J. Bus. Stud. 2019, 4, 54–66. [Google Scholar]
- Ryan, T.A. Intentional Behavior: An Approach to Human Motivation; Ronald Press: New York, NY, USA, 1970. [Google Scholar]
- Locke, E.A.; Latham, G.P. Building a practically useful theory of goal setting and task motivation: A 35-year odyssey. Am. Psychol. 2002, 57, 705–717. [Google Scholar] [CrossRef] [PubMed]
- Locke, E.A. Personnel Attitudes and Motivation. Annu. Rev. Psychol. 1975, 26, 457–480. [Google Scholar] [CrossRef]
- Locke, E.A.; Latham, G.P. New Developments in Goal Setting and Task Performance; Routledge/Taylor & Francis Group: Oxfordshire, UK, 2013. [Google Scholar]
- Covaleski, M.; Evans, J.H.; Luft, J.; Shields, M.D. Budgeting research: Three theoretical perspectives and criteria for selective integration. In Handbooks of Management Accounting Research; Elsevier: Amsterdam, The Netherlands, 2006; Volume 2, pp. 587–624. [Google Scholar] [CrossRef]
- Pepper, A.; Gore, J. Behavioral Agency Theory. J. Manag. 2012, 41, 1045–1068. [Google Scholar] [CrossRef]
- Robbins, S.P.; Judge, T.A. Organizational Behavior, 15th ed.; Prentice Hall: New York, NY, USA, 2008. [Google Scholar]
- Venkatesh, V.; Morris, M.G.; Davis, G.B.; Davis, F.D. User Acceptance of Information Technology: Toward a Unified View. MIS Q. 2003, 27, 425–478. [Google Scholar] [CrossRef]
- Rahi, S.; Othman Mansour, M.M.; Alghizzawi, M.; Alnaser, F.M. Integration of UTAUT model in internet banking adoption context. J. Res. Interact. Mark. 2019, 13, 411–435. [Google Scholar] [CrossRef]
- Rahi, S.; Ghani, M.A. The role of UTAUT, DOI, perceived technology security and game elements in internet banking adoption. World Rev. Sci. Technol. Sustain. Dev. 2018, 15, 338–356. [Google Scholar] [CrossRef]
- Lu, J. Are personal innovativeness and social influence critical to continue with mobile commerce? J. Med. Internet Res. 2014, 24, 134–159. [Google Scholar] [CrossRef]
- Lutfi, A.; Saad, M.; Almaiah, M.A.; Alsaad, A.; Al-Khasawneh, A.; Alrawad, M.; Alsyouf, A.; Al-Khasawneh, A.L. Actual Use of Mobile Learning Technologies during Social Distancing Circumstances: Case Study of King Faisal University Students. Sustainability 2022, 14, 7323. [Google Scholar] [CrossRef]
- Davis, F.D. Perceived Usefulness, Perceived Ease of Use, and User Acceptance of Information Technology. MIS Q. 1989, 13, 319–340. [Google Scholar] [CrossRef]
- Cane, J.; O’Connor, D.; Michie, S. Validation of the theoretical domains framework for use in behaviour change and implementation research. Implement. Sci. 2012, 7, 37. [Google Scholar] [CrossRef]
- Campbell, M. Framework for design and evaluation of complex interventions to improve health. BMJ 2000, 321, 694–696. [Google Scholar] [CrossRef]
- Michie, S.; Atkins, L.; West, R. The Behaviour Change Wheel: A Guide to Designing Interventions; Silverback Publishing: London, UK, 2014. [Google Scholar]
- Michie, S.; van Stralen, M.M.; West, R. The behaviour change wheel: A new method for characterising and designing behaviour change interventions. Implement. Sci. 2011, 6, 42. [Google Scholar] [CrossRef] [PubMed]
- Nilsen, P. Making sense of implementation theories, models and frameworks. Implement. Sci. 2015, 10, 53. [Google Scholar] [CrossRef] [PubMed]
- Berwick, D.M. Health services research and quality of care: Assignments for the 1990s. Med. Care 1989, 27, 763–771. [Google Scholar] [CrossRef]
- Kahan, J.P.; Bernstein, S.J.; Leape, L.L.; Hilborne, L.H.; Park, R.E.; Parker, L.; Kamberg, C.J.; Brook, R.H. Measuring the Necessity of Medical Procedures. Med. Care 1994, 32, 357–365. [Google Scholar] [CrossRef]
- Lu, D.-N.; Le, H.-Q.; Vu, T.-H. The Factors Affecting Acceptance of E-Learning: A Machine Learning Algorithm Approach. Educ. Sci. 2020, 10, 270. [Google Scholar] [CrossRef]
- Nicola, M.; Sohrabi, C.; Mathew, G.; Kerwan, A.; Al-Jabir, A.; Griffin, M.; Agha, M.; Agha, R. Health Policy and Leadership Models During the COVID-19 Pandemic- Review Article. Int. J. Surg. 2020, 81, 122–129. [Google Scholar] [CrossRef]
- Ho, A.T.K. From performance budgeting to performance budget management: Theory and practice. Public Adm. Rev. 2018, 78, 748–758. [Google Scholar] [CrossRef]
- Rahman, R.A.T.; Irianto, G.; Rosidi, R. Evaluation of E-budgeting implementation in provincial government of DKI jakarta using CIPP model approach. J. Account. Econ. 2019, 20, 94–114. [Google Scholar]
- Gilmour, J.B.; Lewis, D.E. Does Performance Budgeting Work? An Examination of the Office of Management and Budget’s PART Scores. Public Adm. Rev. 2006, 66, 742–752. [Google Scholar] [CrossRef]
- Verploegh, R.F.; Budding, T.; Wassenaar, M. Policy control as an alternative approach to performance-based budgeting (PBB) to strengthen the link between policy and financial means. Public Money Manag. 2022, 1–10. [Google Scholar] [CrossRef]
- Curristine, T. Performance information in the budget process. OECD J. Budg. 2006, 5, 87–131. [Google Scholar] [CrossRef]
- Kong, D. Performance-Based Budgeting: The U.S. Experience. Public Organ. Rev. 2005, 5, 91–107. [Google Scholar] [CrossRef]
- Sterck, M.; Scheers, B. Trends in Performance Budgeting in Seven OECD countries. Public Perform. Manag. Rev. 2006, 30, 47–72. [Google Scholar] [CrossRef]
- Helmuth, U. Better Performance with Performance Budgeting? Analyzing Cases of Success and Failure in Public Administrations. Int. J. Public Adm. 2010, 13, 408–428. [Google Scholar] [CrossRef]
- Srithongrung, A. The effects of results-oriented budgeting on government spending patterns in Thailand. Public Adm. Rev. 2009, 10, 59–89. [Google Scholar]
- Clark, C.; Menifield, C.E.; Stewart, L.M. Policy Diffusion and Performance-based Budgeting. Int. J. Public Adm. 2017, 41, 528–534. [Google Scholar] [CrossRef]
- Bagheri, A.; Akbari, M.; Artang, A. How does entrepreneurial leadership affect innovation work behavior? The mediating role of individual and team creativity self-efficacy. Eur. J. Innov. Manag. 2020, 25, 1–18. [Google Scholar] [CrossRef]
- Alblooshi, M.; Shamsuzzaman, M.; Haridy, S. The relationship between leadership styles and organisational innovation. Eur. J. Innov. Manag. 2020, 24, 338–370. [Google Scholar] [CrossRef]
- Terzi, A.R.; Derin, R. Relation between democratic leadership and organizational cynicism. Int. Online J. Prim. Educ. 2016, 5, 193–204. [Google Scholar] [CrossRef]
- Chemers, M.M. An Integrative Theory of Leadership; Lawrence Erlbaum Associates Publishers: New Jersey, NJ, USA, 1997. [Google Scholar]
- Jiang, H.; Chen, Y.; Sun, P.; Yang, J. The Relationship between Authoritarian Leadership and Employees’ Deviant Workplace Behaviors: The Mediating Effects of Psychological Contract Violation and Organizational Cynicism. Front. Psychol. 2017, 8, 732. [Google Scholar] [CrossRef]
- Son, T.T.; Phong, L.B.; Loan, B.T.T. Transformational Leadership and Knowledge Sharing: Determinants of Firm’s Operational and Financial Performance. SAGE Open 2020, 10, 1–13. [Google Scholar] [CrossRef]
- Mikesell, J.L. Fiscal Administration: Analysis and Applications for the Public Sector, 7th ed.; Thomson Wadsworth: Belmont, CA, USA, 2007. [Google Scholar]
- Pratolo, S.; Mukti, A.H.; Sofyani, H. Intervening Role of Performance-Based Budgeting in the Relationship between Transformational Leadership, Organizational Commitment and University Performance. J. Din. Akunt. Bisnis 2021, 8, 77–90. [Google Scholar]
- Getha-Taylor, H.; Holmes, M.H.; Jacobson, W.S.; Morse, R.S.; Sowa, J.E. Focusing the Public Leadership Lens: Research Propositions and Questions in the Minnowbrook Tradition. J. Public Adm. Res. Theory. 2010, 21, i83–i97. [Google Scholar] [CrossRef]
- Newell, T. Values-based leadership for a democratic society. In The Trusted Leader: Building the Relationships that Make Government Work; CQ Press: Washington, DC, USA, 2007; pp. 19–48. [Google Scholar]
- Fernandez, S.; Rainey, H.G. Managing Successful Organizational Change in the Public Sector. Public Adm. Rev. 2006, 66, 168–176. [Google Scholar] [CrossRef]
- Hashim, J.; Wok, S. Competence, performance and trainability of older workers of higher educational institutions in Malaysia. Empl. Relat. 2013, 36, 82–106. [Google Scholar] [CrossRef]
- Meister, J.C. Corporate Universities: Lessons in Building a World-Class Work Force; McGraw-Hill: New York, NY, USA, 1998. [Google Scholar]
- Bleyen, P.; Klimovský, D.; Bouckaert, G.; Reichard, C. Linking budgeting to results? Evidence about performance budgets in European municipalities based on a comparative analytical model. Public Adm. Rev. 2016, 19, 932–953. [Google Scholar]
- Melkers, J.; Willoughby, K. Models of performance-measurement use in local governments: Understanding budgeting, communication, and lasting effects. Public Adm. Rev. 2005, 65, 180–190. [Google Scholar]
- Kelly, J.M.; Rivenbark, W.C. Performance Budgeting for State and Local Government, 2nd ed.; M.E. Sharp: Armonk, UK, 2011. [Google Scholar]
- Wang, X. Performance measurement in budgeting: A study of county governments. Public Budg. Financ. 2000, 20, 102–118. [Google Scholar] [CrossRef]
- Melkers, J.E.; Willoughby, K.G. Budgeters’ Views of State Performance-Budgeting Systems: Distinctions across Branches. Public Adm. Rev. 2001, 61, 54–64. [Google Scholar] [CrossRef]
- Willoughby, K. Performance measurement and budget balancing: State government perspective. Public Budg. Financ. 2004, 24, 21–39. [Google Scholar] [CrossRef]
- Vignieri, V. Performance management in the public sector. In Global Encyclopedia of Public Administration, Public Policy, and Governance; Springer: Cham, Switzerland, 2018; pp. 1–8. [Google Scholar] [CrossRef]
- Van Dooren, W.; Bouckaert, G.; Halligan, J. Performance Management in the Public Sector, 2nd ed.; Routledge: London, UK, 2015. [Google Scholar]
- Rivenbark, W.; Kelly, J. Performance Budgeting in Municipal Government. Public Perform. Amp. Manag. Rev. 2006, 30, 35–46. [Google Scholar]
- Zhao, Z. Why local governments need performance evaluation: Intermediary institutions in the performance-based budgeting process in China. J. Chin. Gov. 2016, 1, 564–573. [Google Scholar] [CrossRef]
- Altig, D.; Baker, S.; Barrero, J.M.; Bloom, N.; Bunn, P.; Chen, S.; Davis, S.J.; Leather, J.; Meyer, B.; Mihaylov, E.; et al. Economic uncertainty before and during the COVID-19 pandemic. J. Public Econ. 2020, 191, 104274. [Google Scholar] [CrossRef] [PubMed]
- Salisu, A.A.; Akanni, L.O. Constructing a Global Fear Index for the COVID-19 Pandemic. Emerg. Mark. Financ. Trade 2020, 56, 2310–2331. [Google Scholar] [CrossRef]
- Sha, Y.; Sharma, S.S. Research on pandemics special issue of the journal Emerging Markets Finance and Trade. Emerg. Mark. Financ. Trade 2020, 56, 2133–2137. [Google Scholar] [CrossRef]
- Derkacz, A.J. Fiscal, Investment and Export Multipliers and the COVID-19 Pandemic Slowdowns Uncertainty Factor in the First Half of 2020. Risks 2020, 8, 122. [Google Scholar] [CrossRef]
- Sicilia, M.; Guarini, E.; Sancino, A.; Andreani, M.; Ruffini, R. Public services management and co-production in multi-level governance settings. Int. Rev. Adm. Sci. 2015, 82, 8–27. [Google Scholar] [CrossRef]
- Grizzle, G.A.; Pettijohn, C.D. Implementing performance-based program budgeting: A system-dynamics perspective. Public Adm. Rev. 2002, 62, 51–62. [Google Scholar] [CrossRef]
- Moynihan, D.P.; Pandey, S.K. The big question for performance management: Why do managers use performance information? J. Public Adm. Res. Theory 2010, 20, 849–866. [Google Scholar] [CrossRef]
- Pandey, S.K. Cutback management and the paradox of publicness. Public Adm. Rev. 2010, 70, 564–571. [Google Scholar] [CrossRef]
- Simonsen, W.; Robbins, M.D. Citizen Participation in Resource Allocation; Westview Press: Boulder, CO, USA, 2000. [Google Scholar]
- Neshkova, M.I.; Guo, H. Public participation and organizational performance: Evidence from state agencies. J. Public Adm. Res. Theory 2012, 22, 267–288. [Google Scholar] [CrossRef]
- Shim, J.; Park, J.H. Public participation and trust in government: The case of the Korean financial regulatory agency. Public Perform. Amp. Manag. Rev. 2016, 40, 1–22. [Google Scholar] [CrossRef]
- Baumgärtner, S.; Quaas, M. What is sustainability economics? Ecol. Econ. 2010, 69, 445–450. [Google Scholar] [CrossRef]
- Grecu, V.; Ciobotea, R.-I.-G.; Florea, A. Software Application for Organizational Sustainability Performance Assessment. Sustainability 2020, 12, 4435. [Google Scholar] [CrossRef]
- Acevedo-Osorio, Á.; Hofmann-Souki, S. Cruz Morales, J. Holistic competence orientation in sustainability-related study programmes: Lessons from implementing transdisciplinary student team research in Colombia, China, Mexico and Nicaragua. Sustain. Sci. 2020, 15, 233–246. [Google Scholar] [CrossRef]
- Aguinis, H.; Glavas, A. On Corporate Social Responsibility, Sensemaking, and the Search for Meaningfulness Through Work. J. Manag. 2017, 45, 1057–1086. [Google Scholar] [CrossRef]
- Farooq, M.; Farooq, O.; Jasimuddin, S.M. “Employees response to corporate social responsibility: Exploring the role of employees” collectivist orientation. Eur. Manag. J. 2014, 32, 916–927. [Google Scholar] [CrossRef]
- Schick, A. Performance budgeting and accrual budgeting: Decision rules or analytic tools? OECD J. Budg. 2007, 7, 109–138. [Google Scholar] [CrossRef]
- Zierdt, G.L. Responsibility-centred budgeting: An emerging trend in higher education budget reform. J. High. Educ. Policy Manag. 2009, 31, 345–353. [Google Scholar] [CrossRef]
- Sangiumvibool, P.; Chonglerttham, S. Performance-based budgeting for continuing and lifelong education services: The Thai higher education perspective. J. High. Educ. Policy Manag. 2016, 39, 58–74. [Google Scholar] [CrossRef]
- Andrews, C. Integrating public service motivation and self-determination theory. Int. J. Public Sect. Manag. 2016, 29, 238–254. [Google Scholar] [CrossRef]
- Ryan, R.M.; Deci, E.L. Intrinsic and extrinsic motivation from a self-determination theory perspective: Definitions, theory, practices, and future directions. Contemp. Educ. Psychol. 2020, 61, 101860. [Google Scholar] [CrossRef]
- Deci, E.L.; Olafsen, A.H.; Ryan, R.M. Self-Determination Theory in Work Organizations: The State of a Science. Annu. Rev. Organ. Psychol. 2017, 4, 19–43. [Google Scholar] [CrossRef]
- Pak, K.; Kooij, D.T.A.M.; De Lange, A.H.; Van Veldhoven, M.J.P.M. Human Resource Management and the ability, motivation and opportunity to continue working: A review of quantitative studies. Hum. Resour. Manag. Rev. 2018, 29, 336–352. [Google Scholar] [CrossRef]
- Corduneanu, R.; Dudau, A.; Kominis, G. Crowding-in or crowding-out: The contribution of self-determination theory to public service motivation. Public Manag. Rev. 2020, 22, 1070–1089. [Google Scholar] [CrossRef]
- Jensen, U.T.; Bro, L.L. How Transformational Leadership Supports Intrinsic Motivation and Public Service Motivation: The Mediating Role of Basic Need Satisfaction. Am. Rev. Public Adm. 2017, 48, 535–549. [Google Scholar] [CrossRef]
- Cohen, S.; Karatzimas, S. The role of the human resources department in budgeting: Evidence from Greece. J. Hum. Resour. Costing Account. 2011, 15, 147–166. [Google Scholar] [CrossRef]
- Parker, R.J.; Kyj, L. Vertical information sharing in the budgeting process. Account. Organ. Soc. 2006, 31, 27–45. [Google Scholar] [CrossRef]
- Heupel, T.; Schmitz, S. Beyond Budgeting-A High-hanging Fruit the Impact of Managers’ Mindset on the Advantages of Beyond Budgeting. J. Financ. Econ. 2015, 26, 729–736. [Google Scholar] [CrossRef]
- Jones, R.; Lande, E.; Lüder, K.; Portal, M. A Comparison of Budgeting and Accounting Reforms in the National Governments of France, Germany, the UK and the US. Financ. Account. Manag. 2013, 29, 419–441. [Google Scholar] [CrossRef]
- Zhang, J.; Long, J.; von Schaewen, A.M.E. How Does Digital Transformation Improve Organizational Resilience?—Findings from PLS-SEM and fsQCA. Sustainability 2021, 13, 11487. [Google Scholar] [CrossRef]
- Williams, N.; Vorley, T. Creating Resilient Economies: Entrepreneurship, Growth and Development in Uncertain Times; Edward Elgar Publishing: Northhampton, MA, USA, 2017. [Google Scholar]
- Annarelli, A.; Nonino, F. Strategic and operational management of organizational resilience: Current state of research and future directions. Omega 2016, 62, 1–18. [Google Scholar] [CrossRef]
- Beuren, I.M.; dos Santos, V.; Theiss, V. Organizational resilience, job satisfaction and business performance. Int. J. Product. Perform 2022, 71, 2262–2279. [Google Scholar] [CrossRef]
- Fiksel, J. Sustainability and resilience: Toward a systems approach. Sustain.: Sci. Pract. Policy 2006, 2, 14–21. [Google Scholar] [CrossRef]
- Vogus, T.J.; Sutcliffe, K.M. Organizational resilience: Towards a theory and research agenda. In Proceedings of the 2007 IEEE International Conference on Systems, Man and Cybernetics, Montreal, QC, Canada, 7–10 October 2007; pp. 3418–3422. [Google Scholar]
- Lengnick-Hall, C.A.; Beck, T.E.; Lengnick-Hall, M.L. Developing a capacity for organizational resilience through strategic human resource management. Hum. Resour. Manag. Rev. 2011, 21, 243–255. [Google Scholar] [CrossRef]
- Beuren, I.M.; Santos, V. Enabling and coercive management control systems and organizational resilience. Rev. Contab. Financ. 2019, 30, 307–323. [Google Scholar] [CrossRef]
- Esakova, E.E.; Nalimova, Z.F.; Yakubenko, I.A. Improving the Relevance of the Budgeting System in the Transition to the Digital Economy Model. Adv. Econ. Bus. Manag. Res. 2019, 113, 243–247. [Google Scholar]
- Hedayati, M.; Emami, F.; Esmaeili, M. Designing a model of effective factors on operational budgeting system in the sport by resilient economy approach. Int. J. Manag. Financ. Account. 2020, 5, 57–70. [Google Scholar]
- Creswell, J.W.; Creswell, J.D. Research Design: Qualitative, Quantitative, and Mixed Methods Approaches; Sage Publications: Thousand Oaks, CA, USA, 2017. [Google Scholar]
- DeJonckheere, M.; Vaughn, L.M. Semi-structured interviewing in primary care research: A balance of relationship and rigour. Fam. Med. Community Health. 2019, 7, e000057. [Google Scholar] [CrossRef]
- Creswell, J.W. Qualitative Inquiry and Research Design: Choosing among Five Approaches; Sage: Thousand Oaks, CA, USA, 2007. [Google Scholar]
- Kummer, T.-F.; Pelzl, S.; Bick, M. A conceptualisation of privacy risk and its influence on the disclosure of check-in services information. Int. J. Inf. Manag. 2021, 57, 102266. [Google Scholar] [CrossRef]
- Lincoln, Y.S.; Guba, E.G. Naturalistic Inquiry; Sage: Thousand Oaks, CA, USA, 1985. [Google Scholar]
- Eisenhardt, K.M. Building Theories from Case Study Research. Acad. Manag. Rev. 1989, 14, 532–550. [Google Scholar] [CrossRef]
- Mehrabian, A.; Russell, J.A. An Approach to Environmental Psychology; The Massachusetts Institute of Technology: Cambridge, MA, USA, 1974. [Google Scholar]
- Maneesriwongul, W.; Dixon, J.K. Instrument translation process: A methods review. J. Adv. Nurs. 2004, 48, 175–186. [Google Scholar] [CrossRef] [PubMed]
- Chapman, D.W.; Carter, J.F. Translation Procedures for the Cross-Cultural Use of Measurement Instruments. Educ. Eval. Policy Anal. 1979, 1, 71–76. [Google Scholar] [CrossRef]
- Alreck, P.L.; Settle, R.B. The importance of word-of-mouth communications to service buyers. In Marketing Theory and Applications; American Marketing Association: Chicago, IL, USA, 1995; pp. 188–193. [Google Scholar]
- Amini, M.R.; Azar, A.; Eskandari, H.; Wanke, P.F. A generalized fuzzy Multiple-Layer NDEA: An application to performance-based budgeting. Appl. Soft Comput. 2020, 100, 106984. [Google Scholar] [CrossRef]
- Andrews, M. Performance-Based Budgeting Reform: Progress Problems and Pointers; Handbook on Public Sector Performance Reviews; The World Bank: Washington, DC, USA, 2002; Volume 1. [Google Scholar]
- Verasvera, F.A. Effect of performance-based budgeting on the performance of local government apparatus (Case study of the West Java Provincial social service). J. Gov. Public Policy 2016, 15, 137–162. [Google Scholar]
- Anderson, R.W. Some determinants of the volatility of futures prices. J. Futures Mark. 1985, 5, 331–348. [Google Scholar] [CrossRef]
- Clark, K.B. The interaction of design hierarchies and market concepts in technological evolution. Res. Policy 1985, 14, 235–251. [Google Scholar] [CrossRef]
- Duncan, R.B. Characteristics of Organizational Environments and Perceived Environmental Uncertainty. Adm. Sci. Q. 1972, 17, 313–327. [Google Scholar] [CrossRef]
- Jauch, L.R.; Kraft, K.L. Strategic Management of Uncertainty. Acad. Manag. Rev. 1986, 11, 777–790. [Google Scholar] [CrossRef]
- Jaworski, B.J.; Kohli, A.K. Market Orientation: Antecedents and Consequences. J. Mark. 1993, 57, 53–70. [Google Scholar] [CrossRef]
- Wijen, F.; van Tulder, R. International regulatory turbulence: Strategies for success. RSM Int. J. Eng. Technol. Manag. 2011, 2, 4–6. [Google Scholar]
- Holzer, M.; Mullins, L.B.; Ferreira, M.; Hoontis, P. Implementing Performance Budgeting at the State Level: Lessons Learned from New Jersey. Int. J. Public Adm. 2015, 39, 95–106. [Google Scholar] [CrossRef]
- McNab, R.M.; Melese, F. Implementing the GPRA: Examining the Prospects for Performance Budgeting in the Federal Government. Public Budg. Financ. 2003, 23, 73–95. [Google Scholar] [CrossRef]
- Wang, X. Conditions to implement outcome-oriented performance budgeting: Some empirical evidence. J. Public Budg. Account. Financ. Manag. 1999, 11, 533–552. [Google Scholar] [CrossRef]
- Palmer, K.N.; Ziegenfuss, D.E.; Pinsker, R.E. International knowledge, skills, and abilities of auditors/accountants. Manag. Audit. J. 2004, 19, 889–896. [Google Scholar] [CrossRef]
- Moullin, M. Improving and evaluating performance with the Public Sector Scorecard. Int. J. Product. Perform. 2017, 66, 442–458. [Google Scholar] [CrossRef]
- Huberts, L. The Integrity of Governance: What It Is, What We Know, What Is Done and Where to Go; Palgrave Macmillan: New York, NY, USA, 2014. [Google Scholar]
- Crucke, S.; Kluijtmans, T.; Meyfroodt, K.; Desmidt, S. How does organizational sustainability foster public service motivation and job satisfaction? The mediating role of organizational support and societal impact potential. Public Manag. Rev. 2021, 24, 1155–1181. [Google Scholar] [CrossRef]
- Chen, R.; Xie, Y.; Liu, Y. Defining, Conceptualizing, and Measuring Organizational Resilience: A Multiple Case Study. Sustainability 2021, 13, 2517. [Google Scholar] [CrossRef]
- Välikangas, L. The Resilient Organization: How Adaptive Cultures Thrive Even When Strategy Fails; McGraw Hill Professional: New York, NY, USA, 2010. [Google Scholar]
- Marsick, V.J.; Watkins, K.E.; Wilson, J.A. Informal and incidental learning in the new millennium: The challenge of being rapid and/or being accurate. In Individual Differences and Development in Organizations; John Wiley & Sons, Ltd.: Hoboken, NJ, USA, 2002; pp. 249–266. [Google Scholar]
- Davenport, E.; Cronin, B. Knowledge Management: Semantic Drift or Conceptual Shift? J. Educ. Libr. Inf. Sci. 2000, 41, 294–306. [Google Scholar] [CrossRef]
- Meen, D.E.; Keough, M. Creating the learning organization. McKinsey Q. 1992, 1, 58–78. [Google Scholar]
- Shore, L.M.; Newton, L.A.; Thornton, G.C. Job and organizational attitudes in relation to employee behavioral intentions. J. Organ. Behav. 1990, 11, 57–67. [Google Scholar] [CrossRef]
- Costanza, D.P.; Blacksmith, N.; Coats, M.R.; Severt, J.B.; DeCostanza, A.H. The Effect of Adaptive Organizational Culture on Long-Term Survival. J. Bus. Psychol. 2015, 31, 361–381. [Google Scholar] [CrossRef]
- Ramón, M.; Koller, T. Exploring adaptability in organizations; where adaptive advantage comes from and 450 what it is based upon. J. Organ. Change Manag. 2016, 29, 837–854. [Google Scholar]
- Venkatesh, V.; Davis, F.D. A Theoretical Extension of the Technology Acceptance Model: Four Longitudinal Field Studies. Manage Sci. 2000, 46, 186–204. [Google Scholar] [CrossRef]
- Schierz, P.G.; Schilke, O.; Wirtz, B.W. Understanding consumer acceptance of mobile payment services: An empirical analysis. Electron. Commer. Res. Appl. 2010, 9, 209–216. [Google Scholar] [CrossRef]
- Lin, H.-F. An empirical investigation of mobile banking adoption: The effect of innovation attributes and knowledge-based trust. Int. J. Inf. Manag. 2011, 31, 252–260. [Google Scholar] [CrossRef]
- Lu, Y.; Yang, S.; Chau, P.Y.K.; Cao, Y. Dynamics between the trust transfer process and intention to use mobile payment services: A cross-environment perspective. Inf. Manag. 2011, 48, 393–403. [Google Scholar] [CrossRef]
- Yang, S.; Lu, Y.; Gupta, S.; Cao, Y.; Zhang, R. Mobile payment services adoption across time: An empirical study of the effects of behavioral beliefs, social influences, and personal traits. Comput. Hum. Behav. 2012, 28, 129–142. [Google Scholar] [CrossRef]
- Straub, D.W. Validating Instruments in MIS Research. MIS Q. 1989, 13, 147–169. [Google Scholar] [CrossRef]
- Singh, S.; Srivastava, S. Engaging consumers in multichannel online retail environment. J. Model. Manag. 2018, 14, 49–76. [Google Scholar] [CrossRef]
- Hinkin, T.R. A Review of Scale Development Practices in the Study of Organizations. J. Manag. 1995, 21, 967–988. [Google Scholar] [CrossRef]
- Wolf, E.J.; Harrington, K.M.; Clark, S.L.; Miller, M.W. (2013). Sample Size Requirements for Structural Equation Models. Educ. Psychol. Meas. 2013, 73, 913–934. [Google Scholar] [CrossRef] [PubMed]
- Comrey, A.L.; Lee, H.B. A First Course in Factor Analysis; Erlbaum: Hillsdale, NJ, USA, 1992. [Google Scholar]
- Urbach, N.; Ahlemann, F. Structural Equation Modeling in Information Systems Research Using Partial Least Squares. J. Theor. Appl. Inf. Technol. 2010, 11, 5–40. [Google Scholar]
- Etikan, I.; Musa, S.A.; Alkassim, R.S. Comparison of Convenience Sampling and Purposive Sampling. Am. J. Theor. Appl. 2016, 5, 1–4. [Google Scholar] [CrossRef]
- Sahoo, S. Exploring the effectiveness of maintenance and quality management strategies in Indian manufacturing enterprises. Benchmarking 2020, 27, 1399–1431. [Google Scholar] [CrossRef]
- Tan, L.P.; Wong, K.Y. Linkage between knowledge management and manufacturing performance: A structural equation modeling approach. J. Knowl. Manag. 2015, 19, 814–835. [Google Scholar] [CrossRef]
- Dandagi, S.; Bhushi, U.; Bagodi, V.; Sinha, D. Strategic management of technical university: Structural equation modelling approach. J. Model. Manag. 2016, 11, 75–90. [Google Scholar] [CrossRef]
- Cho, E.; Kim, S. Cronbach’s Coefficient Alpha. Organ. Res. Methods. 2014, 18, 207–230. [Google Scholar] [CrossRef]
- Raykov, T.; Marcoulides, G.A. Thanks Coefficient Alpha, We Still Need You! Educ. Psychol. Meas. 2017, 13, 147–169. [Google Scholar] [CrossRef]
- Hair, J.F.; Black, W.C.; Babin, B.J.; Anderson, R.E. Multivariate Data Analysis, 7th ed.; Prentice Hall: Englewood Cliffs, NJ, USA, 2010. [Google Scholar]
- Bagozzi, R.P.; Yi, Y. Specification, evaluation, and interpretation of structural equation models. J. Acad. Mark. Sci. 2011, 40, 8–34. [Google Scholar] [CrossRef]
- Bryne, B.M. Structural Equation Modelling with AMOS: Basic Concepts, Applications and Programming, 3rd ed.; Taylor & Francis: New York, NY, USA, 2016. [Google Scholar]
- Hair, J.F.; Ringle, C.M.; Sarstedt, M. Partial Least Squares Structural Equation Modeling: Rigorous Applications, Better Results and Higher Acceptance. Long Range Plann. 2013, 46, 1–12. [Google Scholar] [CrossRef]
- Tweneboah-Koduah, E.Y.; Adams, M.; Acheampong, G. The role of theories in social marketing in predicting physical activity behavior among the youth. J. Soc. Mark. 2019, 9, 398–417. [Google Scholar] [CrossRef]
- Fornell, C.; Larcker, D.F. Evaluating Structural Equation Models with Unobservable Variables and Measurement Error. J. Mark. Res. 1981, 18, 39–50. [Google Scholar] [CrossRef]
- Lu, I.R.R.; Thomas, D.R.; Zumbo, B.D. Embedding IRT in Structural Equation Models: A Comparison with Regression Based on IRT Scores. Struct. Equ. Modeling Multidiscip. J. 2005, 12, 263–277. [Google Scholar] [CrossRef]
- Blunch, N. Introduction to Structural Equation Modeling Using IBM SPSS Statistics and AMOS; Sage: London, UK, 2012. [Google Scholar]
- Baumgartner, H.; Homburg, C. Applications of structural equation modeling in marketing and consumer research: A review. Int. J. Mark. Res. 1996, 13, 139–161. [Google Scholar] [CrossRef]
- Konecny, P.A.; Thun, J.-H. Do it separately or simultaneously—An empirical analysis of a conjoint implementation of TQM and TPM on plant performance. Int. J. Prod. Econ. 2011, 133, 496–507. [Google Scholar] [CrossRef]
- Handley, S.M.; Benton, W.C. Unlocking the business outsourcing process model. J. Oper. Manag. 2009, 27, 344–361. [Google Scholar] [CrossRef]
- Hair, J.F.; Black, W.C.; Babin, B.J.; Anderson, R.E. Multivariate Data Analysis, 7th ed.; Pearson Education: Essex, UK, 2014. [Google Scholar]
- Motawa, I.; Oladokun, M.G. Structural equation modelling of energy consumption in buildings. Int. J. Energy Sect. Manag. 2015, 9, 435–450. [Google Scholar] [CrossRef]
- Guo, J.; Marsh, H.W.; Parker, P.D.; Dicke, T.; Lüdtke, O.; Diallo, T.M.O. A Systematic Evaluation and Comparison Between Exploratory Structural Equation Modeling and Bayesian Structural Equation Modeling. Struct. Equ. Modeling Multidiscip. J. 2019, 26, 529–556. [Google Scholar] [CrossRef]
- Shea, C.; Howell, J.M. Efficacy-performance spirals: An empirical test. J. Manag. 2000, 26, 791–812. [Google Scholar] [CrossRef]
- Babin, B.J.; Chebat, J.-C.; Michon, R. Perceived appropriateness and its effect on quality, affect and behavior. J. Retail. Consum. Serv. 2004, 11, 287–298. [Google Scholar] [CrossRef]
- Probst, M.A.; Kanzaria, H.K.; Frosch, D.L.; Hess, E.P.; Winkel, G.; Ngai, K.M.; Richardson, L.D. Perceived Appropriateness of Shared Decision-making in the Emergency Department: A Survey Study. J. Acad. Emerg. Med. 2016, 23, 375–381. [Google Scholar] [CrossRef] [PubMed]
- Cheshin, A.; Amit, A.; van Kleef, G.A. The interpersonal effects of emotion intensity in customer service: Perceived appropriateness and authenticity of attendants’ emotional displays shape customer trust and satisfaction. Organ. Behav. Hum. Decis. Process. 2018, 144, 97–111. [Google Scholar] [CrossRef]
- Ivanov, S.; Webster, C. Perceived appropriateness and intention to use service robots in tourism. In Information and Communication Technologies in Tourism; Springer: Cham, Switzerland, 2019; pp. 237–248. [Google Scholar] [CrossRef]
- Picket, B.; Dando, R. Environmental Immersion’s Influence on Hedonics, Perceived Appropriateness, and Willingness to Pay in Alcoholic Beverages. Foods 2019, 8, 42. [Google Scholar] [CrossRef] [PubMed]
- Boerman, S.C.; Segijnb, C.M. Awareness and Perceived Appropriateness of Synced Advertising in Dutch Adults. J. Interact. Mark. 2022, 22, 187–194. [Google Scholar] [CrossRef]
- Chakraborty, I.; Maity, P. COVID-19 outbreak: Migration, effects on society, global environment and prevention. Sci. Total Environ. 2020, 728, 1–7. [Google Scholar] [CrossRef]
- Joyce, P.G. The Obama Administration and PBB: Building on the Legacy of Federal Performance-Informed Budgeting? Public Adm. Rev. 2011, 71, 356–367. [Google Scholar] [CrossRef]
- Mihm, J.C. Commentary on “The Obama Administration and PBB: Building on the Legacy of Federal Performance-Informed Budgeting? ” Public Adm. Rev. 2011, 71, 368–369. [Google Scholar] [CrossRef]
- Macnab, A.; Mitchell, F. Outcome Budgeting in the Public Sector: Challenges and Solutions. An Exploratory Empirical Study; World Congress of Accountants: Rome, Italy, 2014. [Google Scholar]
- Jakobsen, M.L.F.; Pallesen, T. Performance Budgeting in Practice: The Case of Danish Hospital Management. Public Organ. Rev. 2016, 17, 255–273. [Google Scholar] [CrossRef]
- Chipeva, P.; Cruz-Jesus, F.; Oliveira, T.; Irani, Z. Digital divide at individual level: Evidence for Eastern and Western European countries. Gov. Inf. Q. 2018, 35, 460–479. [Google Scholar] [CrossRef]
- Gupta, K.; Arora, N. Investigating consumer intention to accept mobile payment systems through unified theory of acceptance model: An Indian perspective. South Asian J. Bus. Stud. 2020, 9, 88–114. [Google Scholar] [CrossRef]
- Raza, S.A.; Qazi, W.; Khan, K.A.; Salam, J. Social Isolation and Acceptance of the Learning Management System (LMS) in the time of COVID-19 Pandemic: An Expansion of the UTAUT Model. J. Educ. Comput. Res. 2020, 59, 183–208. [Google Scholar] [CrossRef]
- Muangmee, C.; Kot, S.; Meekaewkunchorn, N.; Kassakorn, N.; Khalid, B. Factors Determining the Behavioral Intention of Using Food Delivery Apps during COVID-19 Pandemics. J. Theor. Appl. Electron. Commer. Res. 2021, 16, 1297–1310. [Google Scholar] [CrossRef]
- Nikolopoulou, K.; Gialamas, V.; Lavidas, K. Habit, hedonic motivation, performance expectancy and technological pedagogical knowledge affect teachers’ intention to use mobile internet. Comput. Educ. J. 2021, 2, 100041. [Google Scholar] [CrossRef]
- Miraz, M.H.; Hasan, M.T.; Rekabder, M.S.; Akhter, R. Trust, transaction transparency, volatility, facilitating condition, performance expectancy towards cryptocurrency adoption through intention to use. J. Manag. Inf. Decis. Sci. 2022, 25, 1–20. [Google Scholar]
- Hooda, A.; Gupta, P.; Jeyaraj, A.; Giannakis, M.; Dwivedi, Y.K. The effects of trust on behavioral intention and use behavior within e-government contexts. J. Inf. Manag. 2022, 67, 102553. [Google Scholar] [CrossRef]
- Greenwood, R.; Hinings, C.R. Understanding Radical Organizational Change: Bringing Together the Old and the New Institutionalism. Acad. Manag. Rev. 1996, 21, 1022–1054. [Google Scholar] [CrossRef]
- Arifin, H.M. The Influence of Competence, Motivation, and Organisational Culture to High School Teacher Job Satisfaction and Performance. Int. Educ. Stud. 2014, 8, 38–45. [Google Scholar] [CrossRef]
- Ismail, M.D.; Domil, A.K.A.; Isa, A.M. Managerial Competence, Relationship Quality and Competitive Advantage among SME Exporters. Procedia Soc. Behav. Sci. 2014, 115, 138–146. [Google Scholar] [CrossRef]
- Ingraham, P. Pursuit of Performance: Management Systems in State and Local Government; Johns Hopkins University Press: Baltimore, MD, USA, 2007. [Google Scholar]
- Kohlmeyer, J.M.; Mahenthiran, S.; Parker, R.J.; Sincich, T. Leadership, Budget Participation, Budgetary Fairness, and Organizational Commitment. Adv. Account. Behav. Res. 2014, 95–118. [Google Scholar] [CrossRef]
- Aldrich, G.A.; Grimsrud, K.M.; Thacher, J.A.; Kotchen, M.J. Relating environmental attitudes and contingent values: How robust are methods for identifying preference heterogeneity? Environ. Resour. Econ. 2006, 37, 757–775. [Google Scholar] [CrossRef]
- Kotchen, M.J.; Reiling, S.D. Environmental attitudes, motivations, and contingent valuation of nonuse values: A case study involving endangered species. Ecol. Econ. 2000, 32, 93–107. [Google Scholar] [CrossRef]
- He, P.; Sun, Y.; Zhang, Y.; Li, T. COVID–19′s Impact on Stock Prices Across Different Sectors—An Event Study Based on the Chinese Stock Market. Emerg. Mark. Financ. Trade 2020, 56, 2198–2212. [Google Scholar] [CrossRef]
- Fu, Y.; Wu, D.; Wang, Y.; Wang, H. Facility location and capacity planning considering policy preference and uncertain demand under the One Belt One Road initiative. Transp. Res. Part A: Policy Pract. 2020, 138, 172–186. [Google Scholar] [CrossRef]
- García-Gómez, C.D.; Demir, E.; Chen, M.-H.; Díez-Esteban, J.M. Understanding the effects of economic policy uncertainty on US tourism firms’ performance. Tour. Econ. 2021, 28, 1174–1192. [Google Scholar] [CrossRef]
- Orlikowski, W.J.; Hofman, J.D. An Improvisational Model for Change Management: The Case of Groupware Technologies. MIT Sloan Manag. Rev. 1997, 38, 11–21. [Google Scholar]
- McAdam, R.; Hazlett, S.; Casey, C. Performance management in the UK public sector. Int. J. Public Sect. Manag. 2005, 18, 256–273. [Google Scholar] [CrossRef]
- Horngren, C.T.; Datar, S.M.; Foster, G.; Rajan, M.; Ittner, C. Cost Accounting: A Managerial Emphasis, 13th ed.; Pearson Education, Inc.: Upper Saddle River, NJ, USA, 2009. [Google Scholar]
- Horngren, C.T.; Datar, S.M.; Rajan, M. Cost Accounting: A Managerial Emphasis, 14th ed.; Prentice Hall: Upper Saddle River, NJ, USA, 2012. [Google Scholar]
- Barbera, C.; Guarini, E.; Steccolini, I. How do governments cope with austerity? The roles of accounting in shaping governmental financial resilience. Account. Audit. Account. J. 2020, 33, 529–558. [Google Scholar] [CrossRef]
- Mirzamani, A.; Naderi–Beni, N.; Mohammadian, H. The sustainable development goals and policy capacity: A case study of performance-based budgeting implementation in Iran. Int. J. Environ. Sci. Technol. 2022, 19, 5029–5038. [Google Scholar] [CrossRef]
- Alkaraan, F. Public financial management reform: An ongoing journey towards good governance. J. Financ. Report. Account. 2018, 16, 585–609. [Google Scholar] [CrossRef]
- Hijal-Moghrabi, I. The Current Practice of Performance-Based Budgeting in The Largest U.S. Cities: An Innovation Theory Perspective. Public Perform. Amp. Manag. Rev. 2017, 40, 652–675. [Google Scholar] [CrossRef]
- Gomes, S.; Sousa, M.; Santos, T.; Oliveira, J.; Oliveira, M.; Lopes, J.M. Opening the “Black Box” of University Entrepreneurial Intention in the Era of the COVID-19 Pandemic. Soc. Sci. 2021, 10, 181. [Google Scholar] [CrossRef]
- Khandwalla, P.N. Crisis responses of competing versus non-competing organizations. Int. J. Bus. Adm. 1978, 9, 151–178. [Google Scholar]
- Harris, D.J.; Davies, B.C.L. Corporate planning as a control system in United Kingdom nationalized industries. Long Range Plann. 1981, 14, 15–22. [Google Scholar] [CrossRef]
- Vaaler, P.M.; McNamara, G. Crisis and Competition in Expert Organizational Decision Making: Credit-Rating Agencies and Their Response to Turbulence in Emerging Economies. Organ. Sci. 2004, 15, 687–703. [Google Scholar] [CrossRef]
- Hopwood, A.G. The economic crisis and accounting: Implications for the research community. Account. Organ. Soc. 2009, 34, 797–802. [Google Scholar] [CrossRef]
- Octariani, D.; Akram, A.; Animah, A. The Effect of Implementation of Good Governance, Performance Based Budgeting, and Human Resources to Budget Qualities. J. Public Adm. Res. Theory 2017, 1, 81–97. [Google Scholar]
- Wisittigars, B.; Siengthai, S. Crisis leadership competencies: The facility management sector in Thailand. Facilities 2019, 37, 881–896. [Google Scholar]
- Haddon, A.; Loughlin, C.; McNally, C. Leadership in a time of financial crisis: What do we want from our leaders? Leadersh. Organ. Dev. J. 2015, 36, 612–627. [Google Scholar] [CrossRef]
- Nyenswah, T.; Engineer, C.Y.; Peters, D.H. Leadership in Times of Crisis: The Example of Ebola Virus Disease in Liberia. Health syst. Reform 2016, 2, 194–207. [Google Scholar] [CrossRef] [PubMed]
- Leung, P.; Lam, T. Crisis Management During the SARS Threat. J. Hum. Resour. Hosp. 2004, 3, 47–57. [Google Scholar] [CrossRef]
- Manuel, T.; Herron, T.L. An ethical perspective of business CSR and the COVID-19 pandemic. Bus. Soc. Rev. 2020, 15, 235–253. [Google Scholar] [CrossRef]
- Gooneratne, T.N.; Hoque, Z. Institutions, agency and the institutionalization of budgetary control in a hybrid state-owned entity. Crit. Perspect. Account. 2016, 36, 58–70. [Google Scholar] [CrossRef]
- Eichenauer, C.J.; Ryan, A.M.; Alanis, J.M. Leadership During Crisis: An Examination of Supervisory Leadership Behavior and Gender During COVID-19. J. Leadersh. Organ. Stud. 2021, 29, 190–207. [Google Scholar] [CrossRef]
- Li, K.; Griffin, M.A. Prevention-focused leadership and well-being during the pandemic: Mediation by role clarity and workload. Leadersh. Organ. Dev. J. 2022, 43, 890–908. [Google Scholar] [CrossRef]
- Kremer, H.; Villamor, I.; Aguinis, H. Innovation leadership: Best-practice recommendations for promoting employee creativity, voice, and knowledge sharing. Bus. Horiz. 2018, 62, 65–74. [Google Scholar] [CrossRef]
- Zuraik, A.; Kelly, L. The role of CEO transformational leadership and innovation climate in exploration and exploitation. Eur. J. Innov. Manag. 2018, 22, 84–104. [Google Scholar] [CrossRef]
- Birkinshaw, J.; Hamel, G.; Mol, M.J. Management Innovation. Acad. Manag. Rev. 2008, 33, 825–845. [Google Scholar] [CrossRef]
- Afsar, B.; Umrani, W.A. Transformational leadership and innovative work behavior: The role of motivation to learn, task complexity and innovation climate. Eur. J. Innov. Manag. 2020, 23, 402–428. [Google Scholar] [CrossRef]
- Armitage, H.M.; Lane, D.; Webb, A. Budget Development and Use in Small- and Medium-Sized Enterprises: A Field Investigation. Account. Perspect. 2020, 19, 205–240. [Google Scholar] [CrossRef]
- Joniaková, Z.; Jankelová, N.; Blštáková, J.; Némethová, I. Cognitive Diversity as the Quality of Leadership in Crisis: Team Performance in Health Service during the COVID-19 Pandemic. Healthcare 2021, 9, 313. [Google Scholar] [CrossRef]
- Ravichandran, T. Exploring the relationships between IT competence, innovation capacity and organizational agility. J. Strateg. Inf. 2018, 27, 22–42. [Google Scholar] [CrossRef]
- Para-González, L.; Jiménez-Jiménez, D.; Martínez-Lorente, A.R. Exploring the mediating effects between transformational leadership and organizational performance. Empl. Relat. 2018, 40, 412–432. [Google Scholar] [CrossRef]
- Huy, P.Q.; Phuc, V.K. Does Strategic Corporate Social Responsibility Drive Better Organizational Performance through Integration with a Public Sector Scorecard? Empirical Evidence in a Developing Country. Processes 2020, 8, 596. [Google Scholar] [CrossRef]
- Huy, P.Q.; Phuc, V.K. The impact of public sector scorecard adoption on the effectiveness of accounting information systems towards the sustainable performance in public sector. Cogent Bus. Manag. 2020, 7, 1–24. [Google Scholar] [CrossRef]
- Kong, H.; Bu, N. (Tom); Yuan, Y.; Wang, K.; Ro, Y. Sustainability of Hotel, How Does Perceived Corporate Social Responsibility Influence Employees’ Behaviors? Sustainability 2019, 11, 7009. [Google Scholar] [CrossRef]
- Roemer, E. A tutorial on the use of PLS path modeling in longitudinal studies. Ind. Manag. Data Syst. 2016, 116, 1901–1921. [Google Scholar] [CrossRef]


Publisher’s Note: MDPI stays neutral with regard to jurisdictional claims in published maps and institutional affiliations. |
© 2022 by the authors. Licensee MDPI, Basel, Switzerland. This article is an open access article distributed under the terms and conditions of the Creative Commons Attribution (CC BY) license (https://creativecommons.org/licenses/by/4.0/).