Article

The First 3D-Printed Building in Spain: A Study on Its Acoustic, Thermal and Environmental Performance

by
Andrea Salandin
,
Alberto Quintana-Gallardo
*,
Vicente Gómez-Lozano
and
Ignacio Guillén-Guillamón
*
Center for Physics Technologies (CTFAMA), Universitat Politècnica de València, 46022 València, Spain
*
Authors to whom correspondence should be addressed.
Sustainability 2022, 14(20), 13204; https://doi.org/10.3390/su142013204
Submission received: 16 September 2022 / Revised: 6 October 2022 / Accepted: 11 October 2022 / Published: 14 October 2022
(This article belongs to the Section Green Building)

Abstract

:
The first 3D-printed building in Spain is the object of this study, and it is presented and physically described herein from different points of view. This study combines on-site measurements, simulations, and a life cycle assessment to assess some relevant parameters concerning the acoustic, thermal and environmental performance of the 3D-printed house. The main objectives are to analyze whether the house complies with the acoustic and thermal regulations and to assess whether it can act as a sustainable alternative to conventional masonry construction, especially when time plays an important role. The build surface (3D prototype) of the house is approximately 23 m2. The internal space includes a living room (12.35 m2), a bedroom (7.36 m2) and a bathroom (3.16 m2). The total surface of the house is 22.87 m2 and it has a volume of 64.03 m3. The acoustic insulation was measured according to the ISO 9869-1:2014 standard. In terms of the acoustic insulation, the sound reduction index was tested following the guidelines of the ISO 140-5:1999 standard. Additionally, the study includes a comparative life cycle assessment comparing the 3D-printed façade with two conventional wall typologies. The 3D-printed house displays an excellent thermal performance, with a measured thermal transmittance of 0.24 Wm−2K−1, suitable for all Spanish climate zones. Regarding the acoustic insulation, the measured global sound reduction indexes of the façades range from 36 to 45 dB, which is adequate for areas with noise levels of up to 75 dB. The environmental results indicate that 3D-printed façade manufacturing emits 30% more CO2e than a façade constructed using concrete blocks and 2% less than a masonry block wall. Overall, this study shows that, in addition to its multiple advantages in terms of the construction time, the studied 3D-printed house has similar acoustic, thermal and environmental traits to the most common construction typologies. However, it cannot be considered a sustainable construction method due to its high amount of cement.

1. Introduction

3D printing, also known as additive manufacturing (AM), has gained popularity over the last decade in various applications and domains, such as design, construction, medicine, architecture and mechanics [1]. This technology enables the modeling of physical objects by mold making and material shaping or depositing materials in layers based on a digital model with a mounted deposition head, frame, robot or crane [2,3]. The idea was first introduced in 1983 in the form of stereolithography by Charles Hull [4]. It was not until a decade later, in 1993, that 3D printing technology, as it is known today, was patented by Emanuel M. Sachs, John S. Haggerty, Paul A. Williams and Michael J. Cima [5].
Applying 3D printing to the building sector can bring several positive benefits to the industry. During the last decade, several research groups have started working on these ideas. In 2013, several studies on the application of AM to building construction started to be released [6,7]. The studies highlighted the endless possibilities that AM brings to the construction of façades. These two studies even described the wide range of possibilities that other materials, such as glass or even wood, could bring. In 2016, several research projects and studies continued to develop the technology, inspired by the idea of manufacturing complex forms at a lower cost without the difficult-to-form shuttering involved in construction [8]. Another study, in 2017, highlighted that using AM also means avoiding some of the risks related to construction works, as only a simple system of barriers is needed to prevent access during printing [9]. Additionally, 3D printing can be coupled with building information modeling (BIM) to acquire and monitor all the variables in a dynamic working environment [9]. The combination of AM and BIM facilitates the creation of highly customized buildings, allowing for both complex designs and sophisticated forms [10]. In addition to methodological improvements, in 2018, researchers introduced the idea of utilizing Lecce stone scraps combined with polylactic acid as a novel biocomposite for 3D printing applications [11].
In the same timeframe in which this research was being conducted, the industry was working on making those ideas a reality. Several 3D-printed house projects were carried out over the last decade. One remarkable example is the 3D printing of the Canal House in Amsterdam in 2014, which used a biobased thermoplastic developed by Henkel. In 2015, WinSun Decoration Design Engineering Co. printed a five-story building using a similar technique [8]. This project used a combination of industrial waste, fiberglass, cement and a hardening agent. Another significant example is the Mobile Europe Building, finished in 2016, which used a combination of 3D-printed bioplastic with a tensile fabric structure to create a sculptural façade [12]. In 2018, a 95 m2 social dwelling in France, designed and built by the University of Nantes in collaboration with the YHNOVA BatiPrint3D project (Nantes, France), was the world’s first 3D-printed house to be inhabited [13]. This innovative house is composed of two expansive foam layers and an inner concrete layer. In July 2021, a 160-square-meter single-family house was created in Germany [14]. This was Germany’s first 3D-printed house formed using concrete.
Examples such as those mentioned in the previous paragraph prove how quickly this technology has reached market maturity [15]. In general, i.e., not only in the building industry, AM technology has come a long way [16]. Nowadays, it is possible to 3D print virtually any construction element. A basic structure can be printed in 7–10 h, while finishing the house (building systems and envelope) requires an additional week. In 2022, it can be stated that, compared to conventional methods, in situ 3D printing reduces the building construction time, implying a reduction in the costs [17]. Its use can be especially adequate when the circumstances require a fast construction process in contexts such as war, massive refugee displacement, environmental emergency shelters and new areas that need to accommodate a rapidly growing population. However, 3D-printed houses must provide an acceptable level of performance that is at least comparable to that of conventional building practices. Disturbances during printing caused by changes in the material or a problem in the process might be detrimental to successful construction. They can influence the final result and the thermal and acoustic performance of the building [18].
Due to increasing environmental concerns in the building sector, the study of the ecological impacts of 3D-printed houses is also of great relevance. To successfully implement these kinds of technologies in the near future, 3D-printed houses must not have higher environmental impacts than conventional construction practices. The life cycle assessment methodology is the most common way of analyzing the environmental burdens of any human activity [19]. In the case of construction works and products, this methodology is described in the European Norm 15804 [20].
In July 2018, a startup called Be More 3D started constructing what later became the first 3D-printed house in Spain [21]. The house was printed on-site at the Polytechnic University of Valencia using an extra-large, micro-concrete 3D printer (7 m wide × 5 m high). Figure 1 shows the printing device and the results of the 3D printing. This paper is structured as a case study and discusses the characterization of the thermal transmittance and airborne acoustic insulation of the building, providing an analysis of the environmental impacts of its façade compared to two other conventional façade solutions. The main objective is to assess its performance from three complementary points of view, comparing the measured data and simulations and comparing the results with those of other conventional envelope typologies in compliance with international and national standards and norms. To our knowledge, the acoustic, thermal and environmental performance of a 3d-printed building in Spain and its adequacy with regard to local and international regulations had not been analyzed before this study.

2. Materials and Methods

As mentioned in the previous section, the methodology is structured as a case study. This section covers a description of the building, an analysis of the acoustic and thermal performance and a comparative life cycle assessment comparing the 3D-printed façade with two other conventional building envelope typologies.

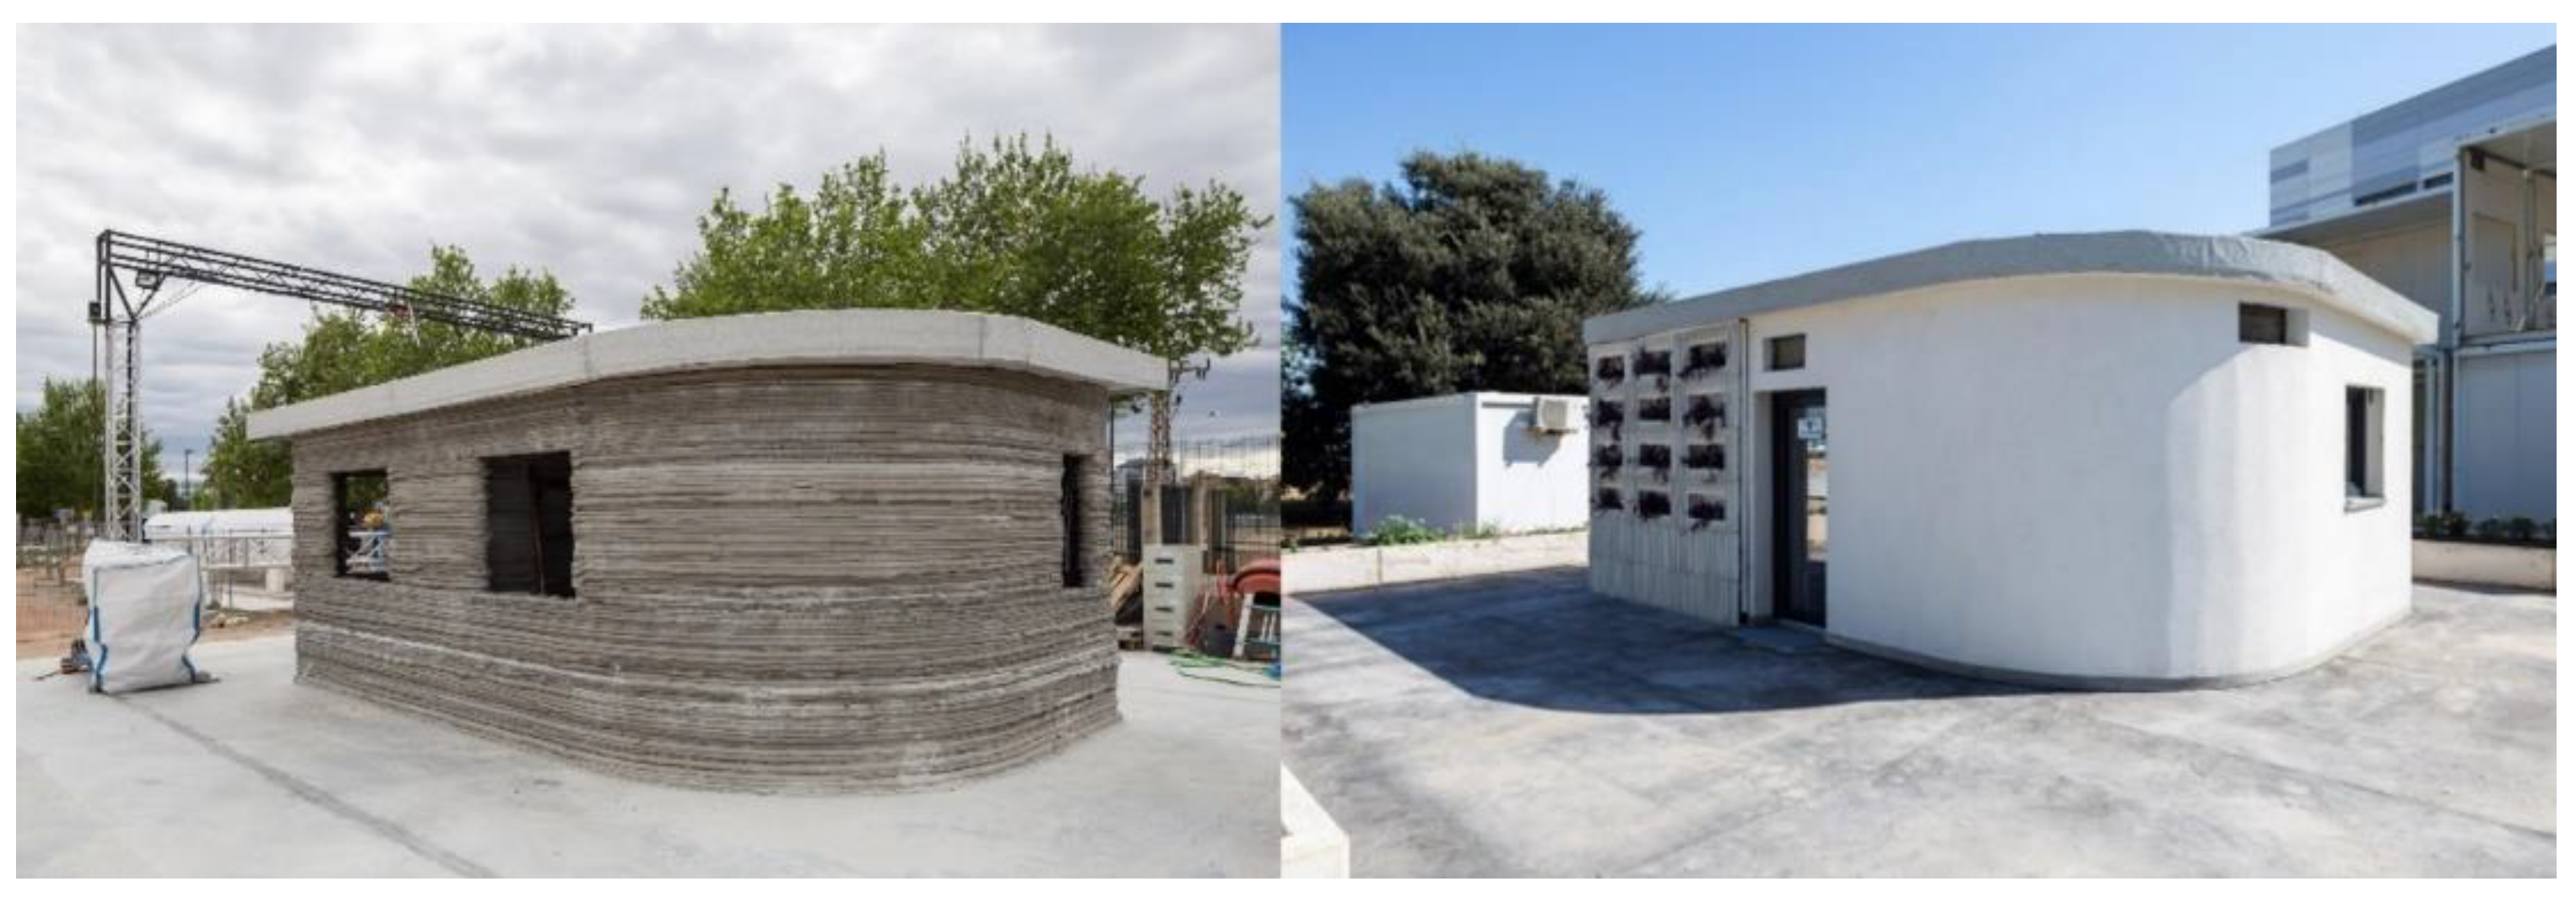
2.1. Building Description and Comparative Study

The plot on which the house was built has an area of 585 m2 and is located within a specific area for innovation projects (Hyperloop and Solar Decathlon) of the Vera Campus of the UPV. The occupied surface area is 196 m2, with a foundation slab of 100 m2 and a build surface (3D prototype) of approximately 23 m2. The internal distribution includes a living room (12.35 m2), a bedroom (7.36 m2) and a bathroom (3.16 m2). It has a surface area of 22.87 m2 and a volume of 64.03 m3. The main façade is on the western side, facing southwest of the Conservatory building (distance of approximately 30 m) and east of the School of Fine Arts building (distance of about 70 m). The building has a rectangular form with two oppositely curved façades on a single (ground) floor, as shown in Figure 2.
The 3D prototype was printed using a machine owned by 3D CONCRETE S.L. (València, Spain), with a self-developed and assembled mobile device for extruding micro-concrete, the material used for 3D printing [21]. After designing the printing model using 3D modeling software to connect all the surfaces correctly, the model is exported as an STL file. This file is the basis of the final G-code file that enables the printing of the layers according to the given coordinates, as explained by the company Be More 3D. For the construction of this 3D dwelling, first, a foundation slab is built. This foundation will also serve as a support plane for the machine itself. After dosing, mixing, and preparing the specific micro-concrete, the resulting material is used to print the envelope and the internal walls of the prototype. The 3D concrete is formed of a conglomerate of gray cement, fine aggregates, fibers and additives and meets the specifications for structural concrete that, in turn, meets the specifications of the Spanish act on structural concrete [22]. The micro-concrete proportions can be seen in Table 1. In Table 2, the most relevant characteristics of the 3D concrete are described. The rest of the layers of the façade, plasterboard, PUR and finishes are added manually after the additive manufacturing process.
A pump system provides the material directly to the hopper, located on the x-axis, where a motorized screw helps it to flow into the mouth of the extruder, producing the correct amount for each layer. A retraction of the extruder collects the possible excess of material from the mouth. The machine’s paths, the amount of material and the printing speed, among other variables, are controlled and recorded for later analysis to ensure that the printed prototype is built as efficiently and effectively as possible. The first layers can support the following ones, without deformations and cracks, as cracking armor is placed at 50 cm intervals to create a continuous structural ring, enhancing the final homogeneity of the façade. Variations are identified and taken into account in order to quickly adapt the process to changing weather conditions (wind and air humidity) or boosting times. Using this system, both the exterior walls and the internal partitions are constructed simultaneously, creating a set of concrete load-bearing walls. Windows and doors are designed as extrusion stops. Pre-frames for windows and doors, triple-pane windows with argon chambers and frames with thermal breaks and insulation in the gaps are utilized to achieve the best transmittance values. The roof is made of a slab with five layers (3 cm mortar, prefabricated panel, 12 cm embedded EPS in mortar and a bituminous sheet). At the same time, the façade has an external thermal insulation composite system (ETICS) with expanded polystyrene (EPS), as shown in the first cross-section of Figure 3. Other insulation materials may have been suitable [23,24]. Here, two façades with a similar acoustic and thermal performance, in which masonry blocks and concrete blocks replace the 3D-printed concrete, are also studied so as to compare the performance of the 3D-printed façade with the conventional options. These other two façade constructions are depicted in the middle and on the right-hand side of Figure 3.

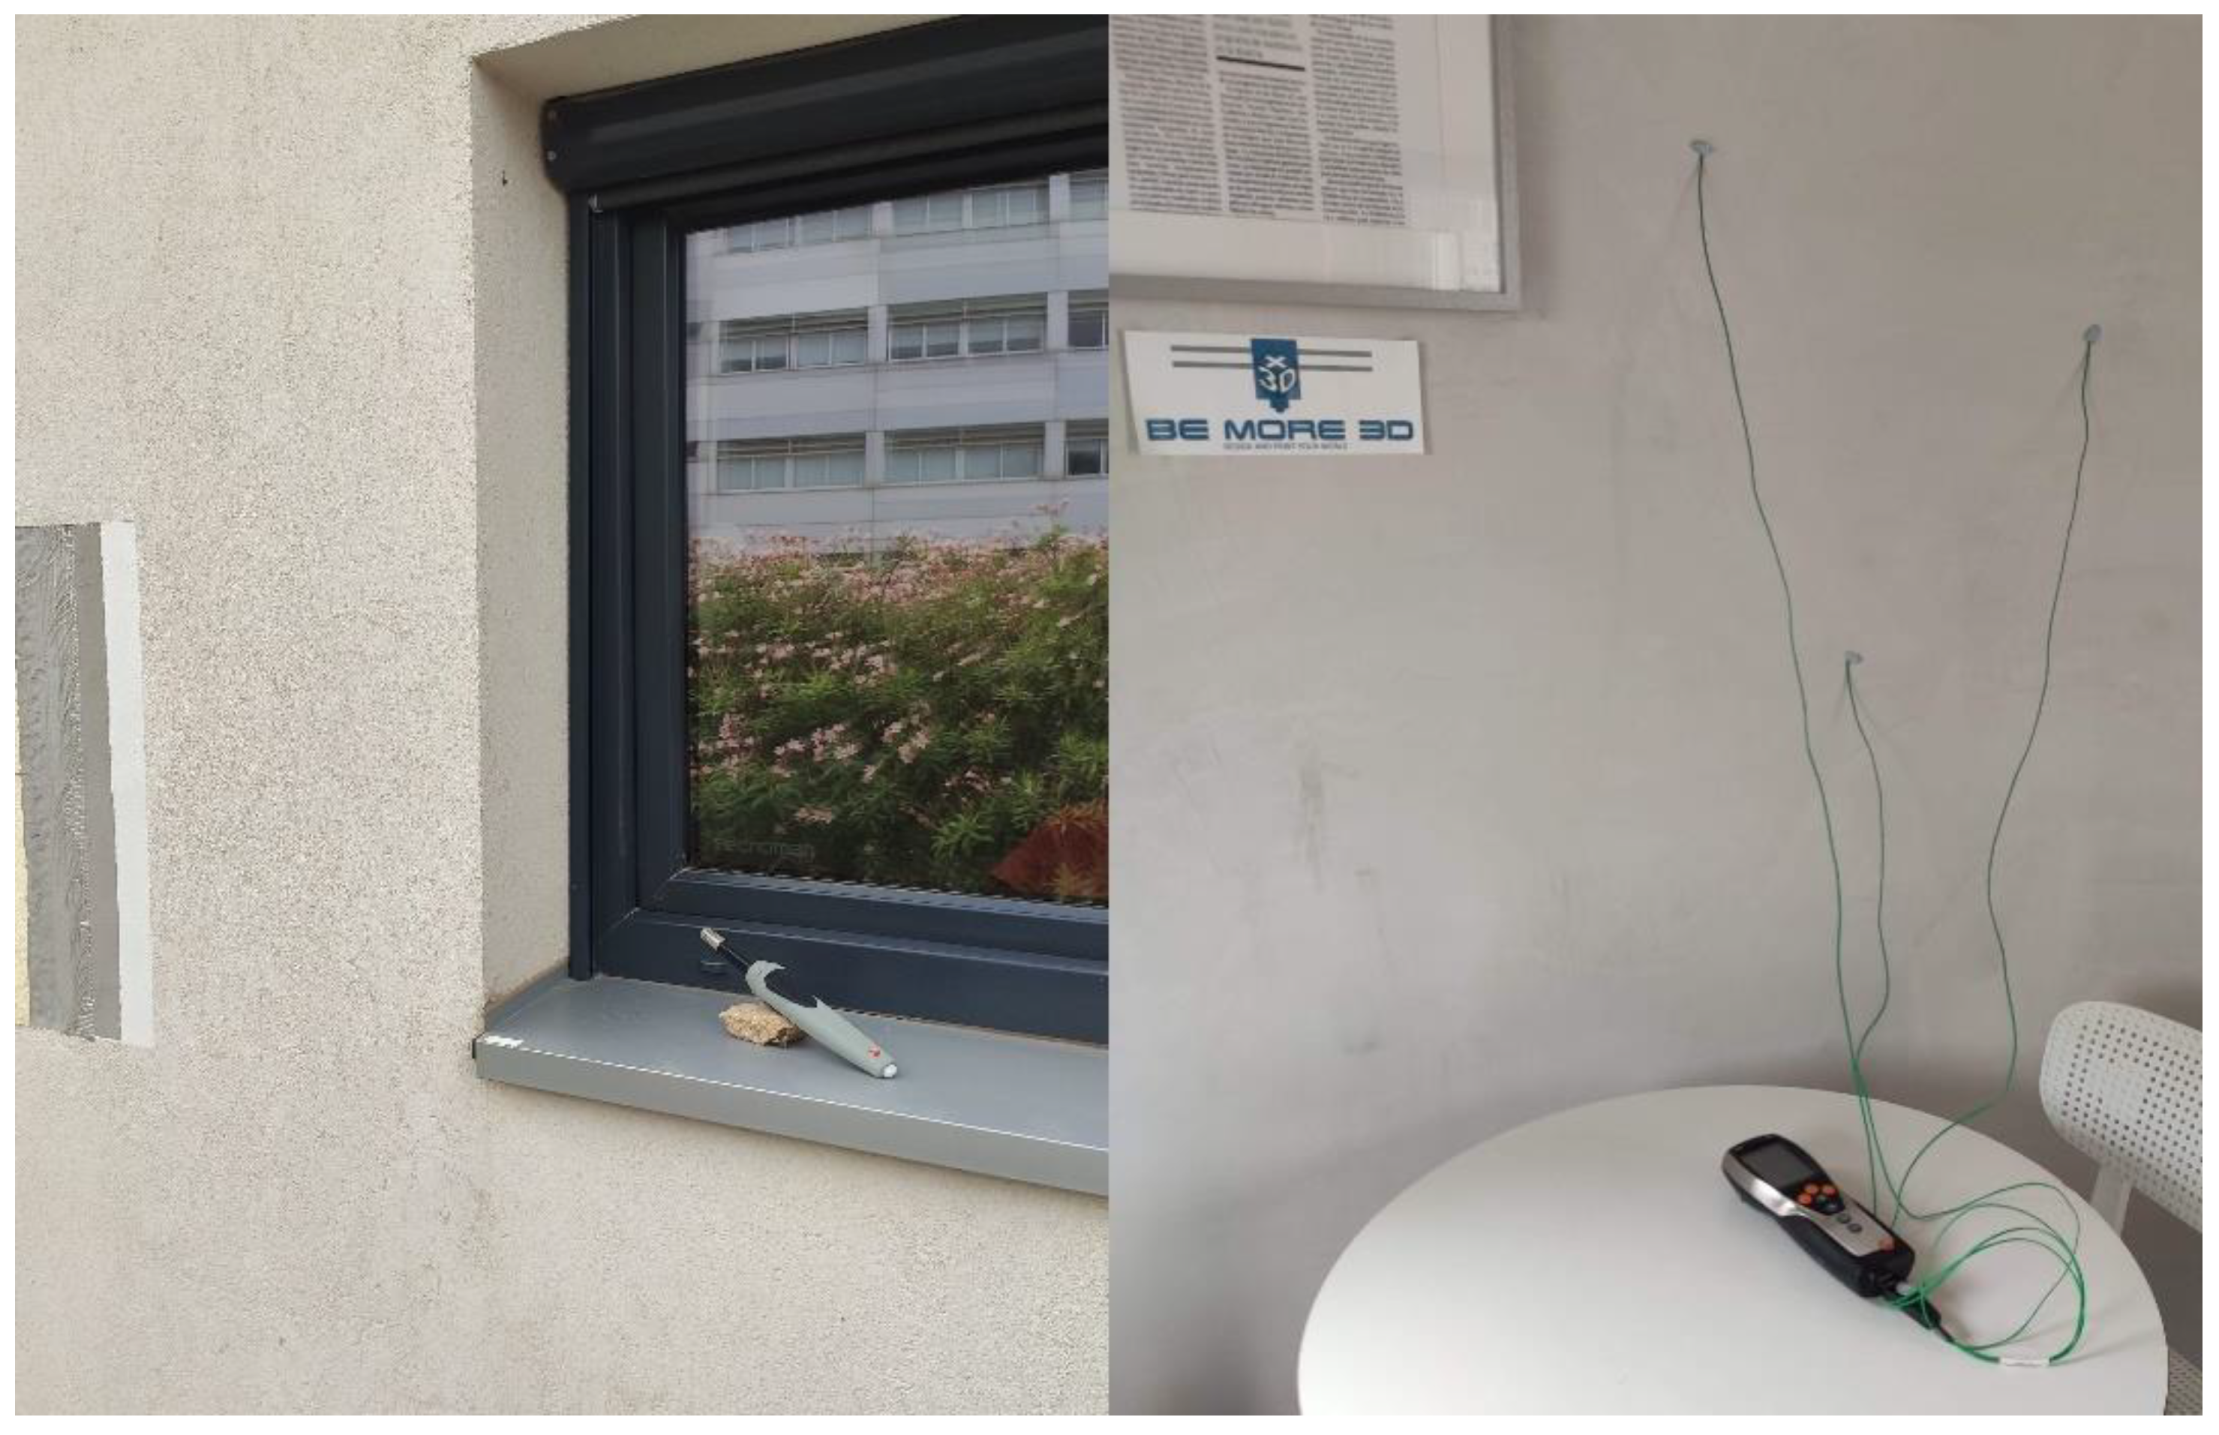
2.2. Thermal Behavior

The thermal transmittance and the thermal lag are analyzed as crucial metrics. The thermal transmittance U (Wm−2K−1) is a critical parameter of energy efficiency. It measures the effectiveness of a particular building envelope as a thermal insulator [25,26]. These metrics were used by researchers in the past to study the thermal inertia and possible retrofitting strategies of buildings [27,28]. The lower the value of the heat conductivity is, the better the thermal insulation of the envelope is. The U-value of construction is defined as the inverse of the summed thermal resistance (R) of each one of the layers it is composed of. The thermal resistance of a material depends on its thickness (e) and heat conductivity (λ), as indicated in ISO 6946 and the ISO 7345 [29,30]. The thermal transmittance is given as [31]:
U = 1 1 h i n t + i = 1 n e i λ i + 1 h e x t      
where λ i (Wm−1K−1) and e i (m) represent the thermal conductivity and the thickness, respectively, of layer i, and 1/hext and 1/hint (m2KW−1) represent the standard external and internal surface resistances, respectively, of the air layers connected with the envelope.
The thermal transmittance is obtained by dividing the average heat flux by the average temperature difference (between the inner and outer sides) over a continuous period. The accuracy of the measurements depends on factors such as the magnitude of the temperature difference (larger means more accurate), the weather conditions (cloudy is better than sunny), strong adhesion of the thermopiles to the test area, the duration of monitoring (a more extended period enables a more accurate average) and the number of test points, which enable a greater accuracy in order to mitigate anomalies. Other factors, such as the ambient temperature, latent heat and convection currents (increased convection contributes to the heat flow) can also affect thermal transmittance measurements. Table 3 presents the thermal properties and some characteristics of the different layers of the façade according to the Spanish Technical Building Code, specifically its section dedicated to energy efficiency (CTE DB-HE) [32], and the ISO 6946 standard [29].
A theoretical transmittance of the wall of 0.29 Wm−2K−1 was obtained using Equation (1). The values of 0.04 m2KW−1 and 0.13 m2KW−1 were used for the standard external and internal surface resistances of the air layers in contact with the building envelope. These values are defined in the Spanish Technical Building Code (CTE DB-HE).
While the basic U-value calculation is relatively simple but theoretical, post-construction measurements can also be undertaken using a heat flux meter under steady-state conditions, according to ISO 9869-1 [33]. The opaque layers should be perpendicular to the thermal flow, with no significant lateral component. Furthermore, measurements should be performed over a sufficiently long period due to the dependence of the results on the temperature and heat flux conditions [34]. The required observation time for reliable measurements depends on the thermal properties of the building components and the nature of the temperature differences between the surroundings on each side. If the environmental conditions are stable, the test should last for at least three days. Otherwise, the test should last for more than seven days, according to the previously mentioned standard. However, because the usual method does not consider the dynamic behavior of the wall, the test duration usually needs to be extended in order to obtain a better estimation [35]. The U-value can be calculated automatically by simultaneously measuring the indoor, outdoor and wall temperatures. To achieve this, a thermopile sensor, firmly fixed to the test area, monitors the heat flow from the inside to the outside. The more significant the difference between the inside and outside temperatures is, the more accurate the measurement result will be. For warm climates, this difference should be between 5 Kelvins and 15 Kelvins [36].
The thermal transmittance measurement positions are indicated in Figure 2. The thermal transmittances are measured directly using two Testo 635 devices (Testo SE & Co. KGaA, Germany). The devices are equipped with a transmittance probe to simultaneously obtain U-values and the relative humidity (RH), as well as the external (Text), wall (Twall) and internal (Tint) temperature data of the two façades (east and south). The device shows a wide measuring range from −40 °C to +150 °C, with an accuracy of ±0.2 °C and a resolution of 0.1 °C. The measurements were conducted from 11 December to 18 December 2021 on cloudy days. Figure 4 shows the thermal transmittance measurement process.
The thermal lag describes the time difference between the maximum outdoor temperature and the maximum indoor heat flow. It is a measure of the dynamic behavior of the building envelope. The thermal lag of the 3D-printed façade was calculated following the methodology described in ISO 13786 [37]. According to the aforementioned standard, the dynamic thermal behavior of a wall is defined by the temperature in zone n (2), the heat flow (2) and the heat transfer matrix (3):
θ n ( t ) = θ ¯ n + | θ ^ n | × cos ( ω × t + ψ ) = θ ¯ n + 1 2 × [ θ ^ + n × e j ω t + θ ^ n × e j ω t ]
Φ n ( t ) = Φ ¯ n + | Φ ^ n | × cos ( ω × t + ψ ) = Φ ¯ n + 1 2 × [ Φ ^ + n × e j ω t + Φ ^ n × e j ω t ]
Z = ( Z 11 Z 12 Z 21 Z 22 )   a n d   ( θ ^ 2 q ^ 2 ) = Z × ( θ ^ 1 q ^ 2 )
where θ ¯ n and Φ ¯ n are the average values of the temperature and heat flow, | θ ^ n | and | Φ ^ n | are the amplitudes of the temperature and heat flow variations, and θ ^ + n and Φ ^ + n are complex amplitudes. The formulas were imported into a spreadsheet to obtain the results.

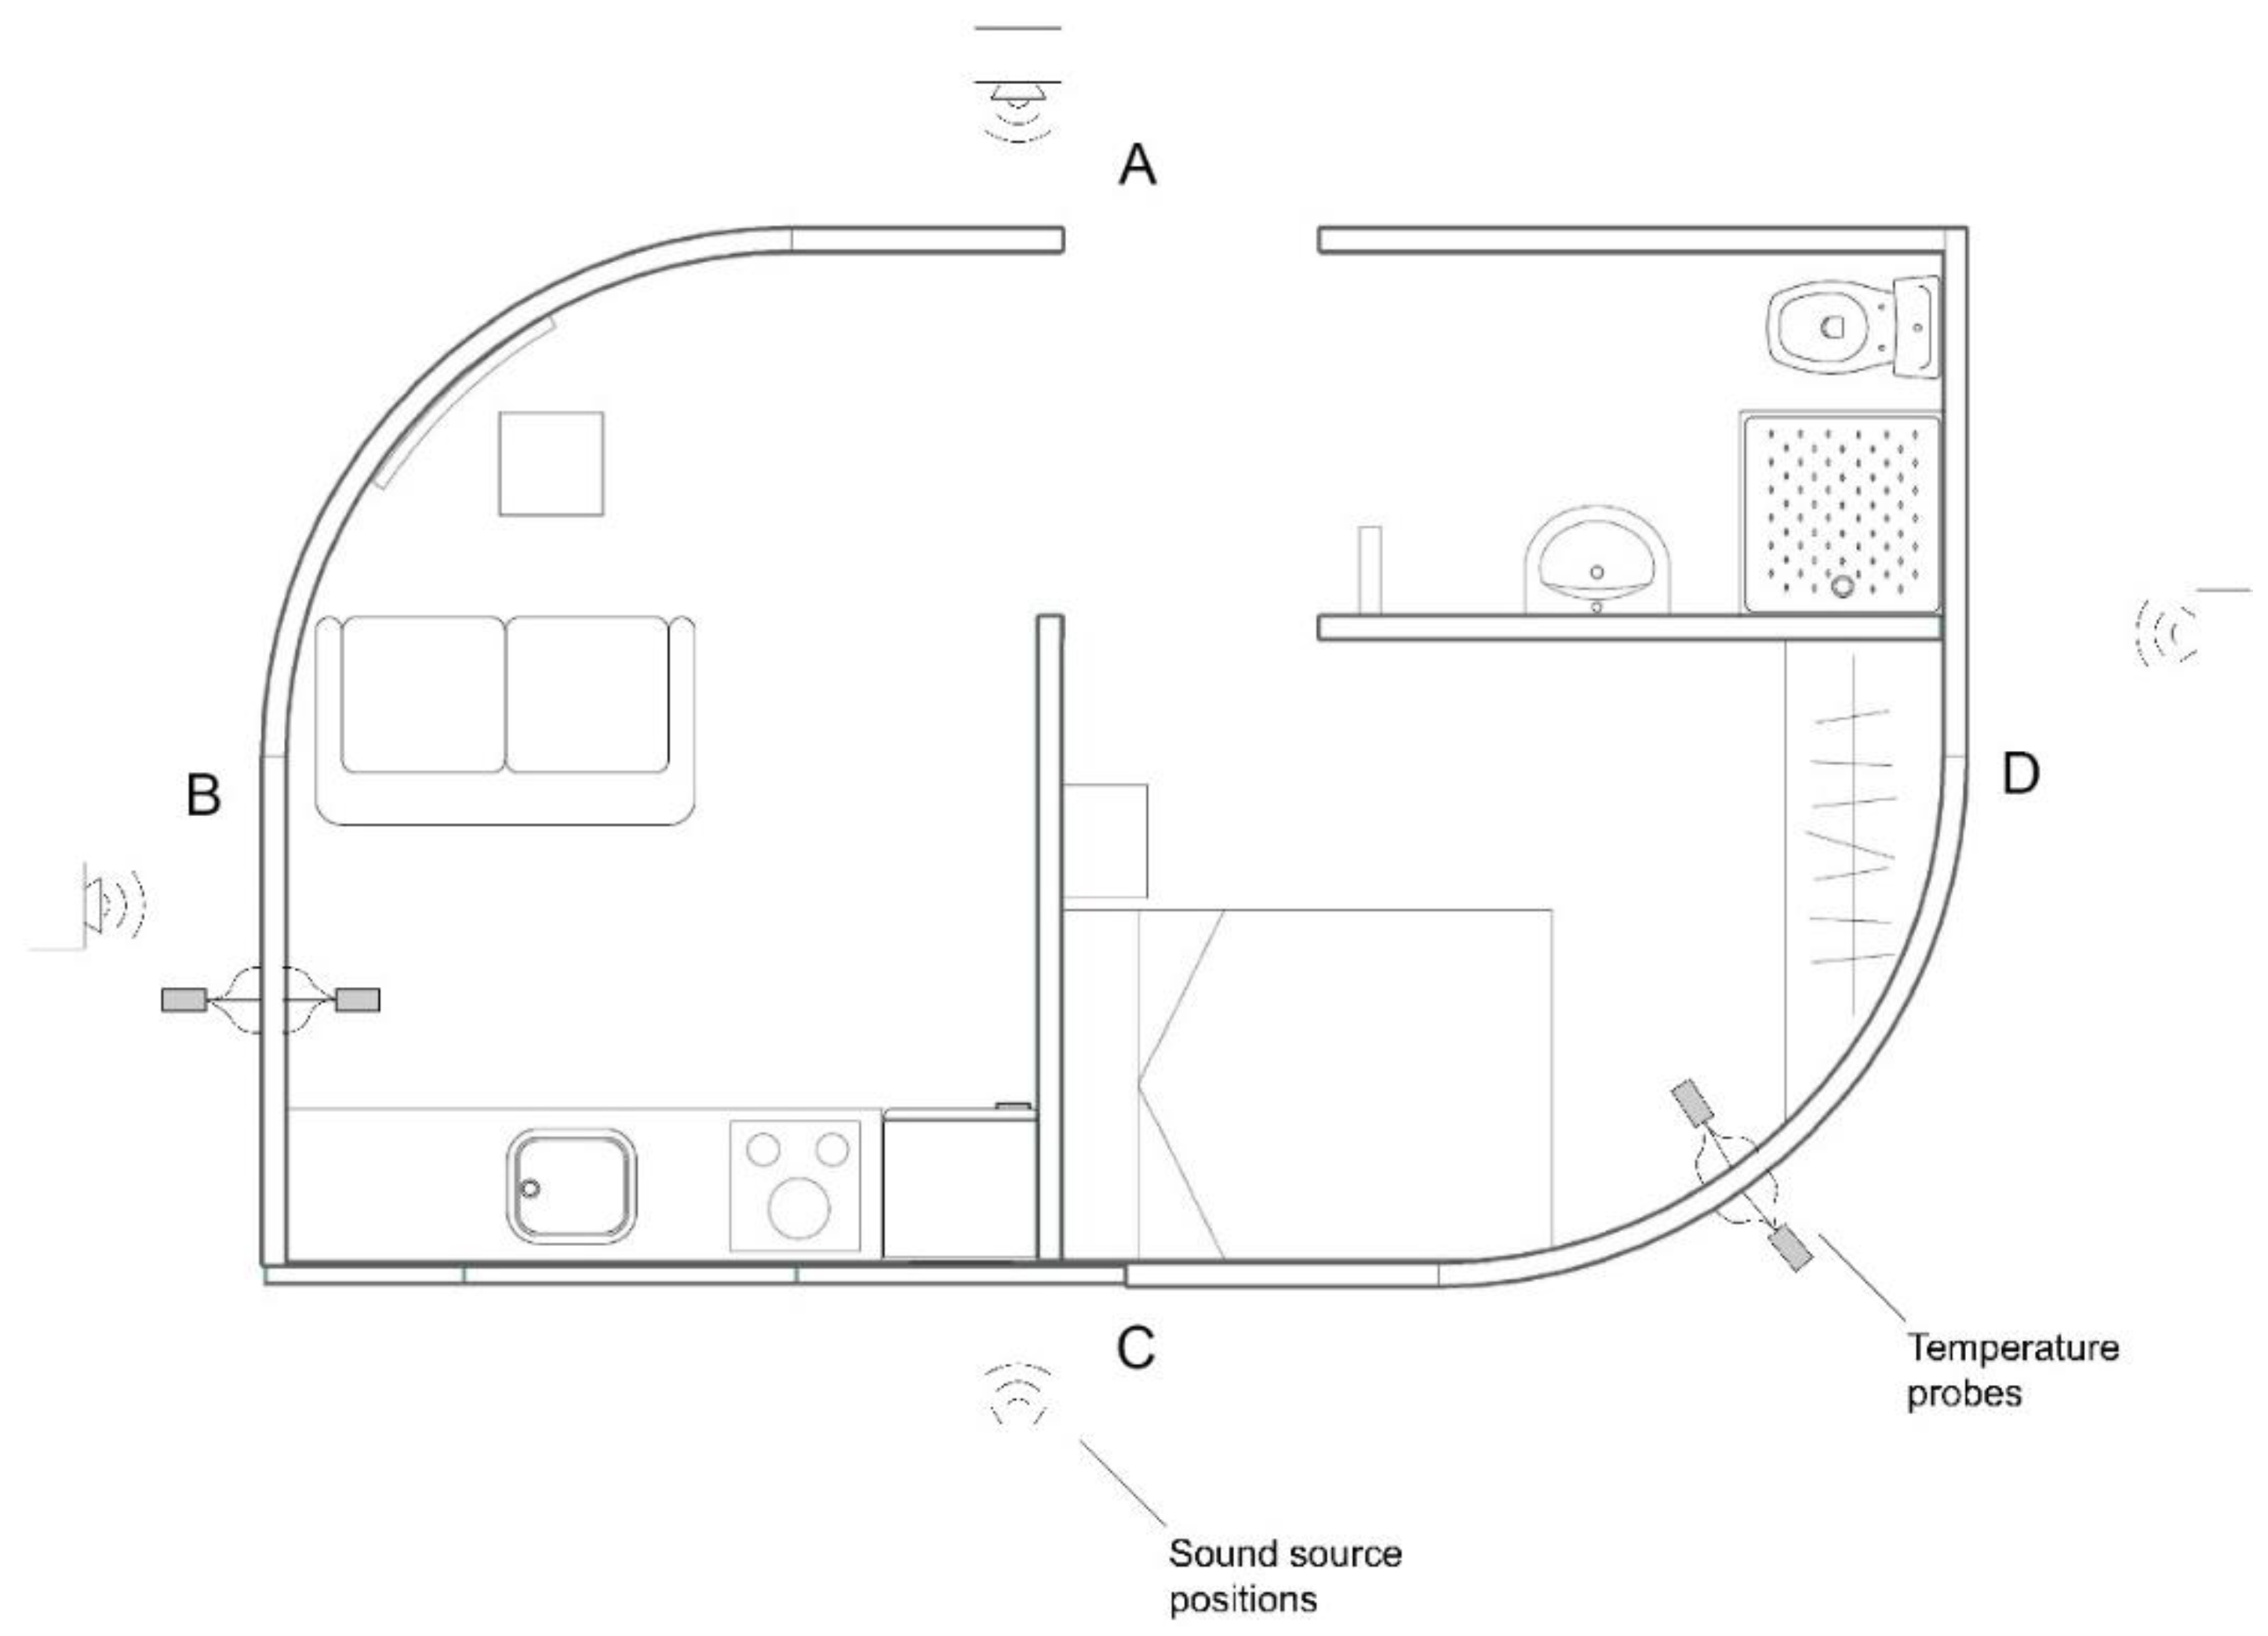
2.3. Airborne Acoustic Insulation

The airborne acoustic performance is measured using the sound reduction index (SRI). The SRI quantifies the reduction in the sound intensity when it passes through part of a building. It is the difference, expressed in decibels, between the sound levels in both parts of the building component. The SRI can be measured in both laboratory and on-site constructions. Due to the conditions of the case study, on-site measurements were performed according to standard ISO-140-5: 1999. Similar measurements were performed in 2004 in the acoustic performance evaluation for non-conventional solutions in Portugal [38]. A similar procedure was also carried out by researchers in 2016 [39]. According to the document on protection against noise of the Spanish Technical Building Code (CTE DB-HR), the weighted normalized airborne sound insulation index for façades, measured from a distance of 2 m (D2m,n W), should be greater than 30 dB for quiet urban zones (Ld up to 60 dB) and up to D2m,n W greater than 42 dB for urban zones, with the Ld ranging between 70 dB and 75 dB. Similar to other European standards, the Spanish Technical Building Code defines a corrective uncertainty index of 3 dB for the in situ measurements [40].
The locations for the SRI measurements are indicated in Figure 2. The process was conducted following the guidelines of the ISO 16283-3: 2016 (Part 3, regarding the façade sound insulation) and the CTE DB-HR (2019) standards. We used Brüel & Kjær (Nærum, Denmark) sound and vibration measurement equipment, including an omnidirectional sound source (type 4295) which can deliver a maximum sound power of 122 dB and 1 pW (100–3150 Hz), powered by a power amplifier (type 2716). The measurement data were collected using a 2260 Investigator™ acoustic analyzer with Building Acoustics software. The analyzer provides the measurement capabilities for measuring the sound pressure level (SPL) outside and inside, the background level noise in the receiving room and the reverberation time of the room. The resolution is 0.1 dB for the SPL and 0.001 s for the reverberation time measurements. The SRI testing was conducted on 25 March 2022. Figure 5 depicts the measurement process.
The sound reduction index (Rw) was assessed using the following expression:
R w = L 1 L 2 + 10 log S A
where L1 and L2 are the sound pressure level in the emitting and receiving rooms, respectively, in dB, S the surface area of the sample wall and A the acoustic absorption equivalent area in the receiving room.

2.4. Life Cycle Assessment Methodology

A comparative life cycle assessment (LCA) of three façades was performed following the guidelines of ISO 14040 and the EN 15804 [41], [20]. LCA is the most common methodology used for assessing the environmental impacts of construction materials [42]. The objective of this section is to compare the environmental impacts generated by the 3D-printed façade to those of the conventional constructions. The LCA is conducted in a cradle-to-gate process. According to EN 15804, the stages accounted for are A1 to A5. The calculation method employed for the study is the environmental footprint methodology (version 3). The Joint Research Centre of the European Commission developed this methodology and recommends its use in LCA studies conducted in the European Union [43]. The EF methodology calculates the results using 18 different impact categories. The results express impacts such as the climate change potential or eutrophication and acidification. As a way of comparing the different impact categories, the method provides a normalization method that consists of multiplying each value by a characterization factor. This normalization process has the objective of expressing the relative impact of each impact category in terms of its contributions to the total environmental impact. The final step is the weighting, in which the normalized results are multiplied by a set of weighting factors that represent the perceived relative importance of the impact categories under consideration. This process allows the results to be compared between categories and summed to obtain a single score [44]. Extensive documentation on the method, including its normalization and weighting process, was developed at the Joint Research Centre [45]. The functional unit in an LCA is the measuring unit used as a reference for the study. The correct choice of the functional unit enables the comparison between similar products or activities. In this case, the functional unit is 1 m2 of the façade wall. The use of surface units is adequate for LCA studies on building envelopes. The LCI of this study was modeled using the software Simapro 9.3, a well-known tool for LCA studies. The data on the 3D-printed concrete were acquired directly from the manufacturing company. The rest of the data were acquired from the Ecoinvent database V3.8, the most comprehensive database for environmental studies [46].

3. Results and Discussion

This section presents the results of the performed measurements and simulations. It identifies the main critical and interesting tendencies or divergences supported by current national and international legislation and standards.

3.1. Thermal Results

From a series of 4862 data regarding the external, wall and internal temperature (Text, Twall, Tint), relative humidity (RH) and calculated U-values, after applying an initial statistical check and the constraint of the temperature (temperature gap >10 °C) to ensure valid measures, 423 values (approximately 8.6%) were used [36]. An average value between the indications of the norm ISO 9869-1: 2015, the thermal insulation for the in situ measurement of the thermal resistance (heat flow meter method) [33] and the recommendations for a warm climate of a 10 K temperature gap were used [36].
The average U-values of the measured and filtered subset are USouth = 0.241 Wm−2K−1 for the south façade and UEast = 0.237 Wm−2K−1 for the east façade. Figure 6 shows the evolution of Text, Twall and Tint for the east façade on three representative measurement days. An almost linear behavior is observed for the internal and wall temperature (approximately 16 °C), while the external one shows peaks corresponding to a daytime exposure of up to 35 °C. The on-site measured U-values fulfill the Passive House Standard (PPHH) and the nZEB requirements, as well as the Spanish Technical Building Code (CTE DB-HE) for zone B2 and many other European locations [47]. The theoretical model was already applied in Section 3, with a resulting value of Uth = 0.29 Wm−2K−1. The main reason for this deviation is that the composition, density and viscosity of the used printing material (micro-concrete) are not fully known. The performed statistical check shows that both measured values, along with their uncertainties (standard deviation), are quite close to the theoretical U-value (continuous line) and are in the range of ±20% (dotted line), as indicated in Figure 7.
The thermal lag between the maximum of Text and Tint, and the delay time between Text and Twall, were also determined in order to complete the analysis of the thermal behavior. These calculations account for the thermal inertia and the dynamic performance of the façades. Figure 8 illustrates the results of the theoretical model, applied to the façade according to ISO 13786. The maximum thermal lag between the outdoor temperature and maximum inner thermal flux is 7.78 h (or 7 h:47′) for 24 h. For the case study, both thermal lags are equivalent for each façade, despite differences in other parameters (e.g., orientation). Figure 9 shows the evolution of the measured time lag for the east façade. For the east façade, the average value of the time lag between Text and Tint is 498 min (8 h:18′), and the average value of the time lag between Text and Twall is 508 min (8 h:28′), as shown in Figure 9. There is a good correspondence with the theoretical lag of 7 h:47′. A good linear correspondence is also observed, with an R2 factor of 0.945. The maximum external temperature is always reached between 1 PM and 2 PM.
For the south façade, the values are quite different due to the radiant behavior of the sitting room windows, which interferes with the measurements. The values drop to 277 min (4 h:37′) for the time lag between Text-Twall and to 220 min (3 h:40′) for the time lag between Text-Tint, respectively.
In the case of this façade, the maximum values of Text are reached later, between 6:30 p.m. and 9:00 p.m. In this case, we can observe sprouted data with a low correspondence factor of R2 = 0.535.
Table 4 summarizes the comparative thermodynamic results obtained for each of the three façades studied. The three of them perform similarly in terms of the U-value and the thermal lag.

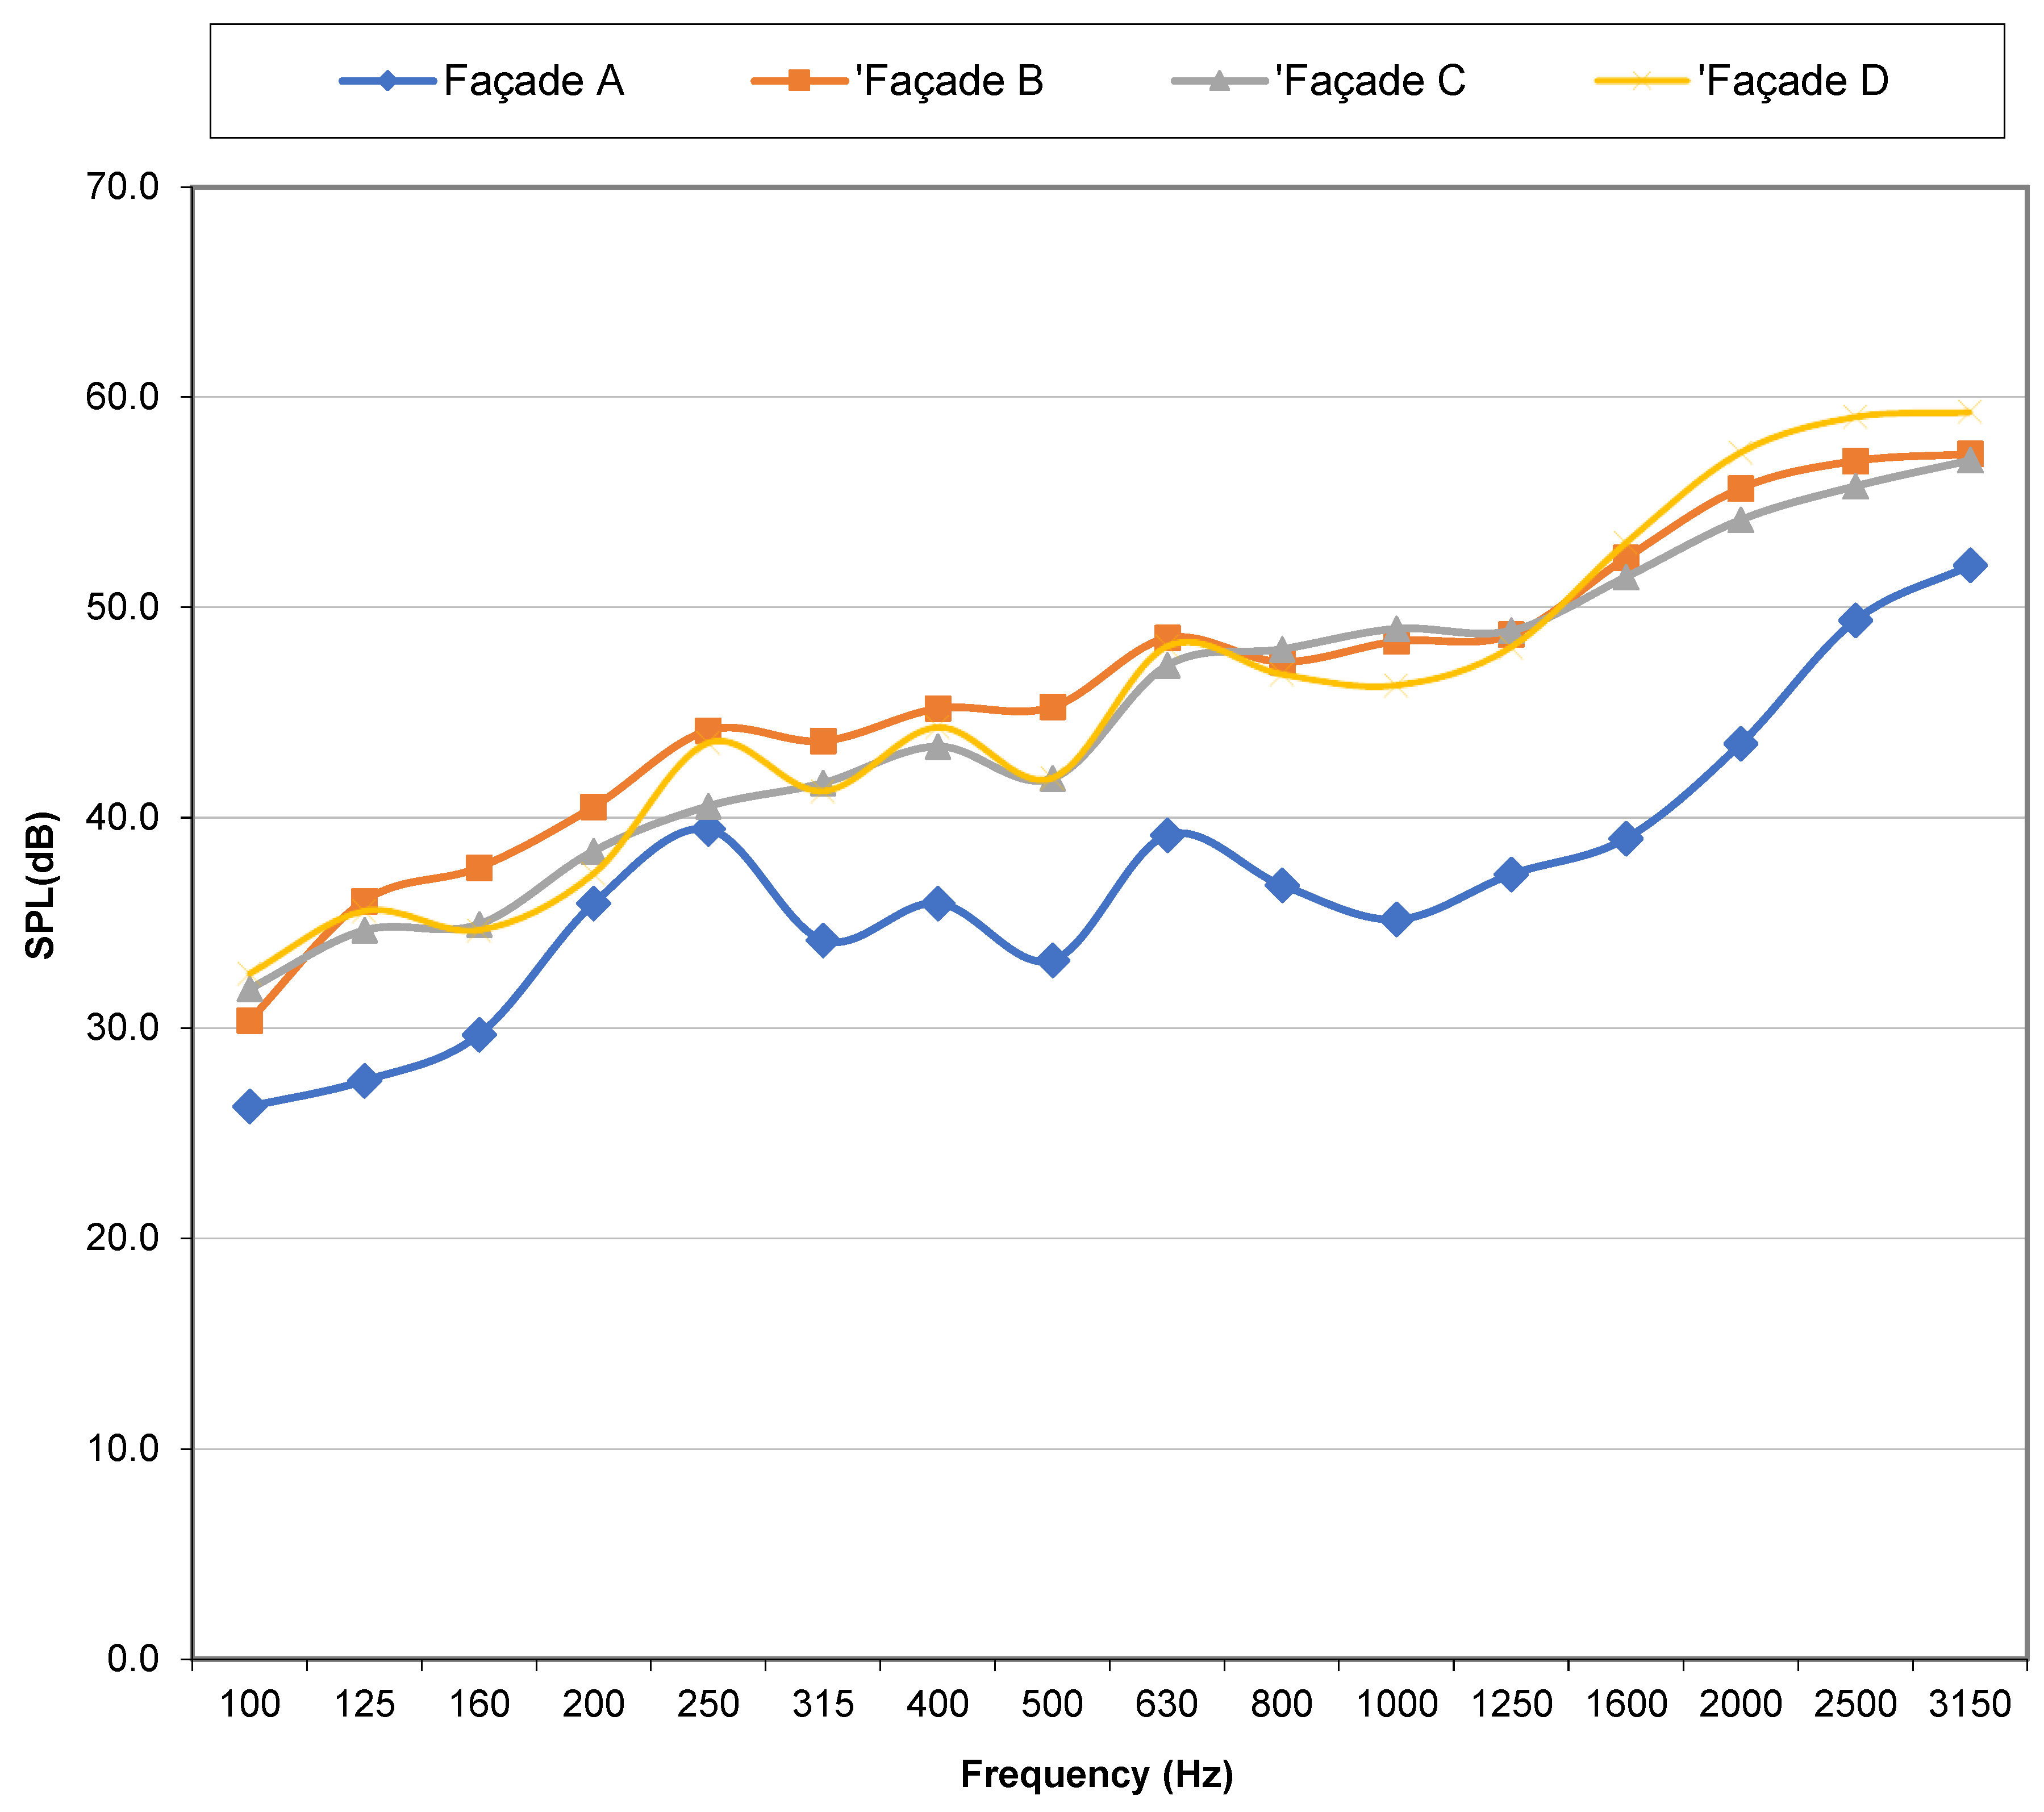
3.2. Acoustic Results
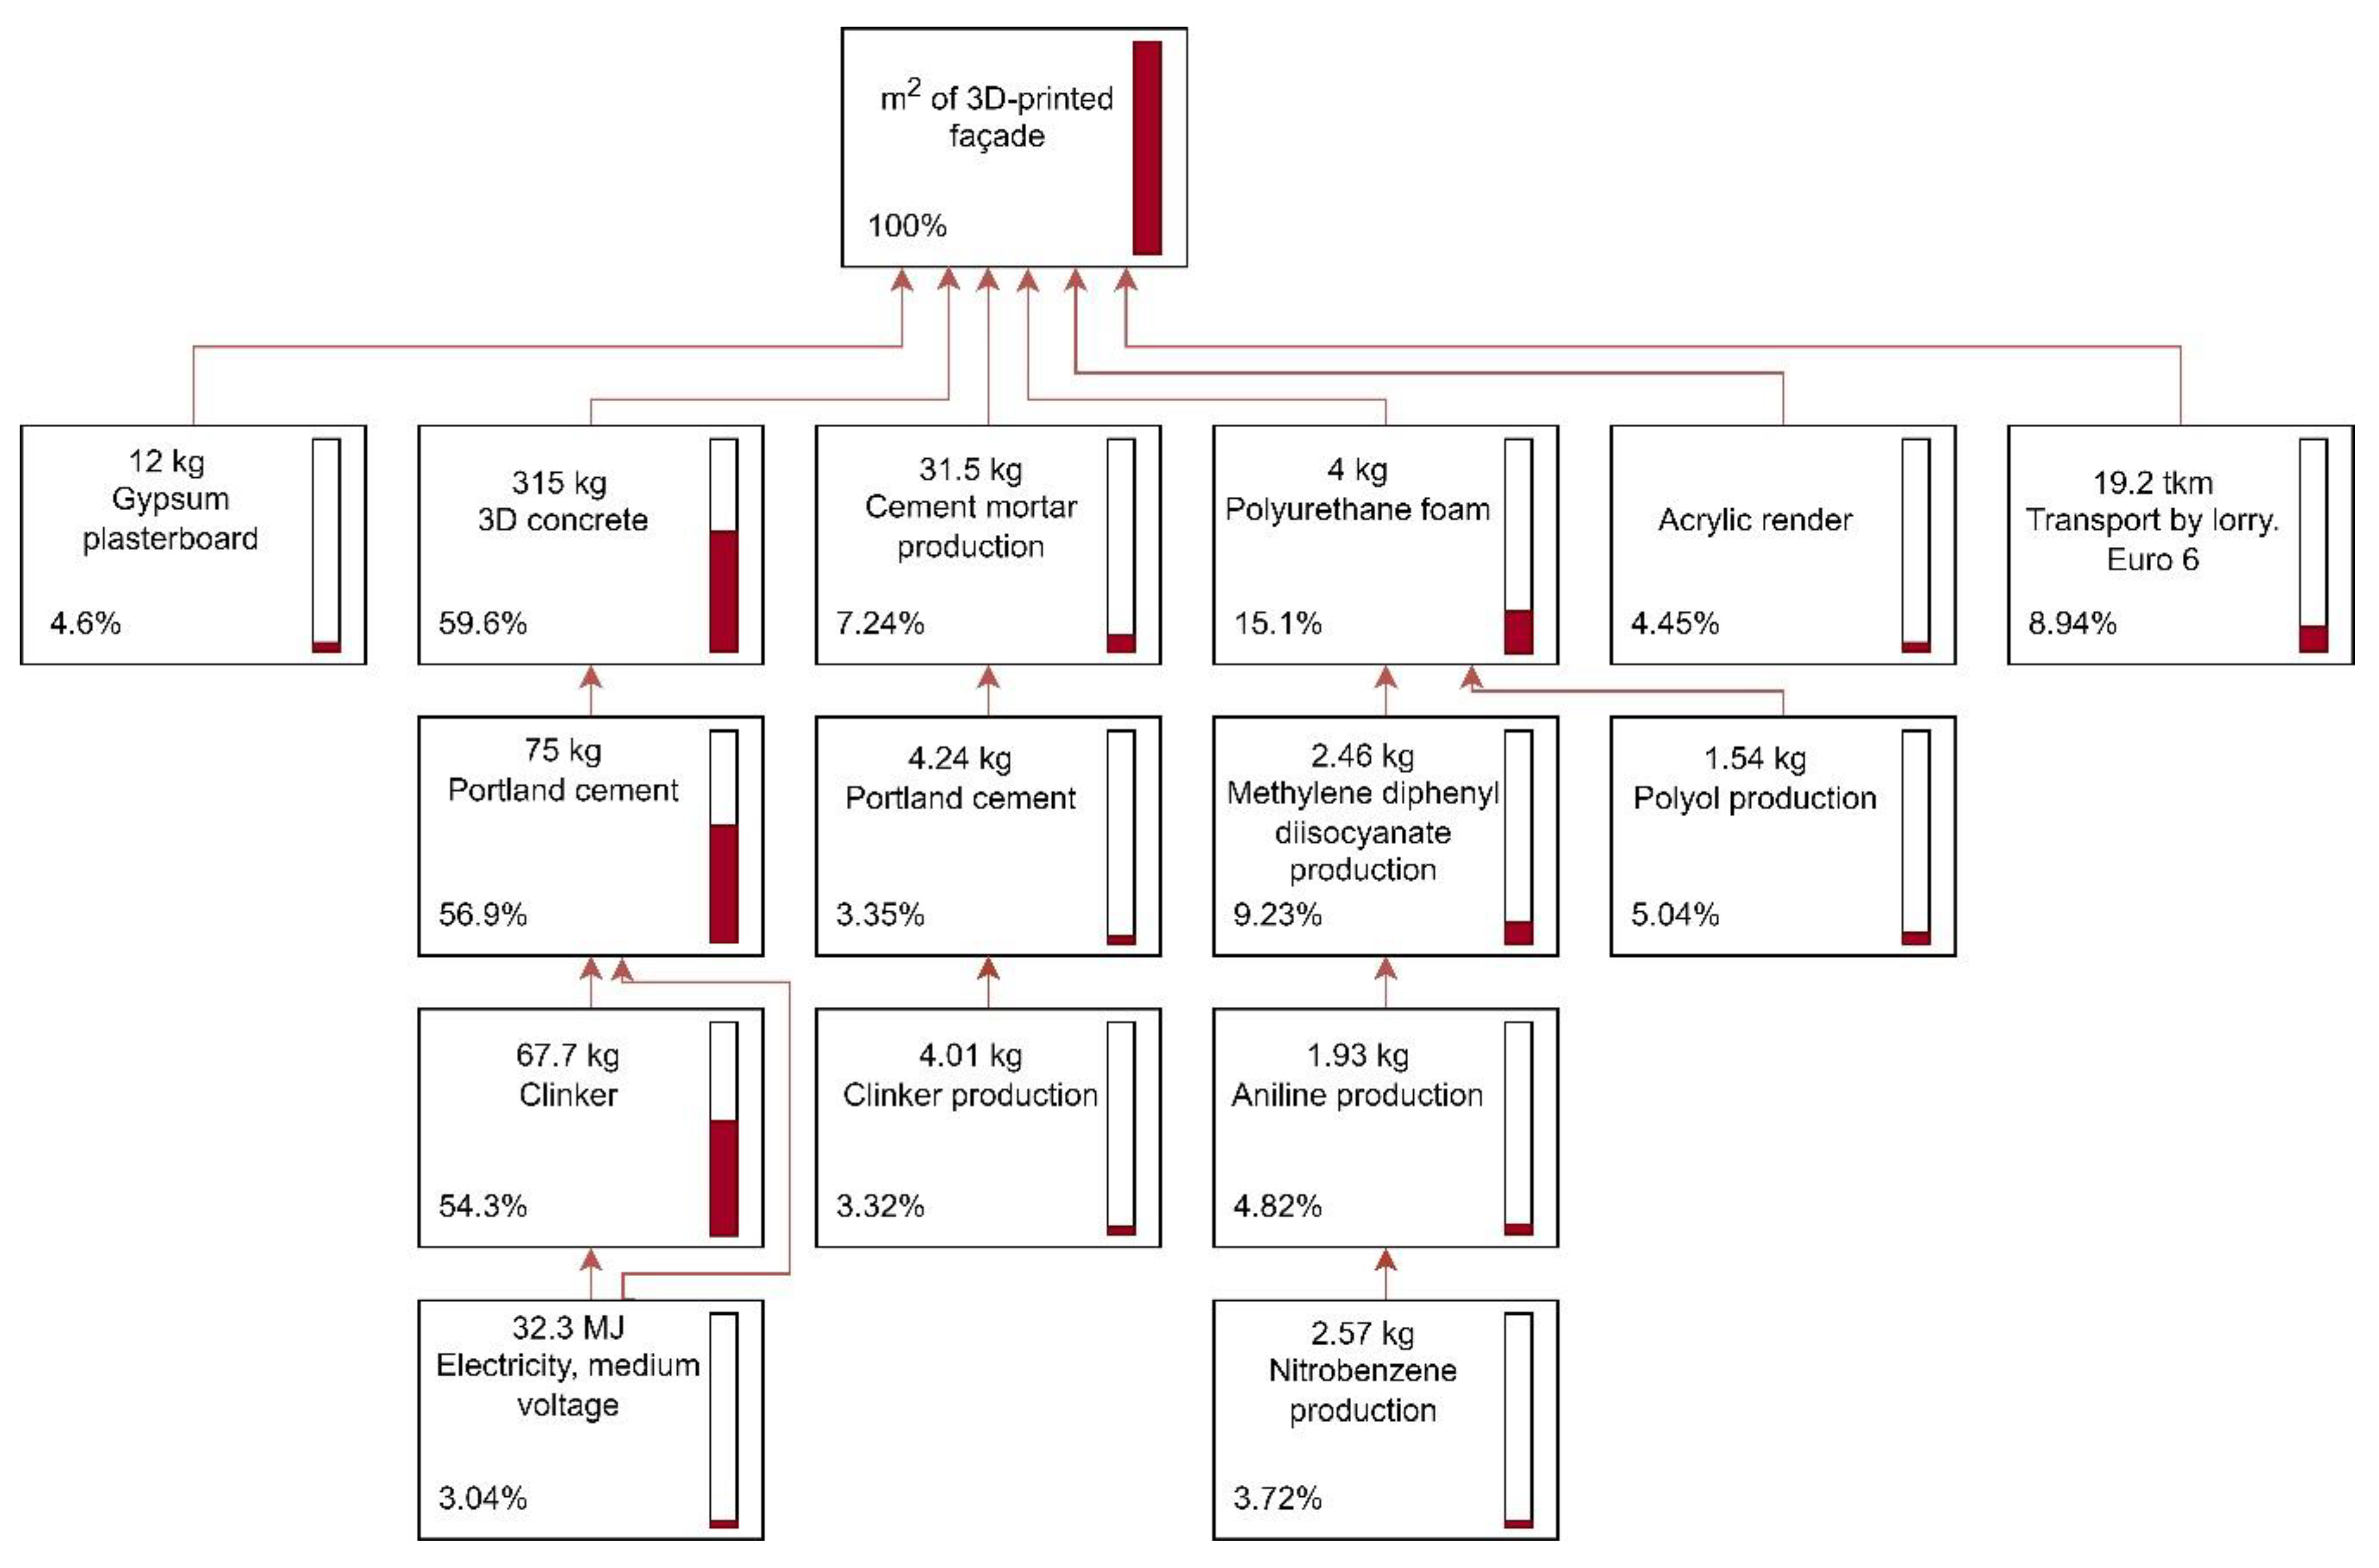
The airborne acoustic insulation of the four façades of the printed house was measured in the locations shown in Figure 2. Figure 10 shows the results of the standard SRI for the four façades using a frequency range from 100 Hz to 3150 Hz [48]. The SRI difference between façade A, corresponding with the main entrance door, and the others originates from the door effect. The lack of sufficient airtightness reduces the acoustic insulation in the case of medium and high frequencies.
The global SRI results in Table 5 exemplify these differences, with a gap of up to 9 dB between the values for the entrance façade compared with the others, according to the international standard ISO-717-1: 2013 [49].
The global value Dn,Tw (C,Ctr) represents the value of a reference curve in dB at 500 Hz adjusted to the experimental value. The terms (C,Ctr) are spectral adaptation terms, with C standing for pink noise and Ctr for traffic noise.
According to the Spanish Technical Building Code CTE DB-HR (2019), it is mandatory during the design phase of all building projects to perform acoustic simulations assessing the acoustic insulation of all façades and indoor partitions [50]. The model accepted for the standard is described in ISO Standard EN 12354 based on statistical energy analysis (Craik, 1996). For our case study, the results obtained for the different façades by applying the theoretical models and their comparison with the in situ results are displayed in Table 6.
The differences between the in situ results and the project simulations are noticeable, being under 2 dB. The accuracy of the model’s results depends on the given precision of the construction performance input data. Based on these results, according to current Spanish regulations, the house is suitable for construction in an urban zone with an equivalent daily exterior sound level (Ld) of up to 75 dB.

3.3. LCA Results

This section environmentally compares 1 m2 of the 3D-printed envelope and the two other constructive solutions. Figure 11, Figure 12 and Figure 13 depict the percentual contributions of the primary materials and production steps to the climate change potential. As shown in Figure 11, cement production is the most impactful step in the case of the 3D-printed façade. These emissions are mainly due to the impact of clinker manufacturing, which is needed to produce cement. This is also true for the concrete block façade (Figure 12), where most carbon emissions come from the concrete blocks and the cement used for the cement render and the joints between the blocks.
Figure 13 shows that almost 50% of the carbon emissions of the masonry block façade are generated during the production process of the masonry blocks, mainly during the drying and firing processes. The polyurethane foam production is also a great contributor to the emissions of all three façades, ranging from 14.9% in the case of the masonry block façade to 21.9% in the case of the concrete block façade.
Table 7 shows the environmental impact results obtained using the environmental footprint methodology for 1 m2 of the façade. The results obtained for almost every category show that the concrete block façade has lower environmental impacts than the 3D-printed and the masonry block façades. This holds true in the case of the climate change potential, where the CO2 emissions of the 3D-printed façade and the masonry block façade are considerably higher. It is important to note that, in the case of the 3D-printed façade, the higher concrete mass is the cause of the higher carbon emissions. Future research could explore the possibility of lightening the concrete. Figure 12 and Figure 13 show the normalized and weighted results. The results are presented in the form of radar graphs, in which each radial line represents a different impact category. These graphs show the score results in dimensionless units (Pt and mPt). The concentric circles indicate the increases and decreases in the impact score. These results are intended to offer a simplified view of the relative contribution of each impact category to the total environmental footprint. In Figure 14, the normalized results reveal the high impacts related to the ecotoxicity of freshwater and resources used for energy and raw material extraction in the case of all three façades, especially in the case of the masonry block façade. After weighting the normalized results, the climate change potential gains importance as the most impactful category, followed by resource use (Figure 15). The weighted results can be summed to obtain a single-score result so as to offer a comparison of the overall environmental footprint between the three façades. The masonry block façade has the highest environmental footprint single-score result (11.55 mPt). The single score of the 3D-printed façade is 9.84 mPt, 7% higher than that of the concrete block façade (9.16 mPt). The overall lower environmental impact of the concrete block façade could be explained by the smaller amount of concrete needed to manufacture the concrete blocks.

4. Conclusions and Outlook

This study analyzed some critical parameters regarding the acoustic insulation, thermal transmittance and environmental footprint of the first 3D-printed house in Spain. The primary purpose was to evaluate the possibilities of using additive manufacturing as a replacement for conventional masonry or concrete block constructions in the Spanish context, especially when time is an essential factor in the construction process. After conducting the study, several conclusions were drawn. The conclusions are divided into four categories: the thermal performance, acoustic performance, environmental impacts and the summary and future development.
Thermal performance:
  • The 3D-printed façade shows excellent thermal insulation abilities. The measured thermal transmittance ranges from 0.241 Wm−2K−1 in the south façade to 0.237 Wm−2K−1 in the east façade.
  • This thermal transmittance is adequate for any Spanish climate zone described in the Spanish Technical Building Code. However, it is not adequate for some countries in Europe, such as Germany, where thermal insulation needs to be lower than 0.2 W/m2K. It complies with the regulations in countries such as Slovenia (0.28 W/m2K) and Italy, in some of their climate zones (0.29 W/m2K in zone D) [51,52].
  • The dynamic behavior of the façade is adequate for the needs of the Spanish climate, with a thermal lag of 7 h and 47 min. There is also a favorable correspondence between the calculated and estimated time lags of the east façade. In the case of the south façade, the higher percentage of the transparent area interferes with the critical radiation effect.
  • Acoustic performance:
  • The airborne acoustic insulation of the building envelope meets the Spanish Technical Building Code (CTE) requirements. The in situ measurements of the sound reduction index reached up to 45 dB.
  • This result is adequate for areas with a noise level of up to 75 dB. The sound reduction indexes (SRI) of the four façades were measured and compared to the theoretical model results.
  • The comparison of both the theoretical and measured values of the transmittance and standard SRI shows a good level of concordance. The results show a maximum difference of 2 dB, with an uncertainty index of 3 dB. The acoustic behavior of the entrance door influenced the results for façade A, which explains the difference of 8 dB compared to the others.
  • Environmental impacts:
  • The environmental impacts of the 3D-printed façade are comparable to those of conventional constructions.
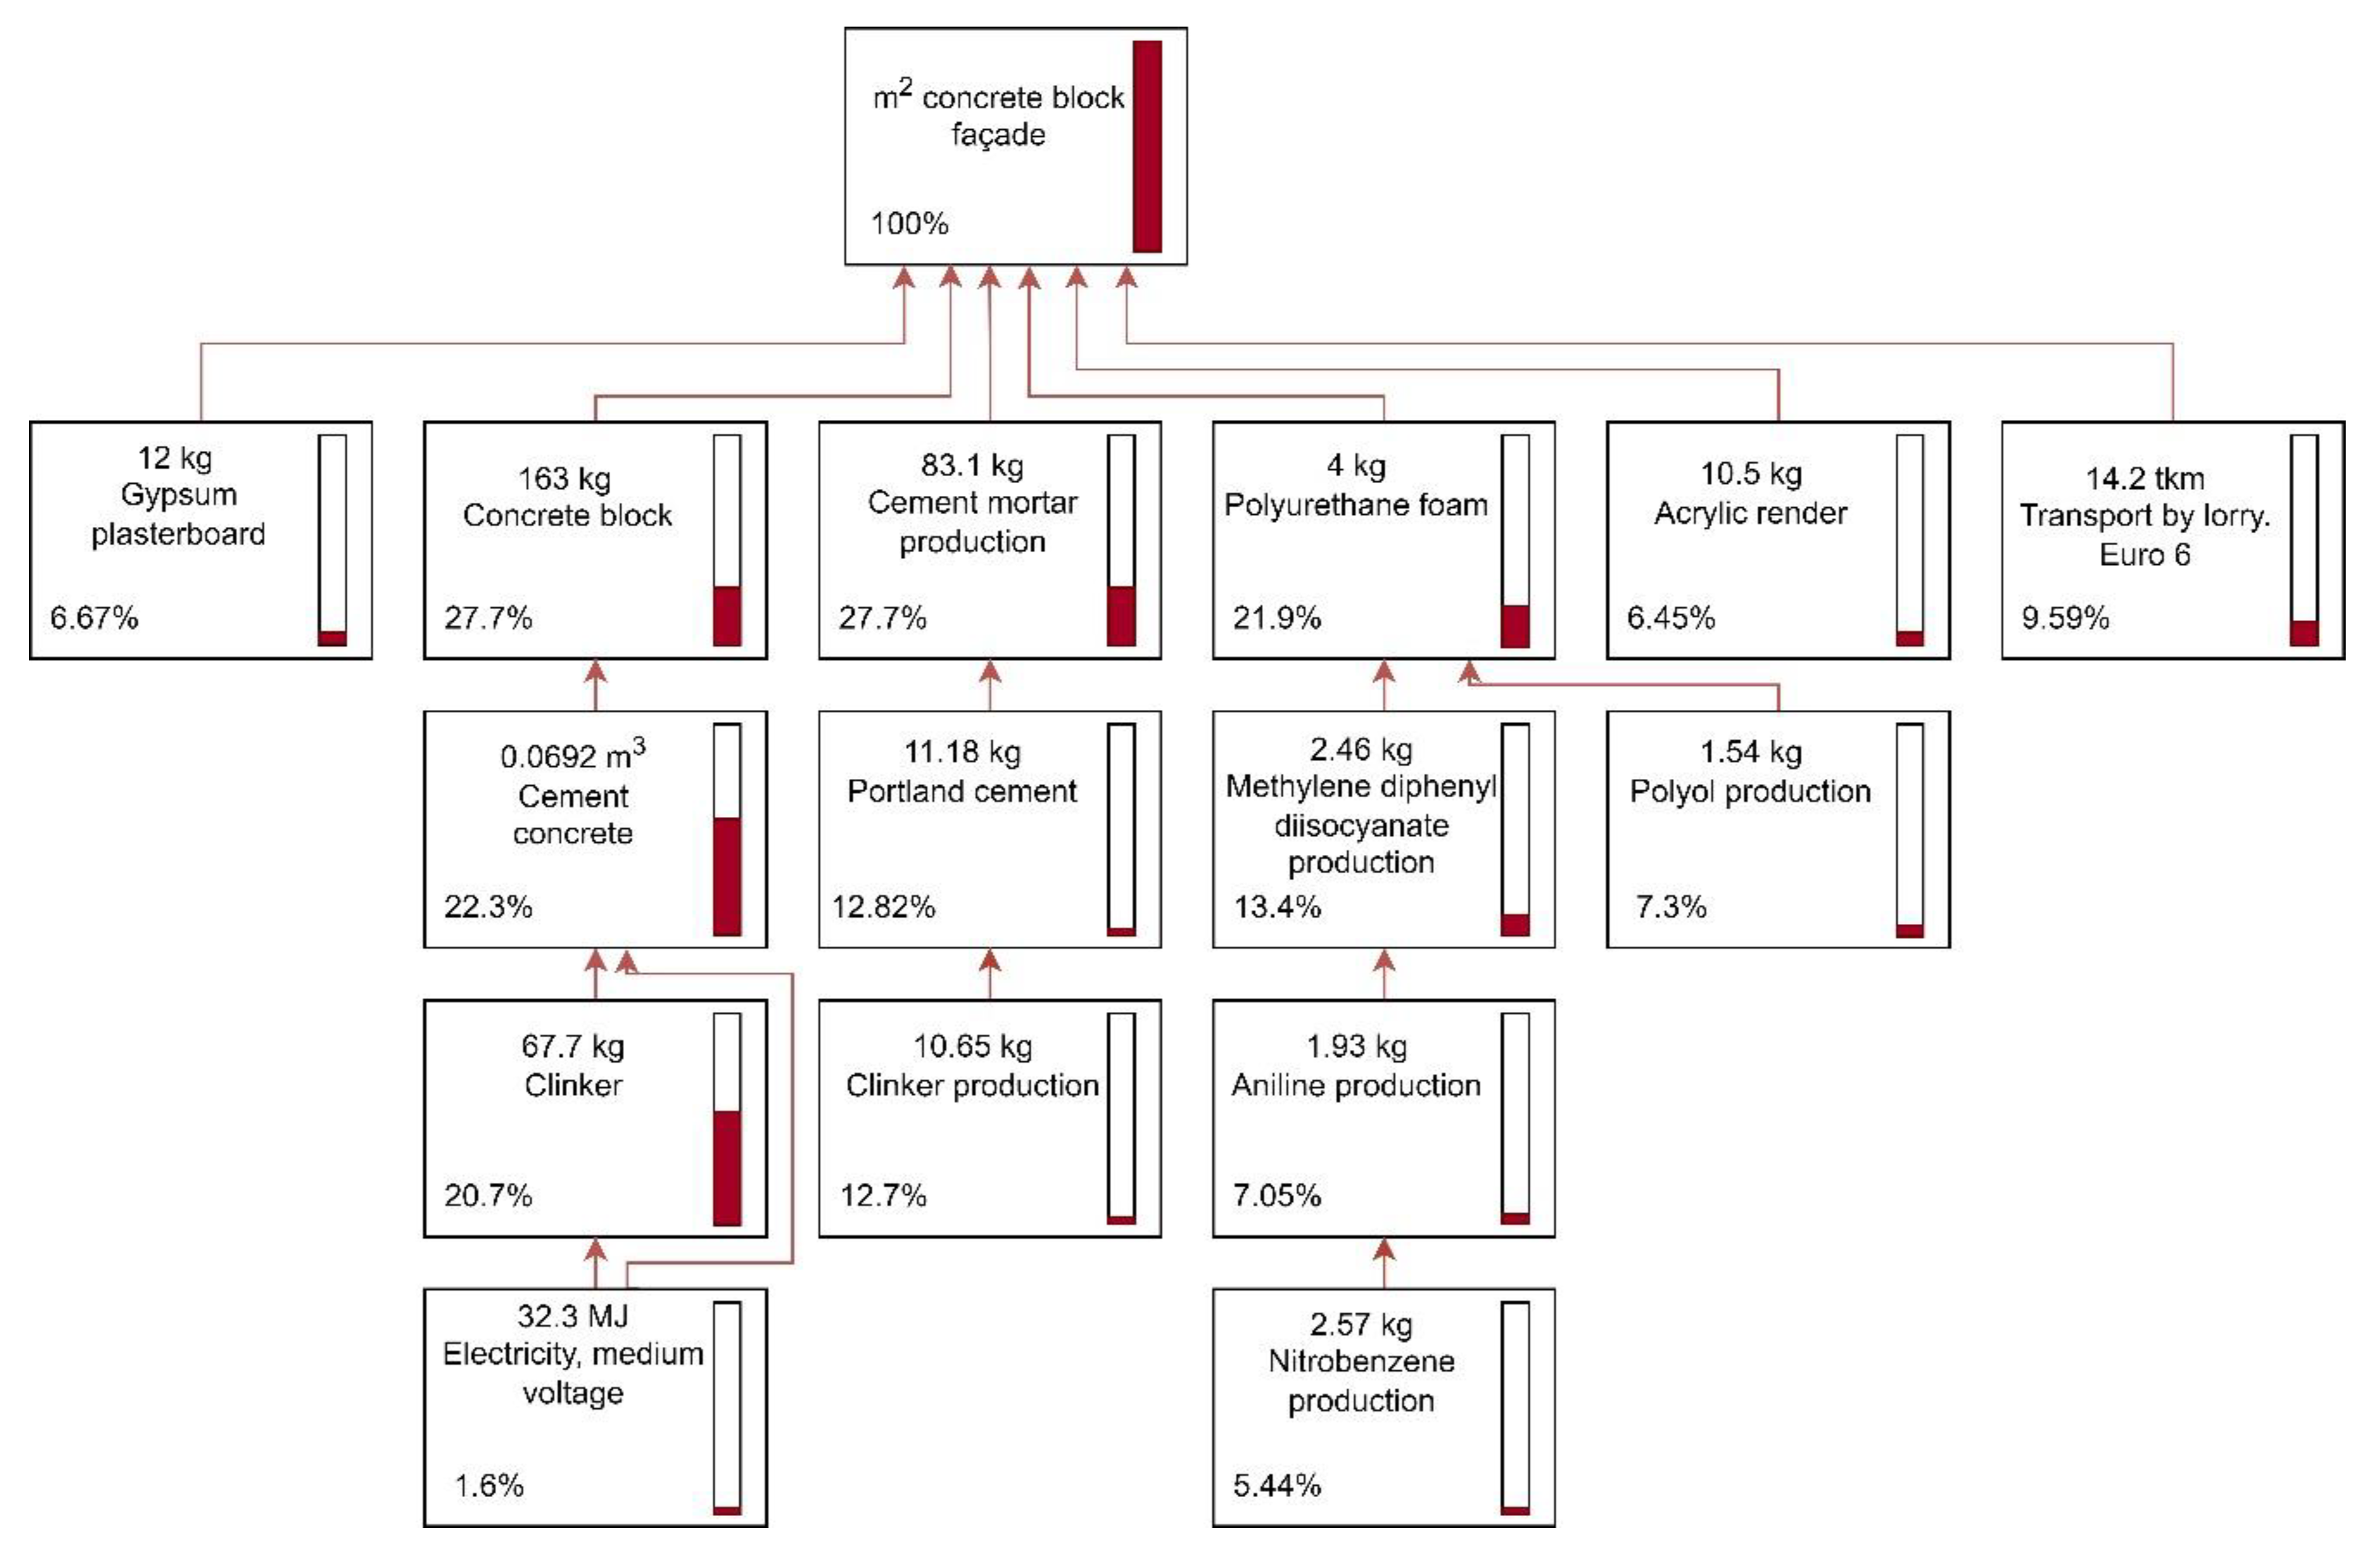
  • The comparative life cycle assessment indicates that using this 3D-printing system does not imply a significant increase in carbon dioxide emissions compared to more conventional alternatives, such as concrete blocks.
  • Although the difference is only slight, the 3D-printing façade emits a lower amount of CO2 than a façade built using masonry blocks. This pattern repeats itself in most of the impact categories obtained using the environmental footprint methodology.
  • After summing the normalized and weighted impacts, the single-score result obtained shows that the overall environmental impact of the 3D-printed façade is similar to that of the concrete block façade. The difference is mainly due to the higher amount of concrete per square meter needed to build the printed one. This could be improved either by reducing the cement content in the concrete or by creating a concrete pattern that leaves voids of holes. These solutions would affect the acoustic and thermal performance, which require further analysis.
  • Summary and general recommendations:
  • Overall, the study proves that the house complies with the Spanish acoustic and thermal regulations. However, the LCA results show that it cannot be considered a sustainable alternative to conventional constructions.
  • The time needed to build the 3D-printed façade is significantly shorter than that required to build the other two typologies. This implies a reduction in both the cost and the environmental impact of the construction works.
  • Working with lighter concretes or alternative shapes should be the objective of future studies. As long as the new solutions imply a reduced amount of cement, the resulting façade will have lower environmental impacts. This will also have consequences for the thermal and acoustic performance.
In the future, more research opportunities may arise in the fields of life cycle assessment, acoustics and thermal analysis, as professors and students use the house as the subject of future studies. We intend, through a collaboration with former students, to design future 3D-printed houses by introducing certain project changes and verifying the actual effects on the thermal and acoustic performance and interdependencies using IR imaging.

Author Contributions

Conceptualization, A.S. and I.G.-G.; methodology, A.Q.-G. and I.G.-G.; software, V.G.-L.; validation, A.Q.-G, V.G.-L.; formal analysis, V.G.-L.; investigation, A.Q.-G.; resources, A.S.; data curation, A.Q.-G.; writing—original draft preparation, A.S. and I.G.-G; writing—review and editing, A.Q.-G.; visualization, V.G.-L.; supervision, I.G.-G.; project administration, I.G.-G.; All authors have read and agreed to the published version of the manuscript.

Funding

This research received no external funding.

Data Availability Statement

Data employed in this study can be found at https://ecoinvent.org/ (accessed on 19 March 2021).

Conflicts of Interest

The authors declare no conflict of interest.

References

  1. Gosselin, C.; Duballet, R.; Roux, P.; Gaudillière, N.; Dirrenberger, J.; Morel, P. Large-scale 3D printing of ultra-high performance concrete–a new processing route for architects and builders. Mater. Des. 2016, 100, 102–109. [Google Scholar] [CrossRef] [Green Version]
  2. Sakin, M.; Kiroglu, Y.C. 3D Printing of Buildings: Construction of the Sustainable Houses of the Future by BIM. Energy Procedia 2017, 134, 702–711. [Google Scholar] [CrossRef]
  3. Lim, S.; Buswell, R.; Le, T.; Austin, S.; Gibb, A.; Thorpe, T. Developments in construction-scale additive manufacturing processes. Autom. Constr. 2012, 21, 262–268. [Google Scholar] [CrossRef] [Green Version]
  4. 3D Systems Our Story. 3D System Website. 2021. Available online: https://www.3dsystems.com/our-story (accessed on 19 March 2021).
  5. Sachs, E.M.; Haggerty, J.S.; Cima, M.J.; Williams, P.A. Three-Dimensional Printing Techniques. U.S. Patent 5,340,656A, 23 August 1994. [Google Scholar]
  6. Strauss, H. AM Envelope: The Potential of Additive Manufacturing for Facade Constructions; TU Delft: Delft, The Netherlands, 2013. [Google Scholar] [CrossRef]
  7. Strauss, H.; Knaack, U. Additive Manufacturing for Future Facades. J. Facade Des. Eng. 2016, 3, 225–235. [Google Scholar] [CrossRef]
  8. Hager, I.; Golonka, A.; Putanowicz, R. 3D Printing of Buildings and Building Components as the Future of Sustainable Construction? Procedia. Eng. 2016, 151, 292–299. [Google Scholar] [CrossRef] [Green Version]
  9. Ma, G.; Wang, L.; Ju, Y. State-of-the-art of 3D printing technology of cementitious material—An emerging technique for construction. Sci. China Technol. Sci. 2017, 61, 475–495. [Google Scholar] [CrossRef]
  10. Bryde, D.; Broquetas, M.; Volm, J.M. The project benefits of Building Information Modelling (BIM). Int. J. Proj. Manag. 2013, 31, 971–980. [Google Scholar] [CrossRef] [Green Version]
  11. Corcione, C.E.; Palumbo, E.; Masciullo, A.; Montagna, F.; Torricelli, M.C. Fused Deposition Modeling (FDM): An innovative technique aimed at reusing Lecce stone waste for industrial design and building applications. Constr. Build. Mater. 2018, 158, 276–284. [Google Scholar] [CrossRef]
  12. Facade of Dutch EU Building Uses 3D-Printed Bioplastic. Available online: https://www.dezeen.com/2016/01/12/european-union-3d-printed-facade-dus-architects-holland/ (accessed on 14 December 2021).
  13. Poullain, P.; Paquet, E.; Garnier, S.; Furet, B. On site deployment of 3D printing for the building construction–The case of YhnovaTM. MATEC Web Conf. 2018, 163, 01001. [Google Scholar] [CrossRef]
  14. Germany’s First Printed House Officially Openend. Available online: https://www.peri.com/en/media/press-releases/germanys-first-printed-house-officially-openend.html (accessed on 10 January 2022).
  15. Souza, M.T.; Ferreira, I.M.; de Moraes, E.G.; Senff, L.; de Oliveira, A.P.N. 3D printed concrete for large-scale buildings: An overview of rheology, printing parameters, chemical admixtures, reinforcements, and economic and environmental prospects. J. Build. Eng. 2020, 32, 101833. [Google Scholar] [CrossRef]
  16. Alfaify, A.; Saleh, M.; Abdullah, F.; Al-Ahmari, A. Design for Additive Manufacturing: A Systematic Review. Sustainability 2020, 12, 7936. [Google Scholar] [CrossRef]
  17. Khosravani, M.R.; Haghighi, A. Large-Scale Automated Additive Construction: Overview, Robotic Solutions, Sustainability, and Future Prospect. Sustainability 2022, 14, 9782. [Google Scholar] [CrossRef]
  18. Buswell, R.A.; De Silva, W.R.L.; Jones, S.Z.; Dirrenberger, J. 3D printing using concrete extrusion: A roadmap for research. Cem. Concr. Res. 2018, 112, 37–49. [Google Scholar] [CrossRef]
  19. Chau, C.-K.; Leung, T.M.; Ng, W.Y. A review on Life Cycle Assessment, Life Cycle Energy Assessment and Life Cycle Carbon Emissions Assessment on buildings. Appl. Energy 2015, 143, 395–413. [Google Scholar] [CrossRef]
  20. UNE EN 15804:2012+A2:2020; Sustainability of Construction Works-Environmental Product Declarations-Core Rules for the Product Category of Construction Products-European Standards. European Committee for Standardization: Brussels, Belgium, 2020.
  21. Bemore3D Viviendas, Dispositivos Y Construcción 3D. Available online: https://bemore3d.com/language/en/home/ (accessed on 10 January 2022).
  22. Spanish Ministry of Transportation, Movility and Urban Agenda. EHE 08, Act on Structural Concrete. 2008. Available online: https://www.mitma.gob.es/organos-colegiados/mas-organos-colegiados/comision-permanente-del-hormigon/cph/instrucciones/ehe-08-version-en-ingles(accessed on 10 January 2022).
  23. Santoni, A.; Bonfiglio, P.; Fausti, P.; Marescotti, C.; Mazzanti, V.; Mollica, F.; Pompoli, F. Improving the sound absorption performance of sustainable thermal insulation materials: Natural hemp fibres. Appl. Acoust. 2019, 150, 279–289. [Google Scholar] [CrossRef]
  24. Schiavoni, S.; D’alessandro,, F.; Bianchi, F.; Asdrubali, F. Insulation materials for the building sector: A review and comparative analysis. Renew. Sustain. Energy Rev. 2016, 62, 988–1011. [Google Scholar] [CrossRef]
  25. Soler, D.; Salandin, A.; Micó, J.C. Lowest thermal transmittance of an external wall under budget, material and thickness restrictions: An integer linear programming approach. Energy Build. 2018, 158, 222–233. [Google Scholar] [CrossRef] [Green Version]
  26. Li, F.G.N.; Smith, A.; Biddulph, P.; Hamilton, I.G.; Lowe, R.; Mavrogianni, A.; Oikonomou, E.; Raslan, R.; Stamp, S.; Stone, A.; et al. Solid-wall U-values: Heat flux measurements compared with standard assumptions. Build. Res. Inf. 2014, 43, 238–252. [Google Scholar] [CrossRef] [Green Version]
  27. Mazarrón, F.R.; Cid-Falceto, J.; Cañas, I. Ground Thermal Inertia for Energy Efficient Building Design: A Case Study on Food Industry. Energies 2012, 5, 227–242. [Google Scholar] [CrossRef]
  28. Nocera, F.; Caponetto, R.; Giuffrida, G.; Detommaso, M. Energetic Retrofit Strategies for Traditional Sicilian Wine Cellars: A Case Study. Energies 2020, 13, 3237. [Google Scholar] [CrossRef]
  29. ISO 6946; Building Components and Building Elements. Thermal Resistance and Thermal Transmittance. Calculation Methods. International Organization for Standardization: London, UK, 2018.
  30. ISO 7345; Thermal Performance of Buildings and Building Components. Physical Quantities and Definitions. International Organization for Standardization: London, UK, 2018.
  31. McMullan, R. Environmental Science in Building; Red Globe Press: London, UK, 2018. [Google Scholar]
  32. Ministerio de Fomento. Gobierno de España DB-HE. Código Técnico La Edif. 2020, 1–129. [Google Scholar]
  33. ISO 9869-1; Thermal Insulation. Building Elements. In-Situ Measurement of Thermal Resistance and Thermal Transmittance. Part 1: Heat Flow Meter Method. International Organization for Standardization: London, UK, 2014.
  34. Rasooli, A.; Itard, L. In-situ characterization of walls’ thermal resistance: An extension to the ISO 9869 standard method. Energy Build. 2018, 179, 374–383. [Google Scholar] [CrossRef]
  35. Choi, D.S.; Ko, M.J. Analysis of Convergence Characteristics of Average Method Regulated by ISO 9869-1 for Evaluating In Situ Thermal Resistance and Thermal Transmittance of Opaque Exterior Walls. Energies 2019, 12, 1989. [Google Scholar] [CrossRef] [Green Version]
  36. Bienvenido-Huertas, D.; Rodríguez-Álvaro, R.; Moyano, J.J.; Rico, F.; Marín, D. Determining the U-Value of Façades Using the Thermometric Method: Potentials and Limitations. Energies 2018, 11, 360. [Google Scholar] [CrossRef] [Green Version]
  37. ISO 13786; Thermal Performance of Building Components. Dynamic Thermal Characteristics. Calculation Methods. International Organization for Standardization: London, UK, 2017.
  38. Bragança, L.; Almeida, M.; Silva, S.; Mendonça, P. Acoustic Evaluation of Some Non-Conventional Solutions in Construction. Proc. Acústica; Guimarães-Port. 2004, 178, p1. Available online: https://1library.co/document/wq201pjz-acoustic-evaluation-of-some-non-conventional-solutions-construction.html (accessed on 10 January 2022).
  39. Aksoylu, C.; Mendi, E.; Söylev, A.; Üniversitesi, S.; Fakültesi, M.; Mühendisliği Bölümü, İ.; Karatay Üniversitesi, K.; Mühendisliği Bölümü, B.; Erbakan Üniversitesi, N.; Fakültesi, M.-M. Ses yalıtımında ses azaltım indisi modellerinin karşılaştırmalı olarak incelenmesi. J. Fac. Eng. Archit. Gazi Univ. 2016, 31, 961–970. [Google Scholar] [CrossRef] [Green Version]
  40. Ministerio de Fomento; Gobierno de España CTE; DB-HR. Protección Frente al Ruido; Ministerio de Fomento: Madrid, Spain, 2006. [Google Scholar]
  41. ISO 14040; Environmental Management. Life Cycle Assessment. Principles and Framework. International Organization for Standardization: London, UK, 2006.
  42. Mesa, J.A.; Fúquene-Retamoso, C.; Maury-Ramírez, A. Life Cycle Assessment on Construction and Demolition Waste: A Systematic Literature Review. Sustainability 2021, 13, 7676. [Google Scholar] [CrossRef]
  43. European Commission. Recommendation 2013/179/EU on the use of common methods to measure and communicate the life cycle environmental performance of products and organisations. Off. J. Eur. Union 2013, 124, 210. [Google Scholar]
  44. Quintana-Gallardo, A.; Clausell, J.R.; Guillén-Guillamón, I.; Mendiguchia, F.A. Waste valorization of rice straw as a building material in Valencia and its implications for local and global ecosystems. J. Clean. Prod. 2021, 318, 128507. [Google Scholar] [CrossRef]
  45. Zampori, L.; Pant, R. Suggestions for Updating the Product Environmental Footprint (PEF) Method; Publications Office of the European Union: Luxembourg, 2019. [Google Scholar]
  46. Wernet, G.; Bauer, C.; Steubing, B.; Reinhard, J.; Moreno-Ruiz, E.; Weidema, B. The ecoinvent database version 3 (part I): Overview and methodology. Int. J. Life Cycle Assess. 2016, 21, 1218–1230. [Google Scholar] [CrossRef]
  47. Baglivo, C.; Congedo, P.M. Design method of high performance precast external walls for warm climate by multi-objective optimization analysis. Energy 2015, 90, 1645–1661. [Google Scholar] [CrossRef]
  48. Keränen, J.; Hakala, J.; Hongisto, V. The sound insulation of façades at frequencies 5–5000 Hz. Build. Environ. 2019, 156, 12–20. [Google Scholar] [CrossRef]
  49. ISO 717-1; Acoustics. Rating of Sound Insulation in Buildings and of Building Elements. Part 1: Airborne Sound Insulation. International Organization for Standardization: London, UK, 2013.
  50. Mak, C.M.; Wang, Z. Recent advances in building acoustics: An overview of prediction methods and their applications. Build. Environ. 2015, 91, 118–126. [Google Scholar] [CrossRef]
  51. Ahmed, K.; Carlier, M.; Feldmann, C.; Kurnitski, J. A New Method for Contrasting Energy Performance and Near-Zero Energy Building Requirements in Different Climates and Countries. Energies 2018, 11, 1334. [Google Scholar] [CrossRef] [Green Version]
  52. Quintana-Gallardo, A.; Schau, E.M.; Niemelä, E.P.; Burnard, M.D. Comparing the environmental impacts of wooden buildings in Spain, Slovenia, and Germany. J. Clean. Prod. 2021, 329, 129587. [Google Scholar] [CrossRef]
Figure 1. First 3D-printed house in Spain (raw and finished).
Sustainability 14 13204 g001
Figure 2. Plan of the house and positioning of the sound sources and temperature probes for the thermal and acoustic measurements.
Sustainability 14 13204 g002
Figure 3. Cross-section of the 3D-printed façade and the comparative solutions.
Sustainability 14 13204 g003
Figure 4. Thermal transmittance measurement process.
Sustainability 14 13204 g004
Figure 5. Sound reduction index measurement process.
Sustainability 14 13204 g005
Figure 6. Evolution of the temperature of the east façade, measured by the probe on three days: the external air temperature Text (blue), the wall temperature Tw (red) and the internal air temperature Tint (green).
Sustainability 14 13204 g006
Figure 7. Theoretical vs. measured U-values of the east and south façade.
Sustainability 14 13204 g007
Figure 8. Theoretical thermal lag.
Sustainability 14 13204 g008
Figure 9. East façade: time lag between Text and Tw and Text–Tint dispersion.
Sustainability 14 13204 g009
Figure 10. Sound reduction index (SRI) results of the on-site measurements expressed in one-third octave bands.
Sustainability 14 13204 g010
Figure 11. Contribution of each process of the 3D-printed façade to the total carbon emissions.
Sustainability 14 13204 g011
Figure 12. Contribution of each process of the concrete block façade to the total carbon emissions.
Sustainability 14 13204 g012
Figure 13. Contribution of each process of the masonry block façade to the carbon emissions.
Sustainability 14 13204 g013
Figure 14. Environmental footprint normalization of 1 m2 of each façade.
Sustainability 14 13204 g014
Figure 15. Environmental footprint weighting and single score of 1 m2 of each façade.
Sustainability 14 13204 g015
Table 1. Concrete proportions for 1 m3 of micro-concrete.
MaterialsMass (Kg)
Water180.00
Portland cement500.00
Sand 0/2, grinded1400.00
MasterGlenium ACE425 (polycarboxylate)0.36
Mass cohesive (REOMIX 175)0.09
Total mass2080.45
Table 2. 3D concrete composition and characteristics.
Concrete Specifications
Minimum content of cement500 Kg/m3
Maximal dimension of aggregates2 mm
Water for soft consistence15 ± 1% based on weight of cement
Fresh bulk density 2100 ± 50 Kgm3
Hardened bulk density2300 ± 50 Kgm3
Minimum consistency (UNE EN 1015-3)12 ± 1 cm
Working time at 21 °C45 min
Setting time 1120 min
Resistance to compression (UNE EN 12390-1,2,3)>25 MPa
1 Depends on weather conditions.
Table 3. Thermal properties of the façade.
MaterialThickness
[m]
Thermal Conductivity [WK−1m−1]Density
[kg/m3]
Specific Heat [Jkg−1K−1]
Inner gypsum layer0.0150.258251000
Micro-concrete0.151.6520001000
Inner cement render0.030.8010501000
EPS0.100.038301000
Exterior acrylic render0.010.2010501500
Table 4. Thermodynamic properties comparison.
Façade TypeU-Value (W/m2K)Thermal Lag (h)
3D-printed 0.26847.71
Masonry blocks0.26629.45
Concrete blocks0.26238.25
Table 5. Global SRI.
FaçadeDn,Tw(C,Ctr)Dn,Tw,Ctr
A39(−1, −3)36 dB
B50(−2, −5)45 dB
C49(−2, −5)45 dB
D48(−1, −4)44 dB
Table 6. SRI comparison of in situ vs. theoretical model.
FaçadeTheoretical ModelIn Situ Results
A38 dB36 dB
B46 dB45 dB
C46 dB45 dB
D46 dB44 dB
Table 7. Environmental footprint characterization of 1 m2 of each façade.
Impact CategoryUnit3D-Printed FaçadeConcrete Block Façade Masonry Block Façade
Climate changekg CO2 eq116.5681.02118.39
Ozone depletionkg CFC11 eq1.00 × 10−5 8.94 × 10⁻⁶ 1.29 × 10⁻⁵
Ionizing radiationkBq U-235 eq2.541.612.34
Photochemical ozone formationkg NMVOC eq0.310.280.39
Particulate matterdisease inc.4.15 × 10−5 4.53 × 10⁻⁵ 6.08 × 10⁻⁵
Human toxicity, non-cancerCTUh3.53 × 10−6 3.42 × 10⁻⁶ 3.64 × 10⁻⁶
Human toxicity, cancerCTUh2.84 × 10−7 3.10 × 10⁻⁷ 3.45 × 10⁻⁷
Acidificationmol H+ eq0.41810.36580.4849
Eutrophication, freshwaterkg P eq3.19 × 10−3 3.44 × 10⁻³ 4.11 × 10⁻³
Eutrophication, marinekg N eq0.100.090.12
Eutrophication, terrestrialmol N eq1.020.871.19
Ecotoxicity, freshwaterCTUe2532.332637.682872.01
Land usePt688.711049.721202.74
Water usem3 depriv.45.2133.5232.76
Resource use, fossilsMJ1075.90982.521391.15
Resource use, minerals and metalskg Sb eq1.13 × 10−3 1.39 × 10−31.51 × 10−3
Publisher’s Note: MDPI stays neutral with regard to jurisdictional claims in published maps and institutional affiliations.

