Article

The Impact of V2G Charging/Discharging Strategy on the Microgrid Environment Considering Stochastic Methods

1
Department of Electrical Engineering, University of Azad Jammu and Kashmir, Muzaffarabad 13100, Pakistan
2
College of Energy and Electrical Engineering, Hohai University, Nanjing 211100, China
3
Department of Electrical Engineering, College of Engineering, Jouf University, Sakaka 72388, Saudi Arabia
4
Electrical Engineering Department, Faculty of Engineering, Aswan University, Aswan 81542, Egypt
5
Department of Electrical Engineering, Yeungnam University, 280 Daehak-ro, Gyeongsan 38541, Korea
*
Authors to whom correspondence should be addressed.
Sustainability 2022, 14(20), 13211; https://doi.org/10.3390/su142013211
Submission received: 18 September 2022 / Revised: 11 October 2022 / Accepted: 12 October 2022 / Published: 14 October 2022
(This article belongs to the Special Issue Energy Efficiency in Building and Energy Balance)

Abstract

:
Although electric vehicles (EVs) play a vital role in realizing remarkable features, however, the integration of a huge number of EVs leads to grid congestion as well. As a result, uncontrolled charging might give rise to undervoltage and complex congestion in the electric grid. The reasons for the uncontrolled charging of EVs have been investigated in the recent past to mitigate the effects thereof. It is very challenging to achieve controlled charging due to different constraints at the customer end; therefore, it is better to take the benefits of power prediction schemes for the charging and discharging of EVs. The power prediction scheme is based on a practical power forecast system that exploits the needs of various patterns, and the current research focuses on considering users’ demands. The primary objective of this study is to develop an effective and efficient coordination system for the charging and discharging of EVs by exploiting a smart algorithm that intelligently tackles the possible difficulties to attain optimum power requirements. In this context, a model is proposed based on stochastic methods for analyzing the impact of vehicle-to-grid (V2G) charging and discharging in the microgrid environment. A Markov model is used to simulate the use of EVs. This method works well with the Markov model because of its ability to adjust to random changes. When considering an EV, its erratic travel patterns suggest a string of events that resemble a stochastic process. The proposed model ensures that high power requirements are met during peak hours in a cost-effective manner. In simpler words, the promising features of the proposed scheme are to meet electricity/power demands, monitoring and the efficient forecasting of power. The outcomes revealed an effective power system, EV scheduling, and power supply without compromising the electric vehicle’s presentation of the EV owner’s tour schedule. In terms of comprehensiveness, the developed algorithm exhibits a significant improvement.

1. Introduction

The transportation sector is one of the biggest sources of carbon dioxide (CO2) emissions. Particularly, in developing countries such as Pakistan, almost one-third of CO2 emissions are anticipated from the transportation sector. Similarly, one-third of all CO2 emissions are realized in the United States as well [1], and one-quarter of all CO2 emissions globally. Although most of the transportation sector around the world still depends on traditional energy resources, the use of electric vehicles (EVs) has also extraordinarily increased and has received a lot of attention from researchers and scientists. EVs have a major role in reducing CO2 emissions in the transportation sector. The promising features of EVs are their ability to reduce tailpipe emissions and pollutants, which ensures a green energy concept, and are three times more energy-efficient and easier when compared to internal combustion engine vehicles (ICV) [2]. Both the short- and long-term economic goals of Pakistan also consider this primary and inevitable transportation sector problem and incorporate the use of EVs into the system, considering the growing importance of EVs. Renewable energy (RE) generation and energy consumption are essential for CO2 emission reduction. Therefore, new EV charging strategies must be incorporated into the current power system to accommodate RE sources. It must be able to incorporate new decentralized energy sources while also meeting the increasing demand caused by the growing usage of EVs [3].
The rapid adoption of EVs is anticipated to have an impact on local electric networks and grids. According to recent studies, EV charging is possible even at low penetration rates; however, it can lead to grid/electric network congestion and undervoltage [4]. As a result, EV charging accelerates distribution transformer deterioration and increases electric network/grid losses [5]. The prior “Fit-and-Forget” approach in this new situation necessitates transmission and distribution companies to change their current electric networks to accommodate the unique, ever-expanding necessity. This would entail enormous investments on the part of transmission and distribution companies [6].
As a result, a large percentage of scholars have recommended a variety of techniques to mitigate the negative impacts of EV charging. Controlled charging of EV batteries prevents extremely congested peak load hours and undervoltage [7,8]. If EV charger capability for vehicle-to-grid (V2G) charging is extensively employed, the batteries might be used as short-term energy storage (ES). Distribution operators could use this short-term energy storage to diminish the congestion on the grid due to conventional loads [9]. The life of the battery can be maximized by enabling controlled charging [10], although regulated EV charging is difficult to achieve since it includes numerous users, each with its own set of priorities.
The primary goal of research on EV fleet aggregators was to reduce energy acquisition costs for charging electric vehicles. The year that saw the lowest charging costs was a globally flattened load profile, obtained by optimizing the EV power of charging and time under the cost signal [11,12]. One advantage is that optimal charging periods and wattages reduce EV charging-related losses on the electric grid [13,14]. The control of EV charging using load shifting and valley filling while taking EV battery energy limits was recommended in [15].
Additionally, several strategies addressed the diverse consumer demands as well as the higher power requirements brought on by the simultaneous charging of many EVs [16]. In these scenarios, the main entity collects the information from each sub-entity and organizes authority utilization to fulfill the overall EV charging goals. Because the study neglected EV driving characteristics, the developed technique is computationally costly when applied to flexible and advanced systems [17,18].
The charging loads for plug-in EVs were calculated using the Monte Carlo (MC) approach after forecasting the system’s initial level of SOC [19]. According to the study, numerous criteria such as metrological circumstances, market charging pricing, and emission reduction may be easily classified in order to predict the charging time and initial state. The certain probability distribution function (Pr) was used with the help of a MC method to estimate how an EV user would drive [20,21]. This approach, however, is not optimal for forecasting load due to the arbitrary selection of distributed elements and incorrect prediction. Moreover, these approaches can only depict the first and final trip of the day [22]. The demand impact of EV rapid charging was explored using MC models [23]. The study’s major problem is that it fails to take into consideration the different methods of EV charging [24,25]. Similarly, the work carried out in [26,27] does not consider variable EV charging patterns.
According to the literature review, a practical charging strategy should be made, with EV fleet aggregators and transmission and distribution companies acting as independent legal entities. The design of EV charging must consider the needs of all parties involved. A strategy for forecasting the power of EV charging and discharging is proposed to accomplish this. The primary goal of this article is to simulate, calculate, and estimate the grid impact of electric vehicles while also determining storage requirements for EVs to contribute to energy service delivery. First, the charging techniques and charging-discharging patterns of EVs are studied, which will be required for future predictions. Furthermore, two distinct approaches for assessing EV usage and developing load profiles are investigated. Moreover, critical aspects that influence the load profile for EV charging are also considered. Stochastic methods are used to simulate the behavior of EVs on a wide scale, predict peak energy consumption, and anticipate peak load periods.
One of the major contributions of this article is to establish a new practical pricing method that considers the various stakeholders’ needs. The study calculates the charging impact of EVs by designing several EV charging models, relying on charging routines promoted by EV owner behavior, in order to work with the innovative charging technique. In the new charging strategy, distribution corporations and charging station operators (CSOs) are classified as distinct entities. Electric vehicle CSOs merely know the positions of various EVs in the power grid, and the distribution operators have no problem dealing with EV data. The novel method employs stochastic algorithms with a maximized extensive index and considers a standard battery to simulate the traveling behavior of big-scale EVS over extended time periods. Moreover, the previous charging techniques are compared and evaluated against the new charging approach.
The proposed algorithm also helps us to reduce the EV owner’s electricity costs. Profit is guaranteed by the differential between peak hours and off-peak hours’ electricity costs. This revenue might be divided between EV owners and electricity supplier companies. To strike a balance between the profit of the EV owners and the advantage of the energy suppliers, we should utilize a portion of the income to compensate EV owners or regular consumers to encourage them to use power wisely. Furthermore, power suppliers must receive a portion of the profit in order to cover the costs of maintenance as well as other services. To sum up, the key contributions of the proposed model are summarized as follows:
  • The primary goal of the proposed system is to provide an algorithm for EV charging and discharging that adequately addresses the issue of peak power demand.
  • To forecast EVs use, the proposed stochastic techniques were applied to charging and discharging algorithms.
  • The novel method employs stochastic algorithms with a maximized extensive index and considers a standard battery to simulate the traveling behavior of big-scale EVS over extended time periods.
  • The proposed algorithm intends to use V2G technology to control excessive power consumption during peak hours.
  • The study calculates the charging impacts by creating several EV charging scenarios dependent on charging patterns promoted by vehicle travel behavior in order to incorporate the new charging approach.
  • When compared to traditional pricing schemes, the proposed algorithm demonstrates a considerable improvement.
The paper continues with a summary of existing charging schemes that highlight forecast challenges. Section 2 explains the features of aggregated EVs integrated with the grid, as well as the major elements that influence EV charging behavior. Section 3 develops two separate models to apply stochastic approaches for predicting EV utilization. The developed models are subjected to simulation, resulting in findings and discussions in Section 4: Calculate peak energy demand, anticipate peak load hours, and reduce peak power consumption by utilizing stored energy in electric vehicle batteries. Section 5 discusses the conclusions.

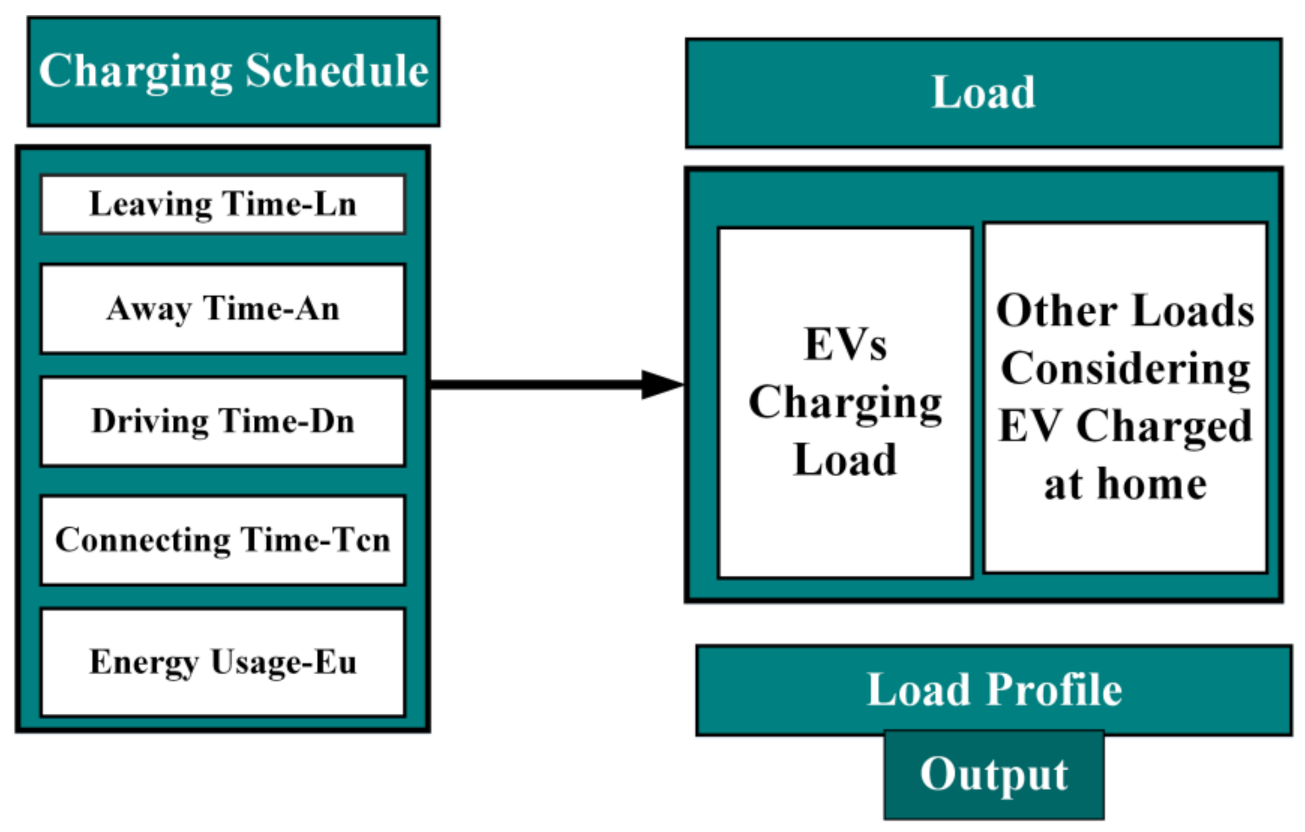
2. Features of Aggregated EVs Integrated with the Grid

The power sectors are facing difficulty in dealing with unpredictable electricity consumption as a result of an abrupt growth in the private EV fleet and considering them to be the vehicle-to-grid (V2G) system. The functioning of the EV appears to have a stronger influence on establishing charging patterns. Variations in a load of EV charging behavior have been observed by several studies and calculated in a variety of load profiles. The majority of these load profiles are dependent on the vehicle’s available charging options. The EV is charged immediately due to an uncontrollable charging event. Once it has been parked and charging is possible during this time, occurrence-only unidirectional charging is considered to be possible. This is feasible when it comes to grid-to-vehicle (G2V) power transfer. Certain outermost components were able to manage the discontinued one-way charging, owing to the advancement of alternate charging techniques. Bidirectional charging exists in the addition of grid-to-vehicle (G2V) charging, which considers the probability of power transfer from vehicle to grid.
In order to study the influence of EV charging on the microgrid/power grid, the characteristics of the EV charging station and charging strategy must be investigated. Figure 1 depicts a generalized plan for grid-connected EV charging stations and charging strategy.

Major Factors Affecting Charging Load Patterns for Electric Vehicles

In addition to charging strategies, three factors are taken into account when the behavior of EVs is studied in a V2G environment: the location of the charging, the requirement for charging, and the timing of the charging. These three critical parameters are required to measure the load patterns of EVs and the impact of electric vehicle charging (EVC) on the electrical network. Figure 2 depicts some of the key elements of an EV charging system and EV charging schedule. The charge required is the amount of electricity required for an EV to travel a particular distance, which is supplied by the grid/microgrid or the batteries [28,29]. Estimating the amount of vehicle-used electricity can be performed on a daily or per-drive-event basis. Assumptions are made about the requirement for charging in time, distance traveled, and duration of the journey, among other aspects [30,31]. It is considered that time-based mobility modeling is essential. Time-dependent state-of-charge (SOC) information is accessible, and the amount of charge required is calculated when the EV enters any parking lot with charging stations.
The charging of an EV battery represents its charge. There are two modeling approaches available: plug-in time and plug-out time. The precise start time can alternatively be specified as the pattern of the EV’s charging [32] or as a probability distribution of certain samples [33,34].
These strategies are only useful for determining when to charge for the day’s last or initial visit. The charged moment is calculated based on the time of stopping information supplied for a visit, whether it is for commuter or non-commuter travel [35,36]. External charging approaches or personal charging might be employed to delay the charging timing. Another constraint to consider when modeling EV charging behavior is the use of secondary fuel. External charging techniques may be altered to arrange parameters such as cost, grid loss, load fluctuation, and income by maximizing the essential aspects of charging location, charging moment, and charging requirement. Taking into consideration V2G services, external pricing strategies are required to carry out different activities to achieve the goals of external charging strategies. The performance of stochastic discrete driving is produced by individual charging techniques with an unregulated charging pattern, which can change the load-charging profile. Due to their versatility, EV chargers can affect charging behavior based on user preferences. EV charging modeling is presently needed to estimate load profiles in connection to the introduction of electric vehicles into the power supply. The primary components of the model can be built in a variety of ways, depending on the model’s goal, which might be external EV charging techniques, individual EV charging tactics, or uncontrolled EV charging.

3. Performance of Electrical Vehicle Charging

The Monte Carlo method is a broad category of computing algorithms in which numerical results are obtained through random sampling. The Monte Carlo approach can be used to address any problem with a probabilistic interpretation. Furthermore, with a large enough sample size, the law of large numbers permits a simple mean to be used to estimate probability standards (or any integral, for that matter). For example, [37,38] can be used to estimate the following integral:
b a f x d x = b a N i = 1 N f x i
The required samples are denoted by N. This fundamental can be used to find one finite-dimensional integral (FDI) above a volume, as follows:
Ω f x d x = V Ω N i = 1 N f x i
where V denotes the volume this holds true in any dimension and has a negligible impact on computation time. In this study, high-dimensional integrals (HDI) are derived numerically; hence, this technique has an advantage.

3.1. Monte Carlo Simulation Markov Chain (MCSMC)

A MC is a set of states x 0   ;   x 1 , . x n in which any state   x i   _ + 1 depends solely on the state x i   _ immediately before it, a condition known as memoCrylessness.
Establishing such a purpose enables the modeling of a Markov chain. The transition amplitude is the probability of moving from state xi to state x i   _ + 1 . Each model in this study is memoryless and has a Markov chain representation. Additionally, any model can be modeled using MCSMC techniques. Solving the symmetry of a many-state scheme can be challenging, if not impossible. Instead, opening from an initial state x 0 , the organization will reach equilibrium, or fulfill the objective allocation at the state x n for some large organizations. The reason for this is that the algorithms presented in this research maintain a high degree of detailed balance and ergodicity, guaranteeing that they ultimately meet the precise possibility distribution. The starting state x0 is arbitrary, despite the fact that knowing the equilibrium distribution beforehand can help convergence proceed more quickly. Although the equilibrium distribution was previously unknown, it may now be roughly determined by growing the Markov chain until the resulting distribution meets the equilibrium state conditions within an error. The Monte Carlo simulation can also be utilized for mathematical modeling to resolve the outcomes index of various charging methods based on EV travel and charge statistics.

3.2. Model-1 for Electric Vehicle Charging

The discrete temporal load profile serves as the foundation for the EV charging model discussed in this work. The energy utilization of the vehicle, which results in a charging demand, and the profile of load at the time of charging, determine the EV charging pattern. In Figure 3, I stands for each time instant for the ‘n’ EVs, where I = 1 , T and T is the largest time step. The input system is provided in the model 1 initial step. When an electric vehicle has been parked and incorporated at the connecting time ( T n c ), the moment of charging begins, and it lasts until the fully charged battery. The amount of time it takes an EV to connect is mostly influenced by how long it takes to leave a parking space ( L n ), how far the vehicle is from a place ( A n ), or how long it takes to drive ( D n ). When the connecting time ( T n c ) is the time of arriving at the destination and the leaving time ( L n ) is the time of departure, this phenomenon is seen in five different scenarios. In Case 1, the user of the car is allowed to leave the parking space, be gone for a predetermined amount of time, and still use the vehicle because the variables L n , A n , and the energy expended E u n are all sampled separately. These factors ensure that there is no highest energy consumption E u m a x n during the shortest possible time away. In this scenario, it is supposed that the electric vehicle is initially charged at the charging station (CS), and the connection time is T n 1 c , which is computed as follows:
T c 1 n = L n + A n
In the second scenario, sampled drive time D n s , velocity V s , and utilization C s , represent the energy utilized E u n   while driving:
E u n = D n s V S C S
The EV is assumed to be beginning from either an office or a commuting parking spot, and the time of connecting   T n 2 c is calculated as follows:
T c 2 n = L n + D n  
A significant amount of Cases 1 and 2 are combined to estimate the connection time in example 3. A late-starting automobile is the subject of Case 4. There will be an hour’s delay in Case 1. In this instance, the connection time   T n 4 c is quite close to the present. Case 5 is about   T n 5 c distributed electric vehicle charging, where the CSO controls how many vehicles are connected to each charging point.
Prediction of Load Demand
The electric vehicle charging load for EV n is determined at instantaneous I as depicted in Figure 3. Based on the charging power C p , V p i , n calculates the expected load. Ci n is the time it takes for each car to fully charge its battery. The car n’s charging time C i n is computed as:
C i n = E u n C p
The formula for charging power C p , load V p i , and n for motor vehicle n at moment I is as follows:
V p n , 1 = C p   I f   C h a r g i n g 0   E l s e
Using MCS for k samples, the predicted power E V p i at the instant I is given by:
E V p i = 1 k n = 1 k V p i , n
The total (EV) charging load V p T o t a l i for N vehicles at the instant I is given by:
V ptotal i = N . E V p i
The mean of the other loads is computed in segment 3 of Figure 3. Other loads O p i . are determined as the creation of the normalized load curve O c , p i and the load number. O n , with a usual consumption of C o   k W h /day/load, at instant i.
O p i = O n . O c , p i . C o
The overall load profile is calculated in the final stage as the sum of the EV load plus further critical loads. The total load means is calculated as follows:
P L i = V p i . t + O p i
The whole analytical algorithm is shown in Figure 4.
Figure 3 can be adjusted as illustrated in Figure 5 for a specific instance of EV scenario 1, where household loads are present and the vehicle has to be charged at residence.
With the exception of taking into consideration domestic operations and electric vehicle routines A p z i , n , where A p is the is denoted as the pattern of activity and Z is denoted as the activity at instant I for EV n , the imitation algorithm is the same as for model 1. In addition, the length of the instant I, the charging power C p , the charging time C i , and the depth of discharge D d . Dd is taken into consideration. The algorithm for charging demand calculation is displayed in Figure 6.

3.3. EV Mobility and Recharging Flexibility

This article’s suggested EV charging model replicates erratic charging and unique charging techniques based on charging price compassion. Based on driving habits and movement of the vehicle, it modifies time dependency to estimate charge profiles. The starting and finishing periods of a trip are used to simulate the mobility of EVs. The demand for charging is mostly determined by the vehicle’s energy usage and velocity during a journey. When the car is moving, we may estimate the requirement for charging, the state of charge, and the position of the CS with respect to time by using temporal dependency. It must be understood that all of the preceding factors are interdependent. Based on the necessity of charging, postulations were made that EV charging could take place anywhere once the trip was completed. As illustrated in Figure 7, the above-mentioned charging model has eight steps.

3.4. Electrical Vehicle Model 2

A Markov model was used to simulate the use of EVs. This method works well with the Markov model because of its ability to adjust to random changes. When considering an EV, its erratic travel patterns suggest a string of events that resemble a stochastic process. According to the widely acknowledged Markov process, given this series of events, an object’s future states depend only on its present state and not on its past occurrences. At each moment I each happening is explained as the probabilistic parameter, X i as X i ; i   τ , where τ is a discrete-time interval and τ = 0 , . ,   T , is the beginning value, and the mathematical symbol for this random process. The process of a Markov chain has a collection of states   G = 1 , . ,   Q , for X i to reside. X i , n provides the status of an EV at the instant I. A matrix of transition T i of dimension Q × Q with transition probability P μ , v with μ ,   v   G , and μ ,   v as matrix elements representing the progress to P μ ,   v i in a single instant. The complete sum of progress (movement) for each instance is given by μ P μ ,   v t = 1 .
Step 1 concerns the mobility of a collection of explanations that an   EV   X i , n in Figure 7 can dwell on. Model 2 specifies these explanations as the inherent patterns connected to any vehicle. The natural states of the set G = P a ,   D r are the parking state ( P a ) and the driving state ( D r ). If the automobile is in state P a , based on the battery’s state of charge, it can charge. If the battery has enough capacity and the automobile is in state D r , it is using energy.
The state of an electric vehicle’s n is evaluated in the second step using a transition matrix T i . At any given time, only one state of that exact electric vehicle may exist.
T i = P i P a P a P i D r P a P I P a D r P i D r D r
For electric vehicle n , the initial state probabilities P s 0 , n are shown by:
P s 0 , n = P p a 0 n P D r 0 , n
Equation (13) treats the X 0 , n first state for E V n . Step 3 of Figure 7 shows each time-dependent event sampling process E V n . There is a possibility P s i + 1 , n that vehicle n is in states P a or D r at the instant i + 1 . A line in the matrix transition T i , that shows the condition at the instant I is represented by P s i + 1 , n The first row in T 0 and the anticipated next state in the line can both be treated if the initial state is X 0 , n =   P a .

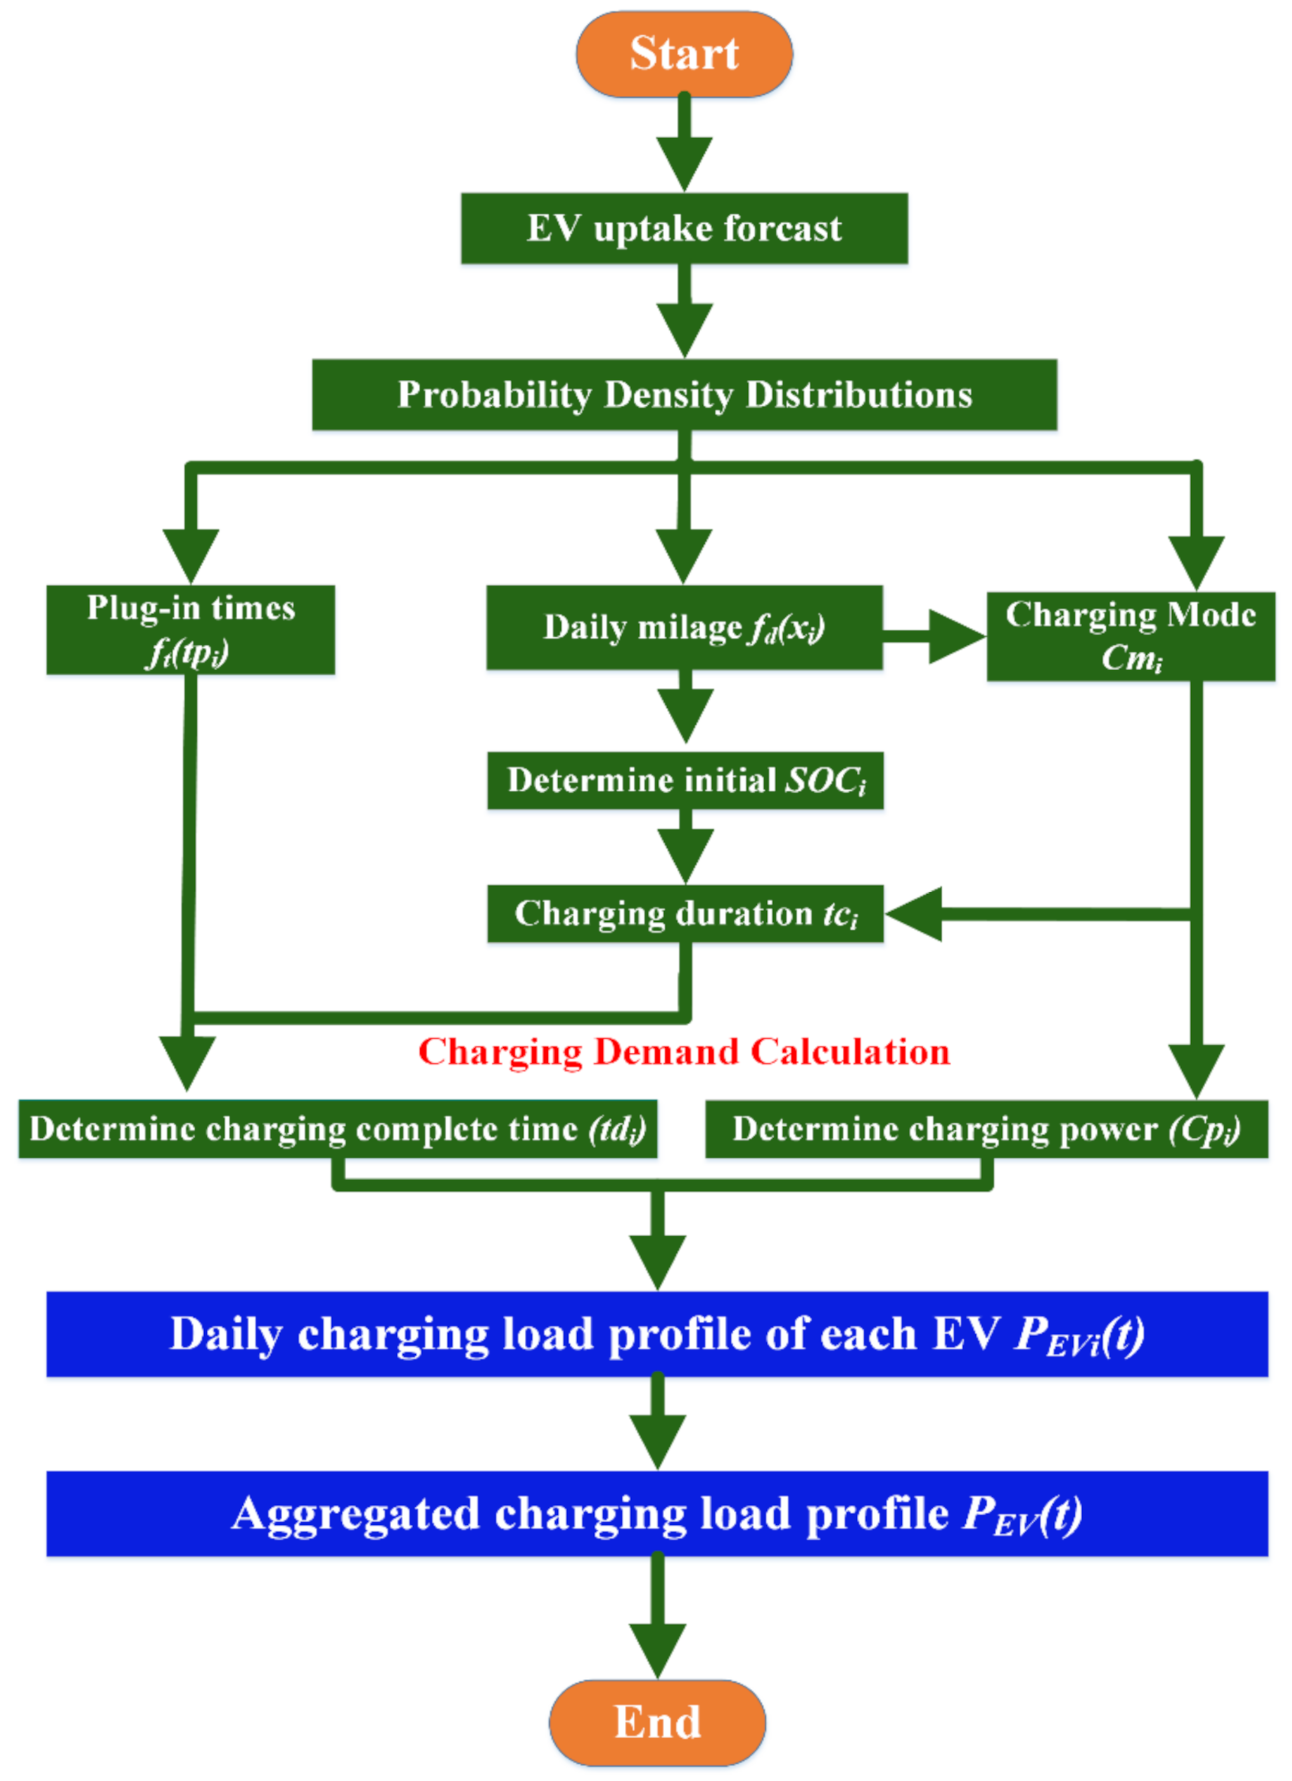
Electrical Vehicle Profile Estimation

Step 5 calculates the electric vehicle’s charging load V p i , n for car n at instant i .
V p i , n = C p       If   Charging   0   e l s e
The mean result of MCS for samples k was used for evaluation of the load profile E V p i for one electric vehicle in step 6.
E V p i = 1 k i = 1 k V p i , n
The standard deviation σ v i   is evaluated as:
σ v i = 1 k 1 i = 1 k V p i . n V p i
Step 7 calculates a total load of charging V p i for N t vehicles at an instant i .
V p t o t a l i = N t V p i ^
The entire load profile is estimated in the last stage by adding the daily load (overall) O p i and charging load (total) of vehicles.
P L i = V p t o t a l i + O p i

4. Results and Discussions

The presented methods aim to reduce peak power needs by utilizing stored power in an EV’s battery. Depending on the EV battery’s state of charge and the desired power for the travel, the charging procedure may occur during peak hours or off-peak hours. Table 1 shows the EV battery characteristics that were used for this study.
Moreover, if the EV leaves the house without enough state of charge to achieve the needed power for the drive, EV owners can charge the EV at a charging station (CS). Meanwhile, EV discharging procedures will happen between the hours of 8:00 am to 8:00 p.m. The charging/discharging times of an electric vehicle are highly influenced by the initial SOC, daily miles, EV discharge period, and power provided. The Monte Carlo simulation (MCS) random sampling approach was used to alleviate these impacts on EVs. The MATLAB/Simulink tool was used to perform the empirical analysis of the data considering power requirements, user mobility, trip plans, and the cost of consumed power and lost grid electricity.

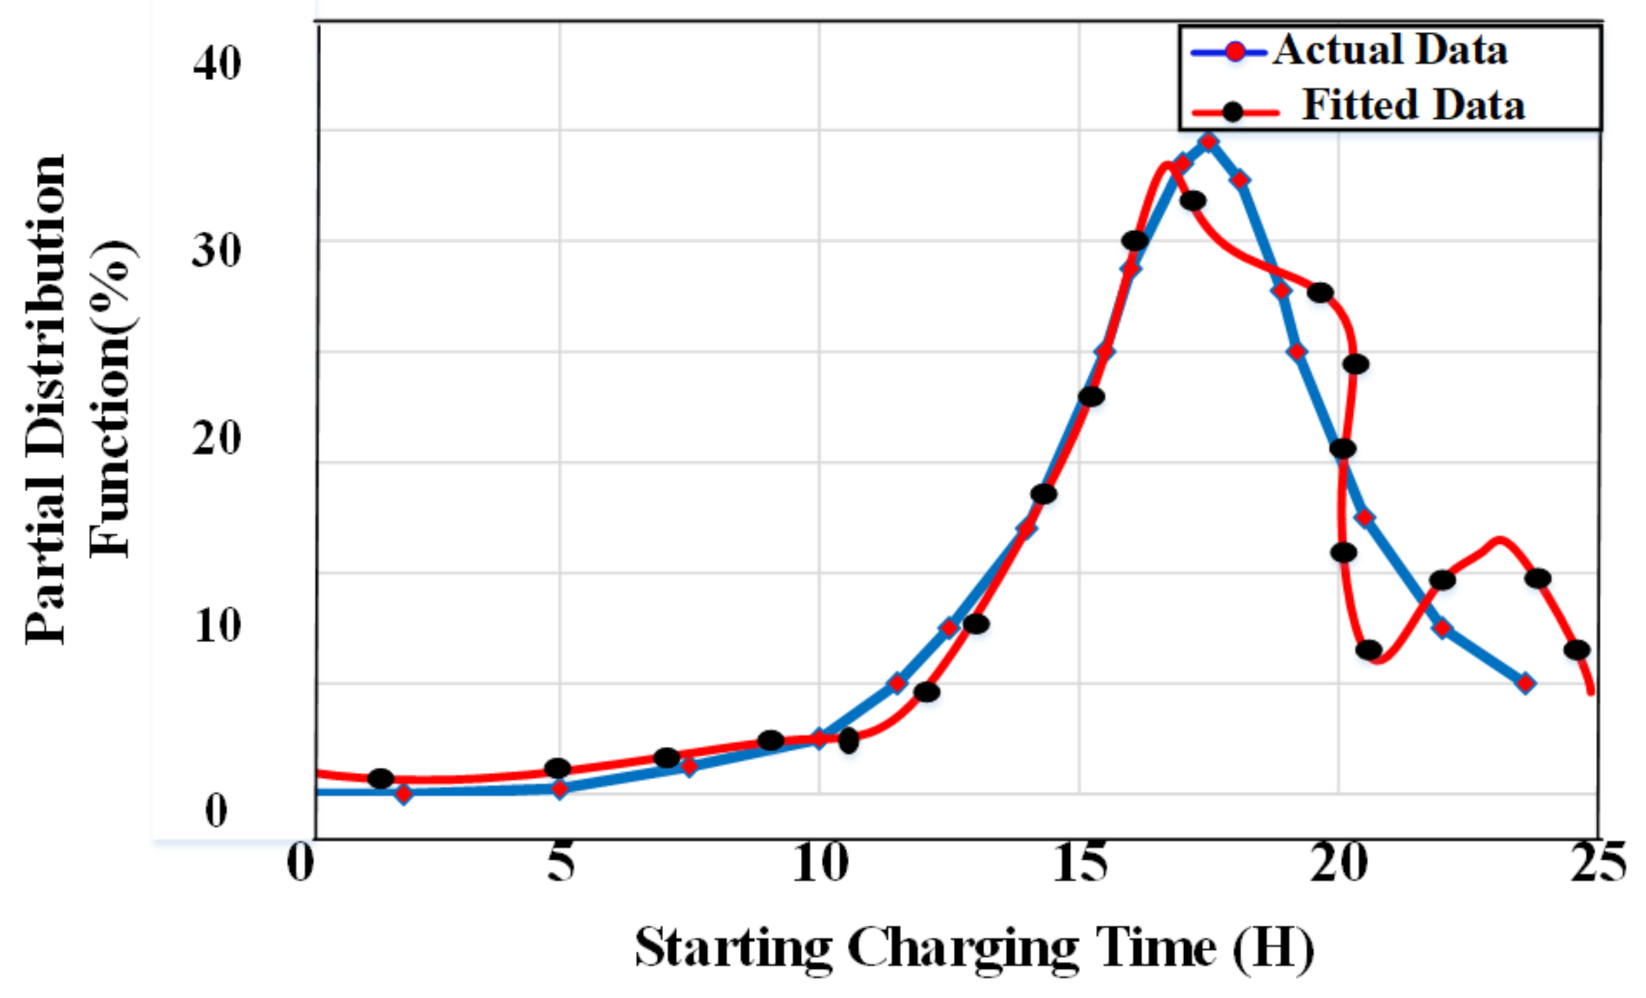
4.1. Model Fitting Using a Probability Distribution for Traveling Parameters

The probability density function (PDF), as well as its values of the driving variables, may be calculated by investigation of electric vehicle driving statistics on business days, as shown in Figure 8.
The PDFs were chosen depending on the data set and stochastic functions. Furthermore, the data was divided into five categories: frequency, electric vehicle travel, duration, distance, and times of trip (morning hours (12.00 am–12.00 pm) and evening hours (12.01 pm–12.00 am)). The best probabilistic distribution functions derived for variables were then implemented in the simulation model, such that the input parameters satisfy particular probabilistic distributions that correspond to the actual EV traveling patterns. Although there are certain distortions when negotiating with trip time, multiple hypothesis testing procedures were used to ensure that these variations were admissible with large enough statistic samples. As a result, the developed MCS model is highly trustworthy and credible.

4.2. Case Studies 1 and 2: The Number of Daily Trips Made and Their Intervals

The everyday traveling frequency T f and the trip interval T i are presented as random variables x , distributed with the size and shape variables, k and θ , accordingly, using Erlang distribution. When θ is big, the Erlang distribution prefers positive actual numbers and resembles the normal distribution. The PDF is presented for k > 0 and > 0:
1 Γ k θ k x k 1 e x θ
where Erlang or Gamma function is denoted with Γ is and is given by:
Γ k = 0 t k 1 e t d t
As a result, the size, geometry, median, and variance variables were calculated using maximum likelihood estimation (MLE), and the relevant graphs were produced and compared empirical findings with genuine fitting data. The parameter estimate plots for activities 1 and 2 are shown in Figure 9, Figure 10 and Figure 11, accordingly.

4.3. Case Study 3: Each Trip’s Mileage

The driving miles per trip Dm is generated by applying the fatigue life distribution to predict the failure durations with the use of shaped k, dimension, and position characteristics.
The PDF is provided for x > and k > 0:
f x ;   k , θ , μ = x μ θ + θ x μ 2 k x μ ϕ x μ θ + θ x μ k
where ϕ is denoted as standard normal distribution’s probability distribution function PDF. The fatigue life distribution has the benefit of being able to fit skew better than current distributions, such as the minimum and maximum distributions and the classic beta distribution. As a result, MLE was used to estimate the size, mean, shape, and variance variables, as well as the relevant graphs, which were generated by correlating statistically with the real fitting data. Figure 12 shows the graphs for parameter estimates using Case 3.

4.4. Case Study 4: Daily Departure Time

There are two options for predicting the daily departure time of the trip.
Case A: Consider that the travel begins in the middle of the night to the morning hours (12.00 am–12.00 pm) of the day   T s E . The destination distributions are modified in this scenario. The PDF is provided for any random variable x , shaped k , size, and positioning parameters:
f T s E x ; k ,   θ , μ = Γ k + 1 2 θ k π . Γ k 2 k k + x μ θ 2 k k + 1 2
where the gamma function is denoted by ‘Γ’.
Case B: Suppose that the travel begins in the evening time of the day (12.00 pm–12.00 am) T s L . The Gaussian distribution is used in this example. The probability distribution function for each random variable x is given by:
f T s L x ; μ σ 2 = 1 2 π σ 2 e x μ 2 2 σ 2
where the median is denoted with x and σ 2 denotes the variance. Moreover, the statistical parameters were calculated using MLE, and the relevant graphs were produced by correlating statistical values with the real fitting data. Figure 13 and Figure 14 show the charts for the parametric tests with activities.
It is clear from the preceding actions that estimating the EV charging/discharging power may be conducted in three distinct scenarios—EV charging, EV traveling, and EV parking—by combining five separate activities. By using the MCMC approach, several simulations were performed to predict the system’s behavior. To assess the system’s dependability, several statistical measures computed were examined with MLE, and the relevant findings are shown in Table 2.
The variation in the parametric values was achieved by modifying the conditions used for this simulation’s estimate procedure. The change in kurtosis parametric values was found to be higher than the variation in predicted values. The variance readings for the MCMC approach were lower in comparison to the SE approach, indicating that it was closer to the weighted mean and minimal risk.
Additionally, the skewness and kurtosis values for the MCMC scenario show higher benefits with the estimating technique. It has also been discovered that the calculation time of MCMC is six times better than that of existing techniques.
New EV charging and discharging mechanisms can be established based on the sample methodologies adopted through examining data to construct a charging/discharging method and create an innovative scenario. For simulation studies, numerous factors and possibilities were considered:
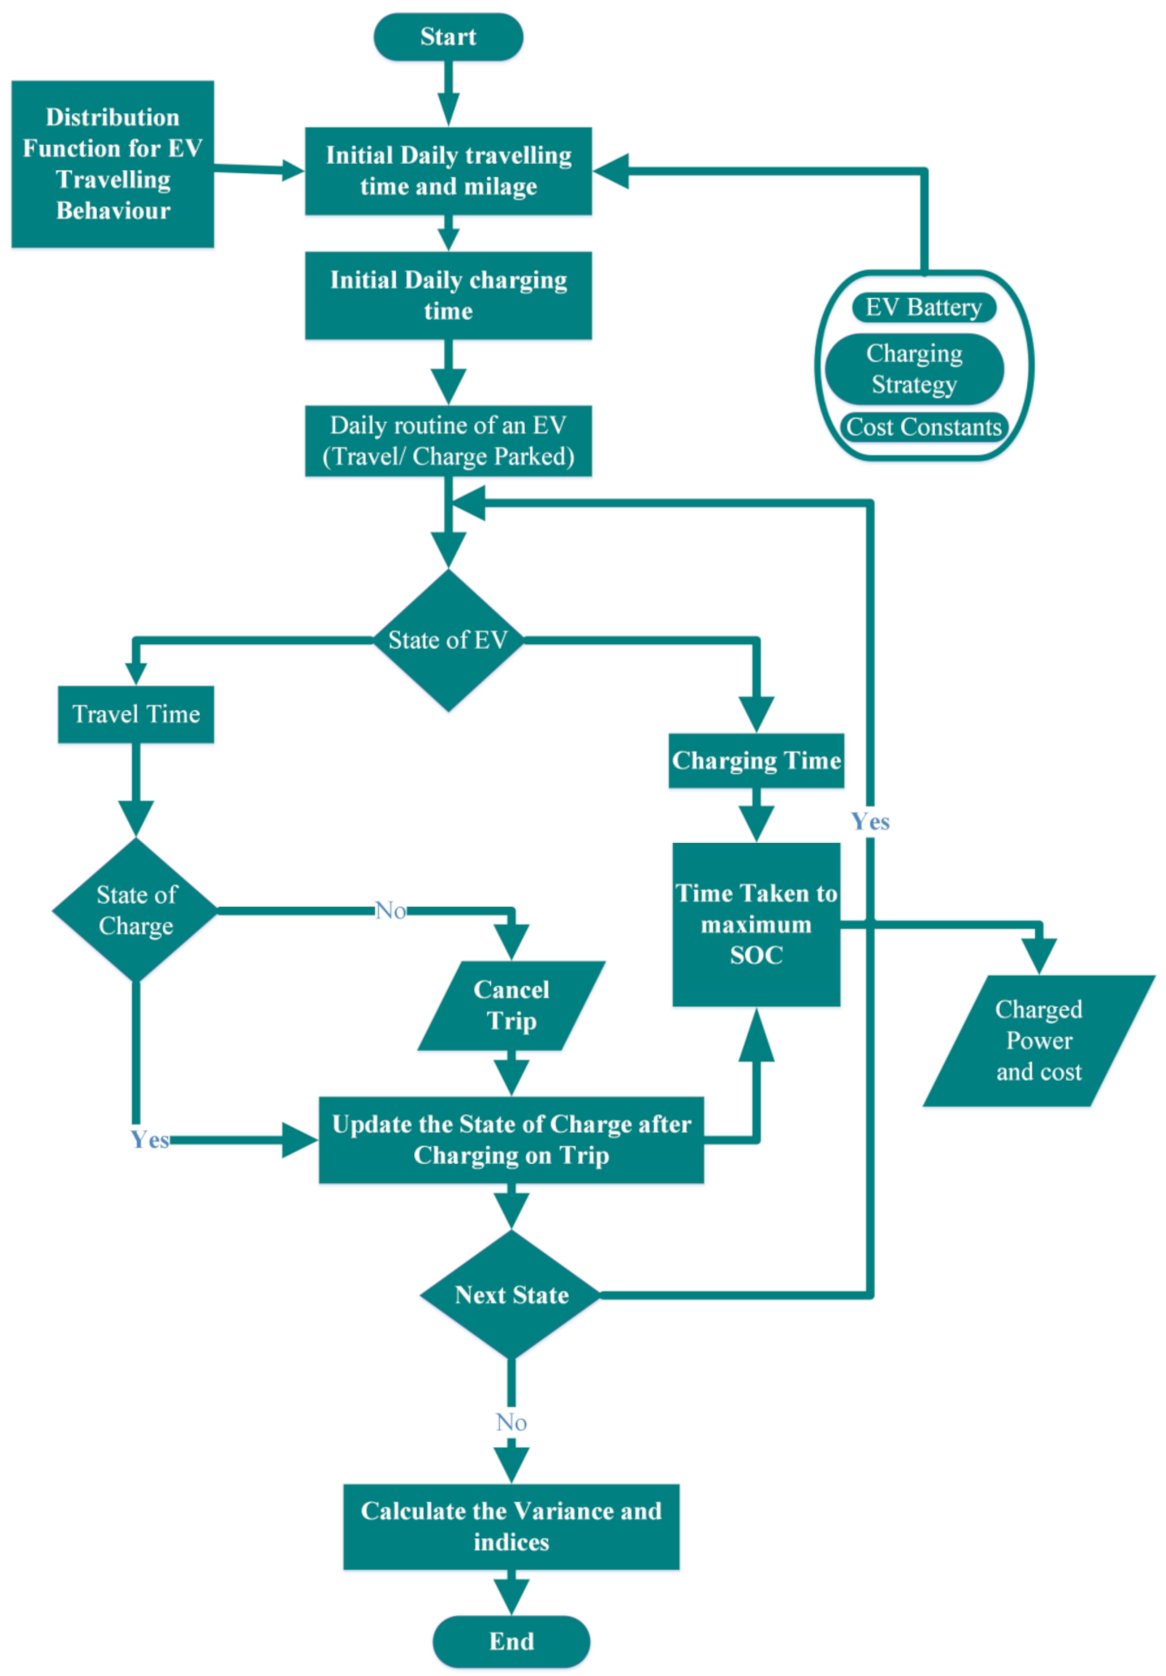
  • The daily use of private EVs is distributed using a log-normal distribution.
  • It is anticipated that the state of charge of the EV’s battery should be more than 0.2 at all times.
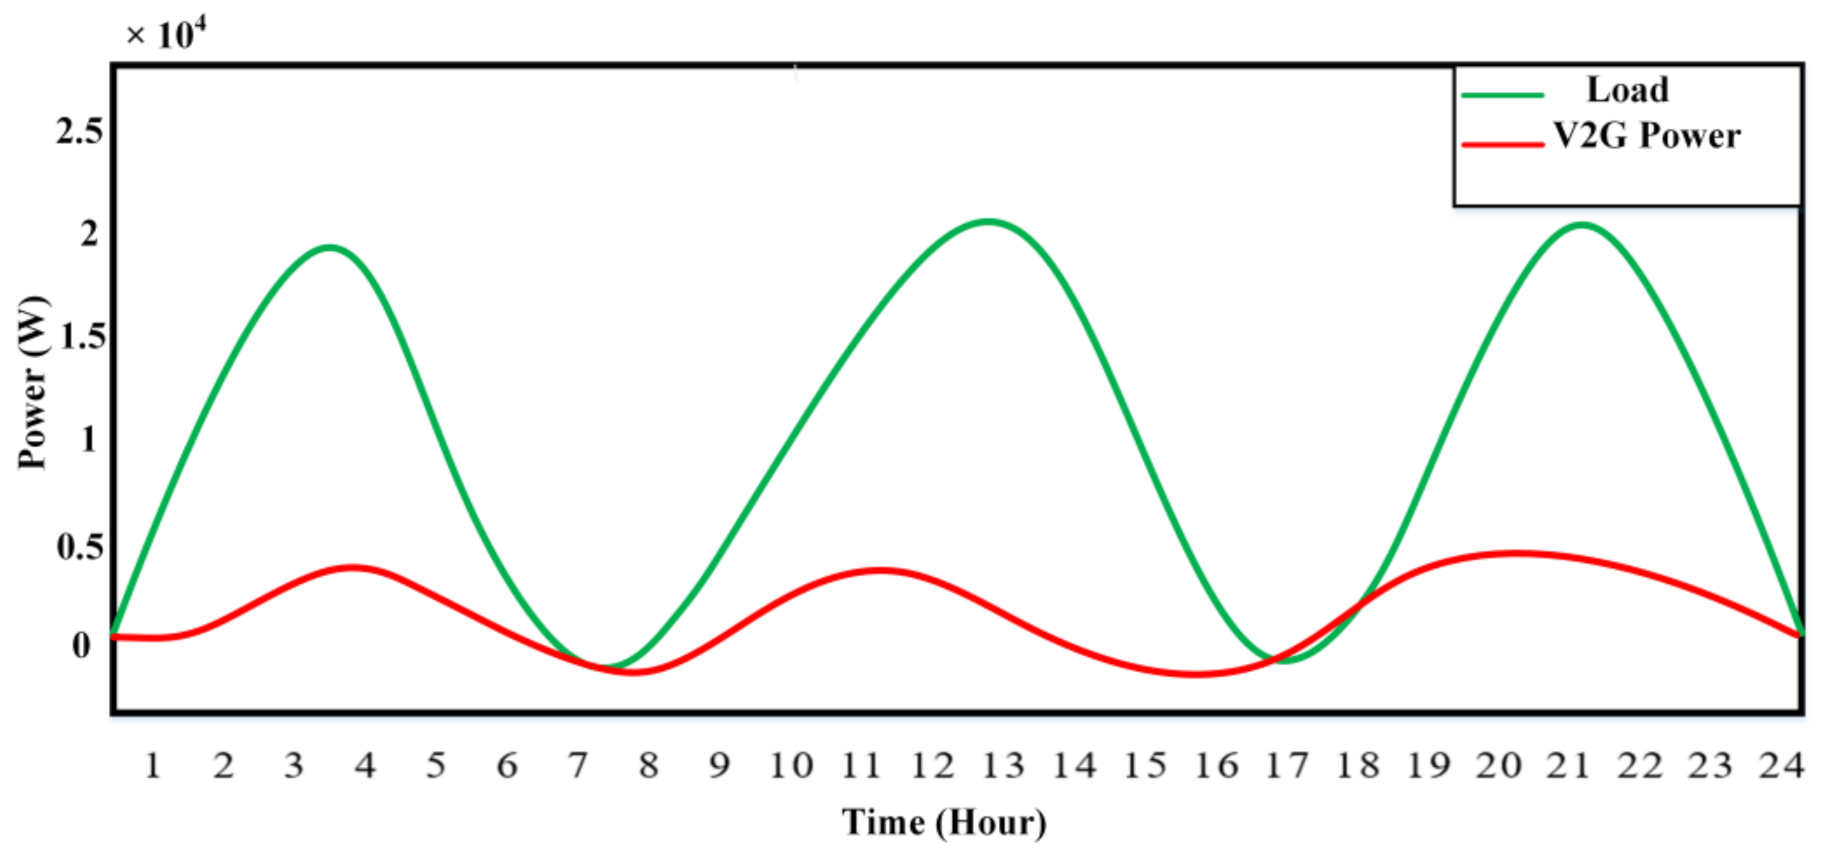
  • As illustrated in the image, specific time periods were selected for performing the EV charging/discharging operations.
  • It is anticipated that equal distribution meets with the initial condition of the EV charging and discharging process.
  • Time restrictions were not considered while charging.
  • The electric vehicle’s battery will keep charging until the state of charge is ≥ 0.9.
The EVs battery’s charging and discharging capacity was estimated by equally partitioning 24 h into 72 periods of 20 min each. For example, the EV charging and discharging power is given as instance ‘i’:
P i = k = 1 n P i k
where P i k is represented as EV charging and EV discharging capability of the k t h electric vehicle at instant I and n   represents the number of EVs used in G2V or V2G mode.
Assuming all of the above limitations, let us suppose that the EV is already completely charged. The initial charging condition is restricted.
Where EV charging and discharging capacity is denoted as P i k of the   k t h EVs at the instant I , and n are a fleet of electric vehicles employed in G2V or V2G mode.
Assume, given all of the above-mentioned constraints, that the EV has been initially fully charged. Because of this, the initial charging state is constrained:
Δ I j k = 1 S O C i n t j k Q j P j k
I o ϵ I o j , I o j , + Δ I j k
where ΔIik represents the maximum charging duration for the k t h electric vehicle, the time instant is denoted by I o j at which the J t h type of electric vehicle is aggregated at a charging station (CS), and the initial EV battery capacity is denoted as S O C i n t j k for the k t h electric vehicle of the j t h type. This pertains to everyday traveling distance; i o is represented as the time necessary for a fully charged EV to reach the CS under each EV’s charging requirements. As stated previously, this designed and controlled a normal distribution within a limit of:
I o j , I o j , + Δ I j k
The battery characteristics used for sampling are given by:
μ i = V a e ¯ e ¯ i = σ i e ¯ x e ¯ i
where μ i represents the variance coefficient, V a represents the variance, e represents the expectation, σ i   represents the standard deviation, and x i s represents the time count.
In general, EV charging/discharging times vary based on the original state of charge, daily travel, and recharging. After obtaining the charging/discharging patterns of various EVs, the charging/discharging capability in 72 h sessions was computed. Furthermore, charging time was calculated based on demand during the set timeframe and the charging power. Given the limitations connected with EV critical charging time, the option of reducing the starting charging time exists. Typically, EVC hours are focused in the morning hours of 8:00 to 12:00 PM and at night from 6:00 to 10:00 PM. Despite hybrid and EV optimization, there has been a significant increase in the personal EV fleet in recent times. As an outcome, the EV charging demand on the power network has increased, resulting in uneven demand and supply ratios. The statistics focus on EV charging periods between 8 AM and 6 PM. Figure 15 depicts the state distribution of EV throughout each day.
As illustrated in Figure 16, an expansion in EV charging, power, and discharge capability of 90,000 electric vehicles per day is anticipated in 2020.
Given the expansion of the electric vehicle industry, Figure 17 uses established modes to illustrate the power needed for V2G operation and EVs, with 300,000 EVs by 2022.
The simulated substantial electric vehicle operating method using MCMC computation is shown in Figure 18. It is based on PD modeling of the EV traveling patterns and types of EV charging techniques. In comparison to electric vehicle users’ travel patterns, electric vehicle charging practices are more manageable with specific coaching. As a result, amongst the most realistic optimization tasks is the charging approach.
According to the results of the model, massive EV charging stations may result in power network stability problems. Additional peak load units are needed to achieve the charging demand, resulting in a cost increase. It is vital to provide an inexpensive and safe power grid in order to efficiently guide the charging process of electric vehicles.
The proposed estimating and electric vehicle charging approaches were evaluated using the framework decision-making for the experimental study. According to electric vehicle owners, the assessment indices are: C c o s t , representing EV charging cost; C m a x c o s t , representing the highest amount paid for maximum EV charging capacity; R s , representing saving rate; and   R m representing as pa percentage of the average distance to planned mileage. A comprehensive index analysis of several pricing techniques is represented in Table 3. Consequently, the assessment indices necessary for analyzing performance from the standpoint of electricity suppliers are: L p , representing 24 h charging peak value; L t , entire load provided for a specific time span; L a p r , representing average peak ratio; and L c g r , representing the ratio of regular charging peak level to grid peak.
L a p r , R s , and R m are the primarily important indices for both entities used in the compilation of the overall indexing C x :
C x = α . 𝕀 L a p r 𝕀 + β 𝕀   R s 𝕀 R m 𝕀   1.0 = α + β + γ
where the positivity value coefficients α , β , γ   can be varied. The values used here were about 0.4, 0.3, and 0.3. The greater the score of the holistic index, the better the system’s performance.
When compared to the other charge approaches, the recommended charging approach had a higher comprehensive index.

5. Conclusions

This study presents stochastic methods to analyze the impact of vehicle-to-grid (V2G) charging/discharging on the microgrid environment. The peak load shaving approach used by EV users and grids/microgrids was presented and examined using a real-time simulation environment against two electric vehicle charging models of EV mobility and charging patterns produced. The MCMC approach was used to create charging algorithms. The impact of EVs on load profiles were calculated by using Monte Carlo simulation and Markov chain strategies by considering power requirements, user mobility, trip plans, and the cost of consumed power and better management of grid electricity. The simulation results clearly indicate in Table 3 that the proposed models can result in considerable charging cost reductions for EV users as compared to normal estimation and charging techniques. The proposed algorithm demonstrates a considerable improvement in the comprehensive index with a value of 0.645 as compared to existing charging strategies. Moreover, the proposed model predicts power requirements and facilitates reducing peak power consumption by scheduling EV charging and discharging procedures and utilizing surplus power in the electric vehicles’ battery to optimize grid/microgrid demands.

Author Contributions

Conceptualization, S.I. and S.H.; methodology, S.I. and S.H.; software, S.I., M.A. and S.H.; validation, S.H., A.S., E.M.A., A.u.R. and S.K.; formal analysis, A.S., M.A., E.M.A. and A.u.R.; investigation, T.K., S.I. and S.H.; resources, S.H., E.M.A. and S.K.; data curation, A.S. and A.u.R.; writing—original draft preparation, S.I.; writing—review and editing, S.I. and S.H.; visualization, S.H., S.I. and S.K.; supervision, T.K. and S.H.; project administration, S.I., S.H., E.M.A. and S.K.; funding acquisition, S.K. All authors have read and agreed to the published version of the manuscript.

Funding

The authors thank the support of the National Research and Development Agency of Chile (ANID), ANID/Fondap/15110019.

Institutional Review Board Statement

Not applicable.

Informed Consent Statement

Not applicable.

Data Availability Statement

Not applicable.

Conflicts of Interest

The authors declare no conflict of interest.

Abbreviations

V2GVehicle to Grid
G2VGrid to Vehicle
EVElectric Vehicle
EVCElectric Vehicle Charging
MCSMonte Carlo Simulation
SOCState of charge
HDIHigh-dimensional integral
MCSMCMonte Carlo Simulation Markov chain
FDIFinite-dimensional integral
PDFProbability distribution function
PDFProbability density function
MLEMaximum likelihood estimation
CSO Charging station operator
CSElectric Vehicle operator
EVAElectric vehicle aggregator
EV V2GElectric vehicle Vehicle to Grid
RERRenewable energy resources
DGsDistributed generations
DGRsDistributed generations resources
CSSCharging station system
BESBattery storage system

References

  1. Zhang, N.; Yu, K.; Chen, Z. How does urbanization affect carbon dioxide emissions? A cross-country panel data analysis. Energy Policy 2017, 107, 678–687. [Google Scholar] [CrossRef]
  2. Habib, S.; Khan, M.M.; Abbas, F.; Numan, M.; Ali, Y.; Tang, H.; Yan, X. A framework for stochastic estimation of electric vehicle charging behavior for risk assessment of distribution networks. Front. Energy 2020, 14, 298–317. [Google Scholar] [CrossRef]
  3. Ritter, A.; Widmer, F.; Niam, J.W.; Elbert, P.; Onder, C. Real-Time Graph Construction Algorithm for Probabilistic Predictions in Vehicular Applications. IEEE Trans. Veh. Technol. 2021, 70, 5483–5498. [Google Scholar] [CrossRef]
  4. Tushar, M.H.K.; Zeineddine, A.W.; Assi, C. Demand-side management by regulating charging and discharging of the EV, ESS, and utilizing renewable energy. IEEE Trans. Ind. Inform. 2017, 14, 117–126. [Google Scholar] [CrossRef]
  5. ur Rehman, A.; Ali, M.; Iqbal, S.; Shafiq, A.; Ullah, N.; Otaibi, S.A. Artificial Intelligence-Based Control and Coordina-tion of Multiple PV Inverters for Reactive Power/Voltage Control of Power Distribution Networks. Energies 2022, 15, 6297. [Google Scholar] [CrossRef]
  6. Xie, S.; Hu, X.; Xin, Z.; Li, L. Time-Efficient Stochastic Model Predictive Energy Management for a Plug-In Hybrid Electric Bus with an Adaptive Reference State-of-Charge Advisory. IEEE Trans. Veh. Technol. 2018, 67, 5671–5682. [Google Scholar] [CrossRef]
  7. Di Somma, M.; Graditi, G.; Siano, P. Optimal bidding strategy for a DER aggregator in the day-ahead market in the presence of demand flexibility. IEEE Trans. Ind. Electron. 2018, 66, 1509–1519. [Google Scholar] [CrossRef]
  8. Habib, S.; Khan, M.M.; Abbas, F.; Ali, A.; Hashmi, K.; Shahid, M.U.; Bo, Q.; Tang, H. Risk Evaluation of Distribution Networks Considering Residential Load Forecasting with Stochastic Modeling of Electric Vehicles. Energy Technol. 2019, 7, 1900191. [Google Scholar] [CrossRef]
  9. Iqbal, S.; Xin, A.; Jan, M.U.; Abdelbaky, M.A.; Rehman, H.U.; Salman, S.; Rizvi, S.A.A.; Aurangzeb, M. Aggregation of EVs for Primary Frequency Control of an Industrial Microgrid by Implementing Grid Regulation & Charger Controller. IEEE Access 2020, 8, 141977–141989. [Google Scholar] [CrossRef]
  10. Zendegan, S.; Ferrara, A.; Jakubek, S.; Hametner, C. Predictive Battery State of Charge Reference Generation Using Basic Route Information for Optimal Energy Management of Heavy-Duty Fuel Cell Vehicles. IEEE Trans. Veh. Technol. 2021, 70, 12517–12528. [Google Scholar] [CrossRef]
  11. Hu, X.; Martinez, C.M.; Yang, Y. Charging, power management, and battery degradation mitigation in plug-in hybrid electric vehicles: A unified cost-optimal approach. Mech. Syst. Signal Process. 2017, 87, 4–16. [Google Scholar] [CrossRef]
  12. Cai, S.; Matsuhashi, R. Model Predictive Control for EV Aggregators Participating in System Frequency Regulation Market. IEEE Access 2021, 9, 80763–80771. [Google Scholar] [CrossRef]
  13. Blanco, H.; Faaij, A. A review at the role of storage in energy systems with a focus on Power to Gas and long-term storage. Renew. Sustain. Energy Rev. 2018, 81, 1049–1086. [Google Scholar] [CrossRef]
  14. Golchoubian, P.; Azad, N.L. Real-Time Nonlinear Model Predictive Control of a Battery–Supercapacitor Hybrid Energy Storage System in Electric Vehicles. IEEE Trans. Veh. Technol. 2017, 66, 9678–9688. [Google Scholar] [CrossRef]
  15. Jan, M.U.; Xin, A.; Rehman, H.U.; Abdelbaky, M.A.; Iqbal, S.; Aurangzeb, M. Frequency Regulation of an Isolated Microgrid with Electric Vehicles and Energy Storage System Integration Using Adaptive and Model Predictive Controllers. IEEE Access 2021, 9, 14958–14970. [Google Scholar] [CrossRef]
  16. Yu, H.; Zhang, F.; Xi, J.; Cao, D. Mixed-Integer Optimal Design and Energy Management of Hybrid Electric Vehicles With Automated Manual Transmissions. IEEE Trans. Veh. Technol. 2020, 69, 12705–12715. [Google Scholar] [CrossRef]
  17. Wang, J.; Bharati, G.R.; Paudyal, S.; Ceylan, O.; Bhattarai, B.P.; Myers, K.S. Coordinated electric vehicle charging with reactive power support to distribution grids. IEEE Trans. Ind. Inform. 2018, 15, 54–63. [Google Scholar] [CrossRef]
  18. Iqbal, S.; Xin, A.; Jan, M.U.; ur Rehman, H.; Masood, A.; Rizvi, S.A.A.; Salman, S. Aggregated Electric Vehicle-to-Grid for Primary Frequency Control in a Microgrid—A Review. In Proceedings of the 2018 IEEE 2nd International Electrical and Energy Conference (CIEEC), Beijing, China, 4–6 November 2018; pp. 563–568. [Google Scholar] [CrossRef]
  19. Xiong, R.; Tian, J.; Shen, W.; Sun, F. A Novel Fractional Order Model for State of Charge Estimation in Lithium Ion Batteries. IEEE Trans. Veh. Technol. 2019, 68, 4130–4139. [Google Scholar] [CrossRef]
  20. Robert, F.C.; Sisodia, G.S.; Gopalan, S. A critical review on the utilization of storage and demand response for the implementation of renewable energy microgrids. Sustain. Cities Soc. 2018, 40, 735–745. [Google Scholar] [CrossRef]
  21. Habib, S.; Abbas, G.; Jumani, T.A.; Bhutto, A.A.; Mirsaeidi, S.; Ahmed, E.M. Improved Whale Optimization Algorithm for Transient Response, Robustness, and Stability Enhancement of an Automatic Voltage Regulator System. Energies 2022, 15, 5037. [Google Scholar] [CrossRef]
  22. Gazafroudi, S.; Corchado, J.M.; Keane, A.; Soroudi, A. Decentralised flexibility management for EVs. IET Renew. Power Gener. 2019, 13, 952–960. [Google Scholar] [CrossRef]
  23. Zhang, T.; Zhao, C.; Sun, X.; Lin, M.; Chen, Q. Uncertainty-Aware Energy Management Strategy for Hybrid Electric Vehicle Using Hybrid Deep Learning Method. IEEE Access 2022, 10, 63152–63162. [Google Scholar] [CrossRef]
  24. Ahmed, M.; Mohamed, E.A.; Elmelegi, A.; Aly, M.; Elbaksawi, O. Optimum Modified Fractional Order Controller for Future Electric Vehicles and Renewable Energy-Based Interconnected Power Systems. IEEE Access 2021, 9, 29993–30010. [Google Scholar] [CrossRef]
  25. Peng, C.; Zou, J.; Lian, L.; Li, L. An optimal dispatching strategy for V2G aggregator participating in supplementary frequency regulation considering EV driving demand and aggregator’s benefits. Appl. Energy 2017, 190, 591–599. [Google Scholar] [CrossRef]
  26. Chen, H.; Xiong, R.; Lin, C.; Shen, W. Model predictive control based real-time energy management for hybrid energy storage system. CSEE J. Power Energy Syst. 2021, 7, 862–874. [Google Scholar] [CrossRef]
  27. Crow, M.L. Electric vehicle scheduling considering co-optimized customer and system objectives. IEEE Trans. Sustain. Energy 2017, 9, 410–419. [Google Scholar]
  28. Habib, S.; Khan, M.M.; Abbas, F.; Tang, H. Assessment of electric vehicles concerning impacts, charging infrastructure with unidirectional and bidirectional chargers, and power flow comparisons. Int. J. Energy Res. 2018, 42, 3416–3441. [Google Scholar] [CrossRef]
  29. Habib, S. Contemporary trends in power electronics converters for charging solutions of electric vehicles. CSEE J. Power Energy Syst. 2020, 6, 911–929. [Google Scholar] [CrossRef]
  30. Hou, J.; Zeng, H.; Zhu, J.; Hou, J.; Chen, J.; Ma, K.-K. Deep Quadruplet Appearance Learning for Vehicle Re-Identification. IEEE Trans. Veh. Technol. 2019, 68, 8512–8522. [Google Scholar] [CrossRef]
  31. Dong, C.; Sun, J.; Wu, F.; Jia, H. Probability-Based Energy Reinforced Management of Electric Vehicle Aggregation in the Electrical Grid Frequency Regulation. IEEE Access 2020, 8, 110598–110610. [Google Scholar] [CrossRef]
  32. Iqbal, S.; Xin, A.; Jan, M.U.; Abdelbaky, M.A.; Rehman, H.U.; Salman, S.; Aurangzeb, M.; Rizvi, S.A.A.; Auragzeb, N.M.; Shah, N.A. Improvement of Power Converters Performance by an Efficient Use of Dead Time Compensation Technique. Appl. Sci. 2020, 10, 3121. [Google Scholar] [CrossRef]
  33. Lei, Z.; Sun, D.; Liu, J.; Chen, D.; Liu, Y.; Chen, Z. Trip-Oriented Model Predictive Energy Management Strategy for Plug-in Hybrid Electric Vehicles. IEEE Access 2019, 7, 113771–113785. [Google Scholar] [CrossRef]
  34. Iqbal, S.; Xin, A.; Masood, A.; Jan, M.U.; ur Rehman, H.; Masood, A.; Rizvi, S.A.A.; Salman, S. Impact of Charging Station Operator (CSO) on V2G Method for Primary Frequency Control (PFC) in an Industrial Microgrid. In Proceedings of the 2019 IEEE 3rd Conference on Energy Internet and Energy System Integration (EI2), Changsha, China, 8–10 November 2019; pp. 100–105. [Google Scholar]
  35. Liu, H.; Yang, Y.; Qi, J.; Li, J.; Wei, H.; Li, P. Frequency droop control with scheduled charging of electric vehicles. IET Gener. Transm. Distrib. 2017, 11, 649–656. [Google Scholar] [CrossRef]
  36. Alam, M. Day-Ahead Electricity Price Forecasting and Scheduling of Energy Storage in LMP Market. IEEE Access 2019, 7, 165627–165634. [Google Scholar] [CrossRef]
  37. Khooban, M.H.; Gheisarnejad, M. A Novel Deep Reinforcement Learning Controller Based Type-II Fuzzy System: Frequency Regulation in Microgrids. IEEE Trans. Emerg. Top. Comput. Intell. 2020, 5, 689–699. [Google Scholar] [CrossRef]
  38. Zhao, M.; Zhang, R.; Lin, C.; Zhou, H.; Shi, J. Stochastic Model Predictive Control for Dual-Motor Battery Electric Bus Based on Signed Markov Chain Monte Carlo Method. IEEE Access 2020, 8, 120785–120797. [Google Scholar] [CrossRef]
Figure 1. An overview of a V2G charging station linked to the grid.
Sustainability 14 13211 g001
Figure 2. Impact of EV charging strategy and charging scheduling factors on the grid.
Sustainability 14 13211 g002
Figure 3. Evaluation of the effect of load on the grid.
Sustainability 14 13211 g003
Figure 4. Simulation algorithm for model 1.
Sustainability 14 13211 g004
Figure 5. EV charging at home.
Sustainability 14 13211 g005
Figure 6. Electric vehicle home-charging demand calculation by using MCS.
Sustainability 14 13211 g006
Figure 7. Electric vehicle mobility and charging flexibility for model 2.
Sustainability 14 13211 g007
Figure 8. Flowchart for selecting the best distribution function.
Sustainability 14 13211 g008
Figure 9. The daily travel pattern of an electric vehicle.
Sustainability 14 13211 g009
Figure 10. An electric vehicle’s frequency of daily travel.
Sustainability 14 13211 g010
Figure 11. Daily mileage for each journey.
Sustainability 14 13211 g011
Figure 12. Everyday driving mileage for each trip.
Sustainability 14 13211 g012
Figure 13. The trip’s start time.
Sustainability 14 13211 g013
Figure 14. Trip departure time on a daily basis.
Sustainability 14 13211 g014
Figure 15. Electric vehicle distribution in 24 h.
Sustainability 14 13211 g015
Figure 16. Total load and electric vehicle discharge capacity in 2020.
Sustainability 14 13211 g016
Figure 17. Total load and electric vehicle discharge capacity in 2022.
Sustainability 14 13211 g017
Figure 18. MCMCS flowchart for estimating EV charging/discharging behavior.
Sustainability 14 13211 g018
Table 1. Characteristics of EV battery.
FeaturesSpecifications
Battery Lithium-ion Battery
Capacity of EV batter72 Volt (100Ah)
Battery nominal voltage72 Volt
Nominal capacity of battery112 Ah
Distinctive capacity of EV battery116 Ah
Accomplished charging voltage85.5 Volt + 0.05 Volt
Accomplished discharging voltage65.5 Volt
Battery charging time of EV4.5 h (0.33C)
Method of EV battery chargeStandard
(85.5 Volt and CV at 0.333 C.A)
Fast EV charging method(85.5 Volt and CV at 1.0 C.A)
Maximum discharging current240 amperes
Table 2. Five different scenarios’ statistical parametric values for MCSMC and the standard statistical estimate technique.
ScenarioForecast ValueSkewnessKurtosisVariance
M.L.EMCSMCM.L.E MCS.MCM.L.EMCSMCM.L.EMCS.MC
i12.087.502.61.608.402.8891.1273.90
ii25.1020.871.540.531.320.80230.08143.88
iii9.965.253.781.7416.502.92131.3551.00
iv 24.8215.101.760.522.000.50195.98188.96
v19.0613.521.940.903.050.15224.98148.05
Table 3. A comprehensive index analysis of several pricing techniques.
Parametric SymbolsExisting Charging StrategyProposed Charging Strategy
Load5358.305354.45
Peak Load308.32302.18
Saving0.1520.642
Average Load54.1854.95
Daily Trip0.9850.982
CI0.5330.645
Publisher’s Note: MDPI stays neutral with regard to jurisdictional claims in published maps and institutional affiliations.

