1. Introduction
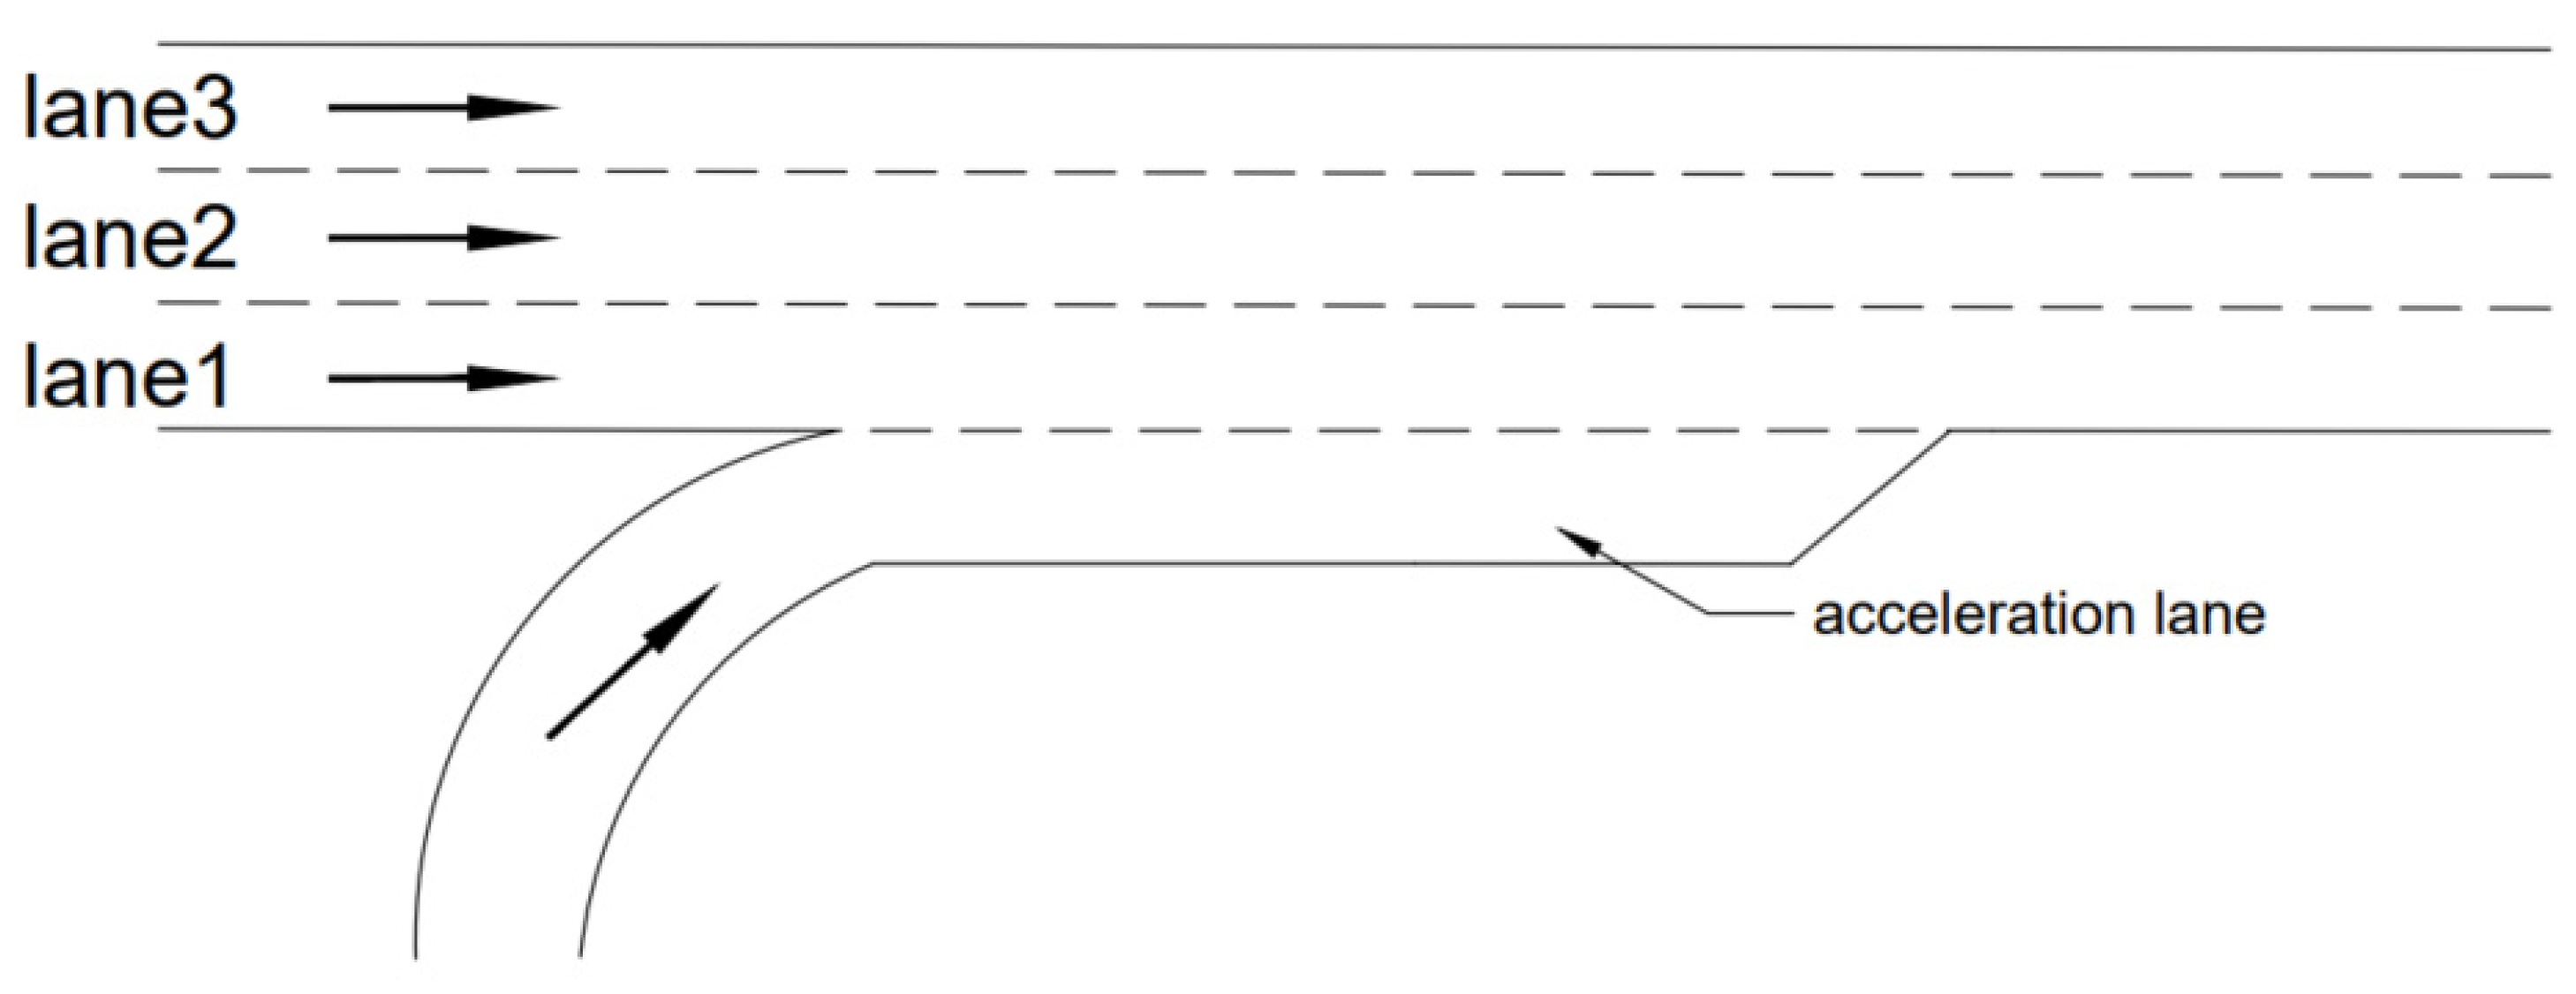
A ramp is a dedicated road connecting two freeways, which vehicles use to complete enter and leave highways. The merging behavior of freeway ramps is the main factor affecting the continuity of freeway-traffic flow, which determines the capacity of central lines and ramps. As shown in
Figure 1, the traffic on the main line at the ramp entrance merges with the traffic entering the ramp. The on-ramp vehicle accelerates in the acceleration lane, looking for an acceptable insertion gap in the road. Traffic flows on adjacent main lines are merged into direct traffic [
1,
2]. Studies have shown a high probability of accidents caused by vehicle collisions in the merging area [
3]. One of the essential reasons for this is that drivers forcibly merging into the main line [
4]. Traffic accidents in China’s freeway merging areas account for about 30% of the total number of casualties. In these accidents, security at the entrance is the most prominent problem [
5]. Therefore, it is worth analyzing the traffic-operation conditions at junctions. Wen Huiying [
6] et al. modeled and examined merging areas. The study showed that in the case of human-driven vehicles when the main line traffic speed is less than 27 m/s and the flow rate is less than 1000 veh/h, the merging area has a higher traffic efficiency and safety level. Hua et al. [
7] studied the characteristics of traffic flow in the merging area when ACC (adaptive cruise control) vehicles are involved. The numerical simulation of the mixed-traffic-flow model shows that the involvement of ACC vehicles can effectively improve the operation of the traffic flow in the on-ramp system, reduce the impact of events such as merging on the process of the traffic flow, suppress the temporal and spatial scope and intensity of traffic congestion, and improve the traffic flow. In particular, reducing the expected headway and psychological lane-changing parameters of ACC vehicles can improve the speed and flow of mixed traffic.
ACC (adaptive cruise control) is a vehicle-longitudinal-movement-control technology. It uses onboard measurement equipment to obtain real-time headway and speed information from the vehicle ahead. It applies acceleration-optimization algorithms to control the car and the vehicle’s front end to maintain stable forward movement. This is automatic driving—an essential part of automotive technology. Drivers of vehicles are slow to respond, and self-driving cars have the characteristics of fast acceleration and high levels of driving safety, which can effectively avoid the problem of slow driver responses. The hybrid stage of ACC and manually driven vehicles is the focus of the current development from manually driven cars to fully automated vehicles [
8,
9,
10,
11,
12,
13,
14]. Davis et al.‘s vehicle-following model [
15] simulates mixed traffic flow between ACC vehicles and human-driven vehicles in the ramp’s convergence area. The traffic flow’s local stability when ACC vehicles are present [
16] was analyzed. An ACC with related information was proposed. Vehicles can reduce the time taken to pass through bottlenecks during traffic restrictions, thereby effectively alleviating traffic congestion [
17]. Ioanniu et al.’s follow-the-leader model is also used to analyze the sensitivity of ACC vehicles to the behavior of cars in adjacent lanes changing lanes. It was found that the smooth road-changing method of ACC vehicles can effectively reduce the impact on traffic flow [
18]. Rezaur et al.‘s simulation model, featuring SUMO, uses actual traffic data to correct vehicle-driving parameters and Time to Collision (TTC) and Deceleration Rate Collision Avoidance (DRAC) as vehicle-crash-assessment metrics, demonstrating that the number of vehicle collisions can be reduced by about 50% when the rate of ACCs is 25% [
19]. Therefore, mixing ACC vehicles can improve the safety and efficiency of the merging area to a certain extent.
Chinese law stipulates that the maximum speed limit of freeways should not exceed 120 km/h. However, as road standards and vehicle performance have become increasingly advanced, people’s awareness of quality and safety has also improved. Some of the better straight freeways have a maximum speed limit of more than 120 km/h. Accordingly, people’s expectations of speed increases have themselves increased. Presently, the design speed of freeways in developed countries is generally higher than in our country, and there is a tendency to increase the speed limit further. For example, the speed limit of freeways in the United States is 129 km/h (80 miles/h), and the speed limit of freeways in France, Switzerland, Austria, and other countries is 130 km/h. Italy has raised the maximum speed limit to 140 km/h, and some German freeways do not even set a speed limit [
20]. He Yongming [
21,
22,
23,
24] proposed the concept of the super-freeway and demonstrated the feasibility of freeway construction and the necessity of development. Freeways are divided into three levels, 100 km/h–160 km/h super-level artificial freeways, 140 km/h–200 km/h driver-assisted or automatic-driving super-level II freeways, and super-level III freeways. Freeways are negotiated by fully autonomous vehicles at 180 km/h–240 km/h. Bao Yuhan [
25] studied the safety-based manual driving vehicle and the comfort-based top speed, which were 148 km/h and 140 km/h, respectively. Therefore, it is feasible to increase the maximum speed limit of freeways from the current 120 km/h to 140 km/h.
Since it is illegal and unsafe to conduct actual vehicle experiments over 120 km/h, this experiment was completed through a SUMO simulation. First, we used the default parameters to simulate and compare with actual traffic conditions, analyze the data obtained by the road detector, and manually modify the parameters until the simulated data were consistent with the actual traffic parameters. SUMO is an open-source microscopic-simulation software developed based on the Python language. It can carry out the continuous and convenient simulation and control of traffic flow and supports large-scale road network simulation. Compared with VISSIM, SUMO can operate a variety of car-following models, such as Krauss, IDM, PWagner2009, and it makes it straightforward to carry out secondary development, modifying different car-following models for various studies. Analyzing the traffic-flow operating conditions of ACC vehicles and human-powered vehicles with different mixing ratios and speed-limit conditions provides a theoretical basis for increasing the speed-limit value of freeways after the mixture ratio of autonomous driving vehicles is increased in the future.
The rest of this paper is organized as follows.
Section 2 describes the simulated environment and acquired data.
Section 3 analyzes, processes, and visualizes the received data, and explains each type of characteristic traffic-flow data.
Section 4 analyzes traffic efficiency.
Section 5 analyzes traffic safety.
Section 6 concludes the paper and discusses future work.
2. Simulation Description and Available Data
This study used a road section of an on-ramp in Beijing as the object, as shown in
Figure 2. The simulation-experiment section was a one-way three-lane freeway, and the number of on-ramp lanes was 1. In
Figure 2, the direction of the arrow is the direction of traffic flow, and the main road comprises the first, second, and third lanes from bottom to top. The detector was placed 150 m upstream and downstream of the weaving area; only cars were considered. The Wiedemann vehicle-following model is based on physiological–psychological driving behavior. Since the driver of the rear vehicle cannot accurately judge the speed of the front car, the speed of the rear vehicle will be lower than the speed of the front car for some time until the distance between the front and rear vehicles reaches another psychological safety distance, at which point the driver of the rear car starts to accelerate. The cycle is formed—an iterative process of acceleration and deceleration. The model fully considers the influence of the driver’s physiological and psychological factors on driving behavior. The Wiedemann driving-behavior model includes W74 and W99. The W74 model is suitable for general urban roads, and the W99 model is ideal for freeways. Therefore, this paper uses W99 as the following model for the driver to control the vehicle. The W99 has ten selectable control parameters, which are: CC0 (average parking distance); CC1 (desired headway); CC2 (random oscillation distance for car-following); CC3 (the threshold for entering the following state); CC4/CC5 (the threshold of the following state); CC6 (vehicle speed oscillation); CC7 (acceleration oscillation); CC8 (static startup acceleration); and CC9 (acceleration at a speed of 80 km/h).The ACC model is based on the automatic control system, which collects the distance information from the vehicle in front through the car’s sensors. According to the driving state of the vehicle in front and the car, the driving behavior is determined by the onboard computer to select the vehicle’s driving condition. ACC is the initial stage of autonomous driving, and it is also the automotive autonomous driving technology that is currently applied. Therefore, in this study, Wiedemann 99 and the ACC model were used as the car-following model in the driving behavior in the freeway-ramp-merging scene, and the driving-behavior parameters were corrected according to the actual driving situation. When the default value is selected for simulation, it is difficult for the vehicle to change lanes; therefore, the car cannot enter the main line. However, making it too easy to change lanes often results in a smaller time-to-vehicle distance, which increases the number of vehicle collisions, improves road capacity, and distorts the simulation. While adjusting the lane-changing behavior, the main parameter for adjusting the car-following model was CC1 (desired headway).
The W99 is a driver-controlled vehicle. Drivers with different personalities have different levels of willingness to change lanes. The ACC vehicle is controlled by a computer, which eliminates the driver’s subjective willingness. The car in the ACC model is set to 1. The vehicle characteristics are shown in
Table 1.
According to the research conclusions of Baoyuhan [
25], from the perspective of driving comfort and fuel economy, 140 km/h is the most likely maximum speed limit to be applied next. Therefore, in this experiment, the maximum speed limit was increased to 140 km/h (120 km/h for trucks) compared with the current top speed limit of 120 km/h (100 km/h for trucks). The vehicle types and traffic requirements selected for the simulation are shown in
Table 2, below. To study the road-traffic conditions under different conditions of main-road flow, according to the service level of the basic sections of freeways in our country and the maximum service traffic volume of grades 1 to 4, the main road flow was set to 3000–6000 veh/h. When ACC was 100%, the main line flow was (3000–7000), the proportion of trucks was 10%, and the interval was 1000 veh/h, among which W99 and ACC had different ratios; the ramp flow was set to 500 veh/h, and the vehicle-type ratio was consistent with the main line.
The radar detectors and loop detectors were set up in the interval 100 m upstream of the mainline at the freeway-ramp-convergence location, in the merging zone, and downstream of the merging zone, respectively. The simulation interface and detector-deployment scheme are shown in
Figure 2. During the simulation run, we obtained detailed traffic-operation parameters, including:
The number of vehicles, average speed, and time occupancy (collected by loop detector);
The individual vehicle speed, space occupancy, and vehicle-lane-change rate (collected by radar detector);
In summary, for the studied road sections, we ensured that sufficent detailed data were obtained for analysis to present a wide range of traffic conditions.
3. Traffic Distribution
3.1. Effects of Increasing Speed Limit and Different Proportions of ACC on Traffic Flow
Figure 3 shows the traffic-flow–occupancy relationship plotted by the data obtained from the detector for different ACC vehicle percentages and speed limits.
Figure 3 shows the traffic-flow–occupancy (all lanes) plots measured at the ramp-merge-road area for different maximum speed limits and ACC-vehicle-mix ratios.
Figure 3a–d show the raw minute data demonstrating the traffic status. The obtained results are shown in the following table (
Table 3).
Comparing the mixed states of different ACC vehicles, the maximum traffic volume on the road increased with the proportion of ACC vehicles. When the mixing ratio is 33% and 66%, the road occupancy rate decreased when the vehicles without ACC were mixed. A larger distance was maintained during the merging process, and the process of cooperative lane changing was smoother. When all the cars were ACC, the road reached the maximum traffic volume and the highest road-occupancy rate. This shows that the distance between the vehicles was low, and lane changing was completed simultaneously, reducing the impact of lane-changing behavior on traffic flow. However, the increase in the maximum speed limit did not significantly improve the road capacity of the main line at the ramp intersection.
3.2. Traffic-Flow Distribution of Each Lane at the Ramp Convergence
The traffic-flow-operation characteristics of each lane are shown in
Table 4 and
Table 5.
Based on the data acquired by the loop detector and radar detector, we collected traffic-flow data for each lane, including the flow rate, speed, vehicle density, and headway spacing.
According to the collection of data, the state of the traffic flow can be divided into two forms, according to the main-line traffic flow:
- (1)
When the traffic volume of the main line is less than or equal to 4000 veh/h (low flow), the density of the vehicles on the road is low, and a large distance is maintained between cars. When vehicles merge into the acceleration lane, there is a large gap. However, when vehicles join, this still significantly affects the main line’s traffic flow. When there are no ACC vehicles, the speed of lane 1 drops the most, and lanes 2 and 3 also decrease. The merging of vehicles disrupts the original regular traffic flow. After the ACC vehicles are mixed in, the speed of all three lanes increases, reducing the interference of cars merging. ACC vehicles can effectively cooperate to complete lane changes in low-traffic conditions.
- (2)
When the traffic volume of the main line is greater than or equal to 5000 veh/h (high flow), the vehicle density on the road is high, the distance between vehicles is low, and the road traffic flow operation is easily affected by the influx of cars in the acceleration lane. After the vehicles merge, the running speed of the main street is reduced to (18–90 km/h), and the first lane is reduced to the greatest extent. An increase in the proportion of ACC vehicles increases the speed, which is at its maximum when only ACC vehicles are present.
After the ACC vehicles are mixed, the road speed is increased, the headway is increased, and the speed difference and density difference between the lanes can be reduced, indicating that ACC vehicles can adjust the traffic state between the lanes so that the car distribution between lanes is more even. The increase in the maximum speed limit significantly improves the speed of operations. The increase in speed leads to a rise in the distance between vehicles. Vehicles need to maintain a greater distance to maintain safe driving. However, the lane-changing behavior caused by merging vehicles can easily lead to traffic accidents. The severity of these accidents is also higher. Therefore, we need to comprehensively evaluate the traffic efficiency and safety of the road and analyze the impact of different maximum speed limits and proportions of ACC vehicles on the efficiency and safety of actual freeway operations.
4. Transportation-Efficiency Analysis
Brilon, a German traffic-engineering scholar, defined freeway-capacity efficiency as the measure of vehicle-kilometers (veh*km/h) of transportation completed by a freeway facility per unit of time, expressed as the product of traffic flow per unit of time and the average travel speed of the traffic stream (see Equation (1)). He believes that freeway-throughput efficiency is not only required for the maximum number of vehicles, but a should also focus on completing transportation at a faster speed and in a shorter time. Brilon‘s definition of throughput efficiency takes into account both the flow rate of the road section and the speed of the traffic flow, which is in line with the management objectives of the freeway. Tjerefore, Equation (1) is used to calculate the road-throughput efficiency in all the studies in this paper.
—efficiency of passage, veh. km/h;
—traffic volume, veh/h;
—the average speed of the vehicle, km/h;
—time, h.
The number of vehicles (
Q) and the average vehicle speed (
V) of each lane passing through the downstream section of the ramp-intertwining zone in 600–2400S were selected.
—the total number of vehicles passing through the cross-section;
—the number of vehicles passing through lane-one cross-section;
—the number of vehicles passing through lane-two cross-section;
—the number of vehicles passing through lane-three cross-section;
—average speed through lane one;
—average speed through lane two;
—average speed through lane three.
Data extraction was performed for scenarios in which the mainline traffic is greater than 4000 veh/h to analyze the efficiency of ACC vehicles with different speed limits and mixing ratios.
According to the traffic volume and average speed of each lane shown in
Table 4 and
Table 5, the traffic efficiency values of different scenarios were calculated by Formula (1). According to
Figure 4,
Table 6 and
Table 7, increasing the speed limit improves the traffic efficiency of the road in different scenarios. At the same time, mixing ACC vehicles improves traffic efficiency, and traffic efficiency also increases with the increase in ACC vehicles. At the same time, increasing the maximum speed limit can also enhance the efficiency of road traffic.
Through the simulation and comparison of different mixture ratios of ACC vehicles and the maximum speed limit of 140 km/h and 120 km/h, the vehicle-operation efficiency and safety evaluation on the freeway on-ramp, this study shows that when the speed limit is 120 km/h, when the ACC vehicle-mixing ratio is 33%, 66%, and 100%, the traffic efficiency is increased by 14.54%, 58.92%, and 165.61%, respectively. When the speed limit is 140 km/h, it is increased by 16.18%, 72.87%, and 150.03%. Compared with the speed limit of 120 km/h and the speed limit of 140 km/h, the mixed ratios of the different ACC vehicles increased by 22.7%, 24.46%, 33.48%, and 15.51%, respectively. Therefore, the inclusion of ACC vehicles can improve traffic-flow efficiency, and the higher the mixing ratio of ACC vehicles, the higher the traffic efficiency. At the same time, increasing the maximum speed limit can also improve the efficiency of traffic.
5. Road Safety Analysis
Solomon [
26] proposed, through research and analysis, that excessive speed dispersion affects driving safety and obtained the accident rate and speed. Cirillo [
27], West [
28], and others also analyzed the relationship between accidents and speed discreteness and obtained the same conclusion as Solomon. They all believed that the greater the speed discreteness, the worse the driving safety. Liu and Popoff [
29] studied the relationship between the accident-casualty rate and the speed/speed difference, showing that speed and discreteness are not conducive to driving safety. Pei Yulong and Cheng Guozhu [
30] investigated some freeways in our country. The relationship between the accident rate and the speed difference also shows that the larger the speed difference, the worse the driving safety. The greater the speed dispersion, the more likely it is to cause rear-end collisions, and the frequency of lane changing increases, which is detrimental to driving safety. The head-to-head distance represents the time difference between the front ends of the two vehicles before and after passing through an exact location. Generally, it can be calculated by dividing the head-to-head distance of the front and rear vehicles by the speed of the rear vehicle. The headway represents the maximum reaction time of the driver behind when the front car brakes. It is an essential indicator for evaluating driving safety, closely related to traffic-flow composition and driving behavior. The minimum safety distance equation (MSDE) is a road-safety-evaluation index first proposed by Sivanaga S. Yadlapati and others in 2004. During the driving process of the vehicle, when the speed of the vehicle behind is greater than that of the vehicle in front, there is the possibility of a rear-end collision. If the distance between the front and rear vehicles is sufficiently large or the speed difference between the two vehicles is small, the vehicle behind experiences a rear-end collision. When the distance difference is considered alone, the shorter the distance between the two cars, the shorter the braking distance left for the rear car, and the greater the probability of an accident; when the speed difference is considered alone, if the speed of the rear vehicle is significantly greater than that of the front car, the time taken by the rear vehicle to catch up with the front car is shorter, and the probability of an accident increases accordingly. Some studies have shown a correlation between the lane-changing rate (the average number of lane-changing times per vehicle per unit time and length of road section) and the traffic-accident rate. Overtaking causes greater disturbance to traffic flow. The minimum-safe-distance evaluation index fully considers the distance and speed between the front and rear vehicles. It gives the relationship between the accident risk and these two factors. Therefore, road areas with frequent lane changes were analyzed, and the minimum safe distance was selected as the safety-evaluation index.
5.1. Regional Statistical Analysis of Lane Changes
According to the analysis of the distribution of the number of lane changes on some sections of the road, lane-change behavior is concentrated in the 2000–2725 m section because the vehicles in the acceleration lane must change to the adjacent road. Therefore, this study counted the number of lane changes related to the acceleration lane and the number of lane changes without the acceleration lane, respectively, as shown in
Figure 5.
Since the vehicles in the acceleration lane must change lanes to lane 1 during main-line operation, the number of lane changes including the acceleration lane
Figure 5a–d and the lane changes = not including the acceleration lane
Figure 5e–h were counted separately counted. It can be seen from the figure that the lane-changing behavior of the vehicles was mainly distributed at 2000–2725 m, that is, 270 m upstream of the ramp entrance to the end of the ramp-merging area.
According to the data shown in
Table 8, the number of lane changes of vehicles increases the proportion of ACC vehicles. When the traffic density on the road is high, the lane-changing behavior of vehicles disrupts the typical passage of cars in other lanes and increases the probability of traffic accidents. Therefore, a security analysis of this area was performed.
5.2. Minimum-Safe-Distance Analysis
The minimum safe distance (MSDE) was selected as the safety-evaluation index for the road (2000–2750 m) area with a high incidence of lane-changing behavior.
—Front-vehicle speed(km/h);
—Rear-car speed(km/h);
—Headway time;
—Vehicle-safety time;
—Road-friction coefficient;
—Slope;
—Perceived reaction time of the driver behind;
—Lifting-of-foot-to-effective-braking time;
—Braking-start-to-braking-end time.
According to related research [
31], t1 is 0.18 s, t2 is 0.17 s, t3 is 1~1.15 s, and PRT = 2.5~3.0 s. In this paper, PRT = 2.5 s. Since the onboard computer controls the ACC vehicle, the PRT time of the ACC vehicle is 0. When MSDE > 0, the traffic is safe, and traffic accidents are unlikely. The larger the MSDE value, the greater the safety. When MSDE < 0, there is the possibility of a collision between two vehicles, and the smaller the MSDE value and the larger the absolute value, the more dangerous the traffic. As shown in
Figure 6,
Table 9 and
Table 10, for the analysis of the MSDE values in different scenarios, the higher the mixture ratio of ACC vehicles, the greater the average value of the MSDE. However, the most significant aspect of safety evaluation is the safety-evaluation index—the smaller the MSDE value, the lower the safety of road operations. Therefore, the lowest MSDE value of each experimental group was selected as the evaluation index. When the speed limit was 120 km/h, compared with the ACC vehicles, when the mixing ratio was 0%, the mixing ratio was 33%, 66%, and 100%, and the traffic efficiency was increased by 8.97%, 1.43%, and 502.21%, respectively. At 140 km/h, the increases were 24.30%, 46.11%, and 303.19%, respectively. Compared with the speed limit of 120 km/h and the speed limit of 140 km/h, the mixture ratios of different ACC vehicles were −6.37%, +6.8%, +34.87%, and −37.31%, respectively. Therefore, ACC vehicles can improve the safety of traffic; when ACC vehicles are used exclusively, the safety is significantly improved. Safety is reduced when the maximum speed limit is increased at 0% ACC. However, safety is improved when ACC vehicles are included, indicating the safety risk of increasing the maximum speed limit when vehicles are manually driven. ACC vehicles can eliminate this risk.
6. Discussion and Conclusions
We considered a new freeway-access rule, increasing the original maximum speed limit from 120 km/h to 140 km/h while adding ACC vehicles, to explore the impact of increasing the speed limit on the efficiency and safety of on-ramp access.
For the evaluation of traffic efficiency, Hong tan et al. [
32] studied the impact of ACC vehicles on traffic safety. The conclusion shows that with 100% ACC-vehicle occupancy the number of fatalities and accidents caused by traffic accidents is effectively reduced. Hua Xuedong [
7] introduced parameters that characterize drivers’ lane-changing psychology. Through a numerical simulation, it was found that reducing the expected headway and increasing the lane-changing psychology of ACC vehicles can improve the speed and flow of mixed traffic. Rotem et al. [
33] studied the overtaking behavior of ACC vehicles and concluded that ACC vehicles can reduce overtaking frequency. Bernat et al. [
34] evaluated the behavior of ACC vehicles in congestion through a micro-simulation, and concluded that ACC vehicles may relieve congestion. In a manner that was consistent with this study’s conclusions, ACC vehicles positively affected traffic efficiency, and traffic efficiency increased with the increased ratio of ACC vehicles. At the same time, increasing the maximum speed limit can also effectively improve traffic efficiency.
For safety evaluation, Tienan li et al. [
35] used the actual macro basic diagram to find that the ACC sets the minimum following distance, and the traffic capacity of a single lane can exceed 3500 veh/h. However, during crowding, the fluctuation of the vehicle is greater than that of manual-drive cars, which may be dangerous. Yuntao Shi et al. [
36] conducted a safety study on mixing ACC vehicles. The results showed that the mixed traffic flow is more dangerous when the penetration rate of ACC vehicles is low compared to traffic flows with manual driving only. Similar to the findings of this paper, the safety improvement was not apparent when the ACC vehicle-mix-ratio was low, and when the vehicle was fully manually driven, increasing the maximum speed limit reduced safety. The safety can be effectively improved only when the ACC ratio is high.
In this paper, the simulation model verified that the mixing of ACC vehicles can improve the efficiency and safety of vehicle traffic and, at the same time, it demonstrated the necessity of increasing the maximum speed limit to 140 km/h. However, there are still some limitations to this study. In setting the simulation scene, only the two-way six-lane freeway was selected as the experimental scene, and no research on two-way four-lane or two-way eight-lane freeways was carried out. In the merging areas of ramps, the safety improvement provided by ACC vehicles when their ratio is low is limited. CACC can achieve communication between cars, and vehicles can work well together when changing lanes, which may effectively improve road-traffic safety, which will be the focus of future research.
Author Contributions
Conceptualization, L.L.; methodology, L.L.; software, Y.B.; validation, L.L.; formal analysis, L.L.; investigation, L.L.; resources, L.L.; data curation, L.L.; writing—original draft preparation, Q.Y.; writing—review and editing, L.L.; visualization, L.L.; supervision, L.W.; project administration, Q.Y.; funding acquisition, Q.Y. All authors have read and agreed to the published version of the manuscript.
Funding
This research received no external funding.
Conflicts of Interest
The authors declare no conflict of interest.
References
- Wang, L. Research on the Capacity of Freeway On-Ramp Junction; Southeast University: Nanjing, China, 2005. [Google Scholar]
- Wang, J.-h. Research on Characteristics and Influence of Heavy Vehicles’ Merging Behavior Near Expressway On-Ramps; School of Transportation Southeast University: Nanjing, China, 2020. [Google Scholar]
- Ahammed, M.A.; Hassan, Y.; Sayed, T.A. Modeling driver behavior and safety on freeway merging areas. J. Transp. Eng. 2008, 134, 370–377. [Google Scholar] [CrossRef]
- Yang, H.; Ozbay, K. Estimation of Traffic Conflict Risk for Merging Vehicles on Highway Merge Section. Transp. Res. Rec. 2011, 2236, 58–65. [Google Scholar] [CrossRef]
- Wang, X.; Hadiuzzaman, M.; Qiu, T.Z.; Yan, X. Sensitivity analysis of freeway capacity at a complex weaving segment. In Proceedings of the 14th COTA International Conference of Transportation Professionals, Changsha, China, 4–7 July 2014; pp. 596–608. [Google Scholar]
- Wen, H.Y.; Wu, J.B.; Qi, W.W. CP-CS Fusion Model for on-ramp merging area on the highway. J. South China Univ. Technol. 2020, 48, 50–57. [Google Scholar]
- Xue-Dong, H.; Wei, W.; Hao, W. A hybrid traffic flow model with considering the influence of adaptive cruise control vehicles and on-ramp. Acta Phys. Sin. 2016, 65, 223–235. [Google Scholar] [CrossRef]
- Vollrath, M.; Schleicher, S.; Gelau, C. The influence of cruise control and adaptive cruise control on driving be-havior-a driving simulator study. Accid. Anal. Prev. 2011, 43, 1134–1139. [Google Scholar]
- Yu, S.; Shi, Z. The effects of vehicular gap changes with memory on traffic flow in cooperative adaptive cruise control strategy. Phys. A Stat. Mech. Its Appl. 2015, 428, 206–223. [Google Scholar] [CrossRef]
- Bose, A.; Ioannou, P. Mixed manual/semi-automated traffic: A macroscopic analysis. Transp. Res. Part C Emerg. Technol. 2003, 11, 439–462. [Google Scholar] [CrossRef] [Green Version]
- Kesting, A.; Treiber, M.; Schonhof, M.; Helbing, D. Adaptive cruise control design for active congestion avoidance. Transp. Res. Part C Emerg. Technol. 2008, 16, 668–683. [Google Scholar] [CrossRef]
- Marsden, G.; McDonald, M.; Brackstone, M. Towards an understanding of adaptive cruise control. Transp. Res. Part C Emerg. Technol. 2011, 9, 33–51. [Google Scholar] [CrossRef]
- Tapani, A. Vehicle trajectory effects of adaptive cruise control. J. Intell. Transp. Syst. 2011, 16, 36–44. [Google Scholar] [CrossRef] [Green Version]
- Yue, L.; Abdel-Aty, M.; Wu, Y.; Wang, L. Assessment of the safety benefits of vehicles’ advanced driver assistance, connectivity and lowlevel automation systems. Accid. Anal. Prev. 2018, 117, 55–64. [Google Scholar] [CrossRef] [PubMed]
- Davis, L.C. Effect of adaptive cruise control systems on mixed traffic flow near an on-ramp. Phys. A 2007, 379, 274–290. [Google Scholar] [CrossRef]
- Davis, L.C. Optimality and oscillations near the edge of stability in the dynamics of autonomous vehicle platoons. Phys. A Stat. Mech. Its Appl. 2013, 392, 3755–3764. [Google Scholar] [CrossRef]
- Davis, L.C. Improving traffic flow at a 2-to-1 lane reduction with wirelessly connected, adaptive cruise control vehicles. Phys. A 2016, 451, 320–332. [Google Scholar] [CrossRef] [Green Version]
- Ioannou, P.A.; Stefanovic, M. Evaluation of ACC vehicles in mixed traffic: Lane change effects and sensitivity analysis. IEEE Trans. Intell. Transp. Syst. 2005, 6, 79–89. [Google Scholar] [CrossRef] [Green Version]
- Rezaur, R.; Samiul, H.; Mohanmed, H.Z. Towards reducing the number of crashes during hurricane evacuation: Assessing the potential safety impact of adaptive cruise control systems. Transp. Res. Part C Emerg. Technol. 2021, 128, 103–188. [Google Scholar]
- Lin, E.D. Research on Design Parameters of Unlimited Speed Highway Based on Safety and Operation Considerations; Harbin Institute of Technology: Harbin, China, 2021. [Google Scholar]
- He, Y.M.; Pei, Y.L. A Research on Fuel Consumption Prediction When Vehicles Run on Superhighway. J. Kunming Univ. Sci. Technol. 2020, 45, 151–160. [Google Scholar]
- He, Y.M.; Pei, Y.L. Research on super highway and its capacity. J. Heilongjiang Inst. Technol. 2017, 31, 8–12. [Google Scholar]
- He, Y.M.; Pei, Y.L. Feasibility demonstration and necessity analysis on superhighway. Highway 2016, 61, 158–162. [Google Scholar]
- He, Y.M. Research in Safety Support and Economy Evaluation of Superhighway; Northeast Forestry University: Harbin, China, 2017. [Google Scholar]
- Bao, Y.H. Study on Speed Limit Improvement of Six-Lane Expressway Based on Safety/Traffic Efficiency; Chang’an University: Xi’an, China, 2021. [Google Scholar]
- Solomon, D.H. Accidents on Main Rural Highways Related to Speed, Driver and Vehicle; Bureau of Public Roads: Washington, DC, USA, 1964. [Google Scholar]
- Council, N. Interstate System Accident Research Study II, Interim Report II. Public Roads 1968, 8, 71–75. [Google Scholar]
- West, L.B.; Dunn, J.W. Accidents, Speed Deviation and Speed Limits. Traffic Eng. Inst Traffic Engr. 1971, 41, 52–55. [Google Scholar]
- Liu, G.; Popoff, A. Provincial-wide Travel Speed and Traffic Safety Study in Saskatchewan. Transp. Res. Rec. J. Transp. Res. Board 1997, 1595, 8–13. [Google Scholar] [CrossRef]
- Pei, Y.L.; Chen, G.Z. Research on relationship between discrete character of speed and traffic accident and speed management of freeway. China Highw. Transp. 2004, 1, 78–82. [Google Scholar]
- Campbell, J.L. Human Factors Guidelines for Road Systems, 2nd ed.; NCHRP Report 600; Transportation Research Board: Washington, DC, USA, 2012. [Google Scholar]
- Tan, H.; Zhao, F.; Liu, Z. impact of adaptive cruise control (ACC) system on fatality and injury reduction in China. Traffic Inj. Prev. 2021, 22, 307–312. [Google Scholar] [CrossRef]
- Duffney, R.; Borowsky, A.; Bar-Gera, H. the effects of adaptive cruise control (ACC) headway time on young-experienced drivers’ overtaking tendency in a driving simulator. Transp. Res. Part F Psychol. Behav. 2022, 86, 151–160. [Google Scholar] [CrossRef]
- Goñi-Ros, B.; Schakel, W.J.; Papacharalampous, A.E.; Wang, M.; Knoop, V.L.; Sakata, I.; van Arem, B.; Hoogendoorn, S.P. Using advanced adaptive cruise control systems to reduce congestion at sags: An evaluation based on microscopic traffic simulation. Transp. Res. Part C 2019, 102, 414–426. [Google Scholar] [CrossRef]
- Li, T.; Chen, D.; Zhou, H.; Xie, Y.; Laval, J. fundamental diagrams of commercial adpaptive cruise control:worldwide experimental evidence. Transp. Res. Part C 2022, 134, 103458. [Google Scholar]
- Shi, Y.; Li, Y.; Cai, Q.; Zhang, H.; Wu, D. How Does Heterogeneity Affect Freeway Safety? A Simulation-Based Exploration Considering Sustainable Intelligent Connected Vehicles. Sustainability 2020, 12, 8941. [Google Scholar] [CrossRef]
| Publisher’s Note: MDPI stays neutral with regard to jurisdictional claims in published maps and institutional affiliations. |
© 2022 by the authors. Licensee MDPI, Basel, Switzerland. This article is an open access article distributed under the terms and conditions of the Creative Commons Attribution (CC BY) license (https://creativecommons.org/licenses/by/4.0/).


