Article

Research on the Emission Reduction Decision of Cost-Sharing Logistics Service Supply Chain in the O2O Model

1
College of Business Administration, Shandong Management University, Jinan 250357, China
2
International Business School Suzhou, Xi’an Jiaotong-Liverpool University, Suzhou 215123, China
3
Hunter Centre for Entrepreneurship, University of Strathclyde, Glasgow G4 0QU, UK
4
Department of Computer Science, University of Liverpool, Liverpool L69 3BX, UK
*
Author to whom correspondence should be addressed.
Sustainability 2022, 14(20), 13247; https://doi.org/10.3390/su142013247
Submission received: 12 July 2022 / Revised: 25 September 2022 / Accepted: 11 October 2022 / Published: 14 October 2022

Abstract

:
As an effective way to realize energy savings and environmental protection, cost sharing is gradually becoming an important measure to reduce emissions in the logistics service supply chain under O2O mode in recent years. How to conduct contract selection and design optimization under the cost-sharing situation, and then improve the operational efficiency of the logistics service supply chain is an important issue that needs to be addressed. Firstly, based on the initial market demand for logistics, this paper involves the influence of both online logistics service integrators and onsite functional logistics service providers on logistics market demand in terms of emission reduction and platform brand image and develops a model based on the logistics service demand function in the O2O mode. Secondly, for the role of online and onsite emission reduction services in multi-cycle continuous cooperation to enhance the platform integrator’s brand image, a cost-sharing differential game model between online and onsite services is developed to facilitate providers’ adoption of high-quality emission reduction services. Finally, the HJB equation is used to compare the non-cooperative Nash game, the cost-sharing Stackelberg game, and the cooperative game to make the optimal abatement decision, the optimal benefit, and the cost-sharing ratio of the abatement service supply chain in the non-cooperative Nash game, the cost-sharing Stackelberg game, and the cooperative game. By comparing the results of the three games, we find that the optimal onsite and online abatement service decision is related to the cost, marginal revenue, and the impact of the service on demand; the abatement cost-sharing contract and cooperation are both better than the non-cooperative independent decision state, which can effectively guide the provision of high-quality onsite abatement service and improve the revenue of both parties involved in the logistics service supply chain and the total system’s revenue in the O2O mode. Compared with the cooperative game model, the cost-sharing contract can more effectively facilitate close cooperation between the actors, and the relationship between onsite and online marginal revenue affects the improvement of both parties’ revenue. The findings of the study can provide useful managerial insights for the selection and design optimization of abatement contracts for logistics service supply chains considering cost-sharing via the O2O model.

1. Introduction

With the improvement of the integrity and complexity of modern logistics service outsourcing, all kinds of logistics organizations cooperate to form a complete logistics service system with multi-level supply and demand relationships from the perspective of demand, forming Logistics Service Supply Chain (LSSC) [1]. The two leading participating enterprises in the Logistics Service Supply Chain are Logistics Service Integrator (LSI), which is the designer and provider of integrated logistics service, and Functional Logistics Service Provider (FLSP), which provides professional operations to Logistics Service integrators. Internet information technology in the era of the digital economy makes online information acquisition of logistics services more convenient, and many industry logistics platforms gradually form stable business models [2,3,4]. Onsite providers tend to diversify their functions, and their mature expertise and promotion experience has caused the rapid expansion of the online integrator platforms, which has led to the emergence of the O2O mode logistics service supply chain. For example, “Cainiao Network” is a typical O2O logistics service supply chain, which combines more than 30 logistics service providers to offer efficient and convenient services for the needs of China’s two major online markets: Taobao and Tmall.
The problem of resource consumption and environmental pollution brought by logistics is becoming more and more prominent. The carbon dioxide emission of the road freight industry alone accounts for about 9% of the global total, and it is one of the largest greenhouse gas (GHG) emitters. The State Council of China issued “the Action Plan for Peak Carbon Dioxide Emissions by 2030’ recently, proposing to build a green and highly efficient transport system and innovate a green, low-carbon, intensive, and efficient distribution model. However, in the context of achieving the goal of carbon peaking and carbon neutrality, the energy consumption level of onsite logistics warehousing and transportation is high. Facing the outstanding contradiction between scale expansion and carbon emission control, it is urgent to accelerate the pace of emission reduction and carbon transformation, facilitating logistics restructuring for healthy and sustainable development [5,6]. Meanwhile, more and more logistics enterprises have incorporated “carbon neutrality” into their core strategies for sustainable development and brand building [7,8]. The platform selects providers who can jointly fulfil social responsibility and achieve green and low-carbon development, which is conducive to promoting emission reduction in upstream and downstream enterprises in the logistics service supply chain in the O2O mode. A survey of more than 300 multinational companies found that 76% of the companies surveyed had set carbon neutrality targets for their operations, and 90% of them planned to achieve these targets by 2030. With the O2O model, the decision of logistics service supply chain emission reduction needs to be executed with the division of labour and cooperation in online and onsite cooperation strategy, information sharing, and collaborative decision-making [9]. After completion of the platform transaction, a high level of the onsite logistics experience will also advance the online brand image and enhance the platform’s brand value and market share [10].
In recent years, the study of coordinated decision-making in logistics service supply chains has received much attention in a range of fields such as capacity allocation [11], quality cost [12,13], and pricing decisions [14,15]. With the rise of the O2O model, logistics services will be platform-based [16,17,18], and some scholars have also conducted research on the supply chain of logistics services in O2O mode. For example, Qu and Liu (2017) analysed the feasibility of constructing the information platform for the logistics services supply chain from the perspective of tripartite coordination [19]. Yang et al. (2017) investigated the resilience of inventory models using interconnected logistics services based on the Internet of Things (IoT), and the results suggested that the IoT inventory model, with greater agility and flexibility, outperforms the current classic inventory models in terms of resilience [20]. Tang and Veelenturf (2019) found that with the Internet of Things, many companies are developing logistics network systems that can change the entire industry, suggesting some new research directions on the strategic role of logistics and transport services in creating economic, environmental, and social value [21]. Lin et al. (2021) developed a sustainable management framework for the platform service supply chain, including three key elements: mutual facilitation between platform and business ecosystem; strategic alignment among the structural elements; and a sustainable element including value co-creation, co-opetition, and dynamic configuration [22]. However, the prior studies have not involved emission reduction decisions in logistics service supply chains in the O2O mode. With the government’s carbon emission reduction constraints and consumers’ awareness of green preferences, the degree of logistics decarbonisation has gradually become an important part of sustainable economic development, which has led to changes in the cost composition and profitability models of enterprises and brought opportunities for their development. The differential game theory, as a novel idea for solving coordination and control problems, can effectively solve the problems of continuous games played by multiple participants. Currently, many scholars have used differential game methods to explore the cooperation mechanism of emission reduction between upstream and downstream enterprises in the product supply chain, among which it is found that cost sharing can not only reduce carbon emissions but also increase the profit of the supply chain, which is a key initiative for enterprises to gain a competitive advantage [23,24]. To this end, this paper innovatively introduces cost-sharing into the decision model of emission reduction in the logistics service supply chain in the O2O mode to achieve the sustainability of low-carbon cooperation in logistics.
Different from previous studies, this paper considers both online and onsite logistics emission reduction services and the impact of platform brand image on downstream demand. At the same time, it also takes into account the promotional effect of both parties’ services on the platform brand in multi-cycle continuous cooperation. Integrators use the “emission reduction cost-sharing factor” to motivate onsite provision of high-quality emission reduction services and try to introduce a differential game method to develop a cooperative differential game model. This article focuses on four key questions:
(1)
What kind of relationship exists between online and onsite abatement services and the platform brand image of the logistics service supply chain in the O2O mode? How do the two affect the market demand for logistics services?
(2)
What are the differences in the returns of the three decision game models under the O2O model? Namely, when Nash non-cooperative equilibrium is in the non-cooperative mode, the Stackelberg game in the cost-sharing mechanism, and the Nash cooperative game, can the provider and the integrator coordinate the emission reduction benefits of the logistics service supply chain?
(3)
How do the online-onsite abatement services affect the total platform brand image and logistics service supply chain revenue over time? What are the changes in the service integrator’s and provider’s revenue before and after the emission reduction cost sharing?
(4)
What are the effects of the important factors, such as the cost of logistics emission reduction and the impact of emission reduction service on market demand and integrator’s brand image, on the cost-sharing Pareto contract of logistics emission reduction in the O2O logistics service supply chain?
The main contributions of this paper are as follows: Firstly, this paper introduces the impact of online and onsite emission reduction services and platform brand image on the logistics market and forms the demand function of the logistics service supply chain with the O2O model. Secondly, through the comparison of equilibrium results under different game conditions, a two-subject differential game model of logistics abatement cost-sharing is constructed to achieve optimal benefits under bounded rationality. Finally, the paper draws some valuable conclusions and enlightenments, which provide effective measures for integrators and providers to implement cost-sharing emission reduction contracts with the O2O model.
This paper is organized as follows. Section 1 introduces the research background and motivation. The related literature is summarized in Section 2. Section 3 provides the model assumptions and develops decision models under three different situations. Section 4 compares the equilibrium results under different game conditions. Section 5 conducts the simulation and sensitivity analysis. Section 7 provides conclusions, management insights, and future directions for research.

2. Literature Review

2.1. Coordinated Decision-Making of Logistics Service Supply Chain under the O2O Model

The research on logistics service supply chain has become a hot issue for academics and enterprises, and more and more scholars have studied the structural characteristics [25,26], supplier selection [27,28], and coordination relationship [29,30] of logistics service supply chain theoretically and practically, especially the research on game strategy model, which has laid an important theoretical and methodological foundation for the coordination of the O2O logistics service supply chain. For example, Liu et al. (2021) builds a logistics service supply chain consisting of a logistics service integrator and a functional logistics service provider and analysed the impact of reciprocity on the supply chain members’ two-stage service capability procurement decisions under demand updating through game theory and a case study [31]. Zhang et al. (2022) embeds resilience into the logistics service supply chain under an emergent circumstance, develops a tripartite evolutionary game model among the government, manufacturers, and integrators, and systematically analyses the strategy selection process with the government’s participation [32]. O2O logistics service supply chain covers the entire process, including the integrator’s online response efficiency, agility, and capabilities of integration and information evaluation to shape the brand elements, as well as the providers’ onsite professionalism, timeliness, and customer satisfaction and other experiential elements [33]. Hong et al. (2019) constructs a block supply chain of logistics service model and studies the application of blockchain technology in the supply chain of logistics service management in three dimensions, namely object domain, functional domain and attribute domain based on exploring the feasibility of blockchain technology in the supply chain of logistics service [33]. Liu et al. (2022) constructs a logistics service supply chain consisting of a logistics service integrator and a logistics service provider, proposed cost-sharing, revenue-sharing, and cost-sharing-revenue sharing hybrid contracts to explore the incentive mechanism for logistics service providers to undergo smart transformation [34]. Liu et al. (2018) develops a customised cost-sharing supply chain coordination model in the context of “The Silk Road Economic Belt and the 21st-century Maritime Silk Road” and analyses the impact of the cost-sharing ratio on the price of logistics services and the efficiency of the supply chain system [35].

2.2. A Differential Game Decision Model for Supply Chain Abatement

Given the current situation of less research on emission reduction in the logistics service supply chain with the O2O model, it is necessary to learn from and refer to the research results of emission reduction decision-making in the product supply chain. Scholars have conducted a lot of research on issues related to long-term emission reduction coordination and cooperation among supply chain enterprises, including carbon emission supervision coordination [36,37], subsidy decision-making [38,39], and sustainable management [40,41]. Some scholars focus on using the differential game method to study how supply chain enterprises conduct games on emission reduction decisions, and how to design contracts to encourage supply chain participants to actively participate in emission reduction activities to achieve supply chain coordination. For example, Yang and Xu (2019) developed a differential game model for the closed-loop supply chain network based on differential variational inequality and analysed the optimality conditions of closed-loop supply chain participants, who compete in a non-cooperative manner under carbon emission permits [42]. Sun et al. (2020) analysed the carbon emission transfer and emission reduction problem among enterprises within the supply chain, integrating the influence of government emission reduction policies and the low carbon market [43]. Wei and Wang (2021) used differential game methods to study the interaction between carbon reduction technology innovation and government intervention via decentralized decision without cost-sharing, a decentralized decision with cost-sharing, and centralized decision, respectively, and found that the optimal level of carbon reduction technology innovation under decentralized decision is the same as centralized situation when there is no cost-sharing [44]. He et al. (2021) studied the impact of bilateral participation strategy on the dynamic emission-reducing behaviours and associated performance of low-carbon supply chains using differential game models [45]. It can be seen that product supply chain emission reductions are implemented by suppliers and manufacturers. Similarly, logistics service supply chain emission reduction in the O2O mode is mainly carried out by providers and integrators, and their cooperation is often characterized by a long-term and dynamic nature. The differential response game model can effectively deal with the issues of conflict, competition, or cooperation over time, providing the possibility to study the decision to reduce emissions in the logistics service supply chain in the O2O mode.

2.3. Supply Chain Abatement Game Model Based on the Cost-Sharing Mechanism

To maintain the high-quality emission reduction services of the logistics service supply chain with the O2O model, the integrators must promote the providers to improve the quality of onsite emission reduction through effective incentive measures. The cost-sharing mechanism can not only motivate service partners to improve the quality of emission reduction, but also improve the benefits of both parties [46,47], and has been widely used in supply chain cooperation and emission reduction research. For example, Zhou et al. (2016) analyzed how the co-operative advertising contract and the co-operative advertising and emission reduction cost-sharing contracts impact the low-carbon supply chain’s optimal decision and coordination and found that co-operative advertising and emission reduction cost-sharing contracts can achieve channel coordination and a win-win situation under certain conditions [23]. He et al. (2020) investigated a service supply chain consisting of a service provider who is in charge of carbon emission reduction and service, and a service integrator who is responsible for low-carbon advertising and established three differential game models to explore the optimal decisions of cost-sharing contract [24]. Different from the product supply chain, logistics products have unique attributes such as intangibility, synchronization of production and consumption, and inability to store. When customers purchase low-carbon logistics services online, they cannot fully experience the quality of emission reduction services. The effect of onsite providers’ logistics service emission reductions on the perceived value of customers, as well as the effect on the brand image of online logistics service integrator platforms and the revenue of logistics service supply chain systems, have not been examined in the prior literature.
Based on the above, for the decision of emission reduction in the logistics service supply chain in the O2O mode, this paper incorporates the online integrator platform emission reduction service and onsite provider emission reduction experience into the influence of a platform brand image, both of which affect the downstream demand, considers the degree of influence of integrator online emission reduction services and also provider onsite emission reduction service and platform brand image on market demand, and motivates providers to provide high-quality logistics emission reduction service through emission reduction cost sharing. The study also explores the optimal abatement service decision in the logistics service supply chain in the O2O mode, and provides a scientific basis for promoting the low-carbon development of logistics enterprises in the Internet environment by introducing a differential game approach to build a differential countermeasure model for the cooperation between platform-based integrators and providers.

3. Problem Description and Model Assumptions

3.1. Problem Description

The object of this study is the O2O model logistics service supply chain composed of onsite functional logistics service providers, online platform logistics service integrators, and downstream demand enterprises, as shown in Figure 1. Under the constraints of emission reduction, practical logistics service providers entrust logistics integrators to sell low-carbon logistics products at a price of p . Online emission reduction services provided by integrators to upstream and downstream enterprises, such as green incentives, low-carbon promotion, information sharing, resource integration, etc. Providers supply onsite emission reduction services based on “low energy consumption, low pollution, and low emissions” to enterprises in need, such as clean energy, low-carbon transportation, equipment recycling, green packaging, and other professional services. Demand companies complete payment transactions online, platform integrators get commissions α p , and integrators pay revenue to functional providers. In addition, both the online and onsite emission reduction levels of the logistics service supply chain with the O2O model and the brand image of platform integrators can affect the logistics market demand, and the emission reduction levels of providers and integrators under environmental regulations and green consumption preferences will affect the platform. Therefore, platform-based logistics integrators can achieve sustainable development by adopting the “emission reduction cost-sharing factor” δ ( t ) , and incentivising providers to implement high-quality logistics emission reduction services.

3.2. Model Assumptions

(1) With the O2O model, the emission reduction logistics cost C I ( t ) , C L ( t ) for the provider and the integrator is positively correlated with the online and onsite emission reduction level S I ( t ) , and the value-adding extent will be greater as the emission reduction level increases. Similar to other service products, the logistics cost also has concave characteristics. According to reference [48], it will be set as a quadratic function, which are and C L ( t ) = λ L S L 2 ( t ) / 2 , where and, respectively, represents the emission reduction logistics cost coefficients of integrators and providers.
(2) According to prior studies on sustainable supply chain branding [49], assuming that the emission reduction services of the provider and the integrator with the O2O model jointly affect the brand image of the online platform, where D I ( 0 ) 0 . The stochastic differential equation of the integrator’s platform brand image under the time constraint is as follows: D I ( t ) = β I S I ( t ) + β L S L ( t ) D I ( t ) .
Among them, β I and, respectively, represents the influence of integrators and providers on the brand image of the platform with the O2O model. When the logistics service supply chain does not provide emission reduction services, the brand value attenuation coefficient of the platform integrator due to the competition is , where > 0 .
(3) It is assumed that the logistics “emission reduction cost-sharing factor” δ ( t ) is used with the O2O model to motivate providers to implement high-level logistics emission reduction services, and the integrators only share part of the provider’s emission reduction costs, where δ ( t ) < 1 .
(4) It is assumed that integrators and providers with the O2O model are rational decision-makers under the condition of complete information. The purpose of participating in emission reduction is to maximize their respective interests, and the discount rate is the same.
(5) According to the research on carbon emission factors by [43,47], this paper assumes that the logistics customer procurement service with the O2O model considers the brand image and carbon emission factors of the provider and integrator. The demand function is Q ( t ) = a + θ I S I ( t ) + θ L S L ( t ) + ε D ( t ) , a represents the market demand for logistics products when the provider and integrator have no emission reduction services, where a 0 . θ I , and is the influence degree of the integrators’ online emission reduction services, the providers’ onsite emission reduction services, and the platform’s brand image on the market demand, respectively.
(6) Assuming that the integrator’s unit logistics service income is under the emission reduction strategy, the provider’s income is ( 1 α ) p . The provider’s onsite logistics cost is c L , and the integrator’s online operating cost is c I . The provider’s marginal revenue is π L = ( 1 α ) p c L , and the integrator’s marginal revenue is π I = α p c I .
According to the above assumptions, the emission reduction benefit functions of onsite providers, online integrators, and logistics service supply chain with the O2O model are obtained, respectively:
The objective function of emission reduction income for online integrators is:
R I = 0 + e ω t [ π I ( a + θ I S I ( t ) + θ L S L ( t ) + ε D ( t ) ) C I ( t ) δ ( t ) C L ( t ) ] d t
The objective function of emission reduction income for onsite providers is:
R L = 0 + e ω t [ π L ( a + θ I S I ( t ) + θ L S L ( t ) + ε D ( t ) ) ( 1 δ ( t ) ) C L ( t ) ] d t
With the O2O model, the objective function of emission reduction income of logistics service supply chain is:
R = 0 + e ω t [ ( π I + π L ) ( a + θ I S I ( t ) + θ L S L ( t ) + ε D ( t ) ) C I ( t ) C L ( t ) ] d t

4. Comparison of Game Models for Emission Reduction in Logistics Service Supply Chain under the O2O Model

This section compares and analyzes different game models for emission reduction in logistics service supply chain with the O2O model: Firstly, to analyze the Nash equilibrium of the non-cooperative game model for emission reduction in integrators and providers with the O2O model. Secondly, the Stackelberg model of both sides of the game is assumed. Finally, the Nash cooperation equilibrium to optimize the emission reduction income of the O2O logistics service supply chain is addressed.

4.1. Non-Cooperative Nash Game Model

When the integrator and the provider do not carry out emission reduction cooperation, the non-cooperative Nash game equilibrium decision considering participation constraints provides a reference for the contract coordination design of both parties, which is denoted by the superscript N. Both of them seek to maximize the profit function in the Nash non-cooperative game of emission reduction decision-making, and the optimal emission reduction level in the Nash equilibrium of the non-cooperative game is the lower limit of the profit contract of the stakeholders.
Proposition 1.
When the logistics abatement cost-sharing factor δ ( t ) = 0 , the integrator and the provider will face a non-cooperative game, and the static feedback Nash equilibrium strategy of the two is:
S I N = π I [ θ I ( ω + ) + β I ε ] / λ I ( ω + )
S L N = π L [ θ L ( ω + ) + β L ε ] / λ L ( ω + )
Substitute the marginal revenue of emission reduction services of integrators and providers into Equations (1) and (2), and we get:
S I N = ( α p c I ) [ θ I ( ω + ) + β I ε ] / λ I ( ω + )
S L N = [ ( 1 α ) p c L ] [ θ L ( ω + ) + β L ε ] / λ L ( ω + )
From Equations (1)–(4), in the Nash non-cooperative game between the integrator and the provider, the emission reduction service is negatively correlated with the cost coefficient and the brand value attenuation coefficient. It is positively correlated with marginal revenue, emission reduction service, and brand image influence coefficient, and emission reduction service has a positive correlation with online brand image influence coefficient. At the same time, the derivation of Formulas (3) and (4) shows that S I N is positively correlated with the commission coefficient α , and S L N is negatively correlated with the commission coefficient α , that is, the higher the commission coefficient, the higher the online emission reduction service level of the logistics service supply chain, while the lower the level of the onsite emission reduction services.
Proof. 
Assuming that there are continuous bounded differential functions U I N ( D ) and U L N ( D ) that satisfy the partial differential equations under D 0 , the Hamilton–Jacobi–Bellman (HJB) Equations (5) and (6) are solved by subtracting the excluded non-cooperative game of Markov refined Nash equilibrium:
U I N ( D ) ω = max S I { π I [ a + θ I S I ( t ) + θ L S L ( t ) + ε D ( t ) ] λ I S I 2 ( t ) / 2 δ λ L S L 2 ( t ) / 2 + U I N ( D ) [ β I S I ( t ) + β L S L ( t ) D I ( t ) ] }
U L N ( D ) ω = max S L { π L [ a + θ I S I ( t ) + θ L S L ( t ) + ε D ( t ) ] ( 1 δ ) λ L S L 2 ( t ) / 2 + U L N ( D ) [ β I S I ( t ) + β L S L ( t ) D I ( t ) ] }
Since both parties are “rational economic men”, the rational platform integrators under the non-cooperative game mechanism have a “cost-sharing factor of emission reduction” δ ( t ) = 0 , which is used to achieve the optimal profit for themselves. It can be seen that Equations (5) and (6) are the quadratic concave functions of S I ( t ) and S L ( t ) , respectively, and the maximization conditions for solving the first-order partial derivative zero equation for S I ( t ) and S L ( t ) are as follows:
S I ( t ) = [ π I θ I + β I U I N ( D ) ] / λ I
S L ( t ) = [ π L θ L + β L U L N ( D ) ] / λ L
Substitute Equations (7) and (8) into the HJB equation, and sort out Equations (9) and (10):
U I N ( D ) ω = π I a + [ π I ε U I N ( D ) ] D ( t ) + [ π I θ I + β I U I N ( D ) ] 2 / 2 λ I + [ π L θ L + β L U L N ( D ) ] [ π I θ L + β L U I N ( D ) ] / λ L
U L N ( D ) ω = π L a + [ π L ε U L N ( D ) ] D ( t ) + [ π L θ L + β L U L N ( D ) ] 2 / 2 λ L + [ π I θ I + β I U I N ( D ) ] [ π L θ I + β I U L N ( D ) ] / λ I
According to Equations (9) and (10), it is assumed that the optimal solutions of the bounded differential functions are linear functions of D , and the optimal solutions are expressed as and U L N ( D ) = x 2 N D + y 2 N . Substitute it into Equations (9) and (10) to get:
( x 1 N D + y 1 N ) ω = π I a + [ π I ε x 1 N ] D ( t ) + [ π I θ I + β I x 1 N ] 2 / 2 λ I + [ π L θ L + β L x 2 N ] [ π I θ L + β L x 1 N ] / λ L
( x 2 N D + y 2 N ) ω = π L a + [ π L ε x 2 N ] D ( t ) + [ π L θ L + β L x 2 N ] 2 / 2 λ L + [ π I θ I + β I x 1 N ] [ π L θ I + β I x 2 N ] / λ I
Simplify Equations (11) and (12) to solve the parameter values of x 1 N and y 2 N in the optimal solution:
x 1 N = π I ε / ( ω + )
y 1 N = π I a / ω + { π I 2 λ L [ θ I ( + ω ) + β I ε ] 2 + 2 π I π L λ I [ θ L ( + ω ) + β L ε ] 2 } / 2 ω λ I λ L ( + ω ) 2 x 2 N = π L ε / ( ω + ) y 2 N = π L a / ω + { π L 2 λ I [ θ I ( + ω ) + β L ε ] 2 + 2 π I π L λ L [ θ I ( + ω ) + β I ε ] 2 } / 2 ω λ I λ L ( + ω ) 2
Substituting the above parameter values into the optimal solution formulas U I N ( D ) = x 1 N D + y 1 N and U L N ( D ) = x 2 N D + y 2 N , the optimal revenue values of the integrators, providers, and logistics service supply chain emission reduction services with the O2O model are, respectively, Formulas (13)–(15):
U I N ( D ) = π I ε D / ( ω + ) + π I a / ω + { π I 2 λ L [ θ I ( + ω ) + β I ε ] 2 + 2 π I π L λ I [ θ L ( + ω ) + β L ε ] 2 } / 2 ω λ I λ L ( + ω ) 2
U L N ( D ) = π L ε D / ( ω + ) + π L a / ω + { π L 2 λ I [ θ I ( + ω ) + β L ε ] 2 + 2 π I π L λ L [ θ I ( + ω ) + β I ε ] 2 } / 2 ω λ I λ L ( + ω ) 2
U N ( D ) = ( π I + π L ) ε D / ( ω + ) + ( π I + π L ) a / ω + { λ L ( π I 2 + 2 π I π L ) [ θ I ( + ω ) + β I ε ] 2 + λ I ( π L 2 + 2 π I π L ) [ θ L ( + ω ) + β L ε ] 2 } / 2 ω λ I λ L ( + ω ) 2
Substitute Equations (13) and (14) for the first derivative of G into Equations (7) and (8), that is, Proposition 1 is proved. □

4.2. The Stackelberg Game of Sharing Logistics Emission Reduction Costs

When adopting the logistics abatement cost-sharing contract, the abatement service decision-making process of integrators and providers conforms to the Stackelberg game process, in which the integrator is the decision leader and the provider is the action follower, which is represented by the superscript S. Decision-making process: Firstly, the integrator decides on its emission reduction service quality and cost-sharing factor, and then the provider decides its emission reduction service quality according to the integrator behaviour. After establishing the payout function and the game model, the model is analyzed by reverse induction.
Proposition 2.
When the integrator and the provider play the Stackelberg game, the optimal logistics emission reduction service and cost-sharing factors are:
S I S = π I [ θ I ( + ω ) + β I ε ] / λ I ( ω + )
S L S = ( 2 π I + π L ) [ θ L ( + ω ) + β L ε ] / 2 λ L ( ω + )
δ S = ( 2 π I π L ) / ( 2 π I + π L )
According to Proposition 2, under the Stackelberg game mechanism, the integrators’ optimal logistics emission reduction cost-sharing factor is positively related to its marginal revenue. It will inevitably tend to pay higher emission reduction costs. At this time, when the integrator is willing to share the emission reduction cost for the provider, it can be seen from Equation (17) that there is a positive correlation between the provider’s optimal emission reduction service and its marginal revenue and the integrator’s emission reduction marginal revenue. The revenue objective functions of integrators and providers are isotropic. The logistics emission reduction cost-sharing contract facilitates the provider to consider the integrator’s revenue impact effect when making decisions. Then, the total revenue of the logistics service supply chain emission reduction with the O2O model can be improved by implementing the revenue distribution mechanism.
Proof. 
Assuming that there are continuous bounded differential functions and satisfying the partial differential HJB equation D 0 , use the reverse induction method to solve the Stackelberg game equilibrium. The provider HJB Equation (19) is as follows:
U L S ( D ) ω = max S L { π L [ a + θ I S I ( t ) + θ L S L ( t ) + ε D ( t ) ] ( 1 δ ) λ L S L 2 ( t ) / 2 + U L S ( D ) [ β I S I ( t ) + β L S L ( t ) D I ( t ) ] }
Since Equation (19) is a concave function about S L ( t ) , the maximization condition for finding the first-order partial derivative is:
S L ( t ) = [ π L θ L + β L U L S ( D ) ] / λ L ( 1 δ )
The integrator HJB Equation (21) is as follows:
U I S ( D ) ω = max S I { π I [ a + θ I S I ( t ) + θ L S L ( t ) + ε D ( t ) ] λ I S I 2 ( t ) / 2 δ λ L S L 2 ( t ) / 2 + U I S ( D ) [ β I S I ( t ) + β L S L ( t ) D I ( t ) ] }
Substitute the optimal condition of the formula S L ( t ) into Formula (21), and find the maximization condition of the first-order partial derivatives of S I ( t ) and δ :
S I ( t ) = [ π I θ I + β I U I S ( D ) ] / λ I
δ = θ I ( 2 π I π L ) + β L [ 2 U I S ( D ) U L S ( D ) ] θ I ( 2 π I + π L ) + β L [ 2 U I S ( D ) + U L S ( D ) ]
Substitute Equations (20), (22), and (23) into Equations (19) and (21), and simplify to get:
U L S ( D ) ω = π L a + [ π L ε U L S ( D ) ] D I ( t ) + [ π L θ I + β I U L S ( D ) ] ( π I θ I + β I U I S ( D ) ) λ I + [ π L θ L + β L U L S ( D ) ] [ θ L ( π L + 2 π I ) + β L [ U L S ( D ) + 2 U I S ( D ) ] ] 4 λ L
U I S ( D ) ω = π I a + [ π I ε U I S ( D ) ] D I ( t ) + [ π I θ I + β I U I S ( D ) ] 2 2 λ I + [ θ L ( π L + 2 π I ) + β L [ U L S ( D ) + 2 U I S ( D ) ] ] 2 8 λ L
Similar to the non-cooperative Nash game model, it is assumed that the optimal solutions of Equations (24) and (25) are linear functions of D , namely and U L S ( D ) = x 2 S D + y 2 S . Substitute into Equations (24) and (25) to obtain x 1 S , and y 2 S , and the optimal revenue values of integrators, providers, and logistics service supply chains under the emission reduction cost-sharing mechanism are Equations (26)–(28):
U I S ( D ) = π I a ω + π I ε D ω + + 4 π I 2 λ L [ θ I ( + ω ) + β I ε ] 2 + λ I ( 2 π I + π L ) 2 [ θ I ( + ω ) + β L ε ] 2 8 ω λ I λ L ( + ω ) 2
U L S ( D ) = π L a ω + π L ε D ω + + π L λ I ( 2 π I + π L ) [ θ I ( + ω ) + β L ε ] 2 + 4 π I π L λ L [ θ I ( + ω ) + β I ε ] 2 4 ω λ I λ L ( + ω ) 2
U S ( D ) = ( π I + π L ) a ω + ( π I + π L ) ε D ω + + 4 π I λ L [ θ I ( + ω ) + β I ε ] 2 + λ I ( 2 π I + π L ) ( 2 π I + 3 π L ) [ θ I ( + ω ) + β L ε ] 2 8 ω λ I λ L ( + ω ) 2
Substitute Equations (26) and (27) for the first derivative of G into Equations (20), (22), and (23), that is, Proposition 2 is proved. □

4.3. Centralized Decision-Making for Emission Reduction in Logistics Service Supply Chain under the O2O Model

With the O2O model, integrators realize joint emission reduction decisions by building platforms and providers and solve the Nash cooperation equilibrium to optimize emission reduction benefits in the logistics service supply chain, which is denoted by superscript C. Assuming that a cooperation agreement is reached between the provider and the integrator, the central decision-maker realizes the emission reduction services and is based on maximizing the overall interests of the logistics service supply chain. At this time, the optimal emission reduction service level is the upper limit of contract coordination.
Proposition 3.
In the case of centralized decision-making, the optimal emission reduction services of integrators and providers are:
S I S = ( π I + π L ) [ θ I ( + ω ) + β I ε ] / λ I ( ω + )
S L C = ( π I + π L ) [ θ L ( + ω ) + β L ε ] / λ L ( ω + )
From Equations (29) and (30), it can be seen that in the case of centralized decision-making, the reduced services of integrators and providers are negatively correlated with cost coefficient and brand value attenuation coefficient, and are positively correlated with marginal revenue, emission reduction services, and brand image influence coefficient and emission reduction. The influence coefficient and online brand image are positively correlated. The optimal emission reduction service decisions of integrators and function providers are positively related to the total marginal revenue, which indicates that with the O2O model, the logistics service supply chain centre coordinator makes balanced decisions based on maximizing total revenue, and jointly coordinates the overall emission reduction goals of the logistics service supply chain.
Proof. 
Similar to the Stackelberg game, the reverse induction method is used to achieve the cooperative equilibrium of emission reduction in the logistics service supply chain with the O2O model. It is assumed that there is a continuous bounded differential function U I , L C ( D ) that satisfies the partial differential HJB equation under D 0 :
U I , L C ( D ) ω = max S I , S L { ( π L + π I ) [ a + θ I S I ( t ) + θ L S L ( t ) + ε D ( t ) ] λ L S L 2 ( t ) / 2 λ I S I 2 ( t ) / 2 + U I , L C ( D ) [ β I S I ( t ) + β L S L ( t ) D I ( t ) ] }
Since Equation (31) is a concave function for S I ( t ) and S L ( t ) , the maximization conditions of its first-order partial derivatives are obtained, respectively:
S L ( t ) = [ ( π I + π L ) θ L + β L U I , L C ( D ) ] / λ L
S I ( t ) = [ ( π I + π L ) θ I + β I U I , L C ( D ) ] / λ I
Substitute (32) and (33) into the HJB equation to obtain Formula (34) as follows:
U I , L C ( D ) ω = [ ε ( π L + π I ) U I , L C ( D ) ] D ( t ) + ( π L + π I ) a [ ( π L + π I ) θ I + β I U I , L C ( D ) ] 2 / 2 λ I + [ ( π L + π I ) θ L + β L U I , L C ( D ) ] 2 / 2 λ L
In the same way, assuming that the optimal solution linear function expression of Equation (34) is U I , L C ( D ) = x C D + y C , and substituting it into Equation (31) to obtain y C , the optimal value function Equation (35) is:
U C ( D ) = ( π I + π L ) a ω + ( π I + π L ) ε D ω + + ( π I + π L ) 2 { λ L [ θ I ( + ω ) + β I ε ] 2 + λ I [ θ I ( + ω ) + β L ε ] 2 } 2 ω λ I λ L ( + ω ) 2
Substitute Equation (35) and derivatives into Equations (32) and (33), that is, Proposition 3 is proved. □

5. Comparative Analysis of Equilibrium Results

Now we compare the emission reduction services and supply chain benefits of providers and integrators under the non-cooperative Nash game, cost-sharing Stackelberg game, and cooperative game, and analyze whether providers and integrators can coordinate the income of logistics service supply chain reduction with the O2O model.
Proposition 4.
Integrators and providers compare emission reduction services as follows:
(1) 
Comparison of optimal emission reduction services for integrators.
(2) 
Comparison of optimal emission reduction services of providers: S L N ( t ) < S L S ( t ) < S L C ( t ) ( π I > π L / 2 ), logistics abatement cost-sharing factor δ ( t ) = [ S L S ( t ) S L N ( t ) ] / S L S ( t ) , S L N ( t ) S L S ( t ) < S L C ( t ) ( π I π L / 2 ).
From Proposition 4, when π I π L / 2 , the emission reduction service in the cost-sharing Stackelberg game is lower than that in the non-cost-sharing non-cooperative Nash game. The integrator not only does not share the logistics emission reduction cost of the provider but also charges a certain fee, which reduces the inherent enthusiasm of the provider to implement emission reduction services. When π I > π L / 2 no cost-sharing non-cooperative game and cost-sharing Stackelberg game have the same level of integrators emission reduction services. The quality of the provider’s emission reduction service is improved, and the increase is equal to the cost-sharing factor. Under coordinated centralized decision-making, the integrator and the provider’s emission reduction service are optimal.
Prove:
(1)
It can be known from Equations (1), (16), and (29) that:
S I N ( t ) S I S ( t ) = 0 , proof completed.
(2)
It can be known from Equations (2), (17), and (30) that:
S L N S L S = ( π L 2 π I ) [ θ L ( ω + ) + β L ε ] / λ L ( ω + ) , if π I > π L / 2 , then S L S > S L N ; if π I π L / 2 , then S L S S L N . Similarly, it is easy to get S L C S L N > 0 , proof completed.
(3)
It can be known from Equations (2), (17), and (18) that:
S L S S L N = ( 2 π I π L ) [ θ L ( + ω ) + β L ε ] / 2 λ L ( ω + ) = δ S S L S , proof completed.
Proposition 5.
The comparison of emission reduction benefits of integrators, providers, and logistics service supply chains is as follows:
(1) 
Comparison of the optimal benefits of emission reduction for integrators: U I N ( D ) < U I S ( D )
(2) 
Comparison of the optimal benefits of emission reduction for providers: U L N ( D ) < U L S ( D ) ( π I > π L / 2 ); U L N ( D ) U L S ( D ) ( π I π L / 2 ).
(3) 
Comparison of emission reduction and value-added benefits of integrators and providers:
π L / 2 < π I 3 π L / 2 , U I S ( D ) U I N ( D ) < U L S ( D ) U L N ( D ) ;
π I > 3 π L / 2 , U I S ( D ) U I N ( D ) > U L S ( D ) U L N ( D ) .
(4) 
Comparison of emission reduction benefits of logistics service supply chain:
When  π I > π L / 2 , U N ( D ) < U S ( D ) < U C ( D )
When π I π L / 2 , U S ( D ) U N ( D ) < U C ( D ) .
According to Proposition 5, when π I π L / 2 , the Stackelberg game of abatement cost-sharing helps to improve the integrators’ income, but it cannot satisfy the provider’s participation constraint. When π I > π L / 2 , the benefits of integrators and providers in the Stackelberg game of abatement cost-sharing are greater than those of the non-cooperative Nash game, and the increase in the abatement benefits of integrators is related to the marginal cost, indicating that the cost-sharing contract is self-enforcing and conducive to both emission reduction benefits improving. When π L / 2 < π I 3 π L / 2 , the value-added impact of the provider is substantial, and when π I > 3 π L / 2 , the value-added effect of the integrator is significant. Therefore, when the integrator has a high marginal benefit, the emission reduction cost-sharing contract should be used to motivate the provider to implement high-quality emission reduction services. In addition, compared with the non-cooperative Nash game of emission reduction and the Stackelberg game of cost-sharing, the logistics service supply chain emission reduction synergy and cooperation income are optimal with the O2O model, and the bargaining power of integrators and providers determine the value-added share of the logistics service supply chain revenue.
Proof. 
(1)
From the optimal value Expressions (13) and (26), we can get:
U I S ( D ) U I N ( D ) = ( 2 π I π L ) 2 [ θ L ( + ω ) + β L ε ] 2 8 ω λ L ( + ω ) 2 > 0
(2)
From the optimal value Expressions (14) and (27), we can get:
U L S ( D ) U L N ( D ) = π L ( 2 π I π L ) [ θ L ( + ω ) + β L ε ] 2 4 ω λ L ( + ω ) 2
If π I > π L / 2 , then U L N ( D ) < U L S ( D ) ; If π I π L / 2 , then U L N ( D ) U L S ( D ) .
(3)
From Equations (36) and (37), we can get:
[ U I S ( D ) U I N ( D ) ] [ U L S ( D ) U L N ( D ) ] = ( π L 2 π I ) ( 2 π I 3 π L ) [ θ L ( + ω ) + β L ε ] 2 8 ω λ L ( + ω ) 2
If π L / 2 < π I 3 π L / 2 , then U I S ( D ) U I N ( D ) < U L S ( D ) U L N ( D ) ;
If π I > 3 π L / 2 , then U I S ( D ) U I N ( D ) > U L S ( D ) U L N ( D ) .
(4)
From Equations (15), (28), and (35), we can get:
U S ( D ) U N ( D ) = ( 4 π I 2 π L 2 ) [ θ L ( + ω ) + β L ε ] 2 8 ω λ L ( + ω ) 2
Now, if π I > π L / 2 , then U L N ( D ) < U L S ( D ) ; If π I π L / 2 , U L N ( D ) U L S ( D ) . Similarly, it can easily get. □

6. Numerical Simulation

This section analyses the O2O logistics service supply chain consisting of an online platform logistics integrator and an onsite functional logistics service provider. It is assumed that the logistics service supply chain in the initial stage of the O2O model does not implement the emission reduction strategy, and the provider and the integrator platform do not provide emission reduction services. That is, C I ( t ) and C L ( t ) (the logistics cost of emission reduction for both), as well as S I ( t ) and S L ( t ) (the level of online and onsite emission reduction) are both zero. Under the low-carbon market constraints of government regulation and consumer preference, the platform brand image will weaken over time and will eventually withdraw from the market. The sustainable development of emission reduction in the O2O logistics service supply chain is not only affected by the onsite logistics service experience but also related to online emission reduction efforts. To ensure the supply chain emission reduction in logistics services with the O2O model, the online platform will adopt a cost-sharing model to urge providers to provide high-quality logistics emission reduction services. Therefore, the MATLAB platform is used to compare the emission reduction benefits of platform integrators, function providers, and logistics service supply chains in the case of non-cooperative Nash game, cost-sharing Stackelberg game, and cooperative game, and then obtain the optimal emission reduction decision parameters of both parties. A specific numerical simulation example is given to test the validity of the cost-sharing model of the logistics service supply chain with the O2O model. To verify the feasibility and effectiveness of the model and avoid the influence of specific examples on the reliability of the model performance, the study is to set the basic parameters randomly based on satisfying the parameter relationship constraints β I > 0 , in Section 3.2, the specific parameter assignments are as follows: α = 0.4 , ε = 2 . In this way, the overall experimental environment for the decision-making of the logistics service supply chain emission reduction cost-sharing contract under the O2O mode is constructed. The sensitivity is used to further analyze the influence mechanism of parameters such as the logistics emission reduction cost parameter and the influence coefficient of emission reduction service on market demand and decision-making.

6.1. Benefit Analysis

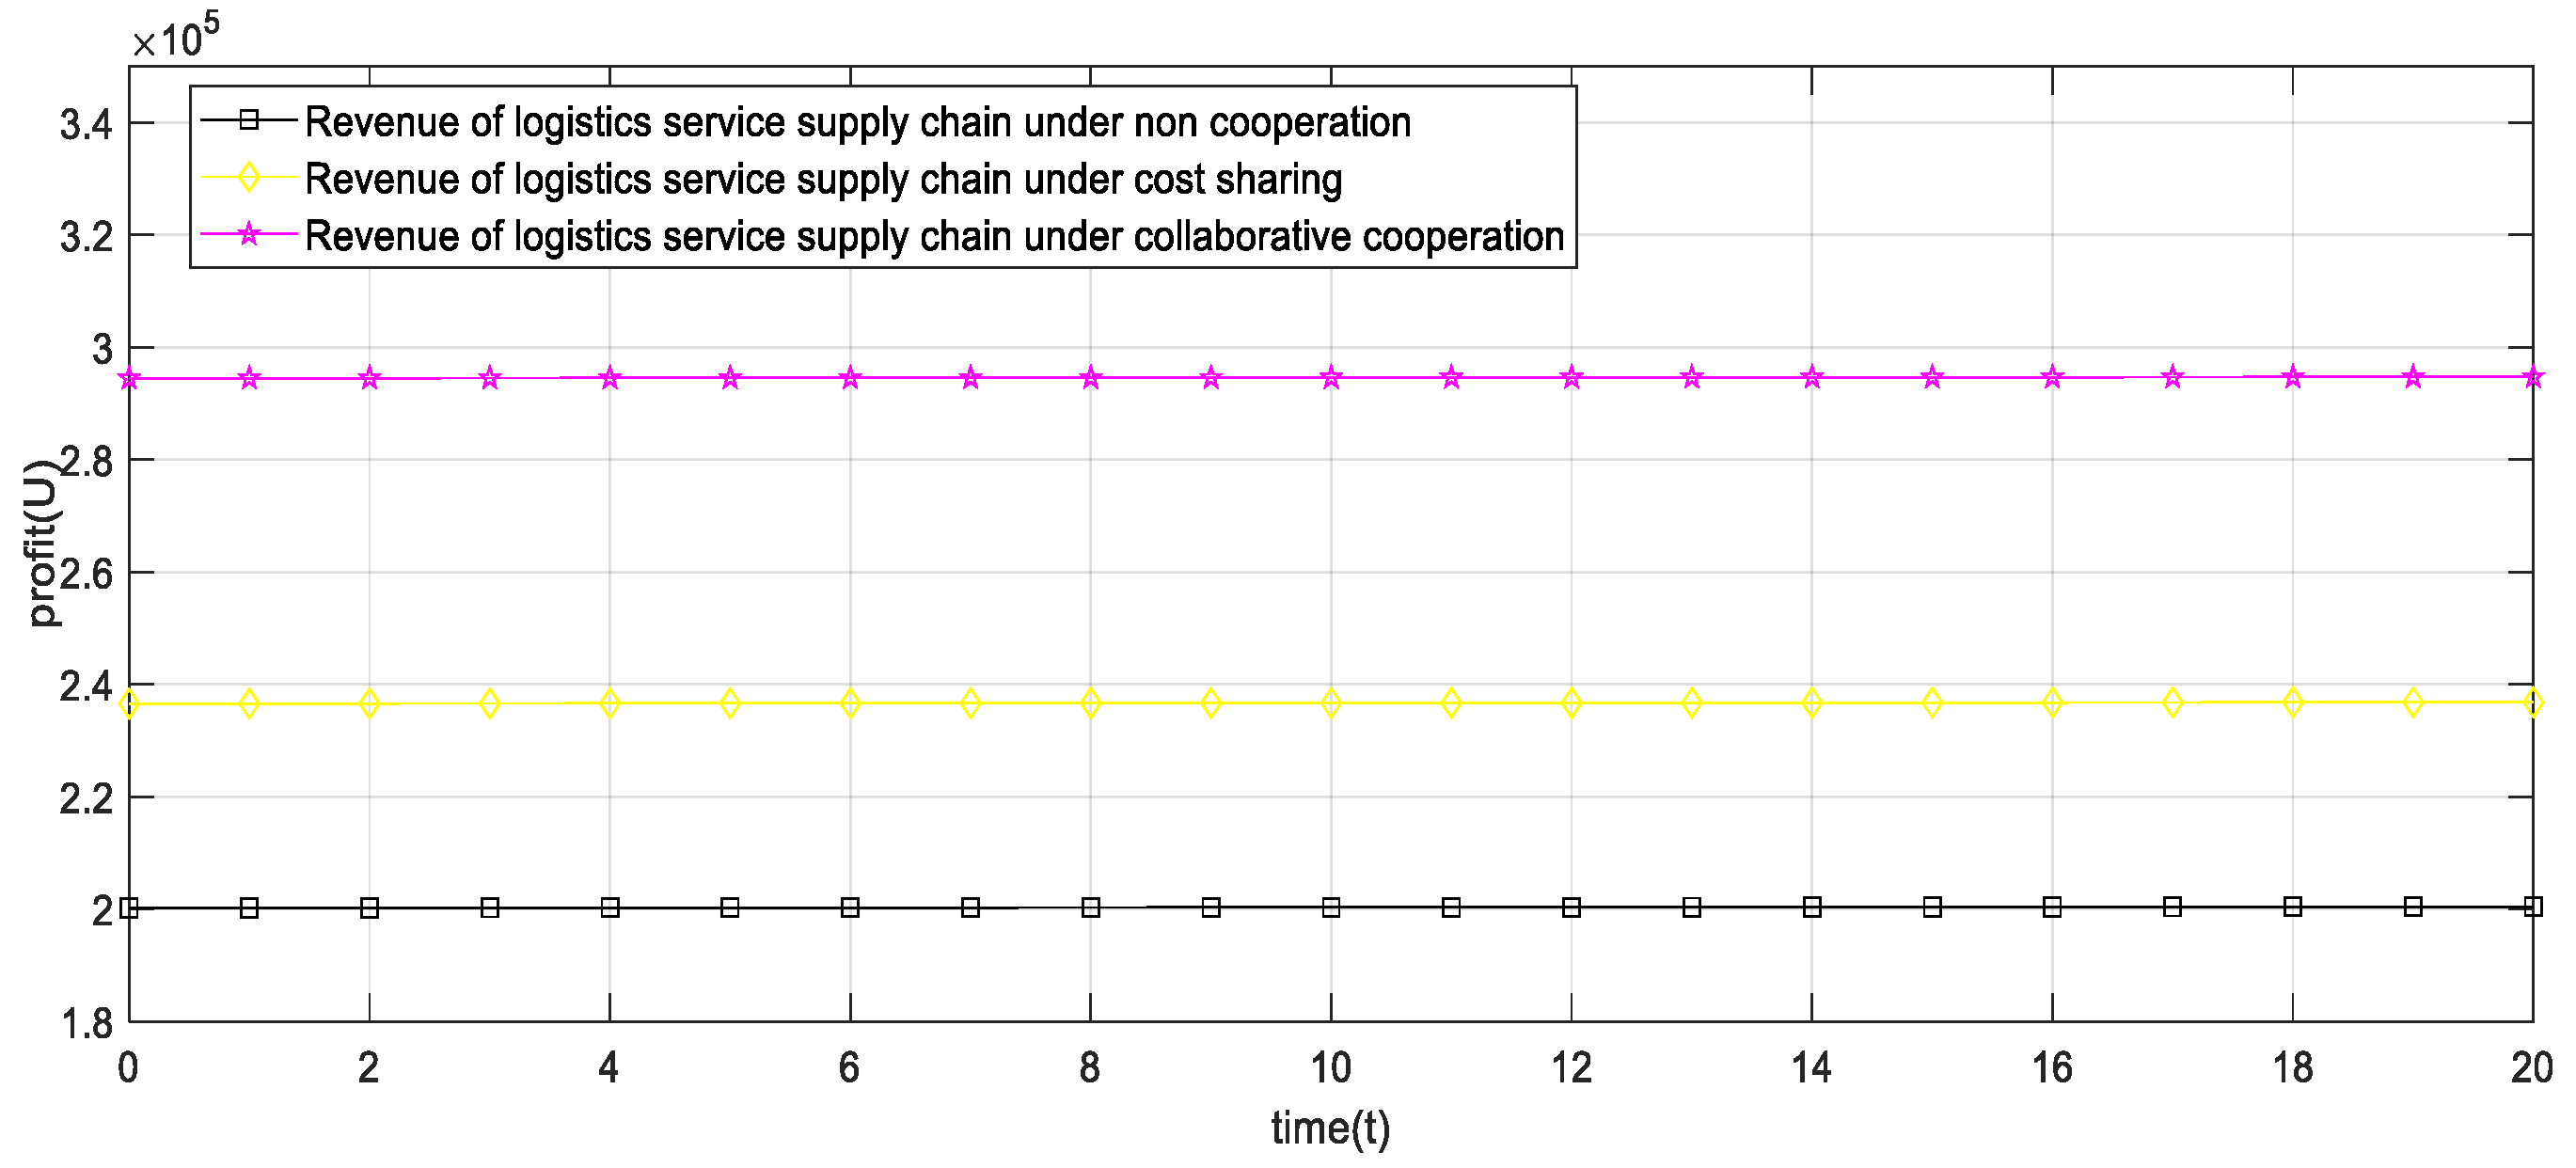
Based on Equations (15), (28), and (35), we compare the emission reduction benefits of the O2O logistics service supply chain under the scenarios of non-cooperative Nash game, cost-sharing Stackelberg game, and cooperative game, as shown in Figure 2. Adopting the cost-sharing strategy of logistics emission reduction, the Stackelberg game, can realize the Pareto improvement of emission reduction income of logistics service supply chain in the O2O mode. At this time, the relationship between the emission reduction benefits of the logistics service supply chain in the three cases is U N ( D ) < U S ( D ) < U C ( D ) , and the conclusion of Proposition 5 is verified. It can be seen from Figure 2 that when platform integrators and providers adopt collaborative cooperation for emission reduction, the total benefit of centralized decision-making in the O2O logistics service supply chain is more significant than in other cooperation modes, and the cooperative strategy is better than the non-cooperative Nash game and cost-sharing Stackelberg game. The collaborative and cooperative O2O logistics service supply chain emission reduction is the optimal strategy, the strategy based on the cost-sharing Stackelberg game is less effective, and the strategy based on the non-cooperative Nash game strategy is the least effective.
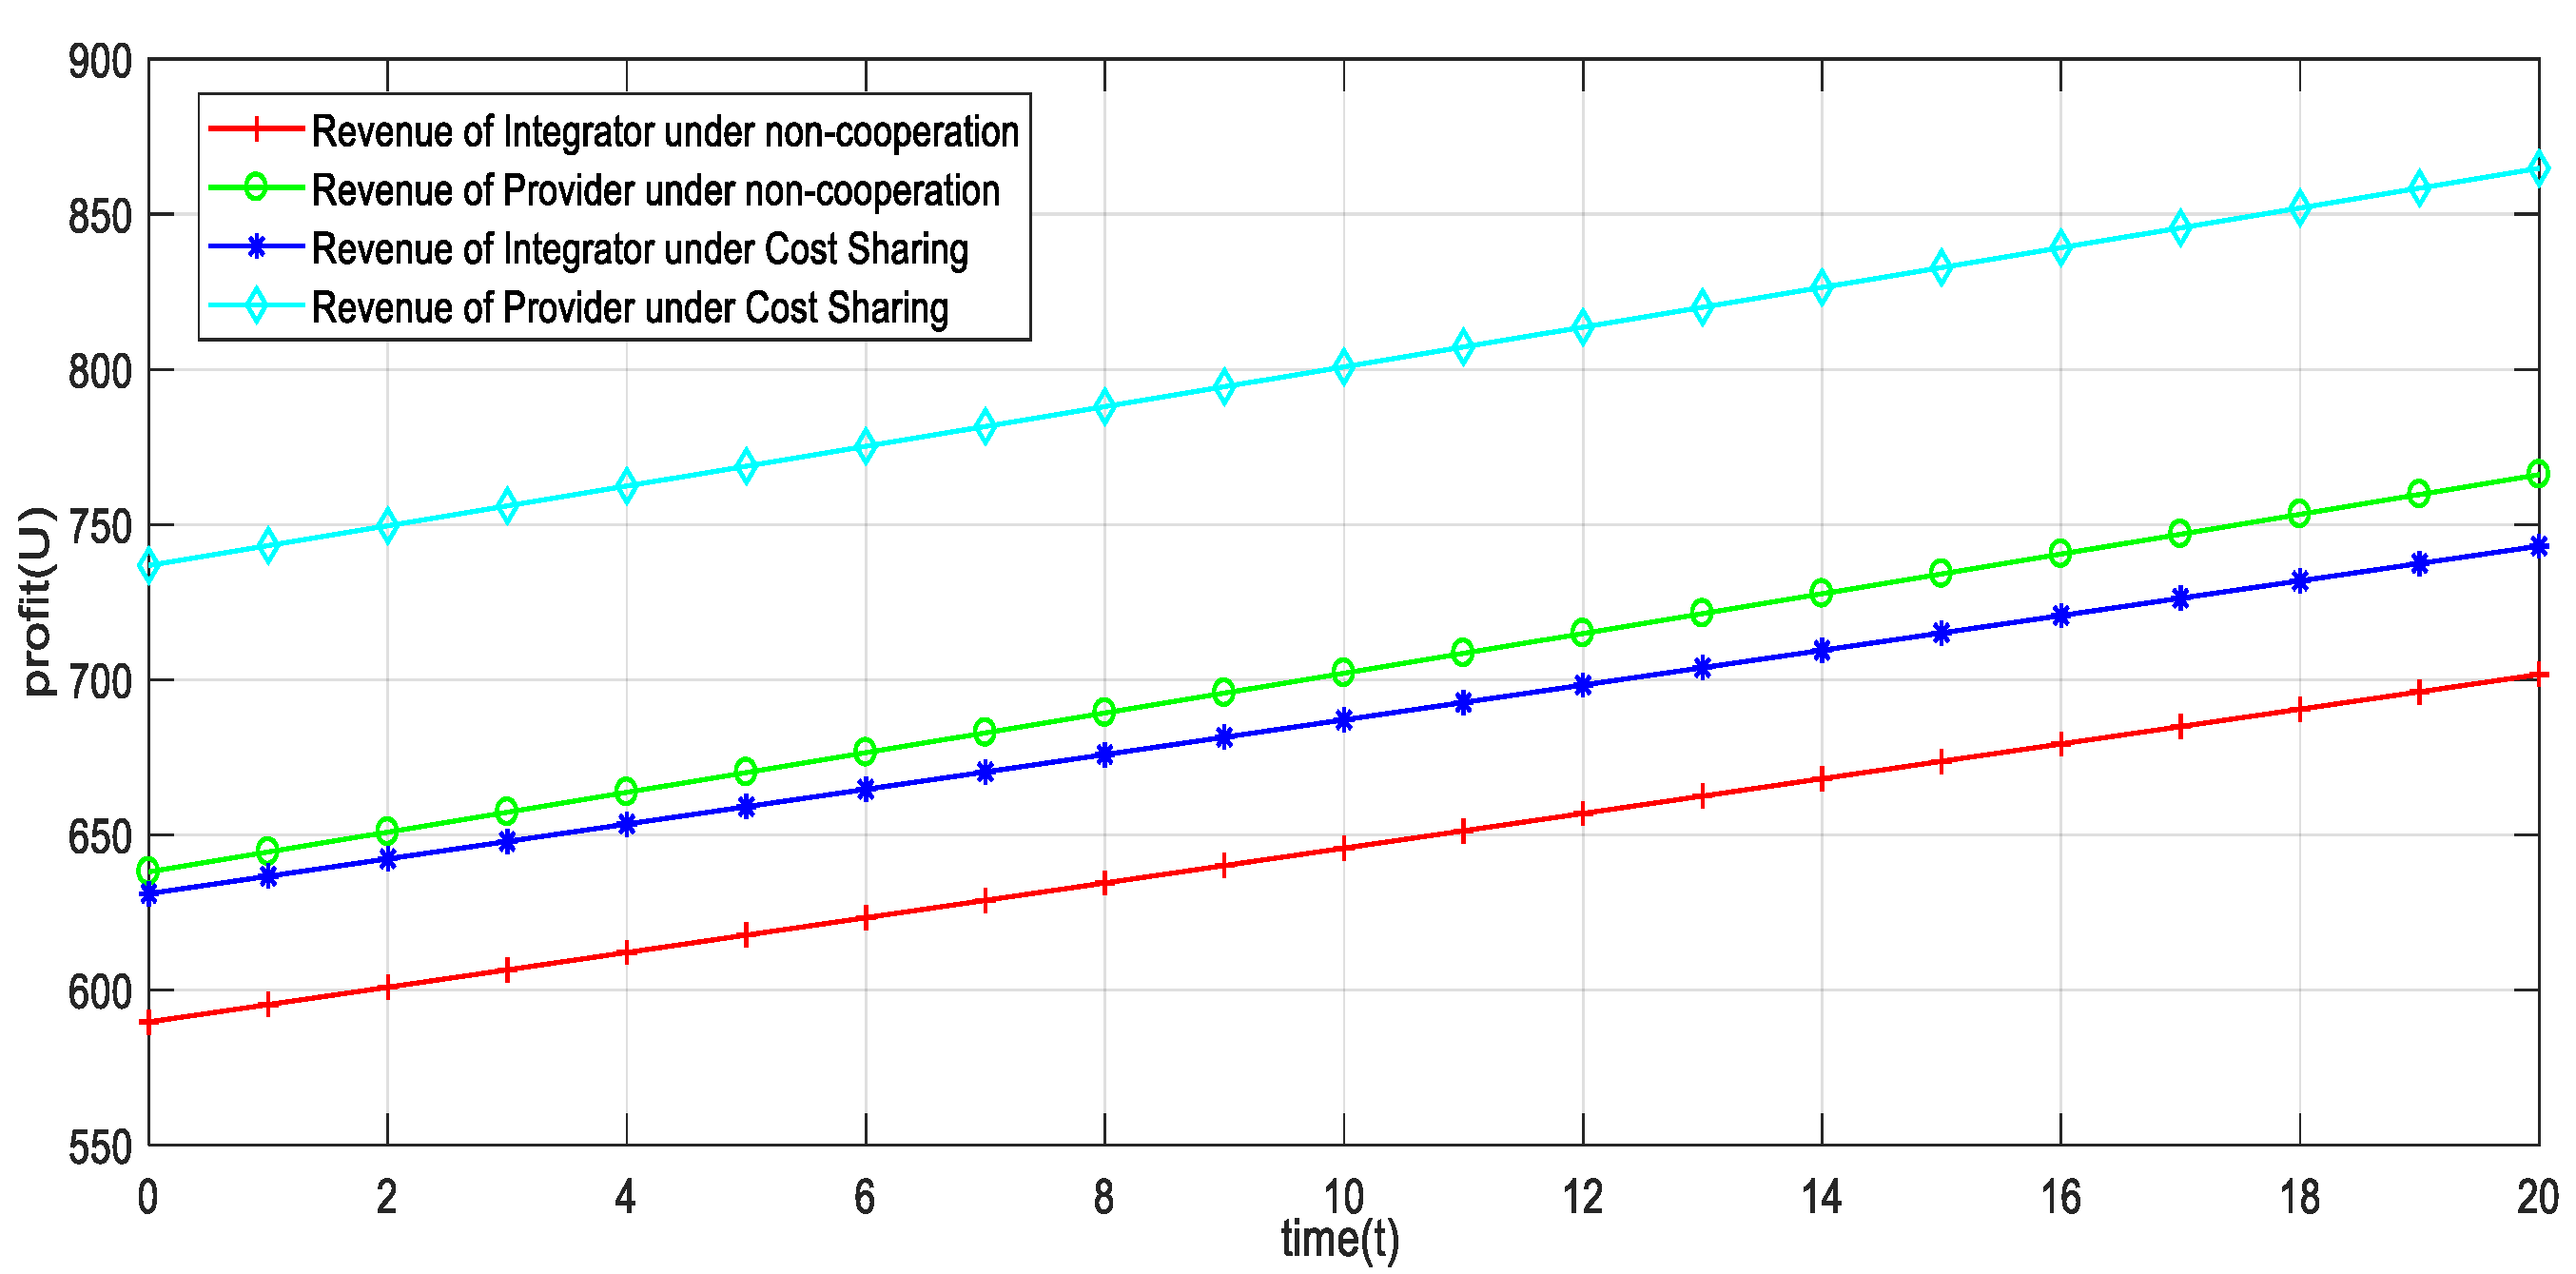
Further, according to Equations (13), (14), (26), and (27), the income trend of the Stackelberg model under the non-cooperative game of emission reduction and cost-sharing is discussed. It can be seen from Figure 3 that the optimal revenue functions of emission reduction in the non-cooperative game are smaller than the optimal revenue functions and U L S ( D ) in the case of cost-sharing. It can be seen that the emission reduction cost-sharing contract can improve the Pareto revenue of the provider and the integrator. Comparing the income trends of providers and integrators before and after the use of the abatement cost-sharing contract in Figure 3, it is found that the agreement is more effective in improving the income of the provider than that of the platform integrator. Under the logistics emission reduction cost-sharing mechanism, the integrators bear part of the onsite emission reduction costs of the providers. To obtain more market demand, the providers must provide logistics emission reduction services to ensure the continuity of cooperation. This virtuous cycle contributes to a further increase in provider revenue. At the same time, the strong market demand effectively compensated for the pressure of integrators to share the emission reduction cost, and the integrators’ income further increased. The income growth of the integrators and the providers in the shared logistics emission reduction cost was more significant than that in the non-cooperation scenario, and they jointly achieved Pareto improvements. However, since the improvement of the integrators’ emission reduction benefits is only affected by the change in demand, the marginal benefit effect is limited, whereas the logistics emission reduction costs and market demand both actively affect the provider’s benefits. Hence, the emission reduction cost-sharing mechanism has a better impact on the providers for the effect on the integrators.

6.2. Improvement Effect of Logistics Emission Reduction Cost-Sharing Contract

According to Equations (36) and (37), the impact of the logistics service provider cost parameter on the logistics emission reduction cost-sharing contract Pareto is known, as shown in Figure 4. With the increase in the cost coefficient of providers’ logistics abatement, the cost-sharing contract has a diminishing effect on the emission reduction benefits of providers and integrators with the O2O model. When the onsite provider’s emission reduction cost coefficient increases, the integrator has to pay more costs, and the incentive effect of the logistics emission reduction cost-sharing contract is not significant. Platform integrators need to consider onsite logistics emission reduction costs when implementing logistics abatement cost-sharing decisions. When the logistics abatement cost coefficient is small, a high-proportion sharing strategy is implemented. When the logistics emission reduction cost coefficient is significant, a shared process with a low-proportion ratio is provided. Therefore, controlling and improving the onsite logistics emission reduction cost of providers is a necessary condition to realize the collaborative governance of the logistics service supply chain with the O2O model. In recent years, the application of new energy technology and information technology has been continuously improved, and the intelligent and green level of the provider’s logistics system has developed rapidly. It is widely used in traditional onsite logistics business activities such as transportation, warehousing, distribution, packaging, loading, and unloading, which helps to achieve optimal scheduling and effective allocation of onsite logistics resources. It can also improve the service process and improve the level of logistics emission reduction by strengthening the management of the logistics process and improving the efficiency of emission reduction.
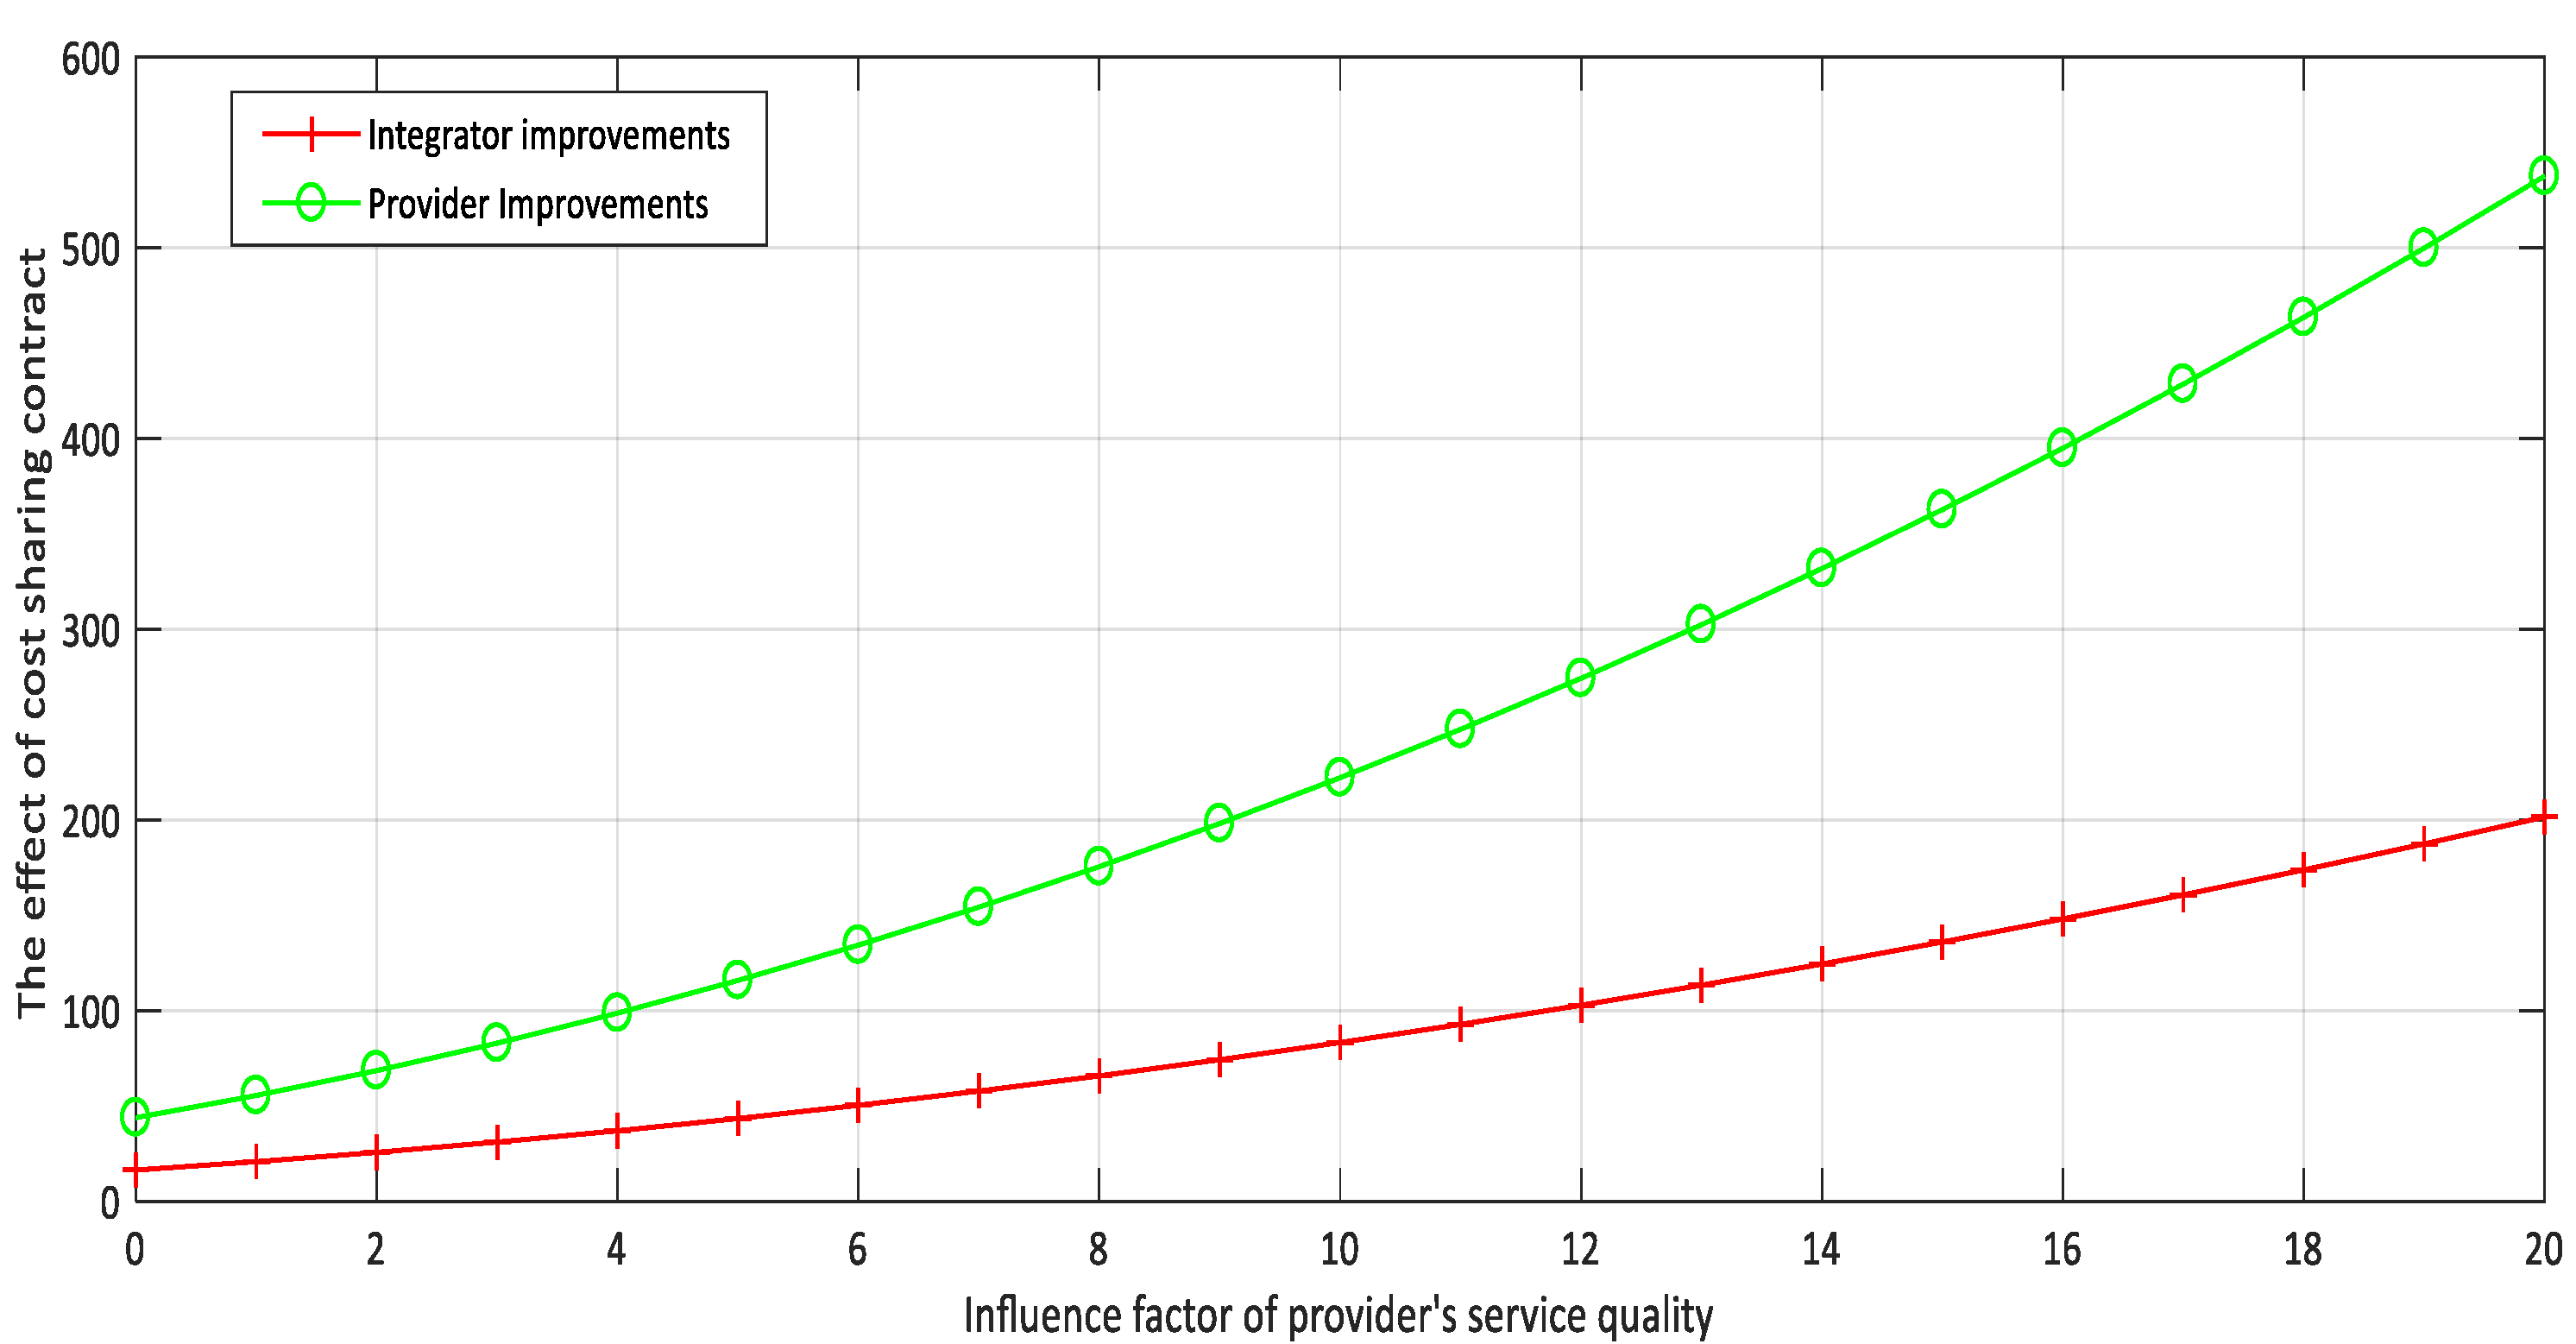
According to Equations (36) and (37), the influence coefficient of the market demand for emission reduction services on the logistics cost-sharing contract Pareto is known, as shown in Figure 5. The increase in the impact coefficient of the provider’s onsite logistics emission reduction has made the onsite emission reduction service customer more sensitive, and the onsite provider’s unit emission reduction service has encouraged more market demand. The income of integrators and providers under the cost-sharing contract has pushed the trend, and the contract has a more significant incentive effect on onsite providers’ emission reduction income. Platform integrators optimize the cost-sharing factor of logistics emission reduction by investigating the impact of onsite emission reduction services on the market and encourage providers to provide high-quality emission reduction services to further increase the level of benefits for both parties, which also strengthens logistics emission reduction for providers. The bargaining power of the cost-sharing contract enables onsite providers to share lower costs.
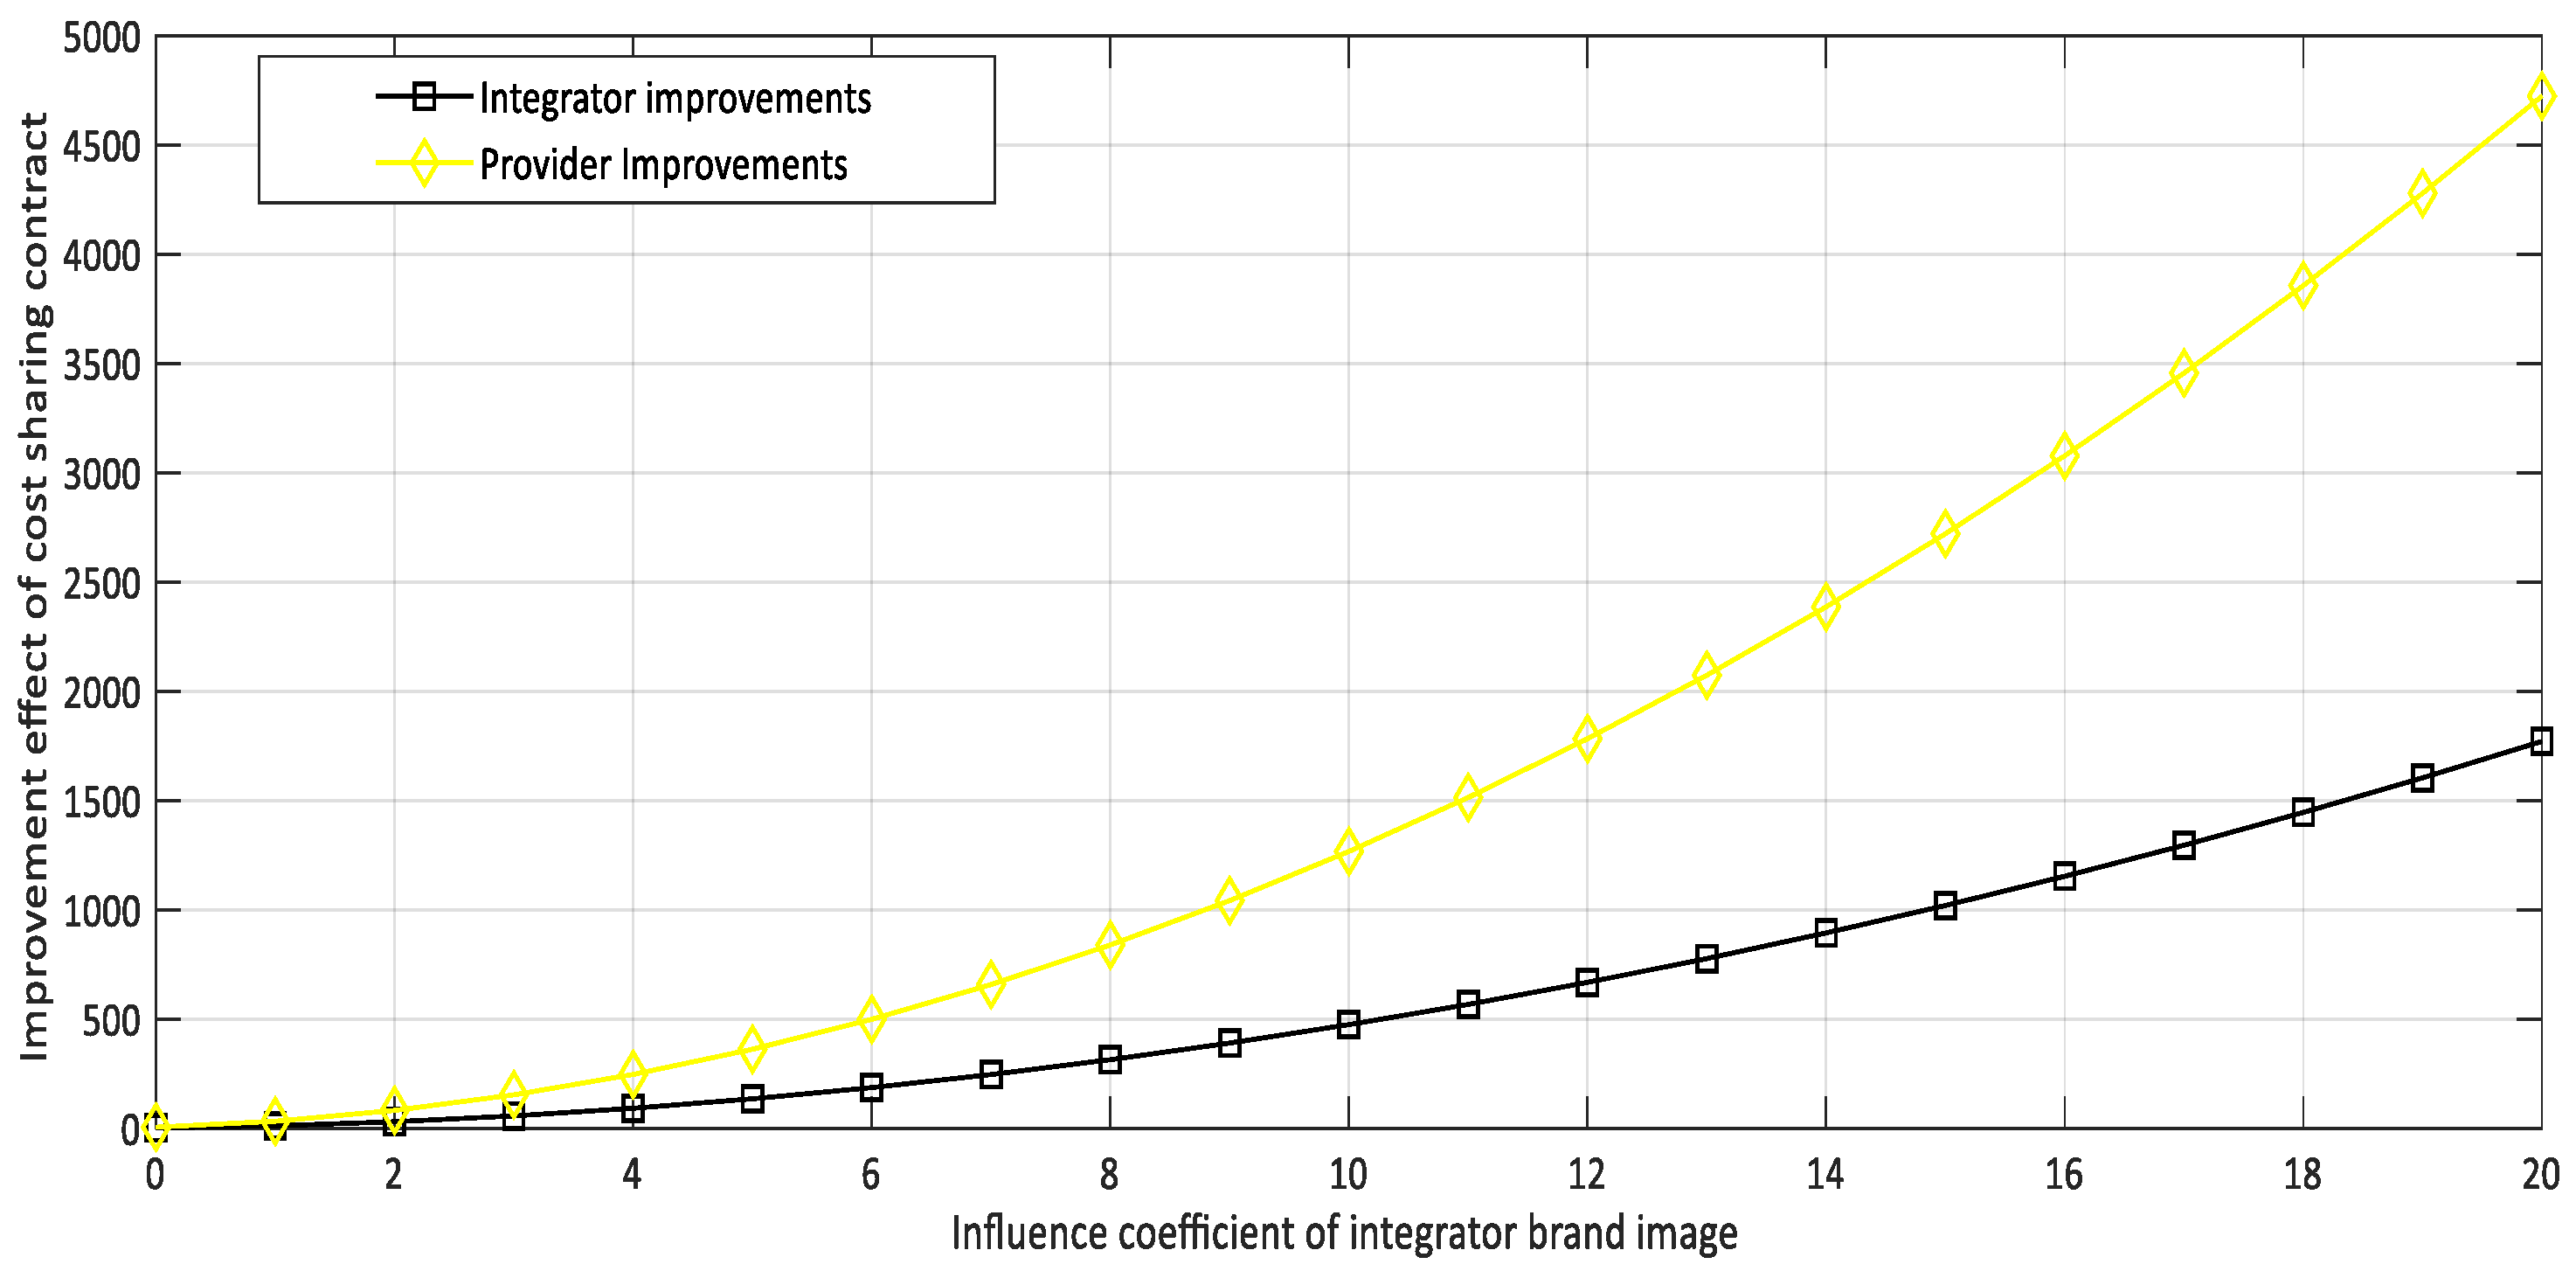
According to Formulas (36) and (37), the influence parameter of the integrator’s brand image on the Pareto contract of logistics emission reduction cost-sharing is obtained, as shown in Figure 6. With the improvement of the integrators’ brand image influence parameters, the integrators’ online platform can bring in more market customers, and the onsite emission reduction income has improved significantly. As the market demand has effectively compensated for the integrators’ emission reduction and sharing costs, its income growth continues to expand, and finally realizes revenue Pareto improvements. From the perspective of the improvement effect of providers and integrators, strengthening the brand image parameters is more meaningful to the advancement of supply chain revenue than onsite providers’ emission reduction cost parameters and emission reduction service parameters. The logic behind this phenomenon may be that the platform organizations are in a dominant position in the logistics service supply chain with the O2O model. With the popularization of social media, it is necessary to build a positive brand while reducing the onsite and online emission reduction cost parameters to improve the emission reduction benefits of the logistics service supply chain with the O2O model. The use of brand promotion to show the value of services to customers forms a word-of-mouth communication effect. The sharing of logistics emission reduction costs is conducive to more effective governance.

7. Conclusions and Implications

7.1. Conclusions

Considering the effect of cost-sharing on the emission reduction in the logistics service supply chain with the O2O model, a differential game model is introduced to study the emission reduction cooperation between integrators and providers. Using HJB to compare the online and onsite emission reduction efforts and logistics service supply chain benefits of providers and integrators in the non-cooperative Nash game, cost-sharing Stackelberg game, and cooperative game, this study is to determine the optimal emission reduction decision, optimal revenue, and emission reduction cost-sharing ratio. The main conclusions are as follows:
(1) According to the benefit analysis in Section 6.1, it can be seen that the collaborative cooperation of the O2O logistics service supply chain for emission reduction is the optimal strategy. The collaborative cooperation is an orderly structure formed spontaneously by subsystems under certain conditions through competition and cooperation for synergies. However, considering the high cost of governance of collaborative emission reduction by integrators and providers in practice, the difficulty of coordination among the players, and the information asymmetry, it is difficult to achieve the collaborative cooperation for emission reduction in the logistics service supply chain in the O2O mode. This not only requires sufficient resources but also an open system to complete consistent actions. The system of authority and responsibility structured by the cost-sharing contract of the logistics service supply chain in the O2O model should have a controlling and decisive role in the internal structure and operation so that the players can closely cooperate and perform their basic duties to achieve the orderly and efficient operation. According to this study, the O2O model of logistics service supply chain cooperation through the logistics abatement cost-sharing mechanism generates certain synergies which reduce the non-cooperative Nash gaming behaviour, ensure the formation of orderly abatement cooperation behaviour among participating subjects, and encourage the abatement revenue increase in the logistics service supply chain in the O2O mode.
(2) In the O2O mode, the integrator and the provider will consider the cost and benefit of logistics abatement and its impact on the brand image of the platform integrator and the market demand for logistics services. Through the sensitivity analysis of the logistics abatement cost parameter λ L , the coefficient of the impact of emission reduction on market demand θ L , and the coefficient of the impact on integrator brand image impact ε in Section 6.2, under the logistics abatement cost-sharing contract, the provider will consider not only its abatement service marginal revenue but also the integrator’s abatement service marginal revenue; whereas, in the scenario of abatement synergy cooperation, both parties will consider their own and each other’s abatement service marginal revenue.
(3) According to the comparative analysis of the equilibrium results in Section 5, when the marginal benefit of the online integrator’s abatement service in the O2O mode is π I > π L / 2 , the change in the integrator’s and the provider’s abatement service varies, with no change in the integrator’s abatement service, while the onsite provider’s abatement level is improved to the same extent as the logistics abatement cost-sharing coefficient. However, since the improvement of the integrator’s abatement benefit is only affected by the demand change, the marginal benefit effect is limited; whereas, the logistics abatement cost and the market demand both positively affect the provider’s return, so the abatement cost-sharing mechanism has a better effect on the provider than on the integrator.
(4) In Proposition 5 of the equilibrium results comparison in Section 5, compared with the non-cooperative Nash game scenario, the logistics abatement cost-sharing improves both the logistics service supply chain system and the internal subject’s revenue in the O2O mode, and cost-sharing in the O2O mode can form a power and responsibility system for internal subjects to further guarantee the continuous improvement of the efficiency of abatement services in the logistics service supply chain. The marginal revenue of an online platform is positively correlated with its increment, and when the marginal revenue of abatement service is substantial, the more revenue of abatement service of integrators, the greater incentive the integrators to adopt logistics abatement cost-sharing contract to motivate onsite providers to implement the abatement service.

7.2. Managerial Implications

The implementation of the logistics service supply chain emission reduction contract with cost-sharing with the O2O model is an effective measure for the integrator and the provider to implement emission reduction cooperation. Firstly, platform integrators can use big data, cloud computing, and artificial intelligence technology to analyze online customer comments, usage intentions, satisfaction, and other related information, understand the real needs and ideas of enterprises and stay close to market demand trends. Integrators can provide timely professional emission reduction services to develop feasible plans for onsite logistics. Secondly, to stimulate the enthusiasm of providers for emission reduction services, integrators can reduce the cost of onsite logistics emission reduction in the form of direct subsidies, and fully balance the constrained decision-making under the condition of profit maximization. They can consolidate the benefits and continuous willingness of cooperation between the two parties and increase the enthusiasm of the providers to reduce emissions, thereby indirectly enhancing the brand image of the platform and increasing the value and benefits of cooperation between the two parties. Third, considering that the building of a platform brand image depends on innovative Internet promotion and the user interaction ecosystem, the participation of upstream and downstream entities in value co-creation helps to shape online and onsite brand images and platform companies can make full use of their logistics service supply chain with the O2O model. The leading position of the organization is to actively create a sustainable Internet product innovation model, build a smooth information communication mechanism based on interactive experience, and achieve the purpose of enhancing the green brand image of the integrated platform market. Finally, both parties are facing gradual low-carbon transformation of the logistics service supply chain in the O2O mode. The suppliers, as the main player of the emission reduction, offer onsite emission reduction services based on “low energy consumption, low pollution, and low emissions”, to reduce the green operation cost of onsite enterprises. On the premise of ensuring the independent operation of the core business, the integrators can cooperate in green technology innovation, clean energy investment, and low-carbon operation design. It is a shared strategy to support the sustainable development of emission reduction to achieve a win-win situation.

7.3. Limitations and Future Research Directions

This paper focuses on analyzing the decision of logistics service supply chain abatement service in the O2O mode, and the impact of low carbon product price is not considered in the modelling, and further research on the decision of abatement service is considered to include price factor. In addition, although the design of logistics abatement cost-sharing contract can achieve Pareto optimization of logistics service supply chain benefits in the O2O mode, it has not yet reached the ideal situation where integrators and providers collaborate in decision-making, and more in-depth research on cost-sharing of a certain abatement behaviour, such as the sharing mechanism of input costs for abatement technology innovation and equipment utilization, can be further developed regarding the platform brand in the future.

Author Contributions

Conceptualization, G.Z. and X.W.; methodology, G.Z.; writing—original draft preparation, G.Z.; writing—review and editing, X.W., J.K. and Y.Z. All authors have read and agreed to the published version of the manuscript.

Funding

This work was supported by the National Social Science Foundation of China, grant number 21BJY227.

Institutional Review Board Statement

Not applicable.

Informed Consent Statement

Not applicable.

Data Availability Statement

Not applicable.

Acknowledgments

We would like to be grateful to the editors and anonymous referees for their valuable comments. This work was supported by the National Social Science Foundation of China, grant number 21BJY227.

Conflicts of Interest

The authors declare that they have no known competing financial interests or personal relationships that could have appeared to influence the work reported in this paper.

References

  1. Liu, W.H.; Xu, X.C.; Ren, Z.X.; Peng, Y. An emergency order allocation model based on multi-provider in two-echelon logistics service supply chain. Supply Chain Manag. 2011, 16, 391–400. [Google Scholar]
  2. Choi, T.M. Internet based elastic logistics platforms for fashion quick response systems in the digital era. Transp. Res. Part E Logist. Transp. Rev. 2020, 143, 102096. [Google Scholar] [CrossRef]
  3. Qin, X.; Liu, Z.; Tian, L. The strategic analysis of logistics service sharing in an e-commerce platform. Omega 2020, 92, 102153. [Google Scholar] [CrossRef]
  4. Niu, B.; Li, Q.; Mu, Z.; Chen, L.; Ji, P. Platform logistics or self-logistics? Restaurants’ cooperation with online food-delivery platform considering profitability and sustainability. Int. J. Prod. Econ. 2021, 234, 108064. [Google Scholar]
  5. Tang, S.; Wang, W.; Yan, H.; Hao, G. Low carbon logistics: Reducing shipment frequency to cut carbon emissions. Int. J. Prod. Econ. 2015, 164, 339–350. [Google Scholar] [CrossRef]
  6. Wang, X.; Dong, F. The dynamic relationships among growth in the logistics industry, energy consumption, and carbon emission: Recent evidence from China. J. Pet. Explor. Prod. Technol. 2022, 1–16. [Google Scholar] [CrossRef]
  7. Xiao, R.; Pan, L.; Xiao, H.; Xiao, H.; Zhu, Z. Research of Intelligent Logistics and High-Quality Economy Development for Yangtze River Cold Chain Shipping Based on Carbon Neutrality. J. Mar. Sci. Eng. 2022, 10, 1029. [Google Scholar] [CrossRef]
  8. Mak, S.L.; Wong, Y.M.; Ho, K.C.; Lee, C.C. Contemporary Green Solutions for the Logistics and Transportation Industry—With Case Illustration of a Leading Global 3PL Based in Hong Kong. Sustainability 2022, 14, 8777. [Google Scholar] [CrossRef]
  9. Zhang, A.; Alvi, M.F.; Gong, Y.; Wang, J.X. Overcoming barriers to supply chain decarbonization: Case studies of first movers. Resour. Conserv. Recycl. 2022, 186, 106536. [Google Scholar] [CrossRef]
  10. Ji, S.; Sun, Q. Low-carbon planning and design in B&R logistics service: A case study of an e-commerce big data platform in China. Sustainability 2017, 9, 2052. [Google Scholar] [CrossRef] [Green Version]
  11. Liu, W.; Wang, M.; Zhu, D.; Zhou, L. Service capacity procurement of logistics service supply chain with demand updating and loss-averse preference. Appl. Math. Model. 2019, 66, 486–507. [Google Scholar] [CrossRef]
  12. Liu, W.H.; Xie, D. Quality decision of the logistics service supply chain with service quality guarantee. Int. J. Prod. Res. 2013, 51, 1618–1634. [Google Scholar] [CrossRef]
  13. Du, N.; Han, Q. Pricing and service quality guarantee decisions in logistics service supply chain with fairness concern. Asia-Pac. J. Oper. Res. 2018, 35, 1850036. [Google Scholar] [CrossRef]
  14. Yu, Y.; Xiao, T. Pricing and cold-chain service level decisions in a fresh agri-products supply chain with logistics outsourcing. Comput. Ind. Eng. 2017, 111, 56–66. [Google Scholar] [CrossRef]
  15. Zhang, Y.; Rong, F.; Wang, Z. Research on cold chain logistic service pricing—Based on tripartite Stackelberg game. Neural Comput. Appl. 2020, 32, 213–222. [Google Scholar] [CrossRef]
  16. Mangano, G.; Zenezini, G.; Cagliano, A.C.; De Marco, A. The dynamics of diffusion of an electronic platform supporting City Logistics services. Oper. Manag. Res. 2019, 12, 182–198. [Google Scholar] [CrossRef]
  17. Zhou, Z.; Wan, X. Does the Sharing Economy Technology Disrupt Incumbents? Exploring the Influences of Mobile Digital Freight Matching Platforms on Road Freight Logistics Firms. Prod. Oper. Manag. 2022, 31, 117–137. [Google Scholar]
  18. Liu, W.; Long, S.; Liang, Y.; Wang, J.; Wei, S. The influence of leadership and smart level on the strategy choice of the smart logistics platform: A perspective of collaborative innovation participation. Ann. Oper. Res. 2021, 1–43. [Google Scholar] [CrossRef]
  19. Qu, F.; Liu, Z. Research on the Information Platform Establishment of Logistics Services Supply Chain from the Perspective of Tripartite Coordination. In Proceedings of the 2017 4th International Conference on Education, Management and Computing Technology (ICEMCT 2017), Hangzhou, China, 15–16 April 2017; Atlantis Press: Amsterdam, The Netherlands, 2017; pp. 489–492. [Google Scholar]
  20. Yang, Y.; Pan, S.; Ballot, E. Mitigating supply chain disruptions through interconnected logistics services in the Physical Internet. Int. J. Prod. Res. 2017, 55, 3970–3983. [Google Scholar] [CrossRef]
  21. Tang, C.S.; Veelenturf, L.P. The strategic role of logistics in the industry 4.0 era. Transp. Res. Part E Logist. Transp. Rev. 2019, 129, 1–11. [Google Scholar] [CrossRef]
  22. Lin, Y.; Chen, A.; Yin, Y.; Li, Q.; Zhu, Q.; Luo, J. A framework for sustainable management of the platform service supply chain: An empirical study of the logistics sector in China. Int. J. Prod. Econ. 2021, 235, 108112. [Google Scholar] [CrossRef]
  23. Zhou, Y.; Bao, M.; Chen, X.; Xu, X. Co-op advertising and emission reduction cost sharing contracts and coordination in low-carbon supply chain based on fairness concerns. J. Clean. Prod. 2016, 133, 402–413. [Google Scholar] [CrossRef]
  24. He, P.; He, Y.; Shi, C.V.; Xu, H.; Zhou, L. Cost-sharing contract design in a low-carbon service supply chain. Comput. Ind. Eng. 2020, 139, 106160. [Google Scholar] [CrossRef]
  25. Hwang, H.S. Design of supply-chain logistics system considering service level. Comput. Ind. Eng. 2002, 43, 283–297. [Google Scholar] [CrossRef]
  26. Ma, F.; Xue, H.; Yuen, K.F.; Sun, Q.; Zhao, S.; Zhang, Y.; Huang, K. Assessing the vulnerability of logistics service supply chain based on complex network. Sustainability 2020, 12, 1991. [Google Scholar] [CrossRef] [Green Version]
  27. Yuan, Y.; Ju, S.D.; Ding, G.Z. Functional logistics service provider selection for online retailing logistics service supply chain (LSSC). J. Balk. Tribol. Assoc. 2016, 22, 2136–2144. [Google Scholar]
  28. Zhang, G.; Wang, X.; Meng, Z.; Zhang, Q.; Wu, K. Operation decision of logistics service supply chain: Considering interruption probability in emergencies. Kybernetes 2021. [Google Scholar] [CrossRef]
  29. Zhong, Y.; Guo, F.; Tang, H.; Chen, X. Research on coordination complexity of E-commerce logistics service supply chain. Complexity 2020, 2020, 7031543. [Google Scholar] [CrossRef]
  30. Lin, M.S.M.; Potter, A.; Pettit, S. Relationship heterogeneity in Taiwanese maritime logistics service supply chains. Supply Chain Manag. Int. J. 2021, 26, 385–401. [Google Scholar] [CrossRef]
  31. Liu, W.; Wei, W.; Zhu, D. Service capacity procurement in logistics service supply chain with demand updating and reciprocal behaviour. Eur. J. Ind. Eng. 2021, 15, 35–66. [Google Scholar] [CrossRef]
  32. Zhang, G.; Wang, X.; Wang, Y.; Kang, J. Research on the Resilient Evolutionary Game of Logistics Service Supply Chain with Government Participation. Mathematics 2022, 10, 630. [Google Scholar] [CrossRef]
  33. Dai, H.; Cui, Y.W.; Guo, L.F.; Ma, J.Q. Construction and Application Analysis of Logistics Service Supply Chain Based on Block Chain. J. Environ. Prot. Ecol. 2019, 20, 1554–1564. [Google Scholar]
  34. Liu, H.; Chen, H.; Zhang, H.; Liu, H.; Yu, X.; Zhang, S. Contract Design of Logistics Service Supply Chain Based on Smart Transformation. Sustainability 2022, 14, 6261. [Google Scholar] [CrossRef]
  35. Liu, X.; Zhang, K.; Chen, B.; Zhou, J.; Miao, L. Analysis of logistics service supply chain for the One Belt and One Road initiative of China. Transp. Res. Part E Logist. Transp. Rev. 2018, 117, 23–39. [Google Scholar] [CrossRef]
  36. Bai, Q.; Jin, M.; Xu, X. Effects of carbon emission reduction on supply chain coordination with vendor-managed deteriorating product inventory. Int. J. Prod. Econ. 2019, 208, 83–99. [Google Scholar] [CrossRef]
  37. Wang, Q.; Li, B.; Chen, B.; Cheng, Y.; Wang, Z. Implication of take-back and carbon emission capacity regulations on remanufacturing in a competitive market. J. Clean. Prod. 2021, 325, 129231. [Google Scholar] [CrossRef]
  38. Wang, Y.; Fan, R.; Shen, L.; Miller, W. Recycling decisions of low-carbon e-commerce closed-loop supply chain under government subsidy mechanism and altruistic preference. J. Clean. Prod. 2020, 259, 120883. [Google Scholar] [CrossRef]
  39. Ma, C.; Yang, H.; Zhang, W.; Huang, S. Low-carbon consumption with government subsidy under asymmetric carbon emission information. J. Clean. Prod. 2021, 318, 128423. [Google Scholar] [CrossRef]
  40. Koberg, E.; Longoni, A. A systematic review of sustainable supply chain management in global supply chains. J. Clean. Prod. 2019, 207, 1084–1098. [Google Scholar] [CrossRef]
  41. Mohaghegh, M.; Blasi, S.; Gossler, A. Dynamic capabilities linking lean practices and sustainable business performance. J. Clean. Prod. 2021, 322, 129073. [Google Scholar] [CrossRef]
  42. Yang, Y.; Xu, X. A differential game model for closed-loop supply chain participants under carbon emission permits. Comput. Ind. Eng. 2019, 135, 1077–1090. [Google Scholar] [CrossRef]
  43. Sun, L.; Cao, X.; Alharthi, M.; Zhang, J. Carbon emission transfer strategies in supply chain with lag time of emission reduction technologies and low-carbon preference of consumers. J. Clean. Prod. 2020, 264, 121664. [Google Scholar] [CrossRef]
  44. Wei, J.; Wang, C. Improving interaction mechanism of carbon reduction technology innovation between supply chain enterprises and government by means of differential game. J. Clean. Prod. 2021, 296, 126578. [Google Scholar] [CrossRef]
  45. He, L.; Yuan, B.; Bian, J.; Lai, K.K. Differential game theoretic analysis of the dynamic emission abatement in low-carbon supply chains. Ann. Oper. Res. 2021, 1–39. [Google Scholar] [CrossRef]
  46. Wu, P.; Yin, Y.; Li, S.; Huang, Y. Low-Carbon Supply Chain Management Considering Free Emission Allowance and Abatement Cost Sharing. Sustainability 2018, 10, 2110. [Google Scholar] [CrossRef]
  47. Yu, C.; Wang, C.; Zhang, S. Advertising cooperation of dual-channel low-carbon supply chain based on cost-sharing. Kybernetes 2019, 49, 1169–1195. [Google Scholar] [CrossRef]
  48. Liu, W.; Wang, Y. Quality control game model in logistics service supply chain based on different combinations of risk attitude. Int. J. Prod. Econ. 2015, 161, 181–191. [Google Scholar] [CrossRef]
  49. Nagurney, A.; Yu, M. Sustainable fashion supply chain management under oligopolistic competition and brand differentiation. Int. J. Prod. Econ. 2012, 135, 532–540. [Google Scholar] [CrossRef]
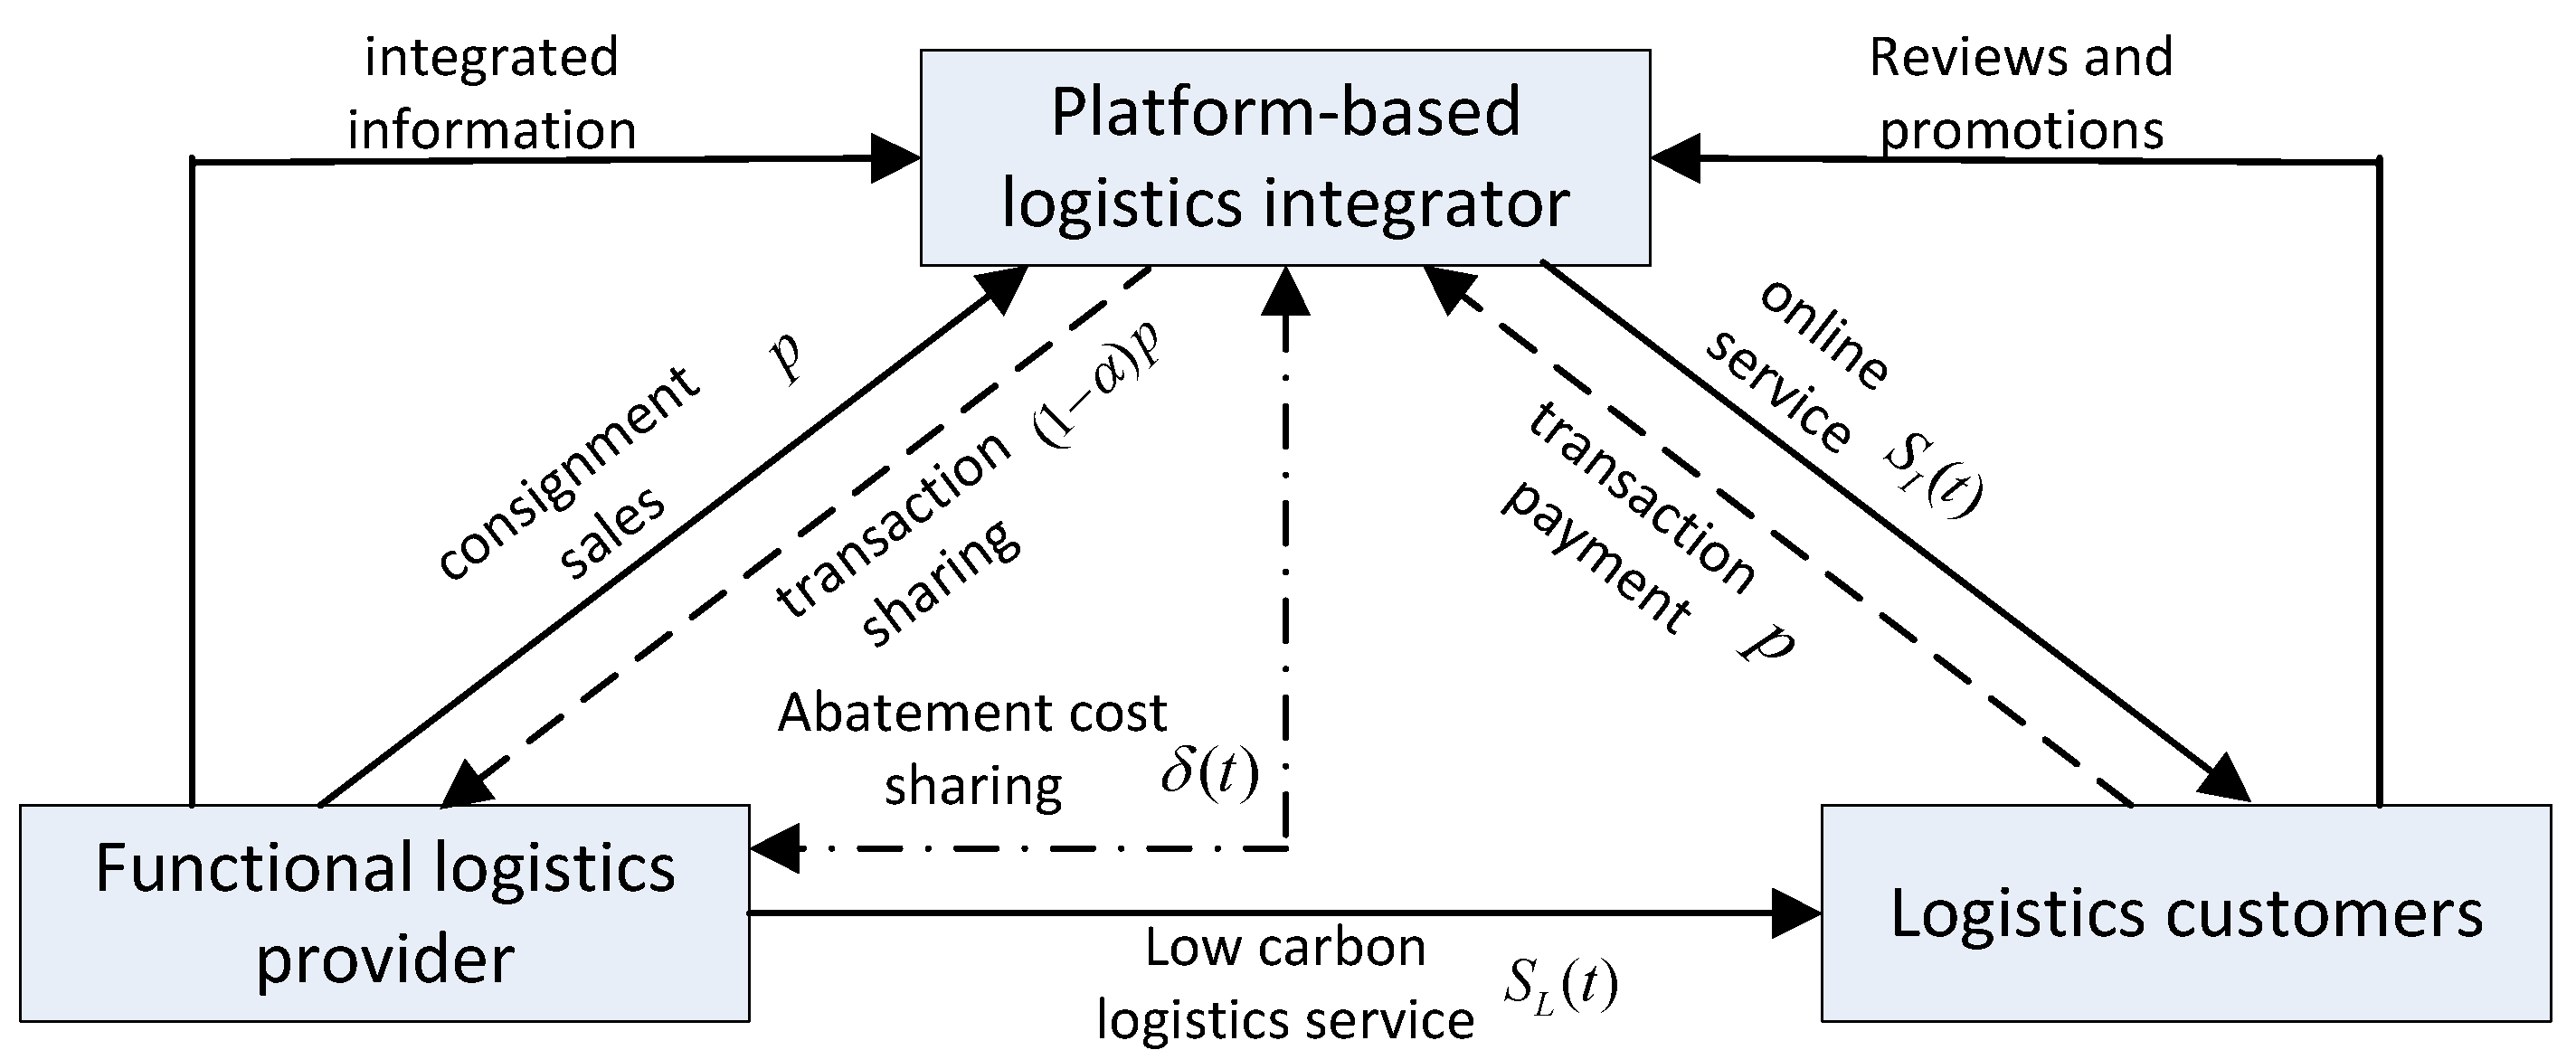
Figure 1. Cost-sharing model of logistics service supply chain emission reduction with O2O model.
Sustainability 14 13247 g001
Figure 2. Comparison of emission reduction benefits of logistics service supply chain in the O2O mode.
Sustainability 14 13247 g002
Figure 3. Comparison of benefits between integrators and providers before and after the emission reduction cost-sharing.
Sustainability 14 13247 g003
Figure 4. Sensitivity to the impact of logistics cost-sharing contracts.
Sustainability 14 13247 g004
Figure 5. Sensitivity to the impact of abatement cost-sharing contracts.
Sustainability 14 13247 g005
Figure 6. Sensitivity to the impact of logistics abatement cost-sharing contracts.
Sustainability 14 13247 g006
Publisher’s Note: MDPI stays neutral with regard to jurisdictional claims in published maps and institutional affiliations.