Article

Optimum Size of Hybrid Renewable Energy System to Supply the Electrical Loads of the Northeastern Sector in the Kingdom of Saudi Arabia

by
Sulaiman Alshammari
1 and
Ahmed Fathy
1,2,*
1
Electrical Engineering Department, Faculty of Engineering, Jouf University, Sakaka 72388, Saudi Arabia
2
Electrical Power and Machines Department, Faculty of Engineering, Zagazig University, Zagazig 44519, Egypt
*
Author to whom correspondence should be addressed.
Sustainability 2022, 14(20), 13274; https://doi.org/10.3390/su142013274
Submission received: 15 September 2022 / Revised: 12 October 2022 / Accepted: 13 October 2022 / Published: 15 October 2022
(This article belongs to the Special Issue Smart Grid Technologies and Renewable Energy Applications)

Abstract

:
Due to the unpredictable nature of renewable sources such as sun and wind, the integration of such sources to a grid is complicated. However, a hybrid renewable energy system (HRES) can solve this problem. Constructing a reliable HRES in remote areas is essential. Therefore, this paper proposes a new methodology incorporating a crow search algorithm (CSA) for optimizing the scale of an HRES installed in a remote area. The constructed system comprises photovoltaic (PV) panels, wind turbines (WTs), batteries, and diesel generators (DGs). The target is to achieve the most economical and efficient use of renewable energy sources (RESs). The CSA is used as it is simple in implementation, it only requires a few parameters, and it has a high flexibility. The designed system is constructed to serve an electrical load installed in the northeastern region of the Kingdom of Saudi Arabia. The load data are provided by the Saudi Electricity Company, including those of the Aljouf region (Sakaka, Alqurayyat, Tabarjal, Dumat Aljandal, and its villages) and the northern border region (Arar, Tarif, Rafha, and its affiliated villages). The temperature, irradiance, and wind speed of the Aljouf region (latitude 29.764° and longitude 40.01°) are collected from the National Aeronautics and Space Administration (NASA) from 1 January to 31 December 2020. Three design factors are considered: the PV number, the WT number, and the number of days of battery autonomy (AD). We compared our results to the reported approaches of an elephant herding optimizer (EHO), a grasshopper optimization algorithm (GOA), a Harris hawks optimizer (HHO), a seagull optimization algorithm (SOA), and a spotted hyena optimizer (SHO). Moreover, the loss of power supply probability (LPSP) is calculated to assess the constructed system’s reliability. The proposed COA succeeded in achieving the best fitness values of 0.03883 USD/kWh, 0.03863 USD/kWh, and 0.04585 USD/kWh for PV/WT/battery, PV/battery, and WT/battery systems, respectively. The obtained results confirmed the superiority of the proposed approach in providing the best configuration of an HRES compared to the others.

1. Introduction

The high rate of population growth around the world has been followed by a rise in the energy consumption rate, whether of fuel, electricity, or other sources. Renewable energy sources (RESs) are used to avoid harming the environment, for example by decreasing global warming, preserving current resources, attaining balance, and meeting life requirements for economic development and future generations. Renewable energy is energy derived from natural sources that can be renewed continually, such as wind energy, solar energy, geothermal energy, water energy, and biomass. RESs are clean and environmentally friendly, as their productions do not cause pollution. They depend on many climatic conditions, as for example, solar energy is only available during the presence of sunlight. Therefore, it cannot be generated during the night, so it is not possible to rely on one source to feed the load for a long time. Therefore, the use of a hybrid system with several RESs comprising photovoltaic (PV) panels, wind turbines (WTs), and a storage system is mandatory for creating a reliable generating system. Moreover, the excess energy at times of excess generation can be stored and used in times of under-generation. The reported approaches employed for the components of HRESs can be explained as follows:
González et al. [1] determined the optimal size of a PV/WT hybrid system connected to the grid using actual hourly irradiation and wind speed data in addition to the required energy at the location of installation. The methodology achieved the minimum cycle of the system’s life cost. Moreover, a sensitivity analysis has also been carried out to identify the variables that are more critical for the system. Kaabeche et al. [2] determined the optimal size of a solar PV and WT hybrid generation system with a battery bank via an iterative optimization method. The authors considered partial models of the system, the loss of the power supply probability (LPSP), and the levelized unit electricity cost (LUEC). Fathy et al. [3] developed a new method based on a social spider optimizer (SSO) to identify the optimal size of a microgrid with hybrid RESs. The considered system used PV/WT, batteries, a diesel generator, and inverters. The cost of energy (COE) was the target. The authors considered the PV panel number, WT number, and the number of battery autonomy days as the variables to be designed. Xu et al. [4] introduced a genetic algorithm (GA)-based methodology to evaluate the optimal size of an independent hybrid WT/PV electrical system, in which the system’s capital cost is mitigated. Moghaddam et al. [5] presented an approach using a grey wolf optimizer (GWO) to evaluate the optimal size of a PV/WT hybrid system, in which the system’s annual expense is minimized. The optimal number of WTs, PV modules, and batteries have been determined. Tutkun et al. [6] minimized the annual cost of a hybrid PV/WT linked to a network for satisfying a residential load at a particular location where the network expansion is not available. Kartite et al. [7] presented a method for evaluating the optimal size of a hybrid PV/WT/battery system using the principle of depletion LPSP and the annual system cost, in addition to a backtracking search algorithm. Belfkira et al. [8] employed a deterministic method to seize a hybrid WT/PV/DG generation system. This approach used a mathematical algorithm for evaluating the optimum number and form of units from a list of commercial control systems to minimize the overall system costs. Zhang et al. [9] designed a hybrid generation system comprising PV, WT, DG, and a battery. An analysis was performed to optimize the number and form of each component to mitigate the system cost. Mohamed et al. [10] solved the problem of sizing the generation sources installed in a microgrid comprising PV, WT, DG, and a storage battery. The system was constructed using the suggestion method of optimization on the basis of an iterative simulation. Smaoui et al. [11] presented an iterative optimization technology to determine the optimal size of a PV/WT hybrid system with a storage hydrogen system. The load was a desalination plant for seawater on Kerkennah island in Southern Tunisia. Fathy [12] presented a mine blast algorithm (MBA)-based approach to identify the optimum size of a hybrid system comprising WT, PV, a fuel cell (FC), an electrolyzer, and a hydrogen tank. Tégani et al. [13] suggested a technique for determining the optimum size of a hybrid off-grid (PV/WT) system by a GA; moreover, a control strategy dependent on the variable flatness concept was provided. The aim of the suggested technique is to choose the optimal number of PV panels, WTs, batteries, the maximum power point tracker (MPPT) controllers, and inverters. Gupta et al. [14] suggested an optimal PV/battery connected to a unreliable grid; moreover, it was examined to determine the user-defined pressure drop probability. Brahmi et al. [15] proposed a sizing algorithm for providing the optimal size of a WT/PV/ battery for supplying agricultural goods. The dimensions included the renewable energy capacity, generator models, and load profile. Ould et al. [16] presented a technique for sizing and optimizing an off-grid hybrid wind/PV/diesel/battery bank that minimizes CO2 emissions and levelizes the cost of energy (LCE) using a multi-target GA. The purpose of that study was to explore the variance of the load profile with the optimum configuration. Hamanah et al. [17] optimized the architecture of a hybrid energy source that included a wind farm, solar array, DG, and battery bank. The target was to reduce the yearly cost as much as possible. The lightning search method was employed to evaluate the optimum cost of the constructed system. Rehman et al. [18] presented different hybrid wind, PV, and DG for a community in Northeastern Saudi Arabia. Power generating systems using diesel, wind/diesel, PV/diesel, and wind/PV/diesel were constructed and compared to identify the ideal alternative system based on the lowest energy cost and least amount of environmental effects. The PV/diesel generation system was discovered to be the most economical solution. Almutairi et al. [19] suggested a hybrid renewable energy generation unit to supply buildings in the Iranian village of Bostegan in the Hormozgan region. They used HOMER software to undertake technical, economic, and environmental analyses, and find the best arrangement for the system components. The authors concluded that combining wind energy, solar energy, a converter, and a backup system of a diesel engine and batteries was the most cost-effective solution. Diab et al. [20] created a simulation model illustrating the functioning of a wind/PV/diesel microgrid with a battery storage system in the Abu-Monqar community in western desert of Egypt. The target was mitigating tye COE supplied by the system while boosting the system’s efficiency and reliability as indicated by an LPSP. Abbassi et al. [21] introduced a virus colony search algorithm to mitigate the total cost of the electricity generated from a PV/WT/battery system. Zhao et al. [22] managed the energy of a grid-connected microgrid with renewable energy generating units optimally via a hybrid optimizer comprising shuffled frog leaping and a pattern search. A modified moth flame optimizer has been used to identify the optimal size of a stand-alone renewable energy generation system such that the total cost of electricity is minimized [23]. Moreover, an LPSP was employed to enhance the selected configuration reliability. Li et al. [24] presented a hybrid approach of a gravitational search algorithm and a pattern search to implement the energy management of a renewable energy-based microgrid with plug-in hybrid electric vehicles (PHEVs). Suresh et al. [25] constructed an optimal configuration of a wind/PV system with a backup battery bank, a DG via a particle swarm optimizer (PSO) and a GA, such that the system total cost is mitigated. A bifacial rooftop, a floating solar/wind energy system, and solid waste-based waste energy have been evaluated for use in smart cities using an adaptive local attractor-based quantum-behaved PSO to achieve the most economic operation of the constructed system [26]. Al-Othman et al. [27] conducted a comprehensive review on artificial intelligence applications in hybrid renewable energy systems. A multi-objective evolutionary algorithm with decision-making was used to establish a wind/PV/battery/thermal energy storage system to minimize the net present cost and LPSP [28].
As the reader can see, great works have been reported identifying the optimal size of a hybrid renewable energy-based system; however, the employed metaheuristic optimization approaches still need more enhancement, as some algorithms have a low convergence rate and may become stuck in local optima. Moreover, some works have neglected the use of reliability factors to assess the constructed systems. Furthermore, the approaches employing HOMER required excessively detailed data and consumed a large amount of computational time. Therefore, the authors considered all these to be defects and covered these gaps by suggesting a simple and flexible approach with fewer controlling parameters: the crow search algorithm (CSA). The approach is used to construct an optimal configuration of an HRES comprising PV panels, WTs, batteries, and a DG installed in the northeastern region of the Kingdom of Saudi Arabia.
Our motivation for constructing a reliable and economic HRES is to help the people in the remote areas of the Saudi desert of the northeastern region of Saudi Arabia cover their needs. The reliable configuration is constructed via a simple, flexible, and robust proposed approach incorporating a CSA. The proposed approach overcomes many defects in the reported methods, such as their complexity in execution and construction, as well as the requirement for many parameters defined by the user which may increase the divergence of the algorithm.
The work contributes the following:
  • A new approach, the crow search algorithm (CSA), is suggested to evaluate the optimal configuration of HRESs installed in the northeastern region of the Kingdom of Saudi Arabia.
  • Our target is to achieve the most economic and efficient use of HRESs.
  • A comparison to the EHO, GOA, HHO, SOA, and SHO methods is conducted to assess the proposed CSA.
  • The robustness, competence, and preference of the proposed CSA are confirmed via the conducted analyses.
The rest of paper is ordered as follows: Section 2 explains the mathematical model formulation. The main aspects of the CSA are given in Section 3. Section 4 gives the proposed objective function and the solution methodology. Section 5 outlines the results and discussions, while Section 6 introduces the conclusions.

2. Mathematical Model Formulation

The electric power produced from the hybrid systems is AC and DC; the solar panels and batteries produce DC power, while the WTs and DGs produce AC energy supplied directly for the demand. Therefore, an inverter must be used with solar panels and batteries to convert the generated power AC. In the constructed system, the DG is a standby generation unit that is used in times of the deficiency of the produced energy from the HRES. All power generators are linked to the energy management control center in order to adjust the energy flow and improve the lifetimes of these components. The proposed microgrid with hybrid renewable energy generation sources is shown in Figure 1.

2.1. Model of Photovoltaic Panel

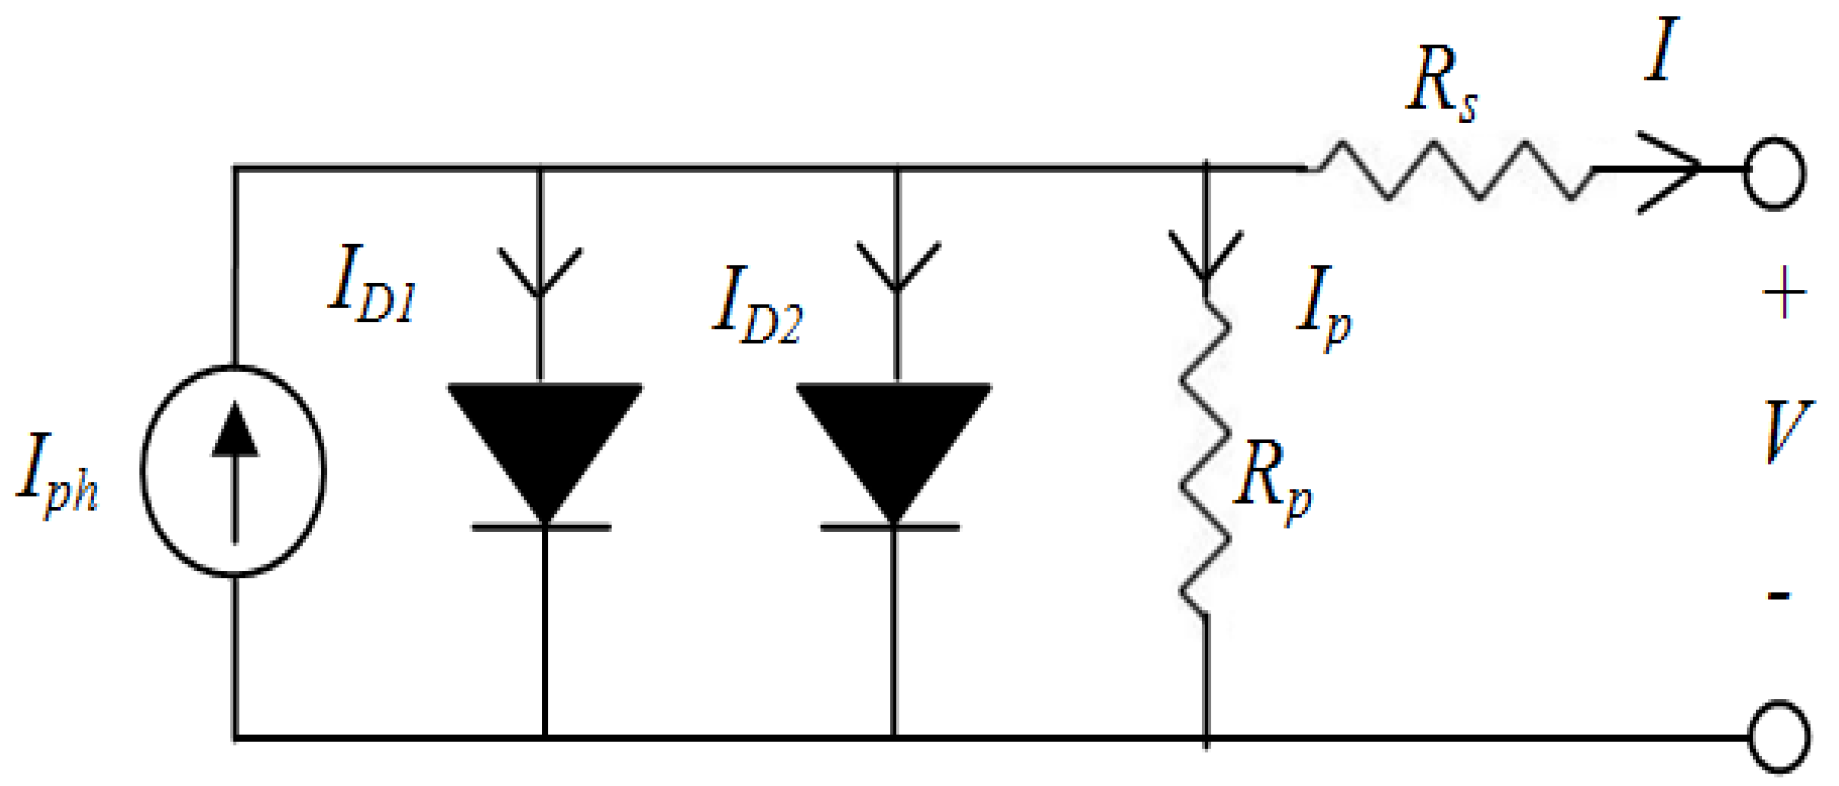
The photovoltaic (PV) panel consists of series cells to generate the essential voltage. The considered PV panel equivalent circuit has two diodes, as shown in Figure 2 [29].
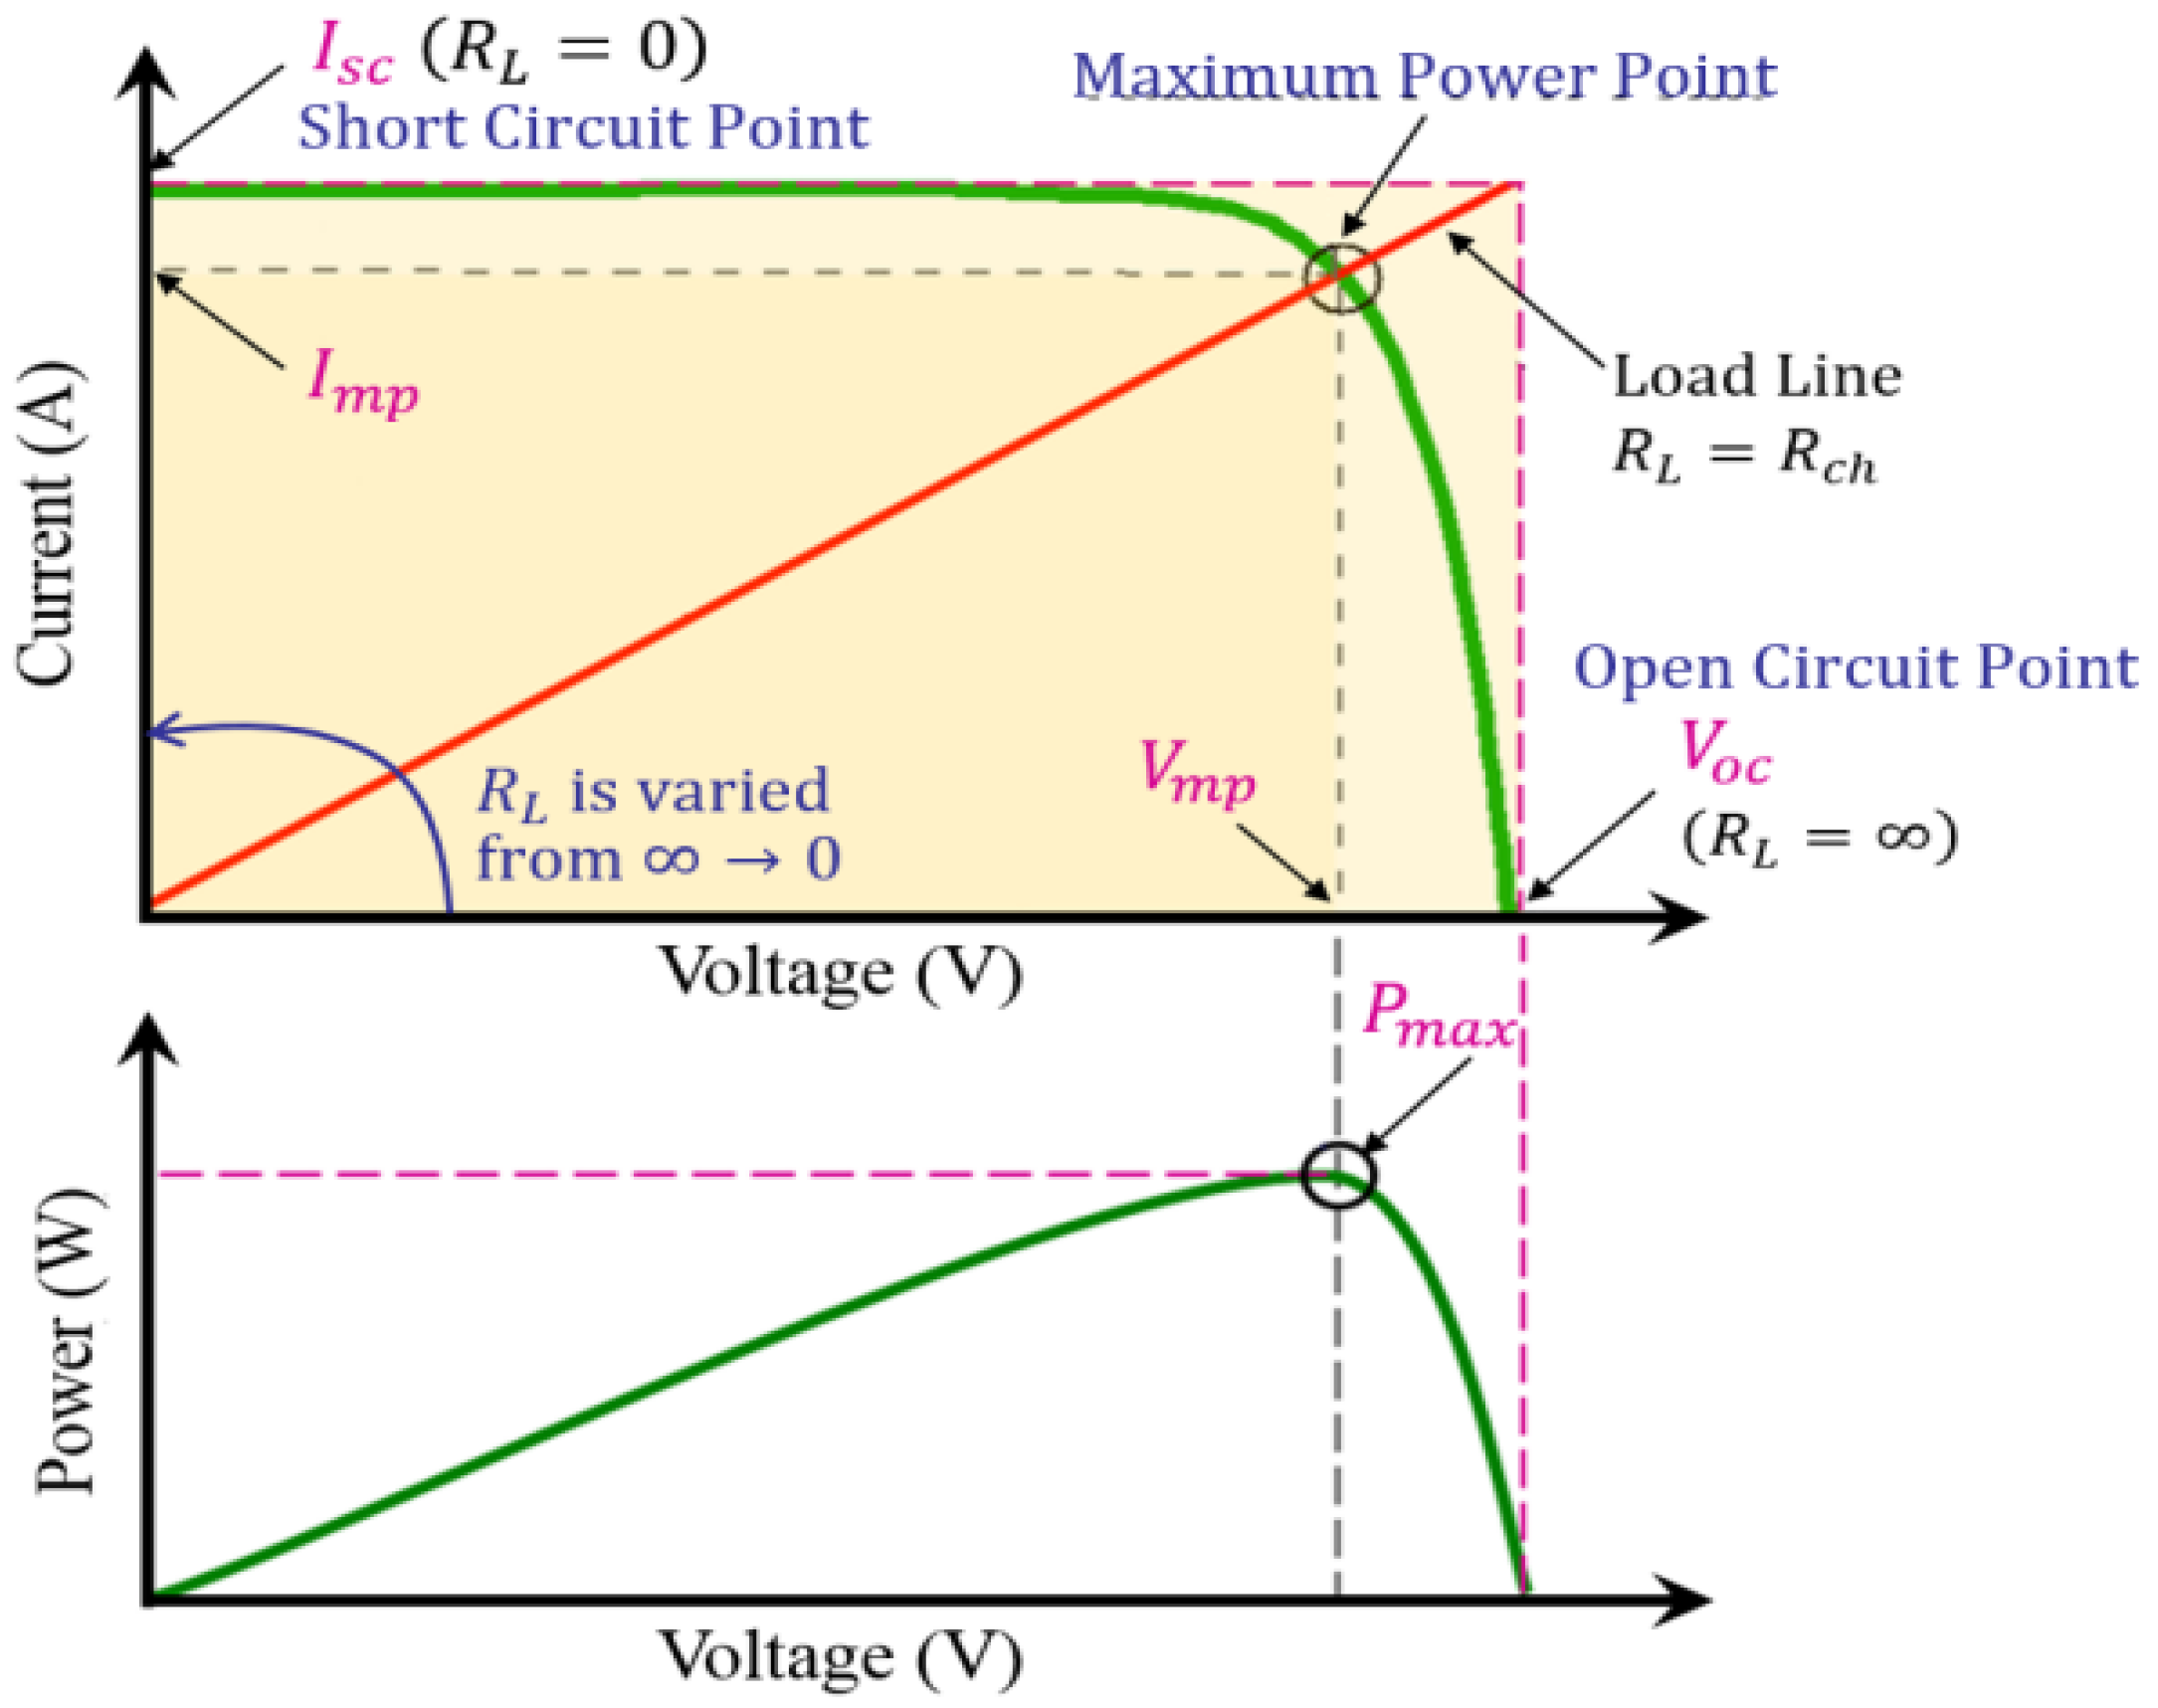
The PV panel generates the maximum current when the resistance of the model is neglected. This means there is a short circuit between the two ends of the panel (positive–negative) and this is called a short circuit current (Isc). In this case, the voltage is zero, as shown in Figure 3 [30]. On the contrary, the voltage reaches its maximum value when the circuit is opened, and this voltage is known as open circuit voltage (Voc). In such a situation, the resistance is very high and the passed current is zero. Moreover, the voltage–power (V–P) curve of the PV panel is shown in Figure 3. The curve has one maximum power point which is located at top of the curve; this point is the ideal one for operating the panel.
The current generated from the panel can be expressed as:
I = N p I p h N p I o 1 exp V N s + I N p α 1 V T 1 1 N p I o 2 exp V N s + I N p α 2 V T 2 1 N p N s   V + I . R s R p
While the PV panel output power can be written as:
P P V t = N P V × I t × V t
where I p h is the photon current, N s is the number of series cells, N p denotes the number of parallel cells, I o 1   a n d   I o 2 are the reverse saturation currents of both diodes, α 1 and   α 2 are the ideality factors of both diodes, respectively, V T 1   and   V T 2 are the thermal voltages, R p   and   R s   are the cell parallel and series resistances, V is the PV panel terminal voltages, I represents the PV panel output current, and P P V denotes the PV panel generated power.

2.2. Wind Turbine Model

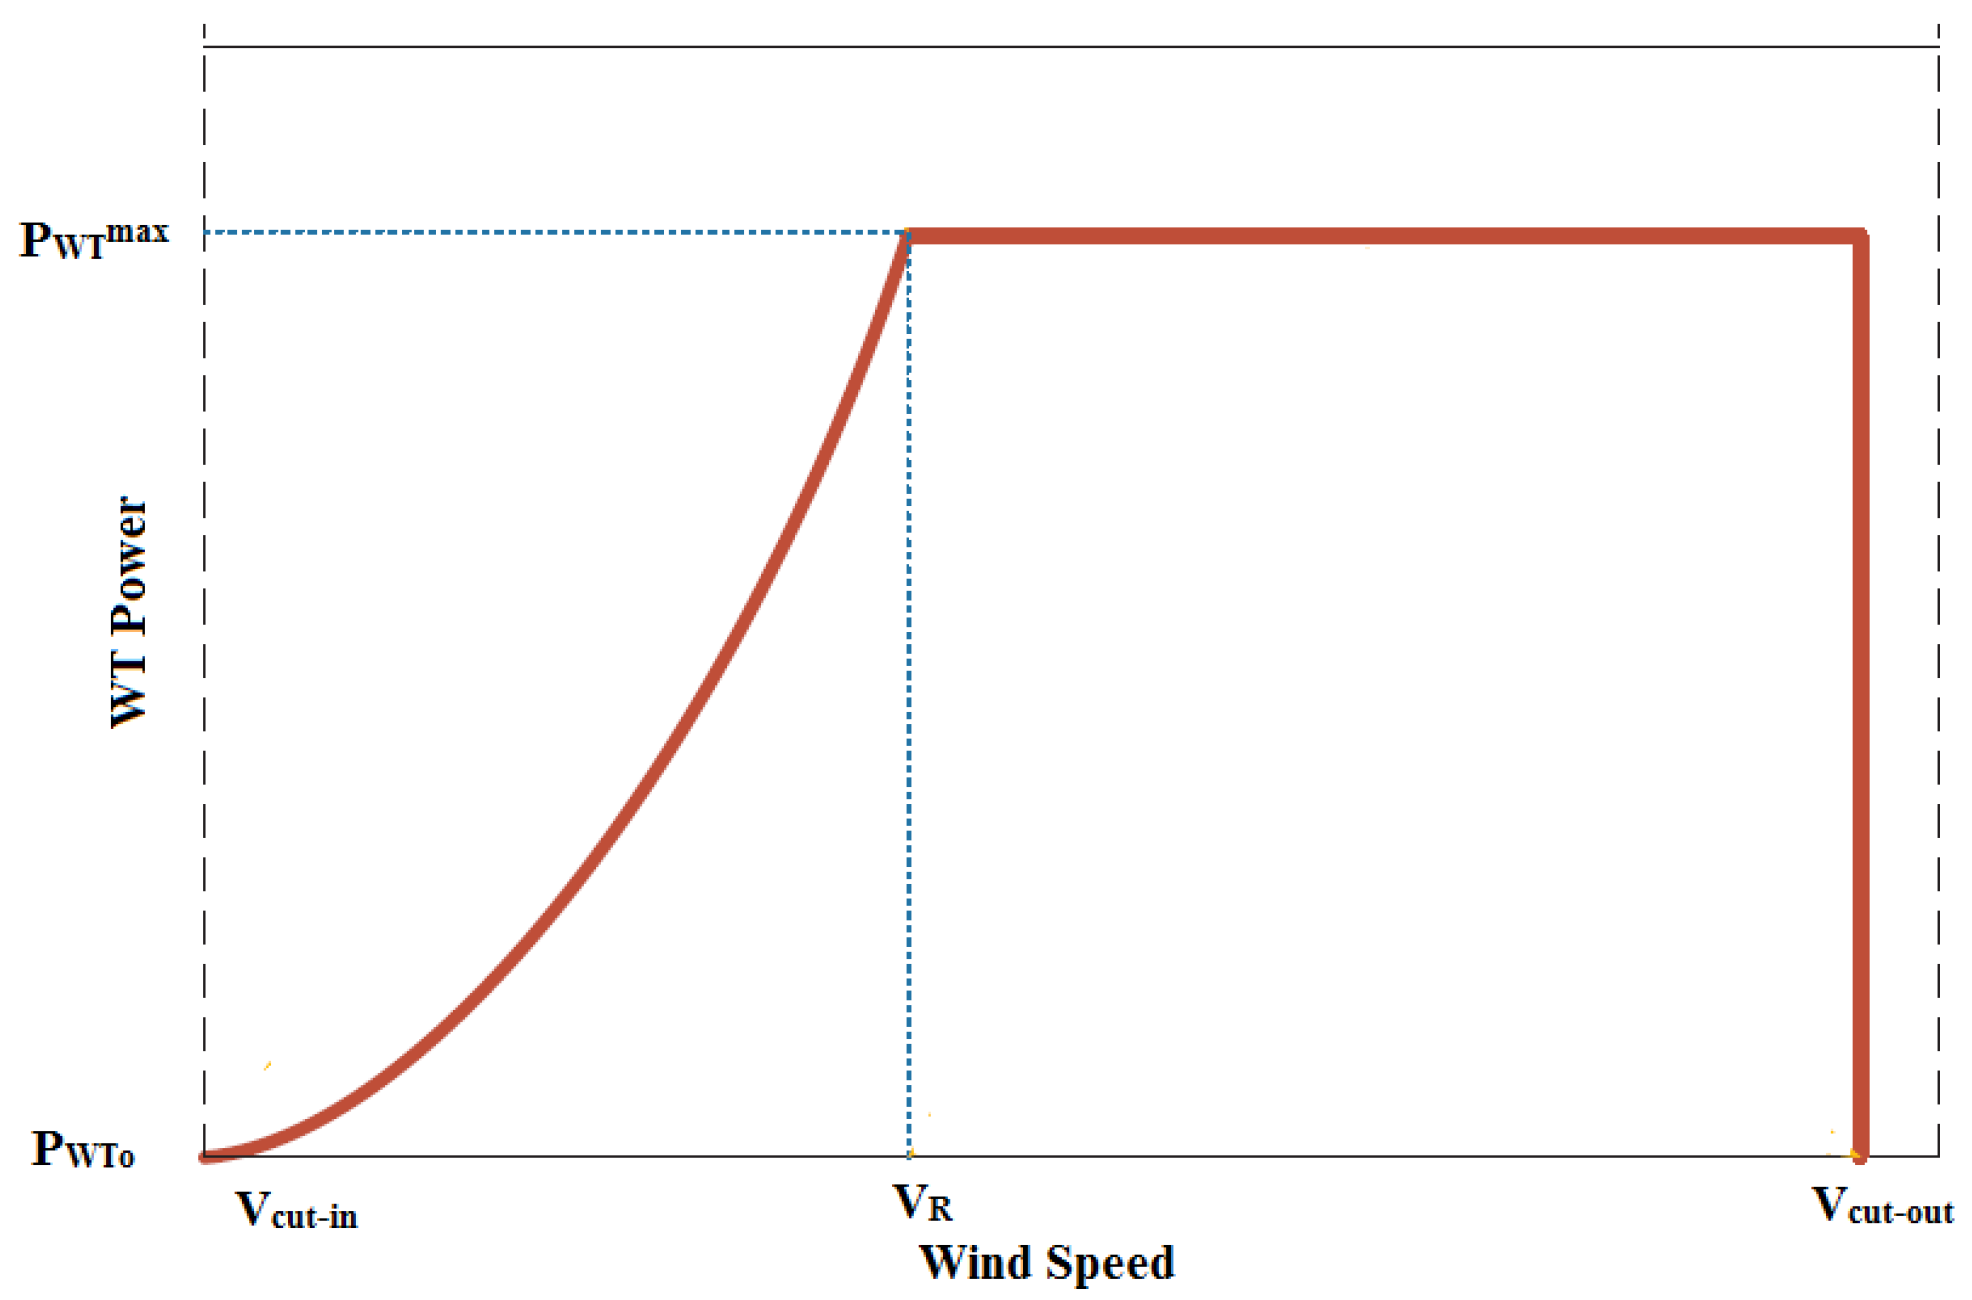
The typical WT power curve is shown in Figure 4. The turbine produces energy from the cut-in speed. The produced power is increased by increasing the wind speed until the rate is one; this occurs at the rated wind speed. At the cut-out speed, the turbine stops to protect itself from high wind speeds that may cause damage.
The power generated via the WT is related to the wind speed, this can be formulated as [31,32]:
P w T t = 0 i f   V V c u t i n   o r   V V c u t o u t P W T max P W T o P W T m a x V c u t o u t V R V t V R   i f V r < V V c u t o u t P W T m a x V t V c u t i n V R V c u t i n 3 i f   V C u t i n   V V R  
The WT output power can be written as:
P W T t = N W T × P W T t
where P W T max denotes the maximum power of WT, P W T o is the WT generated power at the cut-out speed, V c u t i n represents the cut-in speed, V c u t o u t represents the speed of cut-out, V t denotes the wind speed at t, V R is the nominal wind speed, and P W T t is the WT generated power.

2.3. Model of Battery

When the RESs’ generated energy is deficient to cover the load, the battery assists in covering the consumer’s needs. The battery capacity is calculated via the demand and its autonomy day (AD) as:
C B a t = A D × P L η I n v   .   η B a t   . D O D
P B a t t = P P V t + P W T ( t )   P L t η I n v
where P L is the load demand, η I n v denotes the efficiency of the inverter, η B a t represents the battery efficiency, D O D is the depth of discharge of the battery, and A D represents the autonomy day, which is an indication of number of days in which the battery satisfies the load.
The battery state-of-charge ( S O C ) can be formulated as follows:
S O C   t = S O C   t 1   1 δ + P P V t + P W T t P L t η I n v × η B a t , i f   P P V t + P W T t   P L t   S O C   t 1 1 δ + P L t η I n v P P V t + P W T t × η B a t , i f   P P V t + P W T t   P L t
where S O C   t is the state-of-charge and δ denotes the battery’s self-discharge rate.

2.4. Model of DG

Diesel generators (DGs) are among the necessities required in electrical systems. They can work as a backup as they are considered to be alternative sources of electric current especially when the main source is cut off.
DG fuel can be calculated as [33,34]:
f ( t ) = 0.246 P d i e s e l ( t ) + 0.8415 P d i e s e l r a t e d
where P d i e s e l t denotes the power of DG at time t, and P d i e s e l r a t e d represents the DG nominal power.

2.5. Model of Inverter

An inverter is a device that converts DC to AC. The inverter efficiency can be calculated as follows:
η I n v = P P + P 0 + K P 2 ,   P = P o u t P n ,   and   K = 10 η 100 P 0
P 0 = 1 99 ( 10 η 10 1 η 100 9 ) 2
where P 0   denotes the rated power of the inverter, and η 10 and η 100   are the efficiencies of the inverter at 10% and 100% of its nominal power.

3. Main Aspects of Crow Search Algorithm

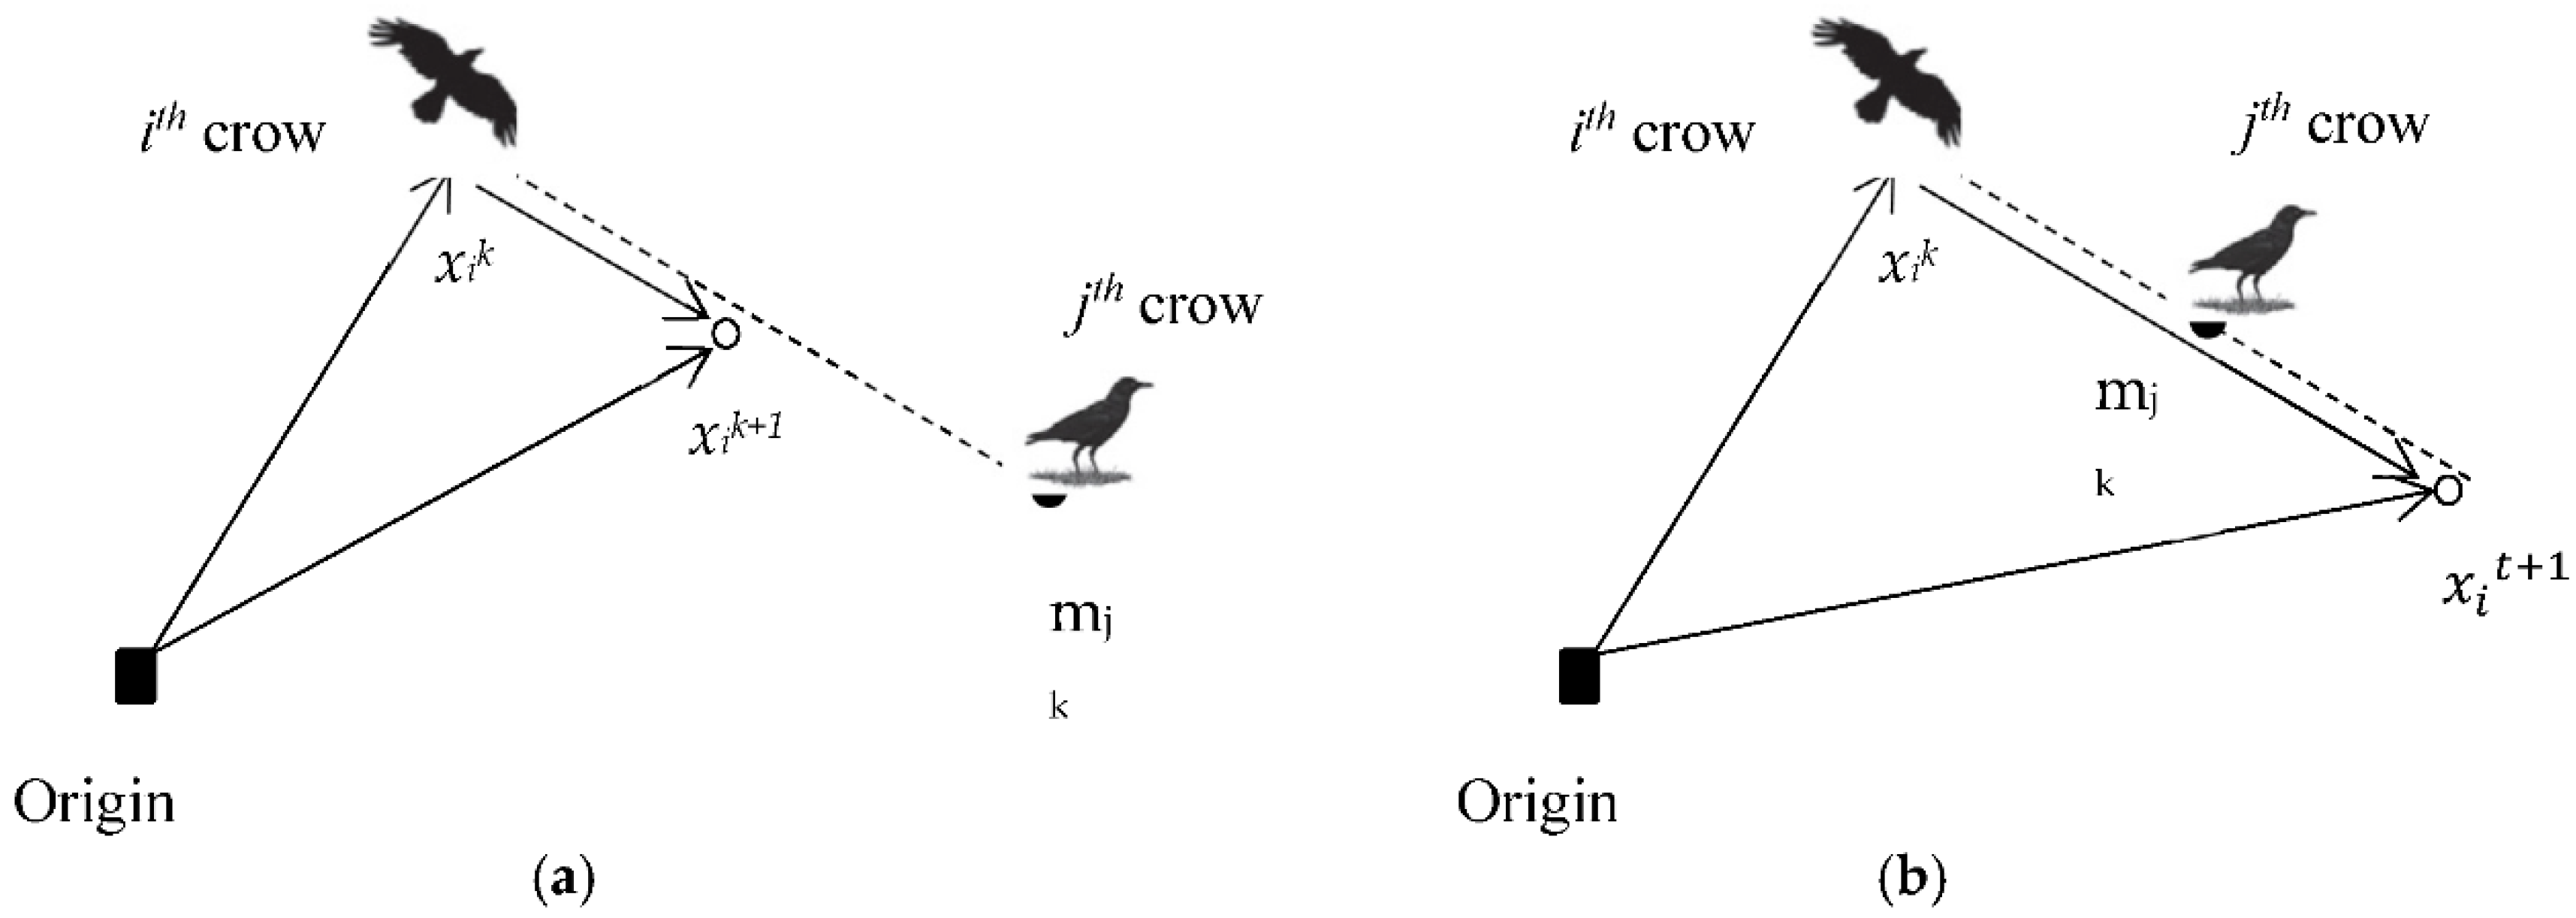
The crow search algorithm (CSA) is a recent metaheuristic optimizer that has been presented by Askarzadeh [35]. It was inspired by a crow’s social behavior when searching for food. Any excess food obtained by the crow is stored in hidden places and then recovered when necessary. The crow is a smart bird that observes the other crows hiding food and steals it while they are leaving. After carrying out the robbery, it hides in order to prevent becoming prey in the future. The CSA is represented mathematically by assuming a flock with N crows, with each crow in the flock at time t having position xit. The crow updates its position in the search space to find the optimum food source (mit). Two probable scenarios can be followed in a CSA. The first one occurs when the jth crow owning the best food does not know who is the thief. This enables the thief to reach the hidden location of the owner’s food. In such a scenario, the updating process can be implemented as follows:
x i t + 1 = x i t + r i × f l i t m j t x i t
where x i t is the position of ith crow in iteration t, r i denotes a random number in [0, 1], and f l i t is the ith crow length of flight at iteration t.
The second situation that may occur in a CSA is the recognition of the thief by the jth crow owning food. This enables the owner crow to trick the ith crow via moving to another position using the following formula:
i f   r j p j t U p d a t e   t h e   p o s i t i o n   e l s e U p d a t e   t o   r a n d o m   p o s i t i o n
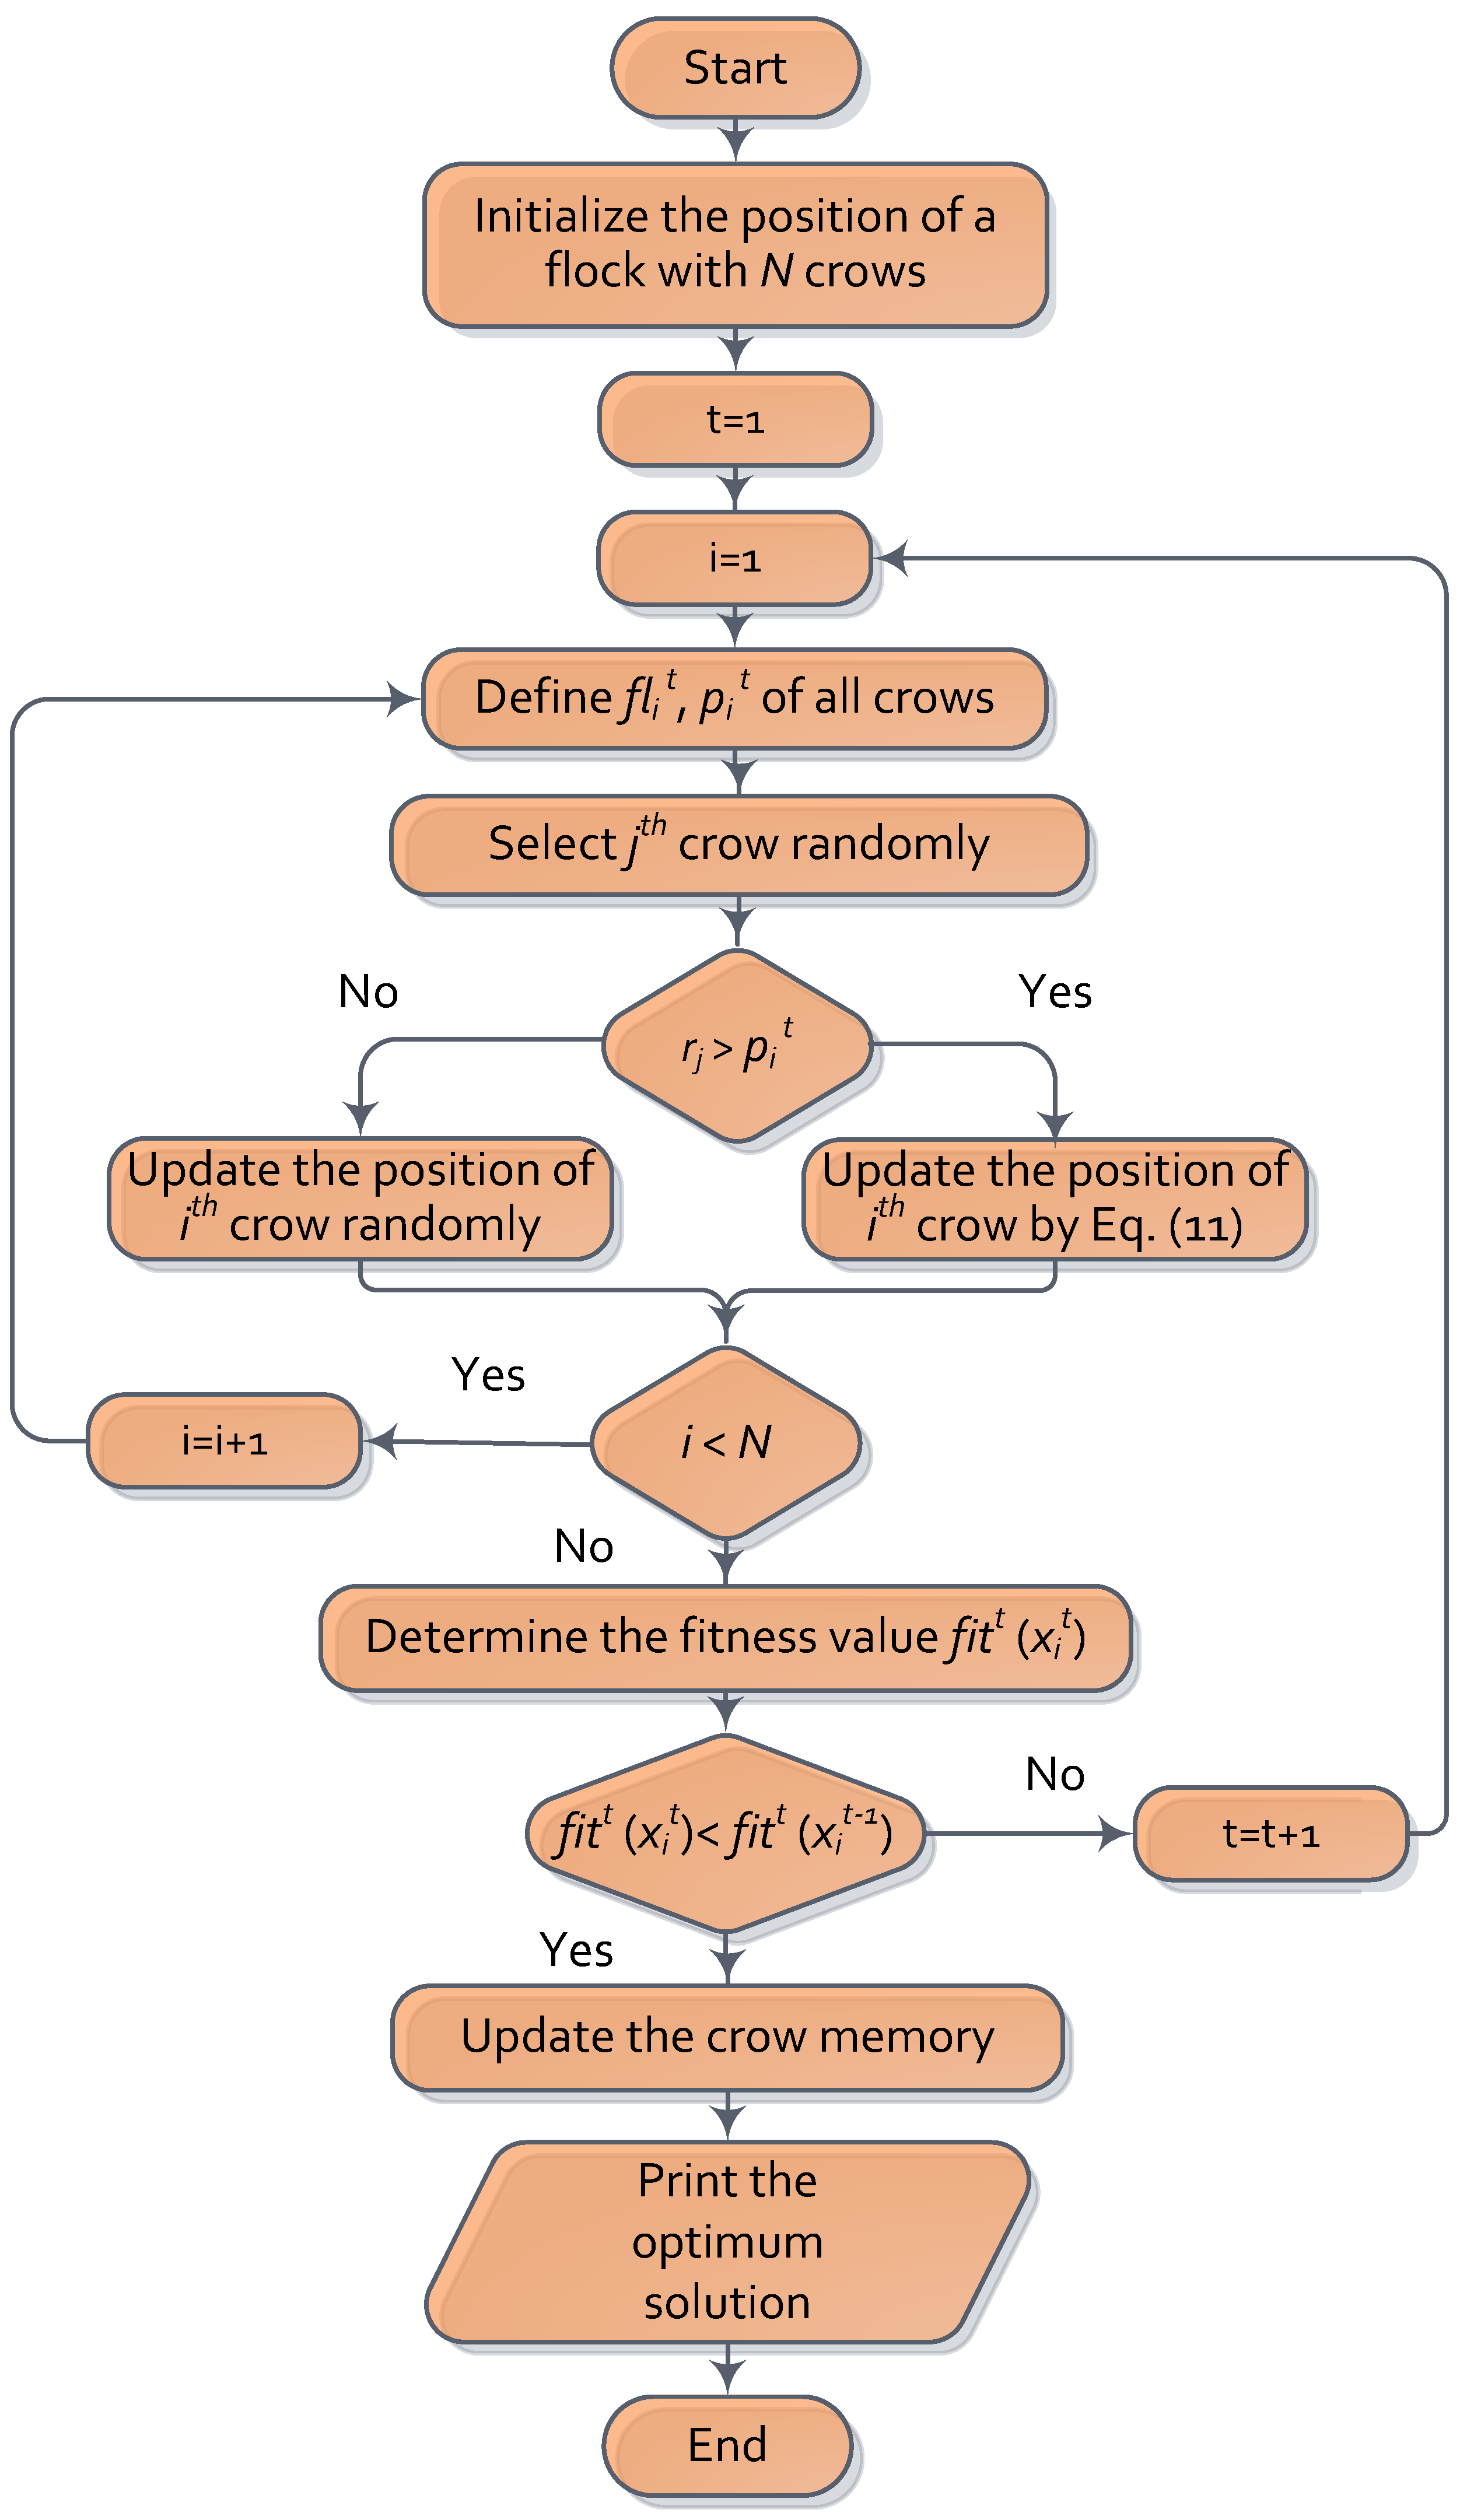
where r j denotes a random number in [0, 1] and p j t represents the jth crow awareness probability at iteration t. The term f l i t is important in obtaining the global solution as its large value helps provide the global best fitness value while small values cause local optima. Figure 5 shows the effect of crow flight length values on the global optima. The main steps of the CSA are given in Figure 6.

4. Formulated Optimization Problem

This section discusses the presented fitness function in addition to the proposed methodology incorporating the CSA.

4.1. The Fitness Function

The cost of energy (COE) is selected as the target. The primary objective of the presented optimization problem is minimizing the COE while achieving a reliable system. The COE is proportional to the total net present cost (NPC) that includes the costs of investment, replacement, and operation and maintenance (O & M). It is expected that RESs have a low O & M cost due to the absence of fuel costs. On the other hand, the capital cost is extremely high. The following costs, including the PV, WT, battery, and DG, are considered [12].
C t P V = N P V   C c P V + C O & M P V × 1 + i n 1 i 1 + i n
C t W T = N W T   C C W T + C O & M W T × 1 + i n 1 i 1 + i n
C t B a t t = C C B a t t + C O & M B a t t × 1 + i n 1 i 1 + i n + C R B a t t × j = 1 n n B a t t 1 1 + 1 1 + i j n B a t t
C t d i e s e l = C C d i e s e l + C O & M d i e s e l × 1 + i n 1 i 1 + i n + C R d i e s e l × j = 1 n n d i e s e l 1 1 + 1 1 + i j n d i e s e l
N P C = C t P V + C t W T + C t B a t t + C t d i e s e l + C C I n v
where N W T and N P V are the WT and PV numbers; C C W T , C c P V , C C d i e s e l , C C B a t t , and C C I n v are the WT, PV, DG, battery, and inverter investment costs; C O & M W T , C O & M P V , C O & M d i e s e l , and C O & M B a t t denote the cost of operation and maintenance for WT, PV, DG, and battery; C R B a t t   and   C R d i e s e l are the replacement costs of battery and DG; n is the system’s lifetime; i represents the annual interest; and n B a t t and n d i e s e l are the battery’s and DG’s lifetimes.
The cost of energy can be expressed as [36]:
C O E = N P C h = 1 8760 P l o a d   × C R F
C R F = i 1 + i n 1 + i n 1  
where P l o a d is the load of consumed power per hour and C R F denotes the capital recovery factor.
The variables to be designed are N P V , N W T , and NAD with the goal of minimizing the COE. The proposed constraints can be written as follows:
N P V   m i n     NPV     N P V   m a x
N W T   m i n     NWT     N W T   m a x
N A D   m i n     NAD     N A D   m a x
It is essential to assess the constructed microgrid reliability. This is accomplished via considering the loss of power supply probability (LPSP), which can be written as follows:
LPSP = ( P l o a d   P P V   P W T + P S O C , m i n   + P d i e s e l   )   P l o a d  
In the case in which the generated power is greater than the load demand, the LPSP will be in range [0, 1] to confirm the system’s reliability. However, the optimal economic situation occurs when the produced power is equal to the load demand; in this situation, the LPSP value converges to zero.

4.2. The Proposed CSA-Based Methodology

In this section, the proposed CSA-based methodology is explained. The approach is employed to find the optimal numbers of PV, WT, and autonomy day to minimize the COE of the constructed microgrid established in the northeastern region of Saudi Arabia. The pseudo code of the proposed methodology is clarified in Algorithm 1. At the beginning, the controlling parameters of CSA, such as the population size (N), the flight lengths of each crow ( f l ), the awareness probability ( p i ), maximum iteration (Max_iter), and number of independent runs (n), are defined. Additionally, the characteristics of the considered components are defined. Furthermore, the data of the northeastern region of Saudi Arabia’s weather conditions and the electrical load data are provided. During the iterative process followed in the CSA, the steps given in Figure 6 are conducted for a number of independent runs. Finally, the minimum fitness value is selected as the required target and the corresponding design variables are the optimum topology of the constructed microgrid.
Algorithm 1 Pseudo code of the proposed CSA
  1:
Input the parameters of CSA (N, f l , p i , and Max_iter), and number of independent runs (n).
  2:
Define the specifications of the microgrid components and the load data.
  3:
Input the weather conditions of the location in which the microgrid is installed.
  4:
Define the lower (lb) and upper (ub) limits of the design variables.
  5:
             Initialize the population of N crows using ub and lb.
  6:
             Determine the initial fitness value fitt (xit) using Equation (18).
  7:
Set run = 1.
  8:
Set t = 1.
  9:
while run > n do
 10:
          while t > Max_iter do
 11:
               for j = 1:N
 12:
                   Generate random candidate crows using Equation (12)
 13:
                   Update the crow positions (xi,newt = xit).
 14:
                   Check the constraints of the updated positions using Equation (21).
 15:
                   Calculate the fitness value of the new solution (fitnew (xinew)) by Equation (18).
 16:
                         if fitnew (xinew) > fit (xi)
 17:
                             Update the search memory and the fitness value
 18:
                      end if
 19:
             end for
 20:
             Save the minimum fitness value as the best.
 21:
              t = t + 1
 22:
       end while
 23:
     run = run + 1
 24:
 end while
 25:
 Print the optimal topology of the microgrid.

5. Results and Discussions

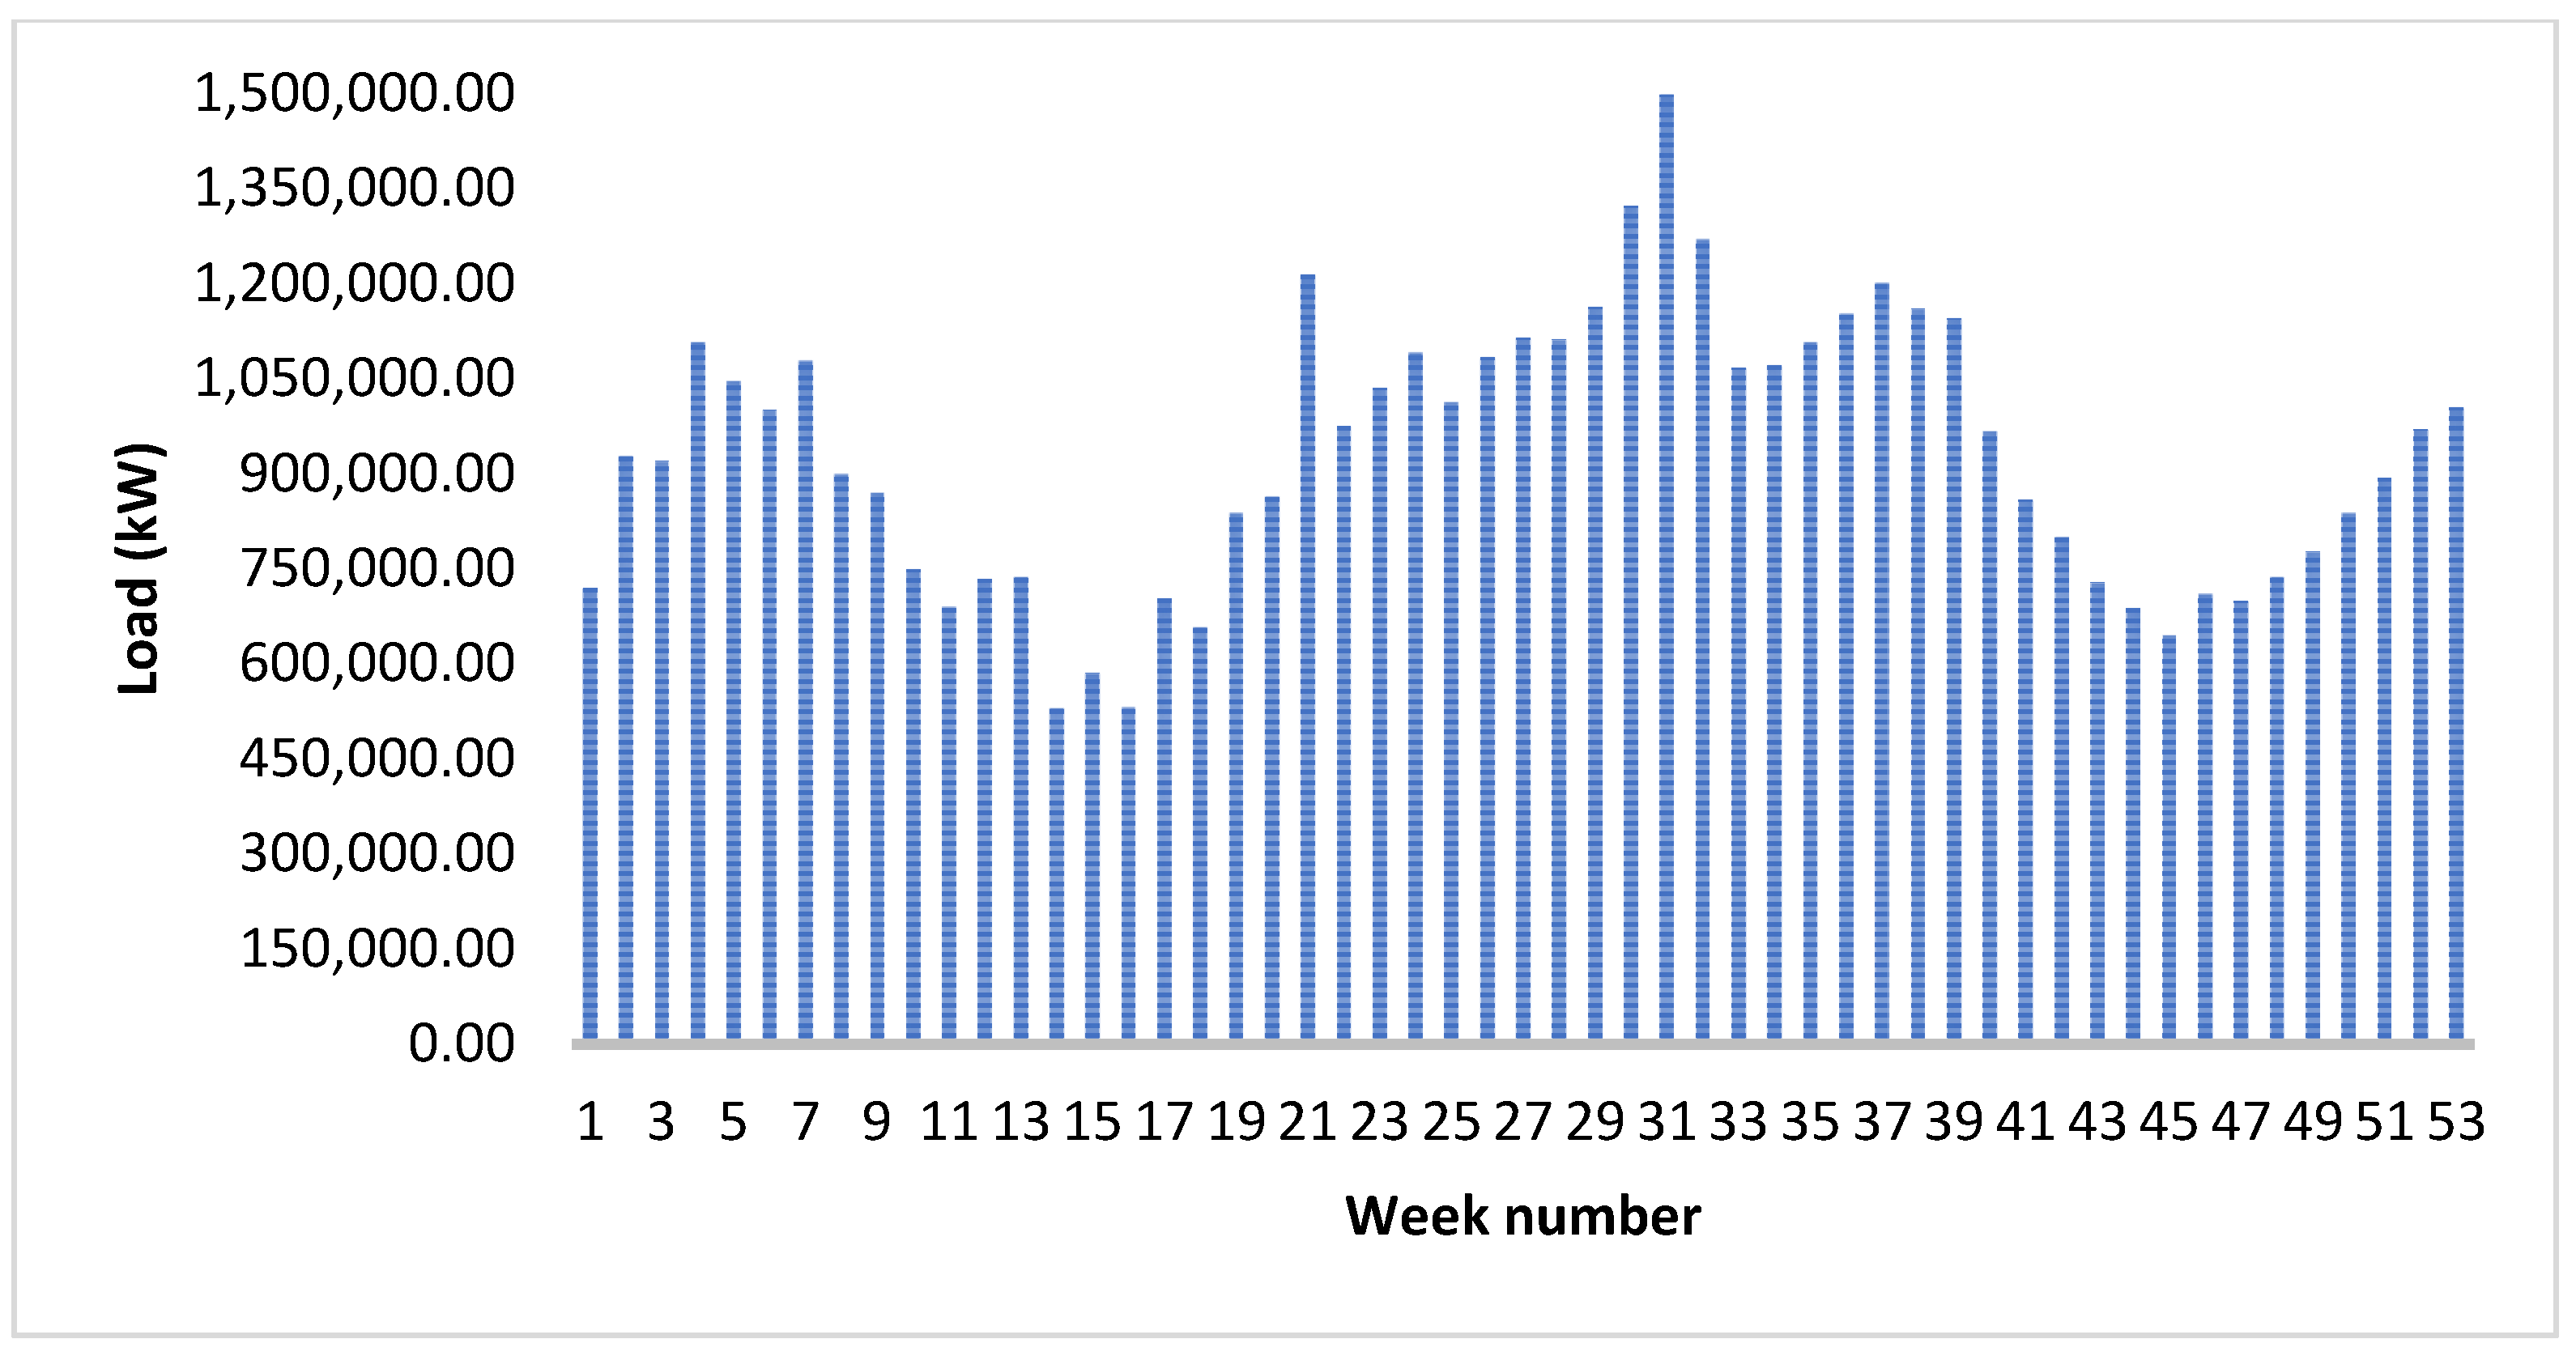
The proposed CSA is applied to evaluate the optimal topology of the considered microgrid comprising PV panels, a WT, a battery, a DG, and an inverter. The electrical specifications of the presented components in this work are tabulated in Table 1. The characteristics of the PV panel are the same of that used in the Sakaka solar power station as well as the specifications of the inverter. Moreover, the authors used the real data of the WT collected from the Dumat Aljandal wind power plant. The turbine model is Vestas-V150-4.2 MW with a capacity of 4 MW. The DG is used as a backup unit, and its data are collected from the Saudi Electricity Company’s Aljouf branch with a capacity of 70 MW. As the proposed established microgrid is isolated from the electrical grid, the battery storage system is mandatory. It has been charged by PV/WT in the event of an excess of generating power though acting as a generation source in cases of power deficiency. The capital cost for each component and the economic parameters of the constructed microgrid are tabulated in Table 2. The considered microgrid is installed in the Aljouf region in the north of the Kingdom of Saudi Arabia (the site’s latitude is 29.764° and its longitude is 40.01°). This site is selected in the Aljouf region is known as the capital of energy as a result of providing an annual solar irradiance of up to 2150 kWh/m2 and a maximum wind speed of 8.0 m/s. This encouraged the Saudi government to establish two renewable energy plants, which are the Sakaka solar power plant with a 300 MW capacity generated via 1,200,000 solar panels, and the Dumat Aljandal wind power plant with a 400 MW capacity obtained from 99 wind turbines. This inspired the authors to construct the microgrid in a remote area in that region. The study is performed to cover the weekly electrical load during the year starting from 1 January 2020 to 31 December 2020. The load data are collected via the water and electricity regulatory authority as shown in Figure 7. The highest load reaches 1498 MW in week 31 while the lowest load is 532 MW in week 16.
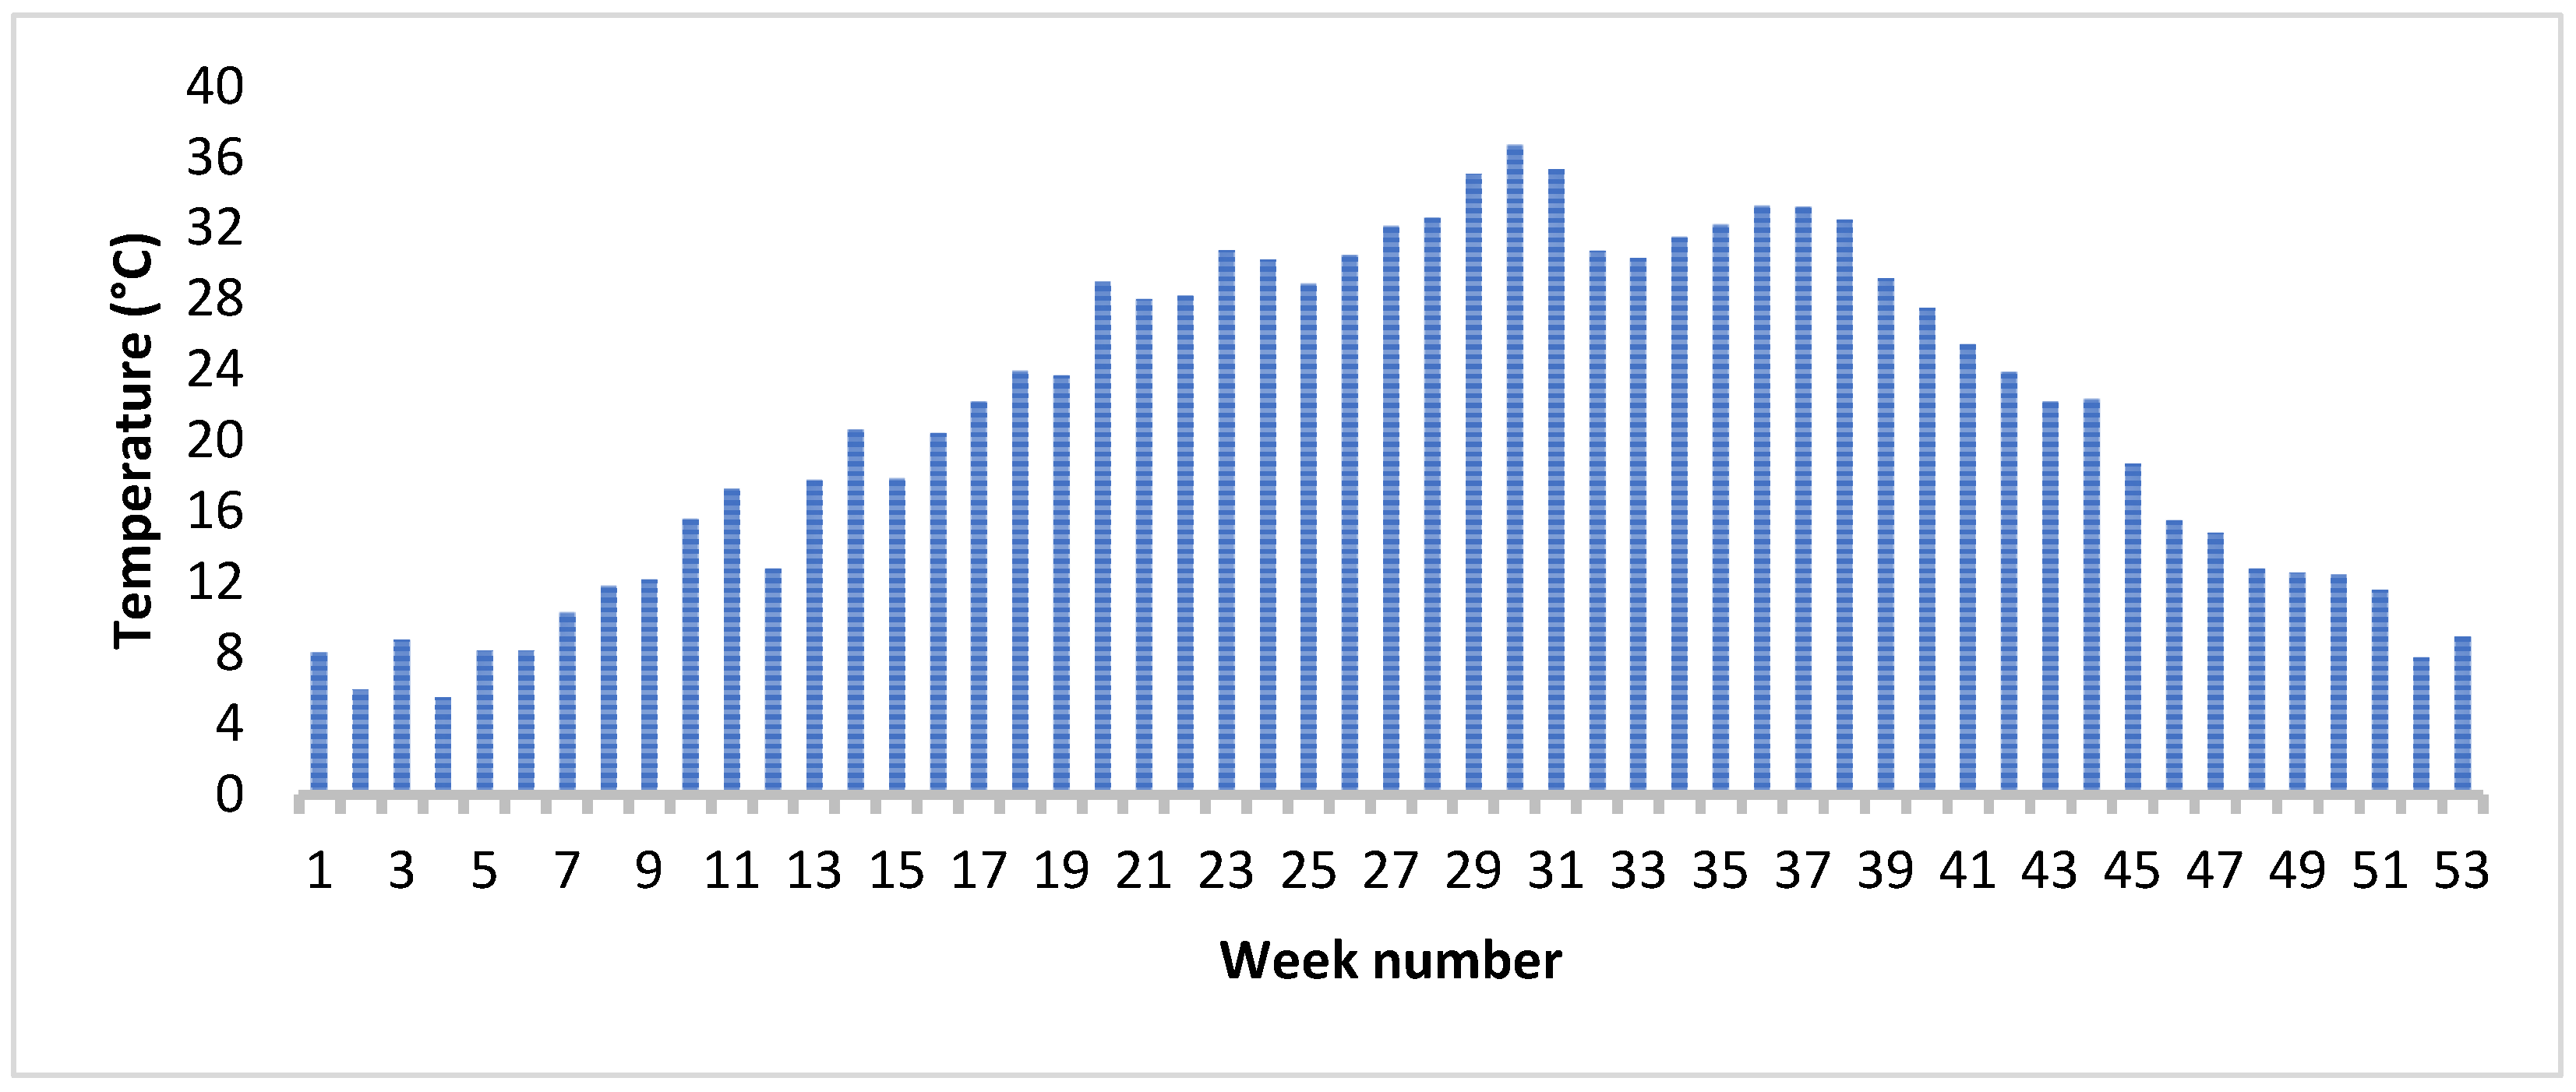
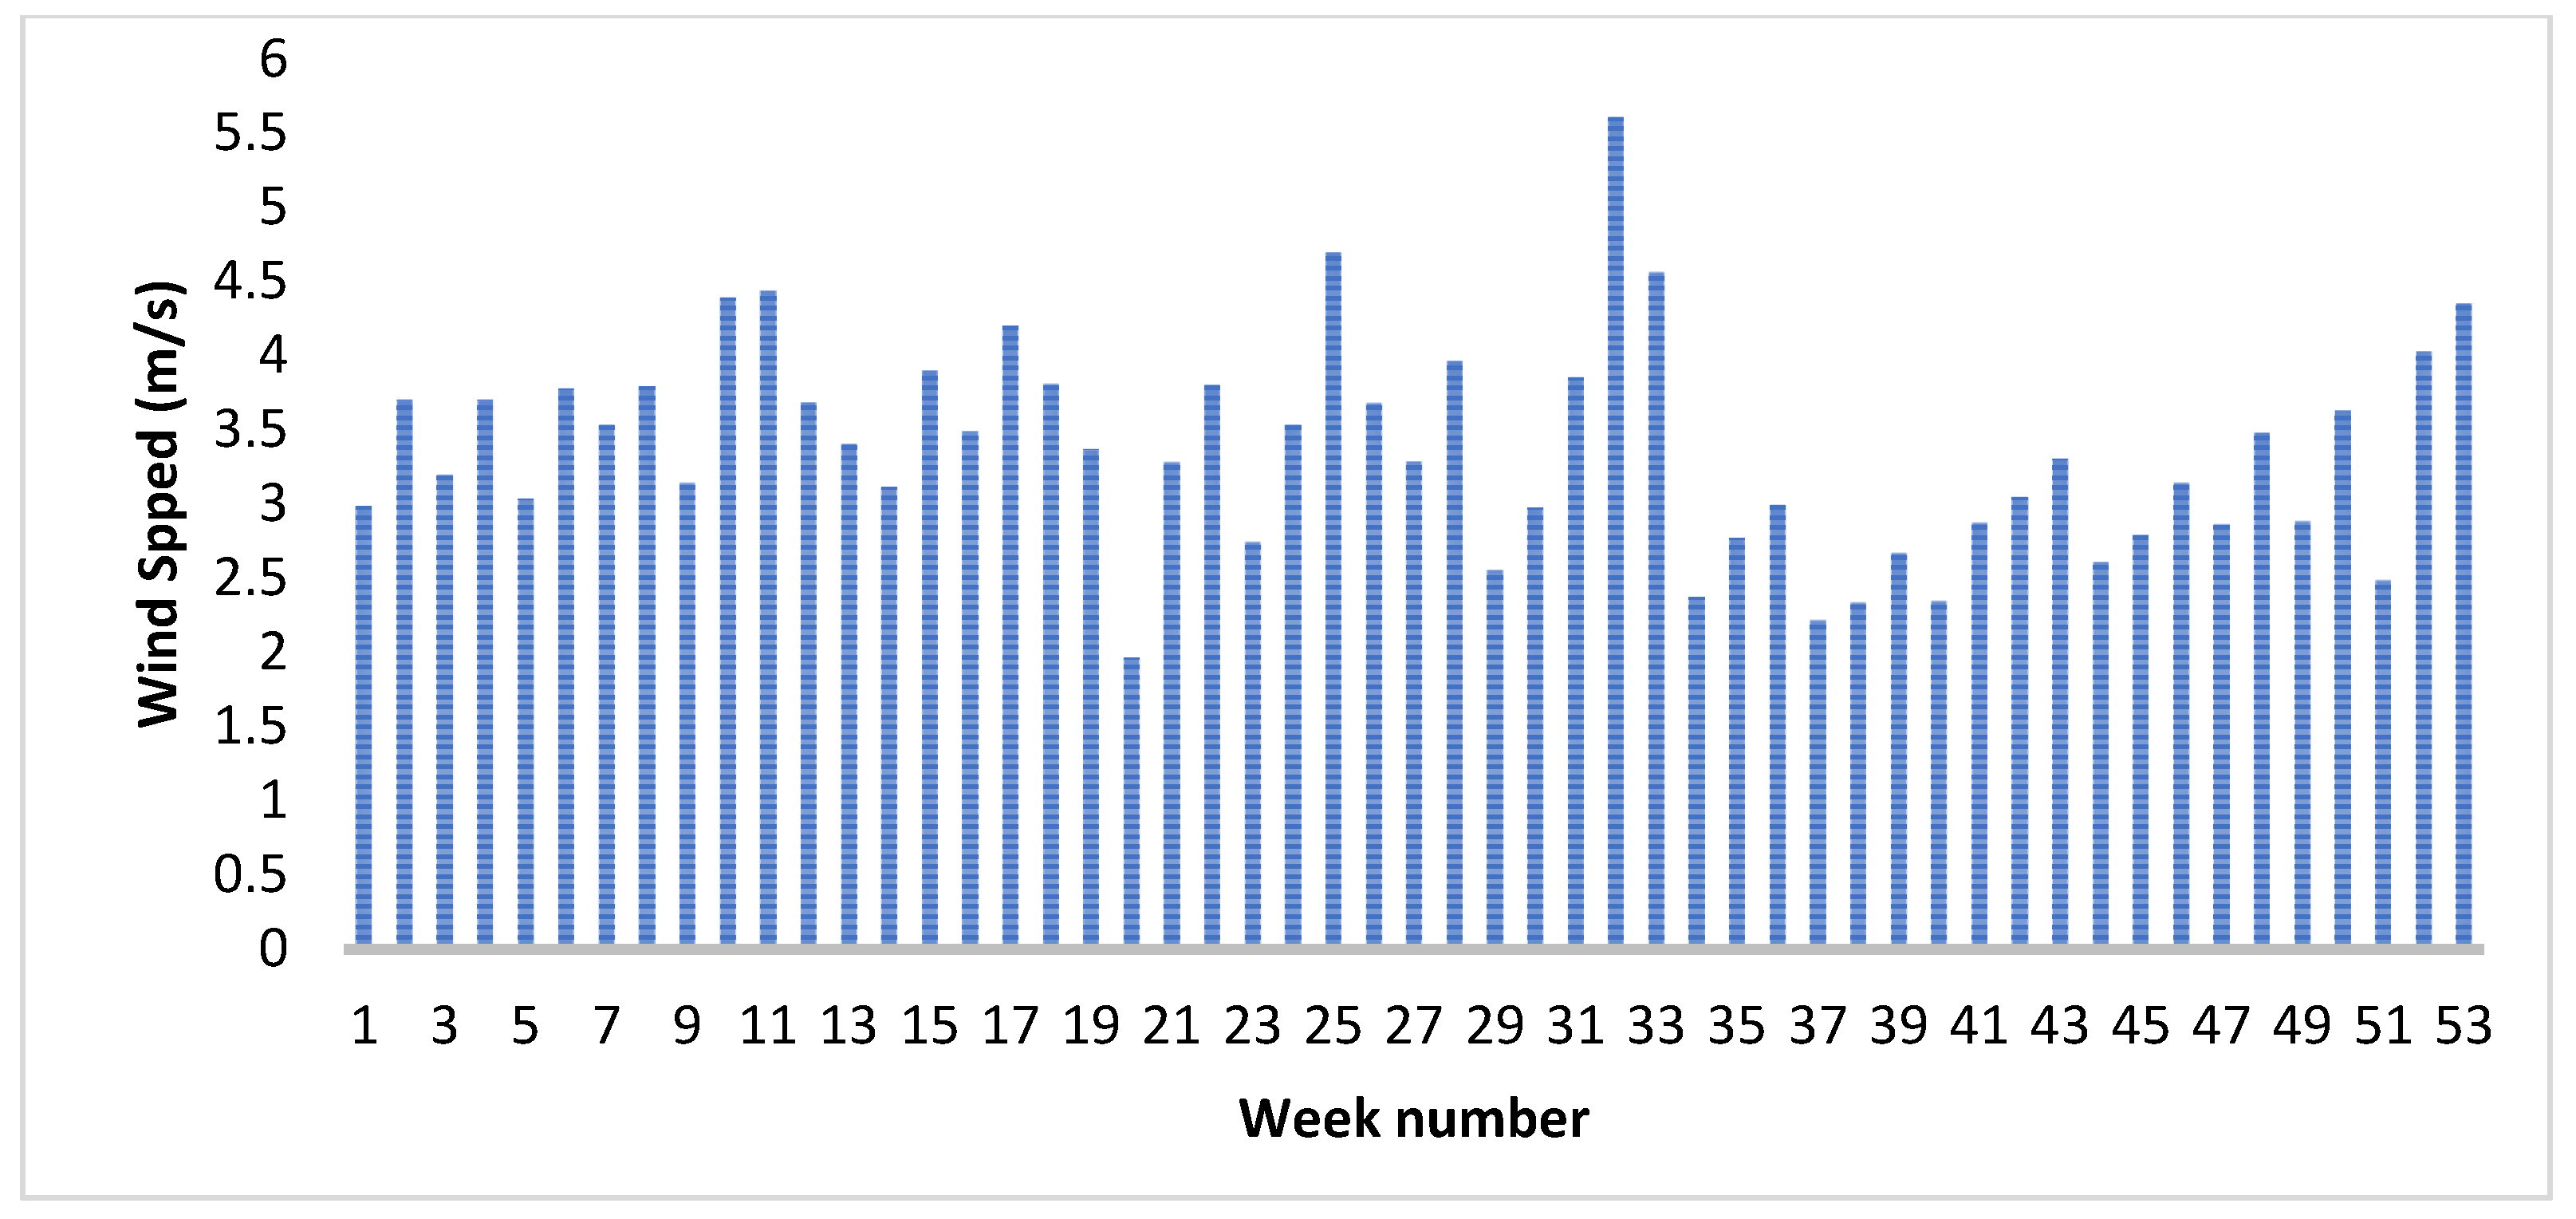
The weather conditions considered in the analysis are the average weekly temperature, solar radiation, and wind speed. All these data are collected from NASA. They are shown in Figure 8, Figure 9 and Figure 10.
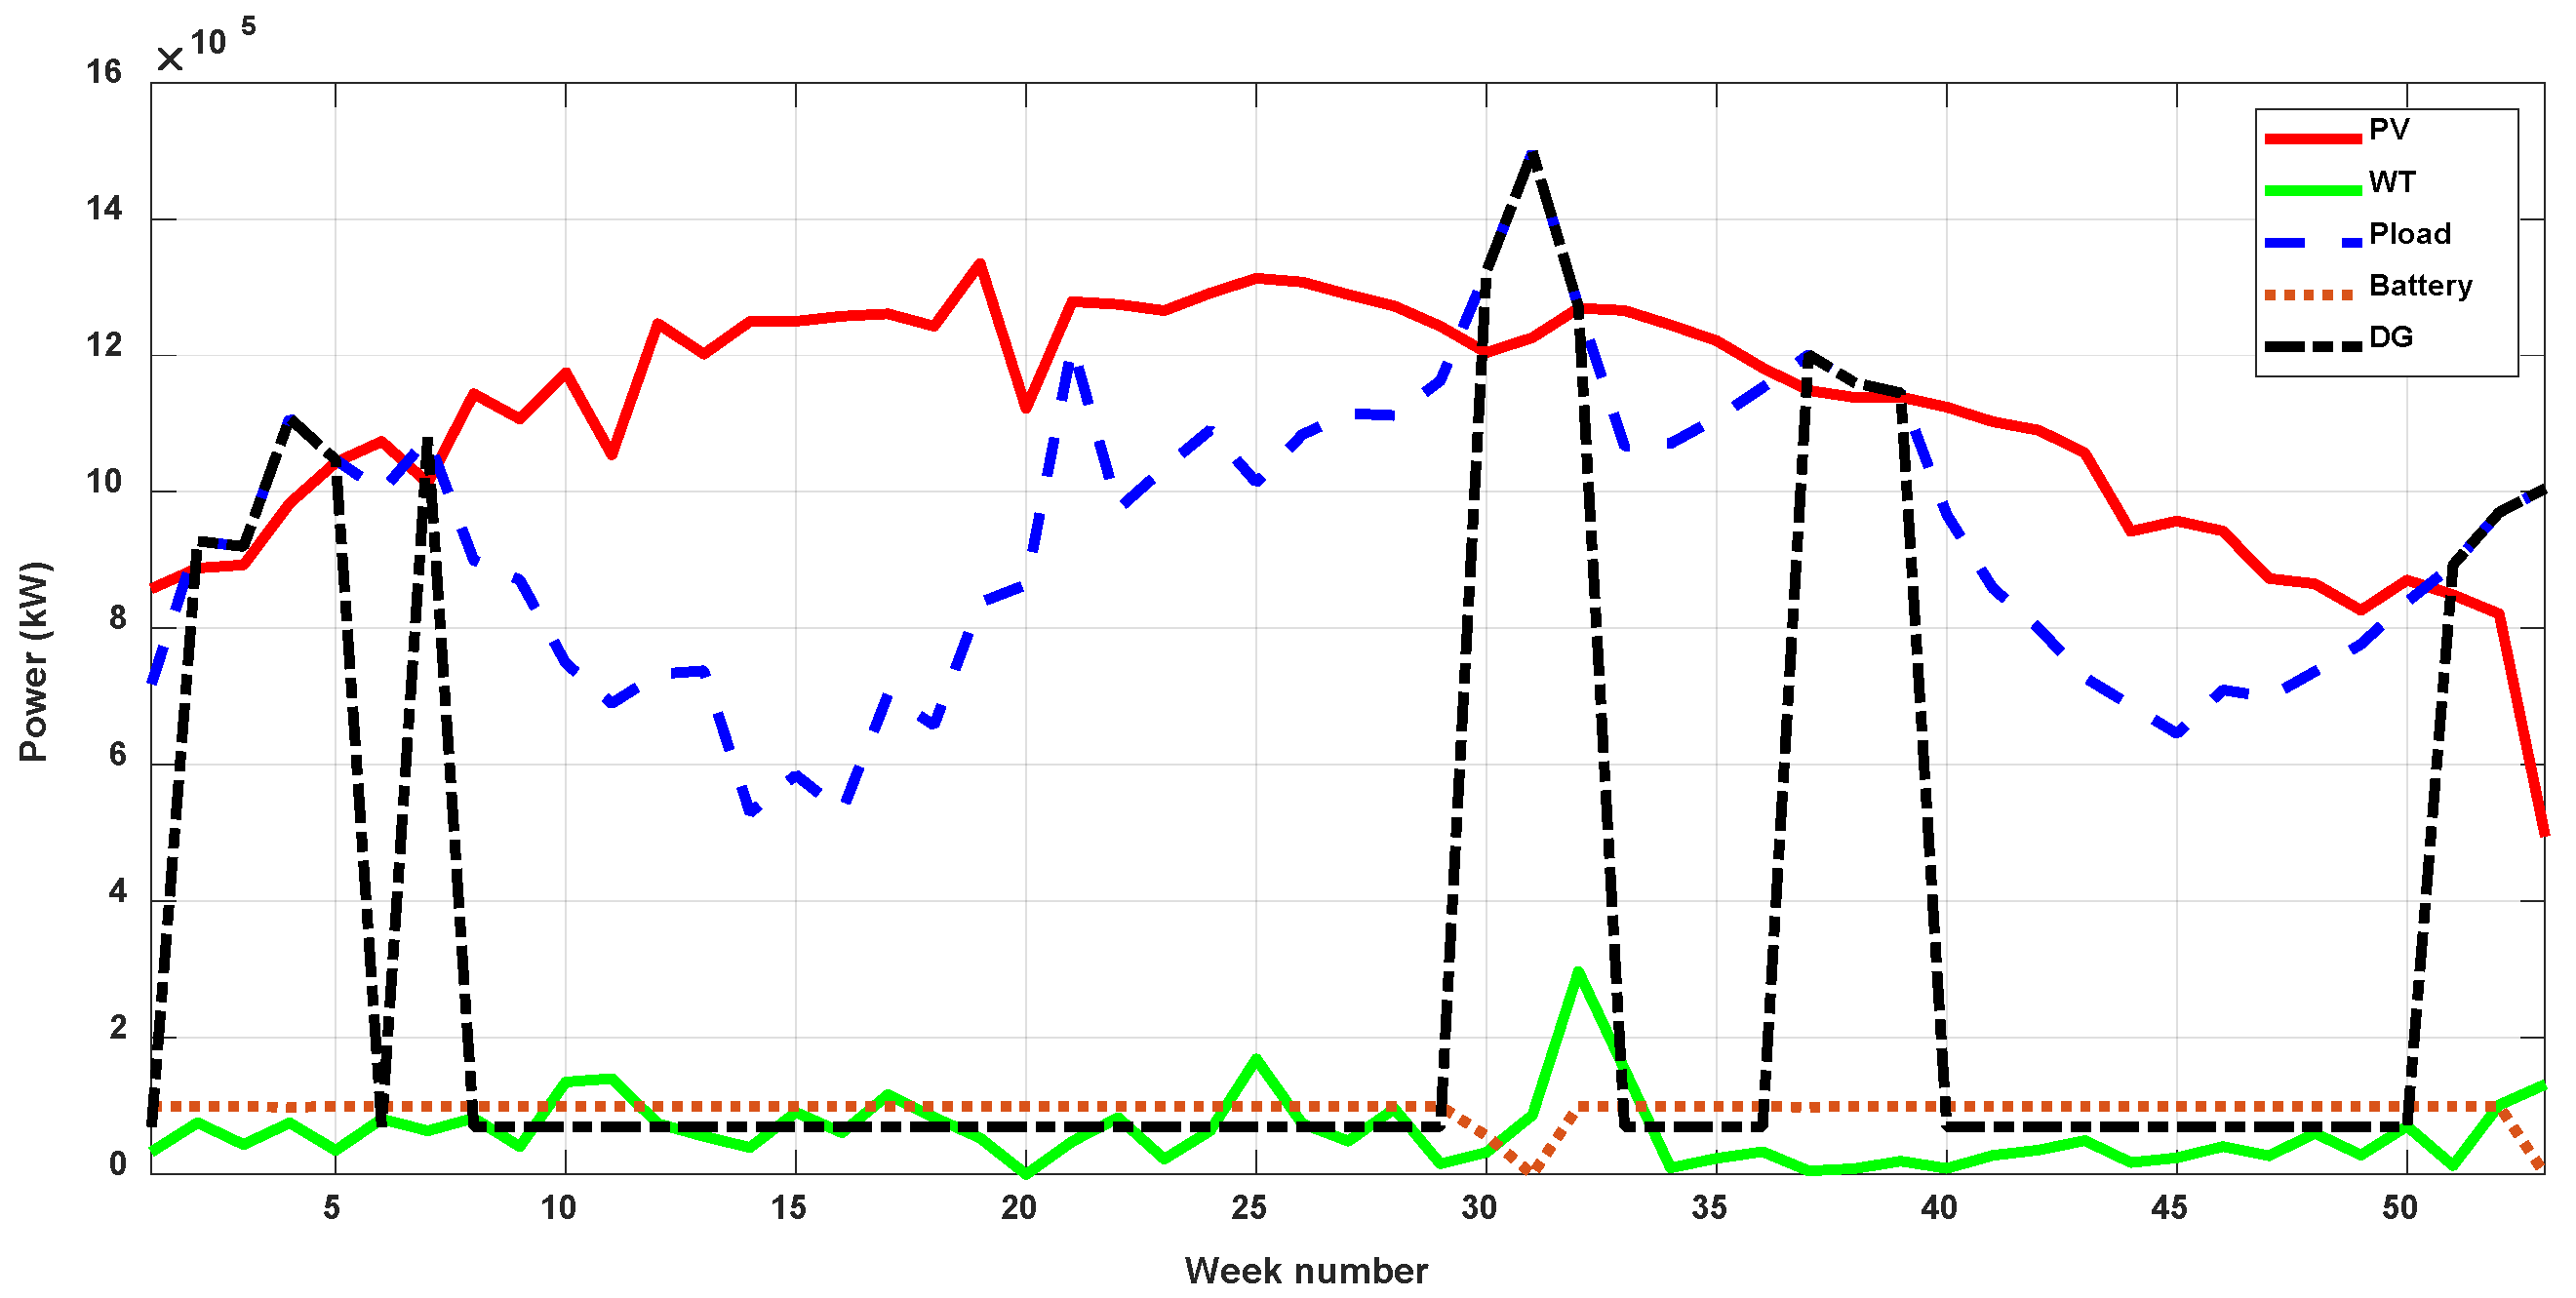
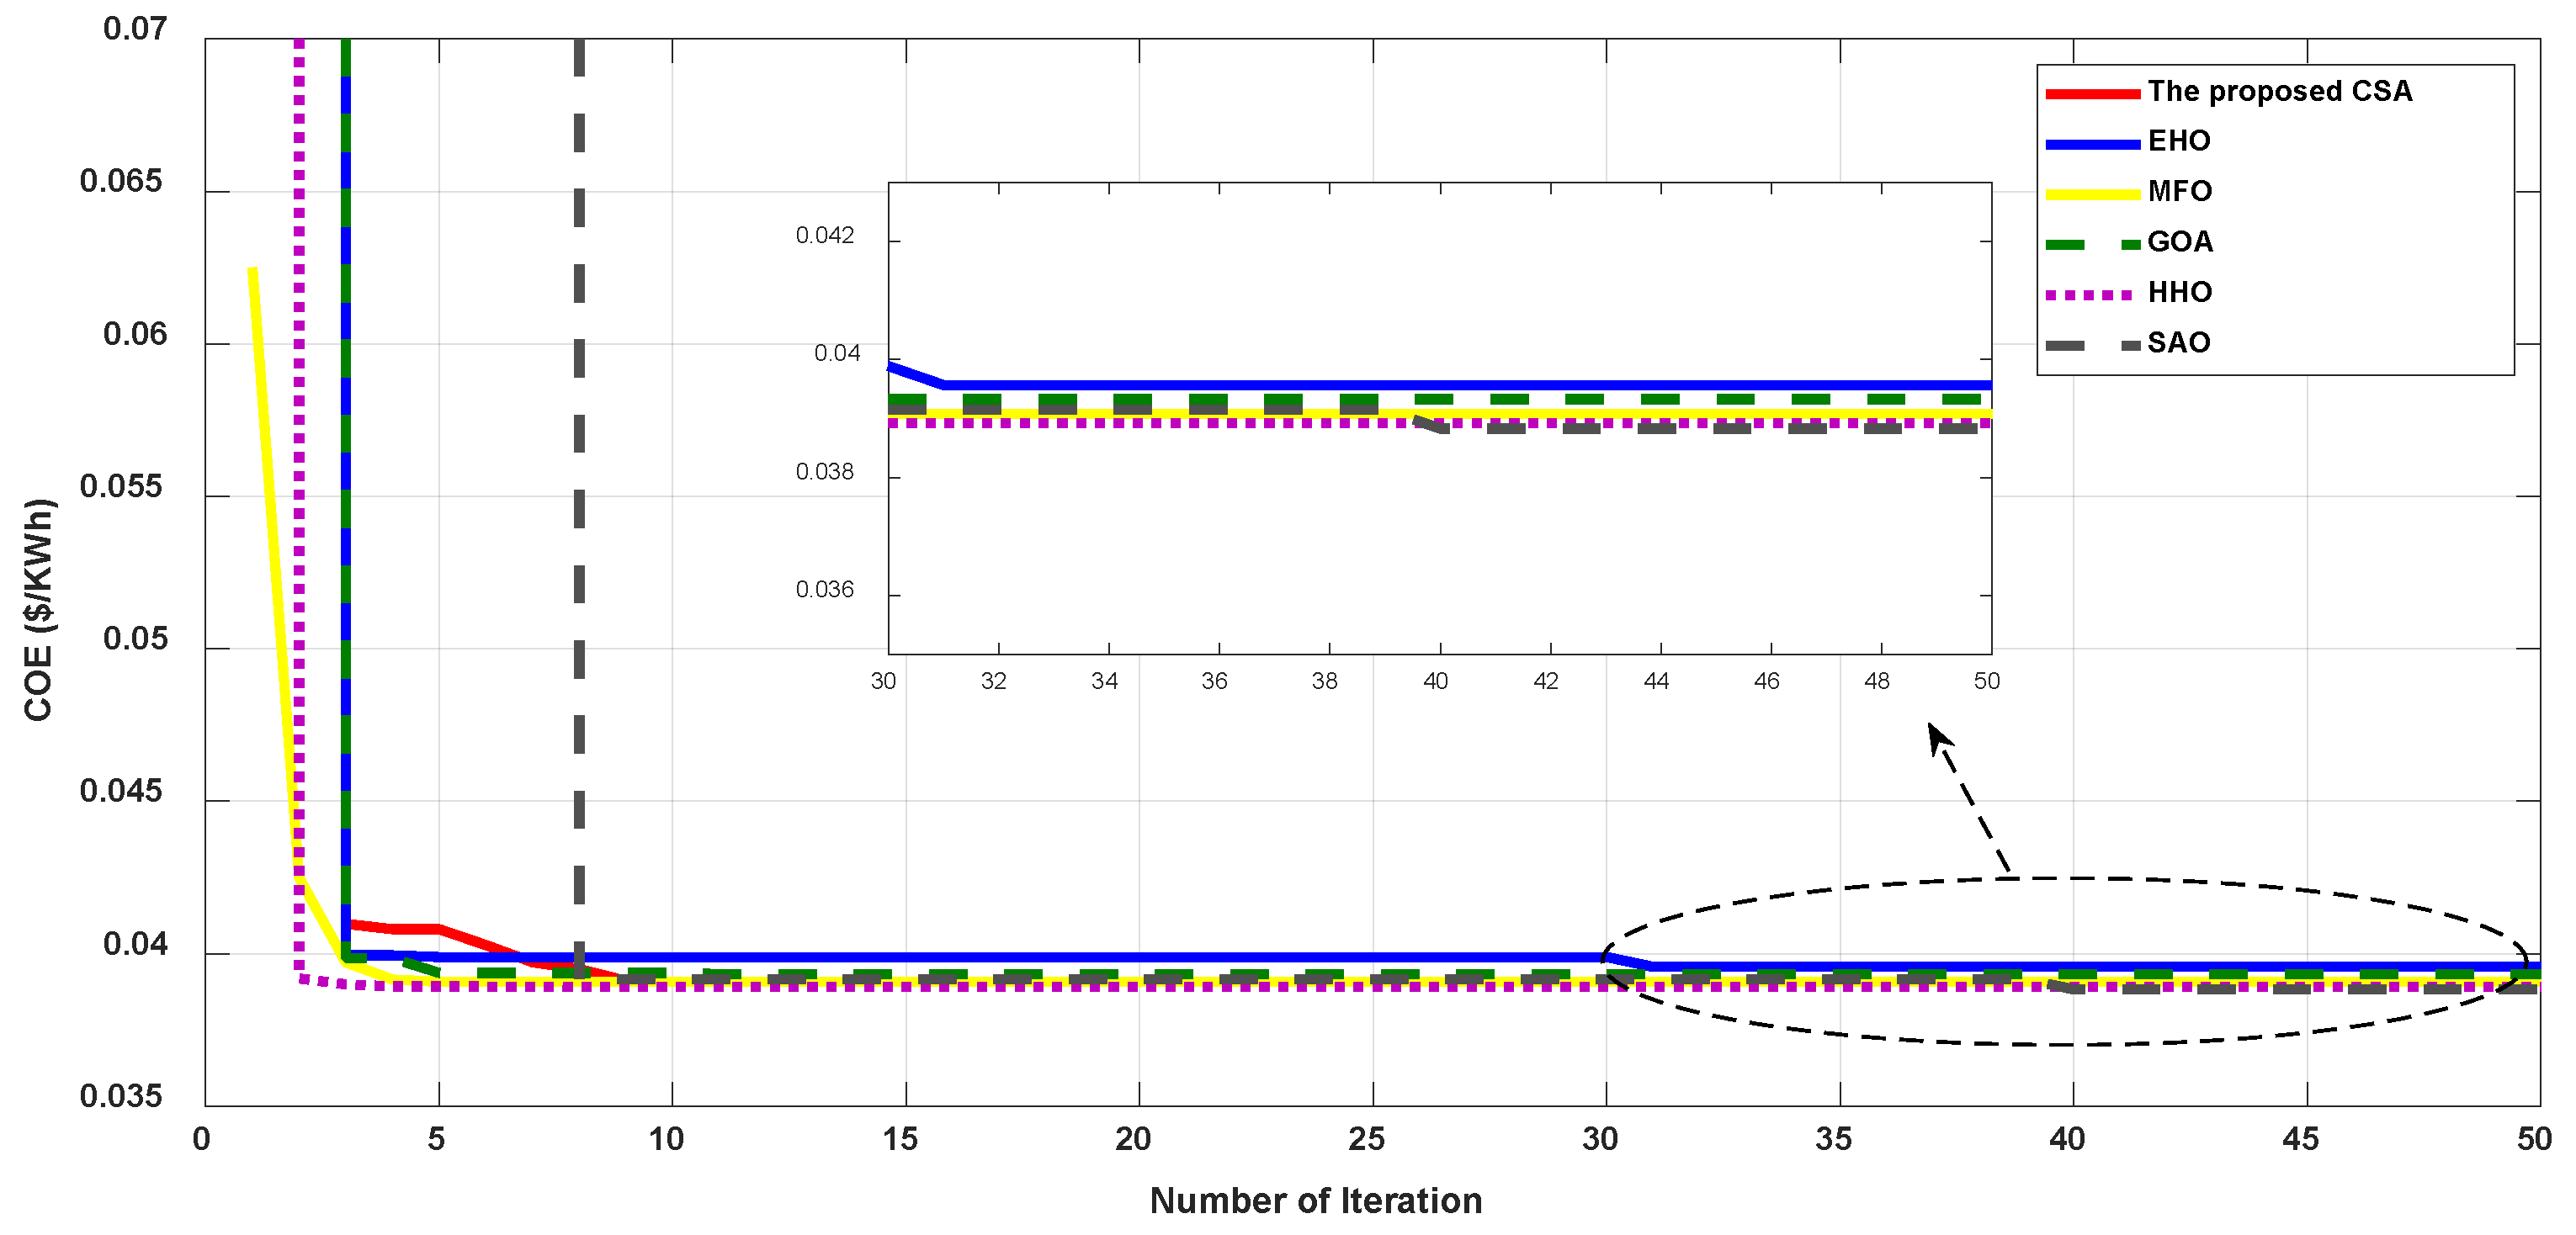
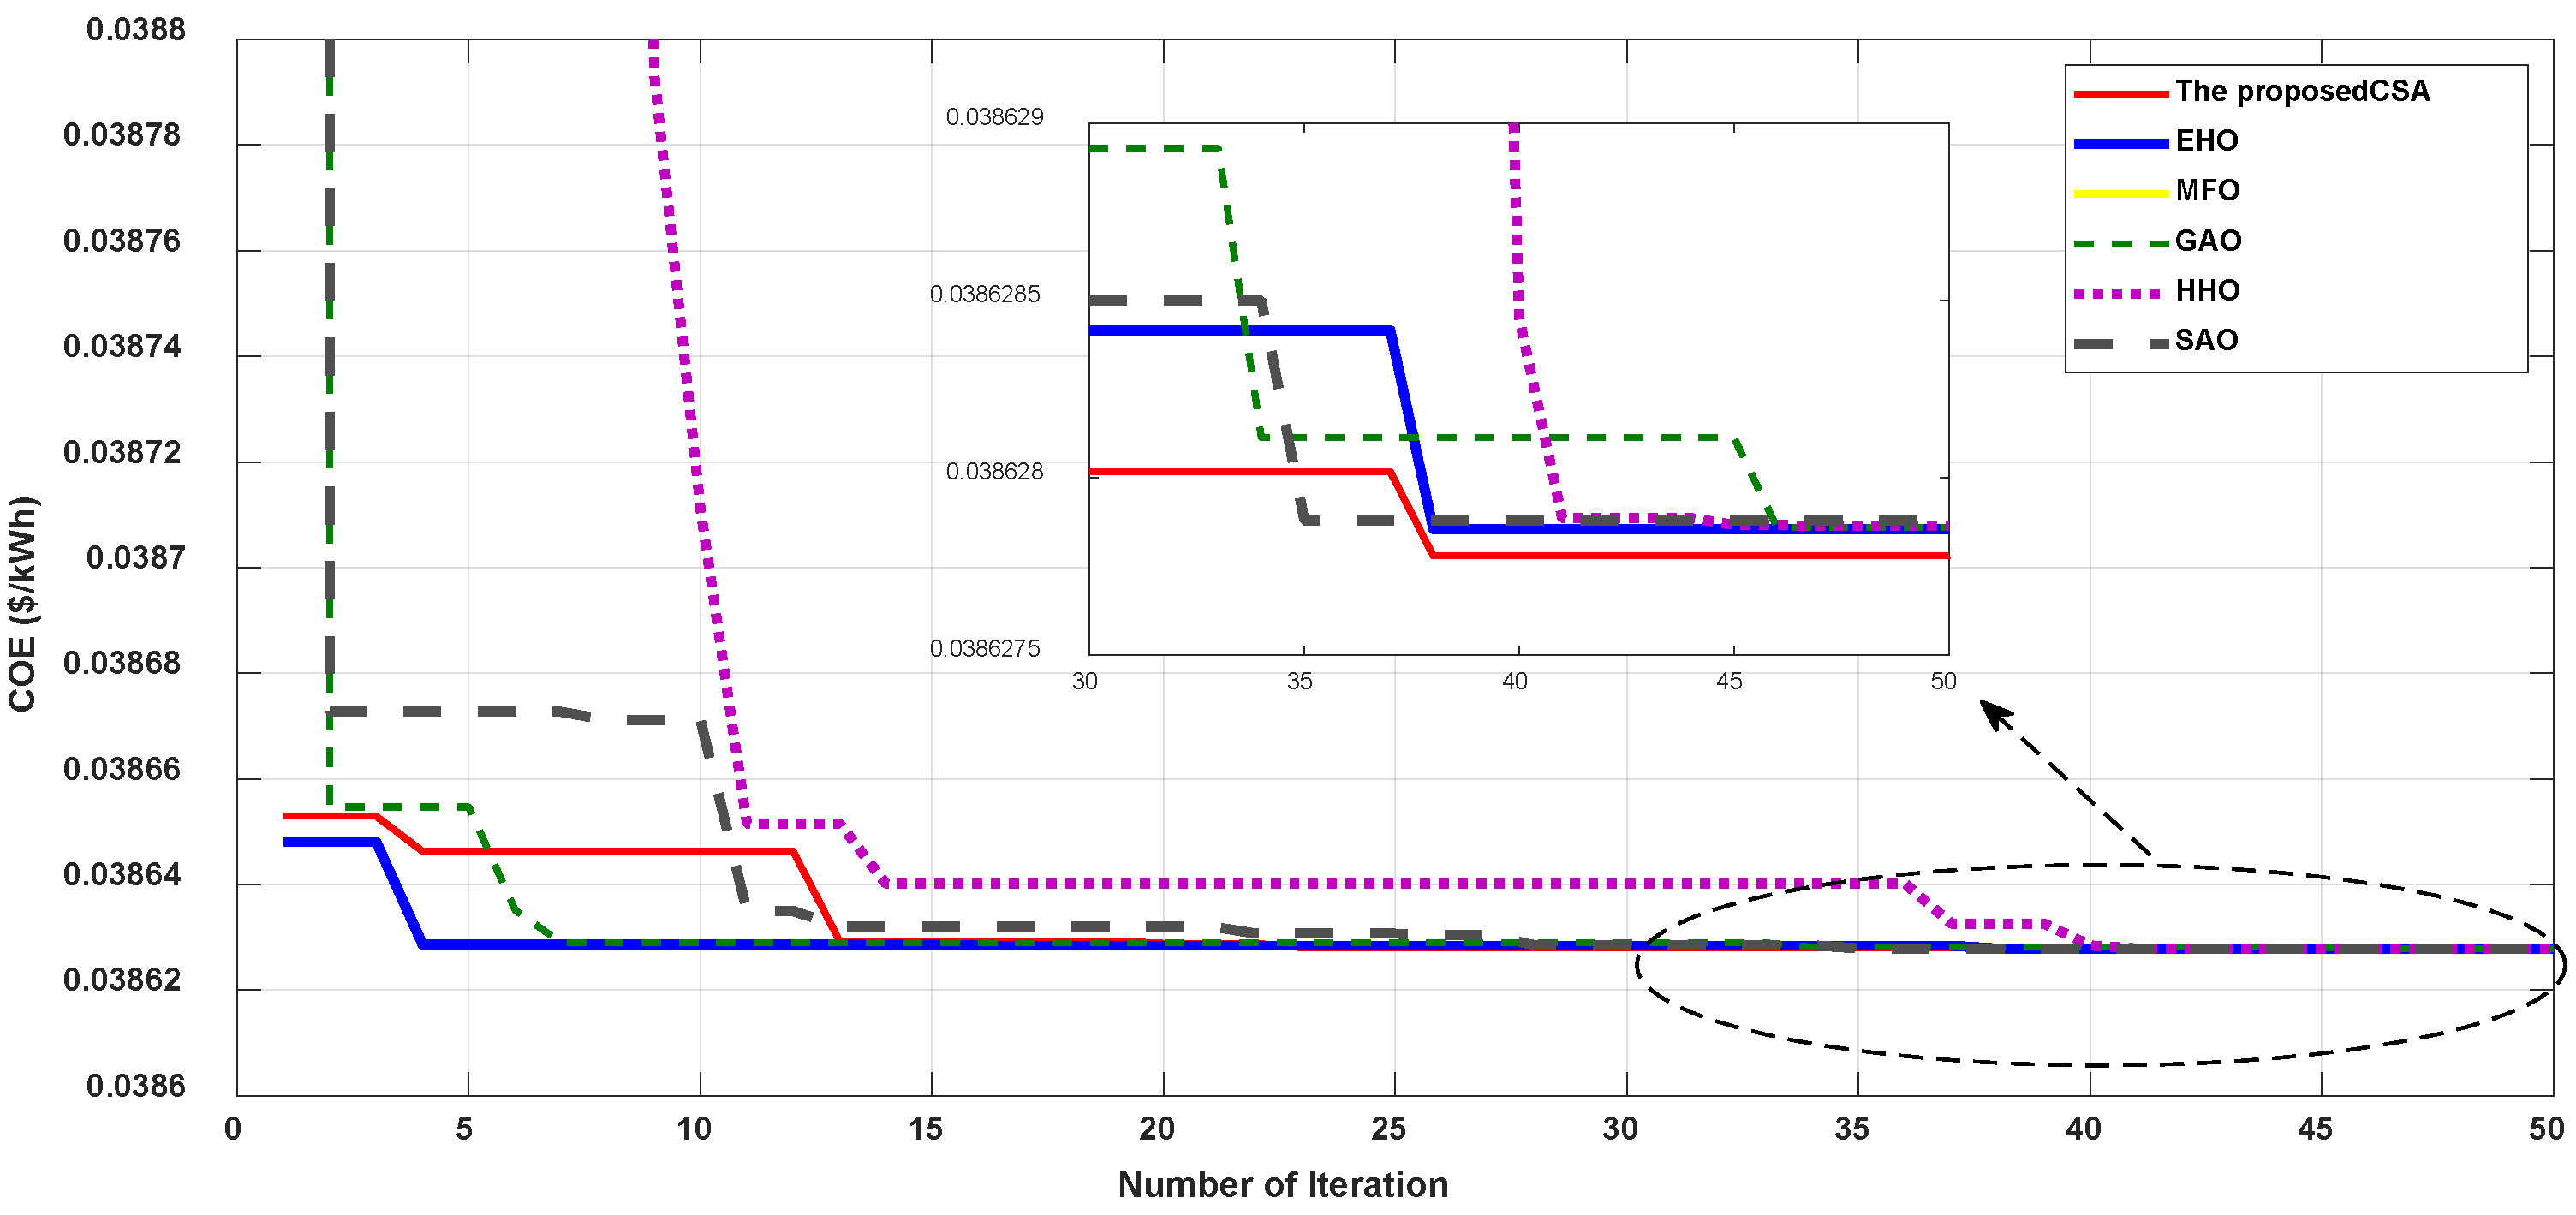
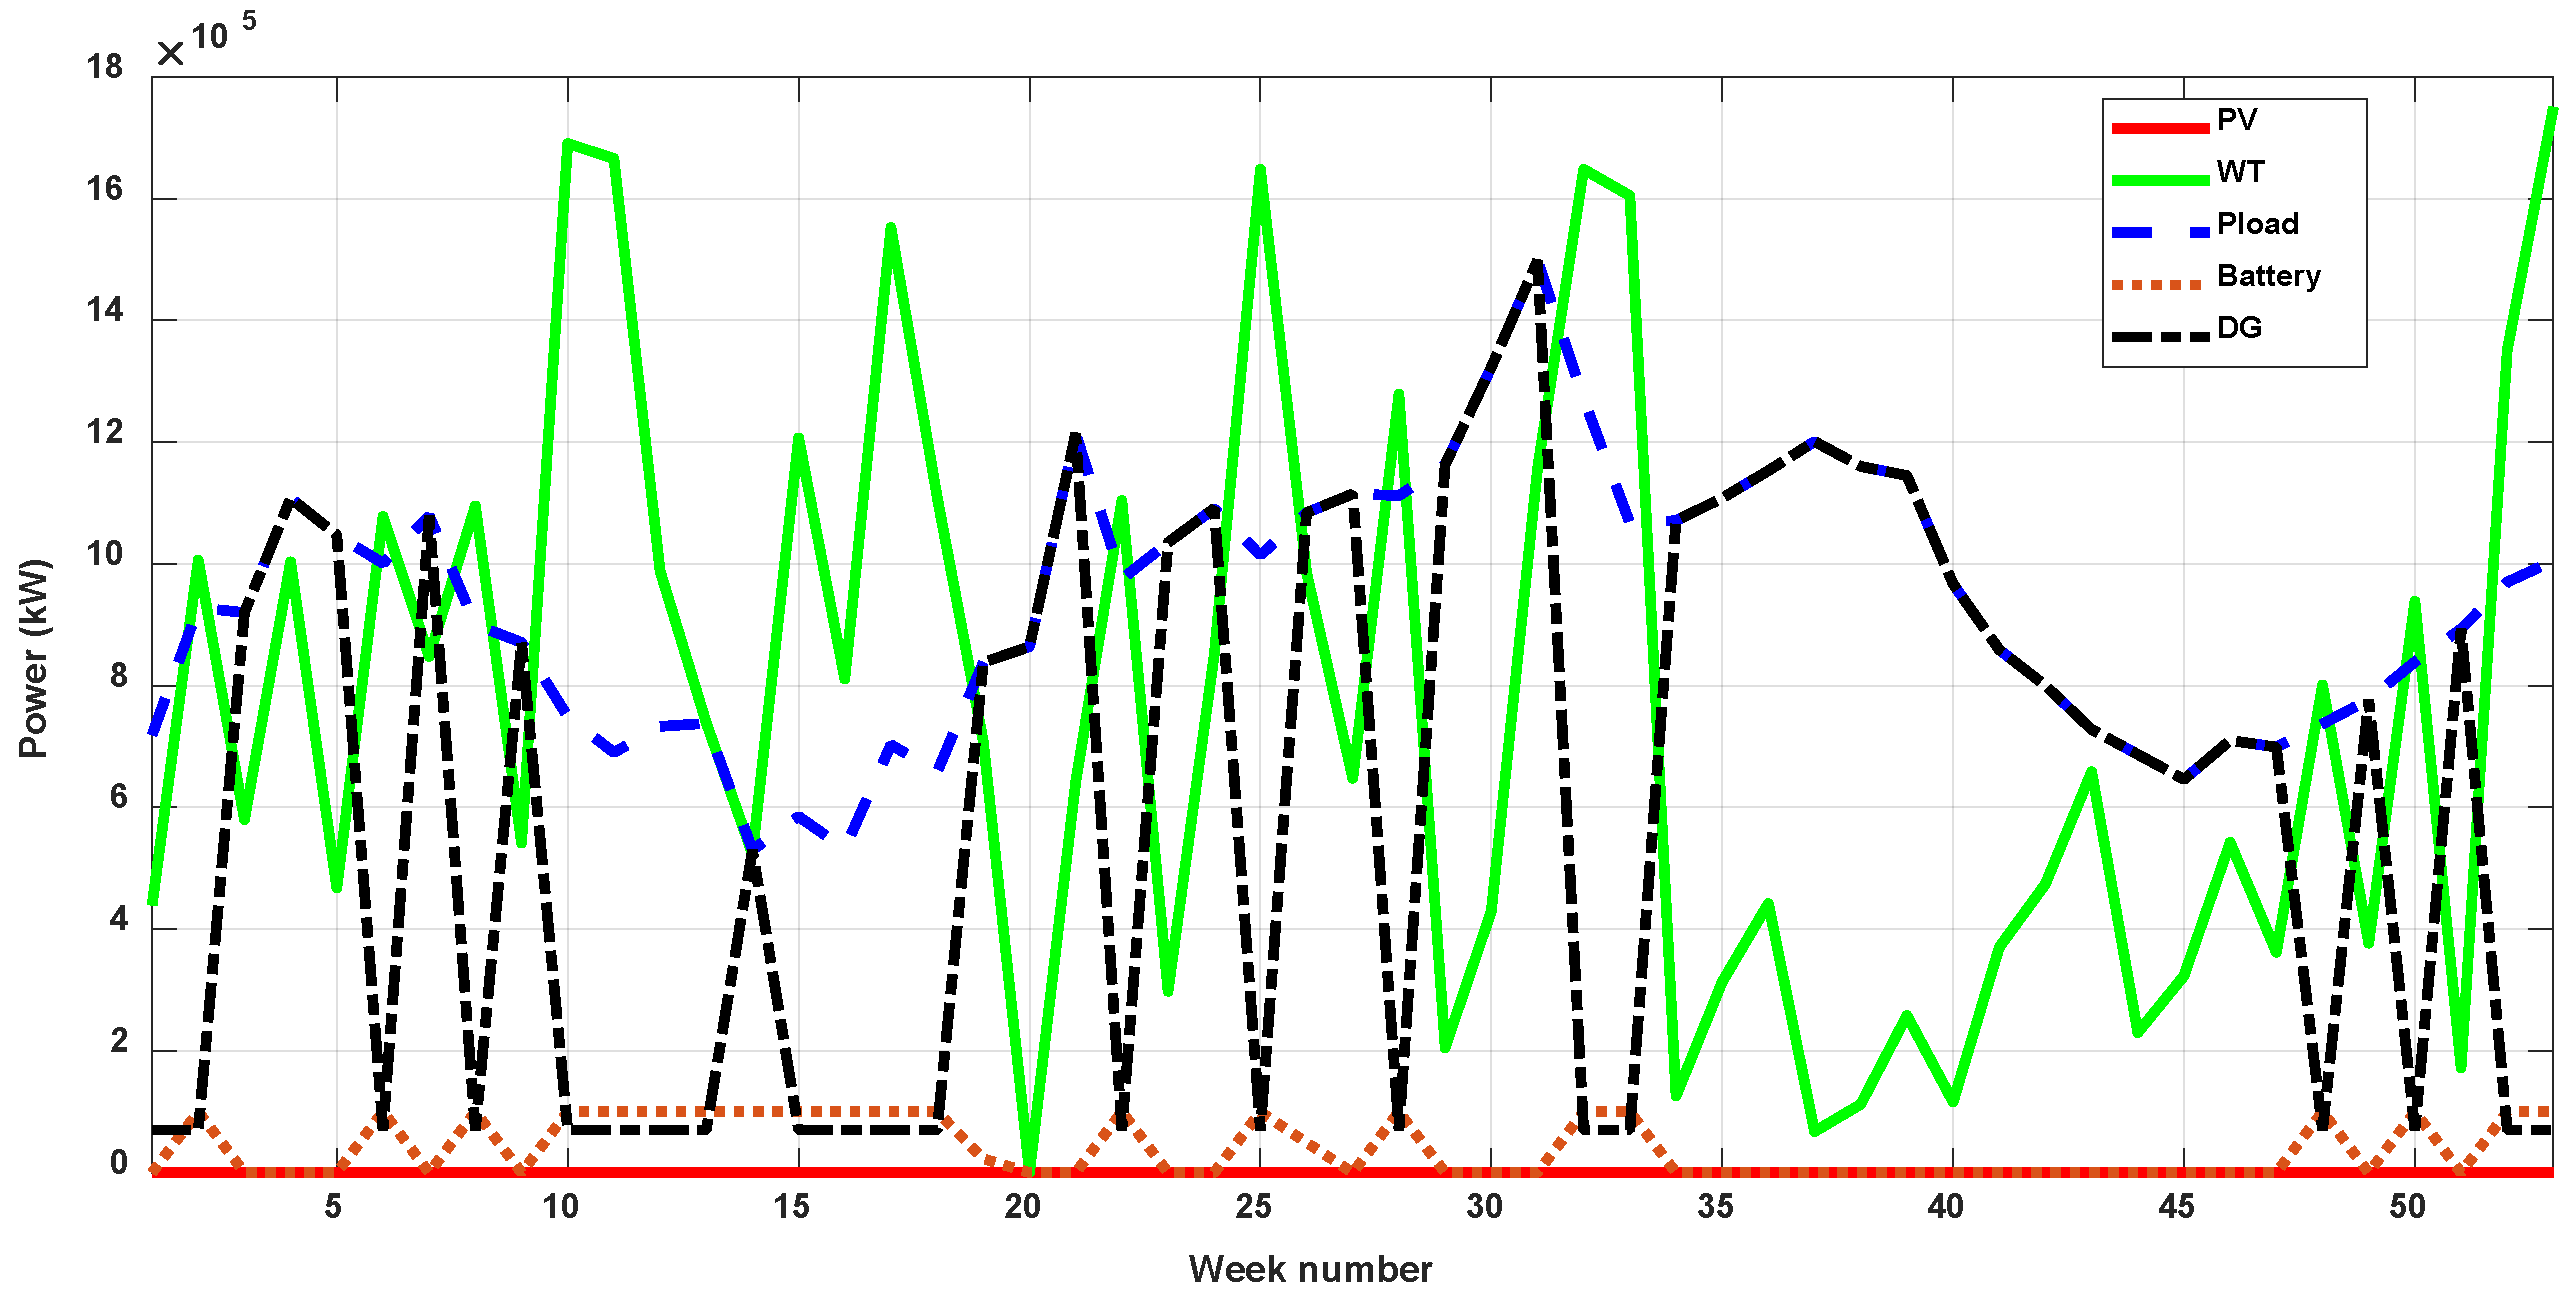
The purpose of this study is to find the optimal size of the components of a hybrid renewable generation system such that the system’s COE is minimized. The proposed CSA is implemented for 50 iterations and a population size of 300. A comparison to the elephant herding optimizer (EHO) [37], the grasshopper optimization algorithm (GOA) [38], the Harris hawks optimizer (HHO) [39], the seagull optimization algorithm (SOA), and the spotted hyena optimizer (SHO) is performed. Each algorithm is implemented for 30 runs and the best run is selected as the global solution. This is essential to avoid the problem of assigning the initial parameters of each optimizer. Moreover, the constructed microgrid is assessed by calculating the LPSP. The optimal solutions via the considered optimizers are given in Table 3. The proposed CSA comes in first, achieving the lowest COE, 0.03883 USD/kWh with an LPSP of 0.9574. This value confirms the reliability of the constructed microgrid via the proposed CSA. On the other hand, the HHO achieved the worst fitness value, 0.03957 USD/kWh. The variations in generated powers from each component of the constructed system obtained via the proposed CSA are shown in Figure 11. It is clear that during the first few weeks, both PV and DG energy are exchanged to cover the demand, while the excess power is employed to charge the battery. From the seventh week to week no. 28, the power supplied from the PV system is adequate to meet the demand. In such a case, the DG is used as a spare unit and the battery is still in charging mode while the power produced from the WT is small. In the remaining weeks, the PV panels and DGs are placed to cover the load. The variations in fitness values during the iterative process followed in each optimizer are given in Figure 12. The curves confirmed the superiority of the proposed CSA.
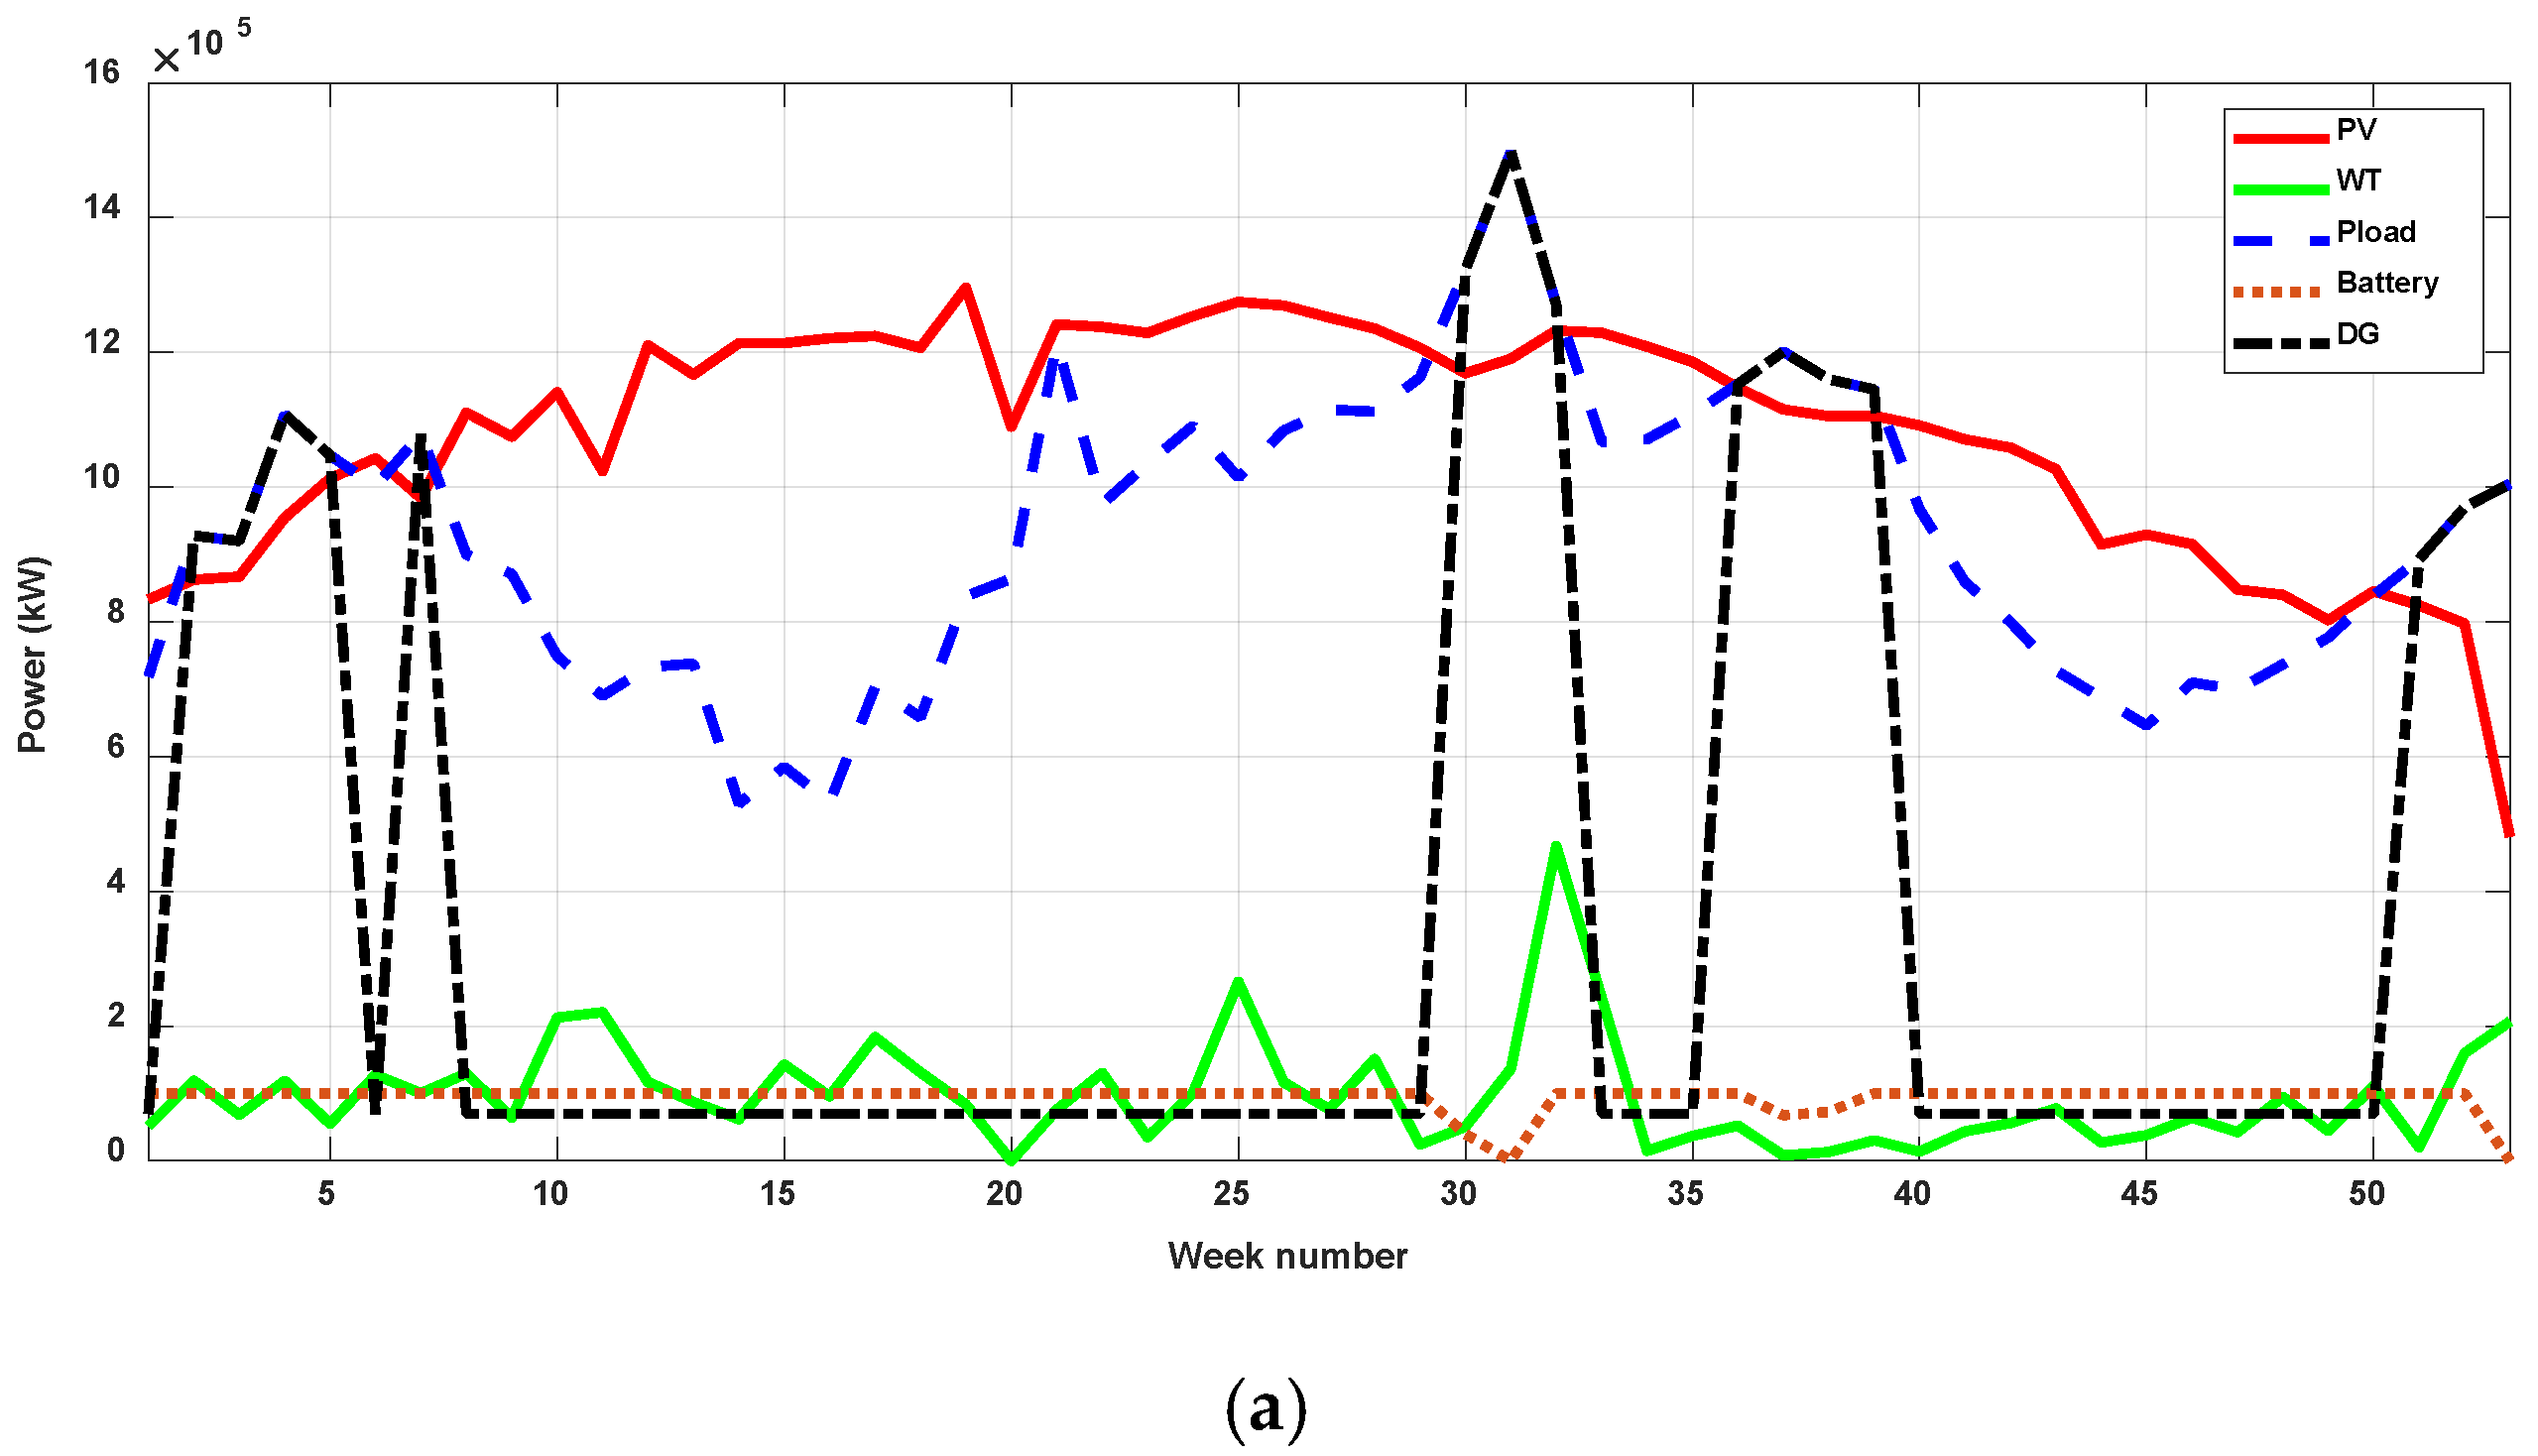
Moreover, the power generation of each component obtained via the EHO, MFO, GOA, HHO, and SAO are given in Figure 13.
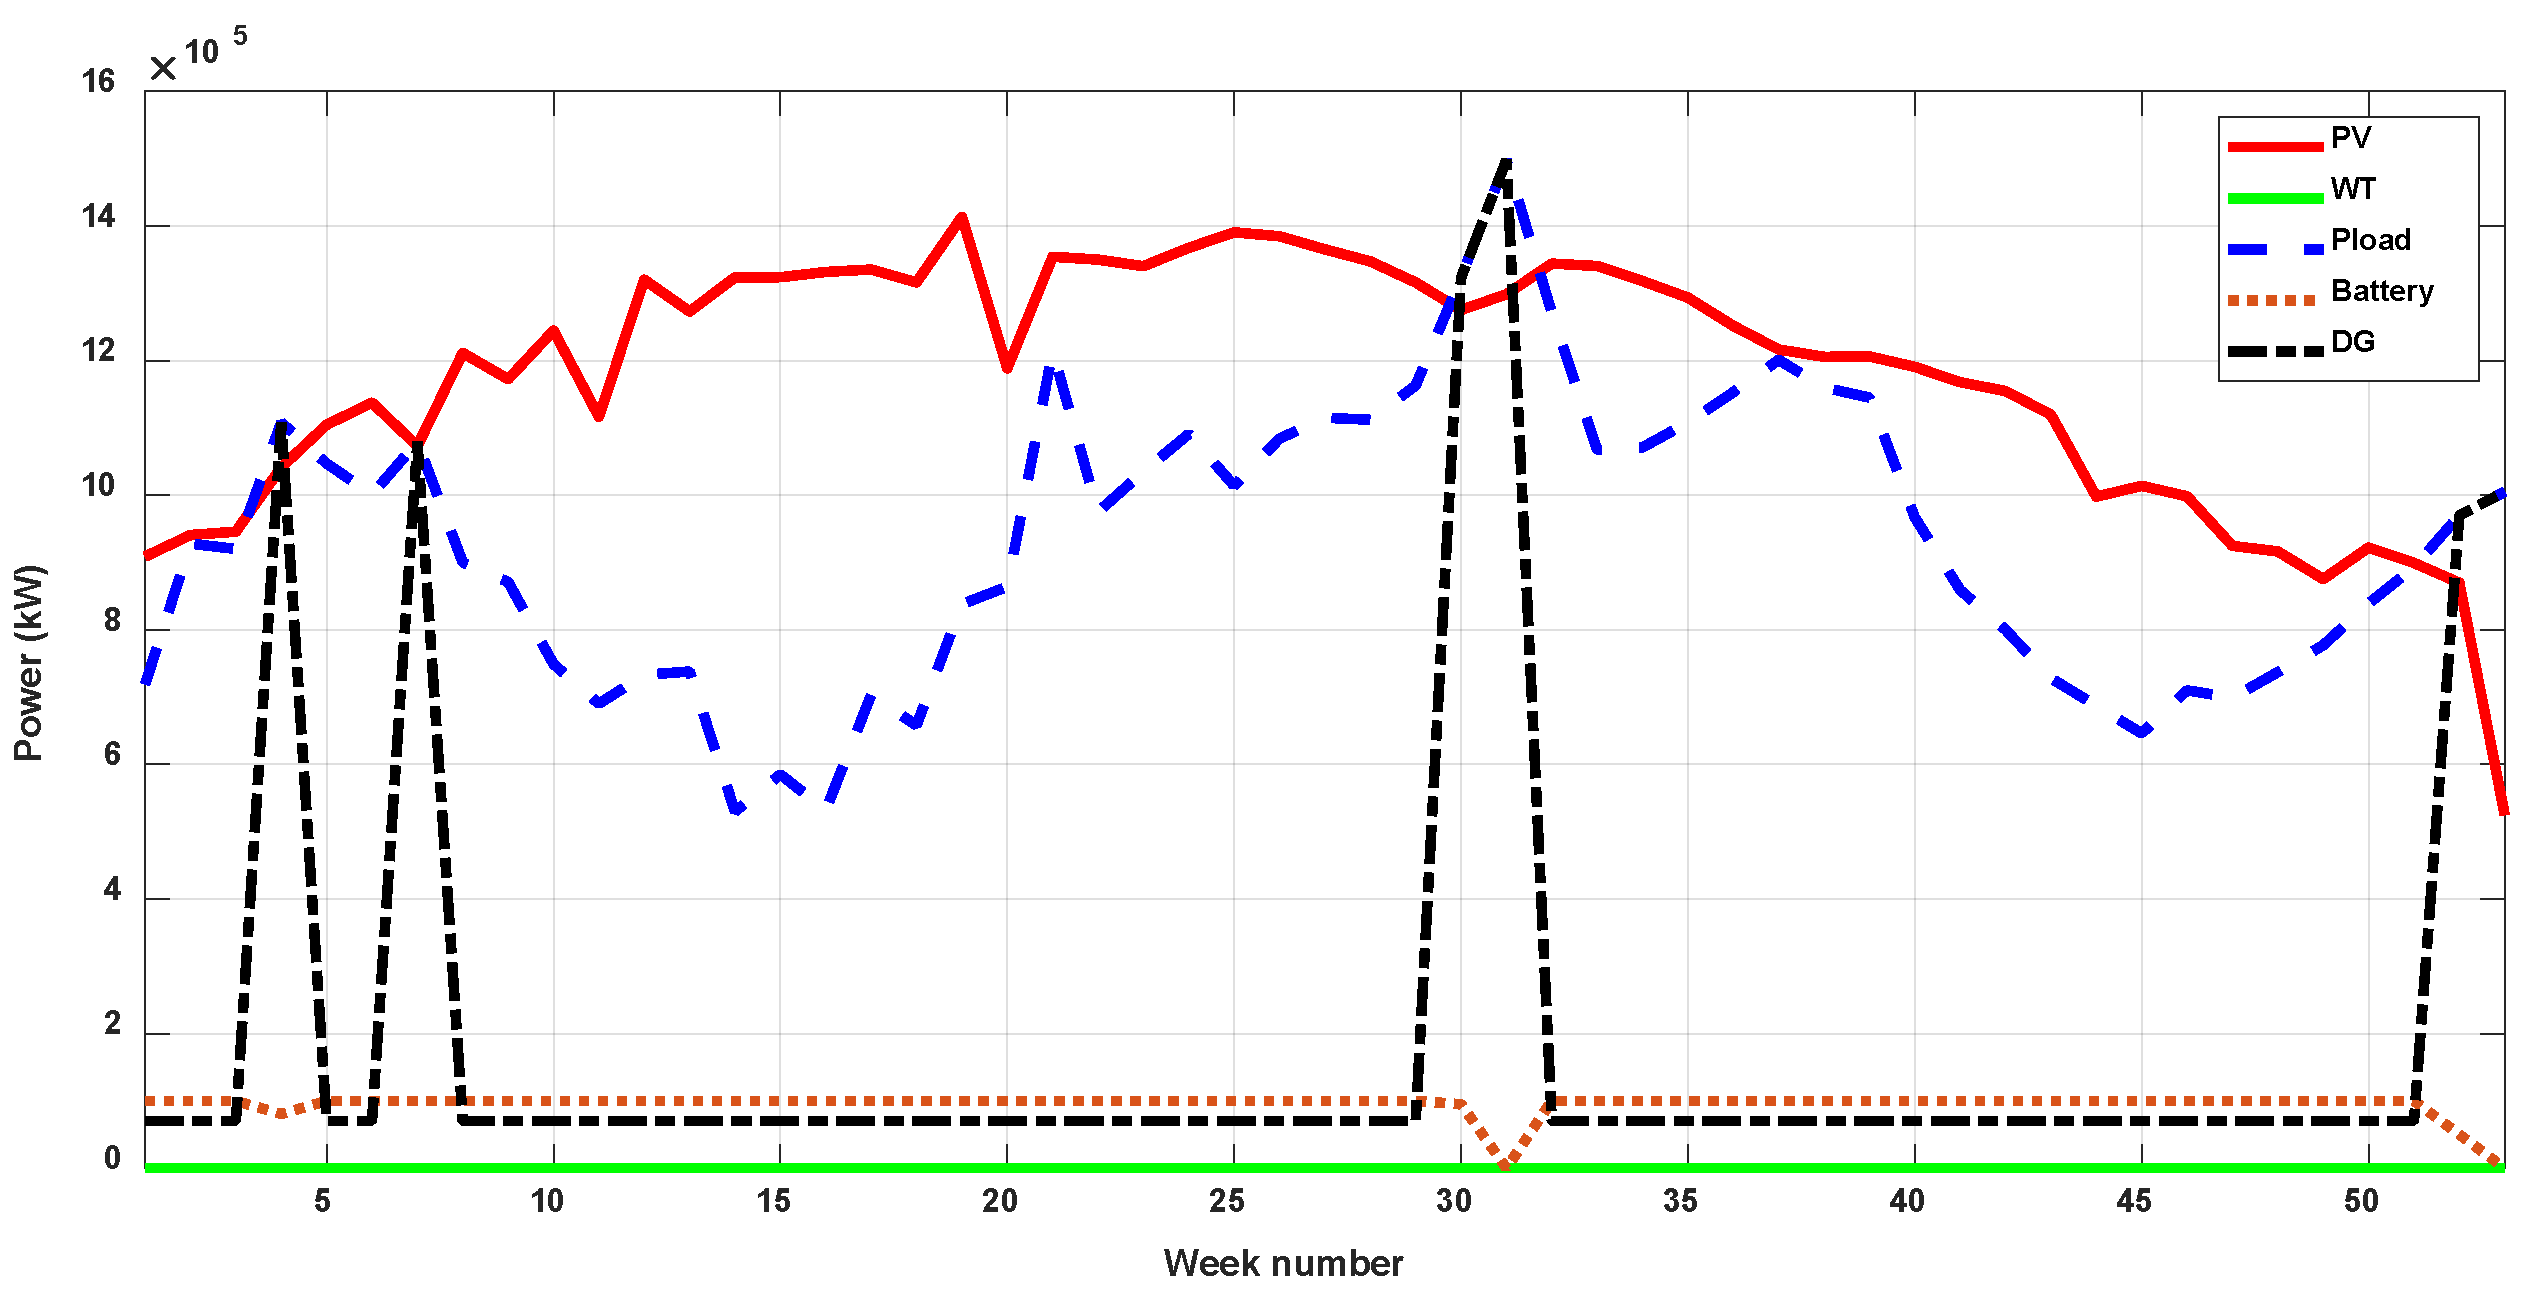
It is essential to assess the constructed system’s reliability via the proposed CSA. This is performed via conducting a sensitivity analysis by excluding either PV panels or WTs from the microgrid. The obtained results for the PV/battery/DG system are tabulated in Table 4. It shows that the fetched results are very similar, but the proposed method is still the best in terms of the COE and LPSP. This confirms the reliability of the constructed system via the proposed CSA. The variations in the power generated from each component with the time are given in Figure 14. It is clear that the proposed CSA succeeded in constructing a reliable microgrid that always meets the demand. On the other hand, the COE versus the iteration number in that case is shown in Figure 15.
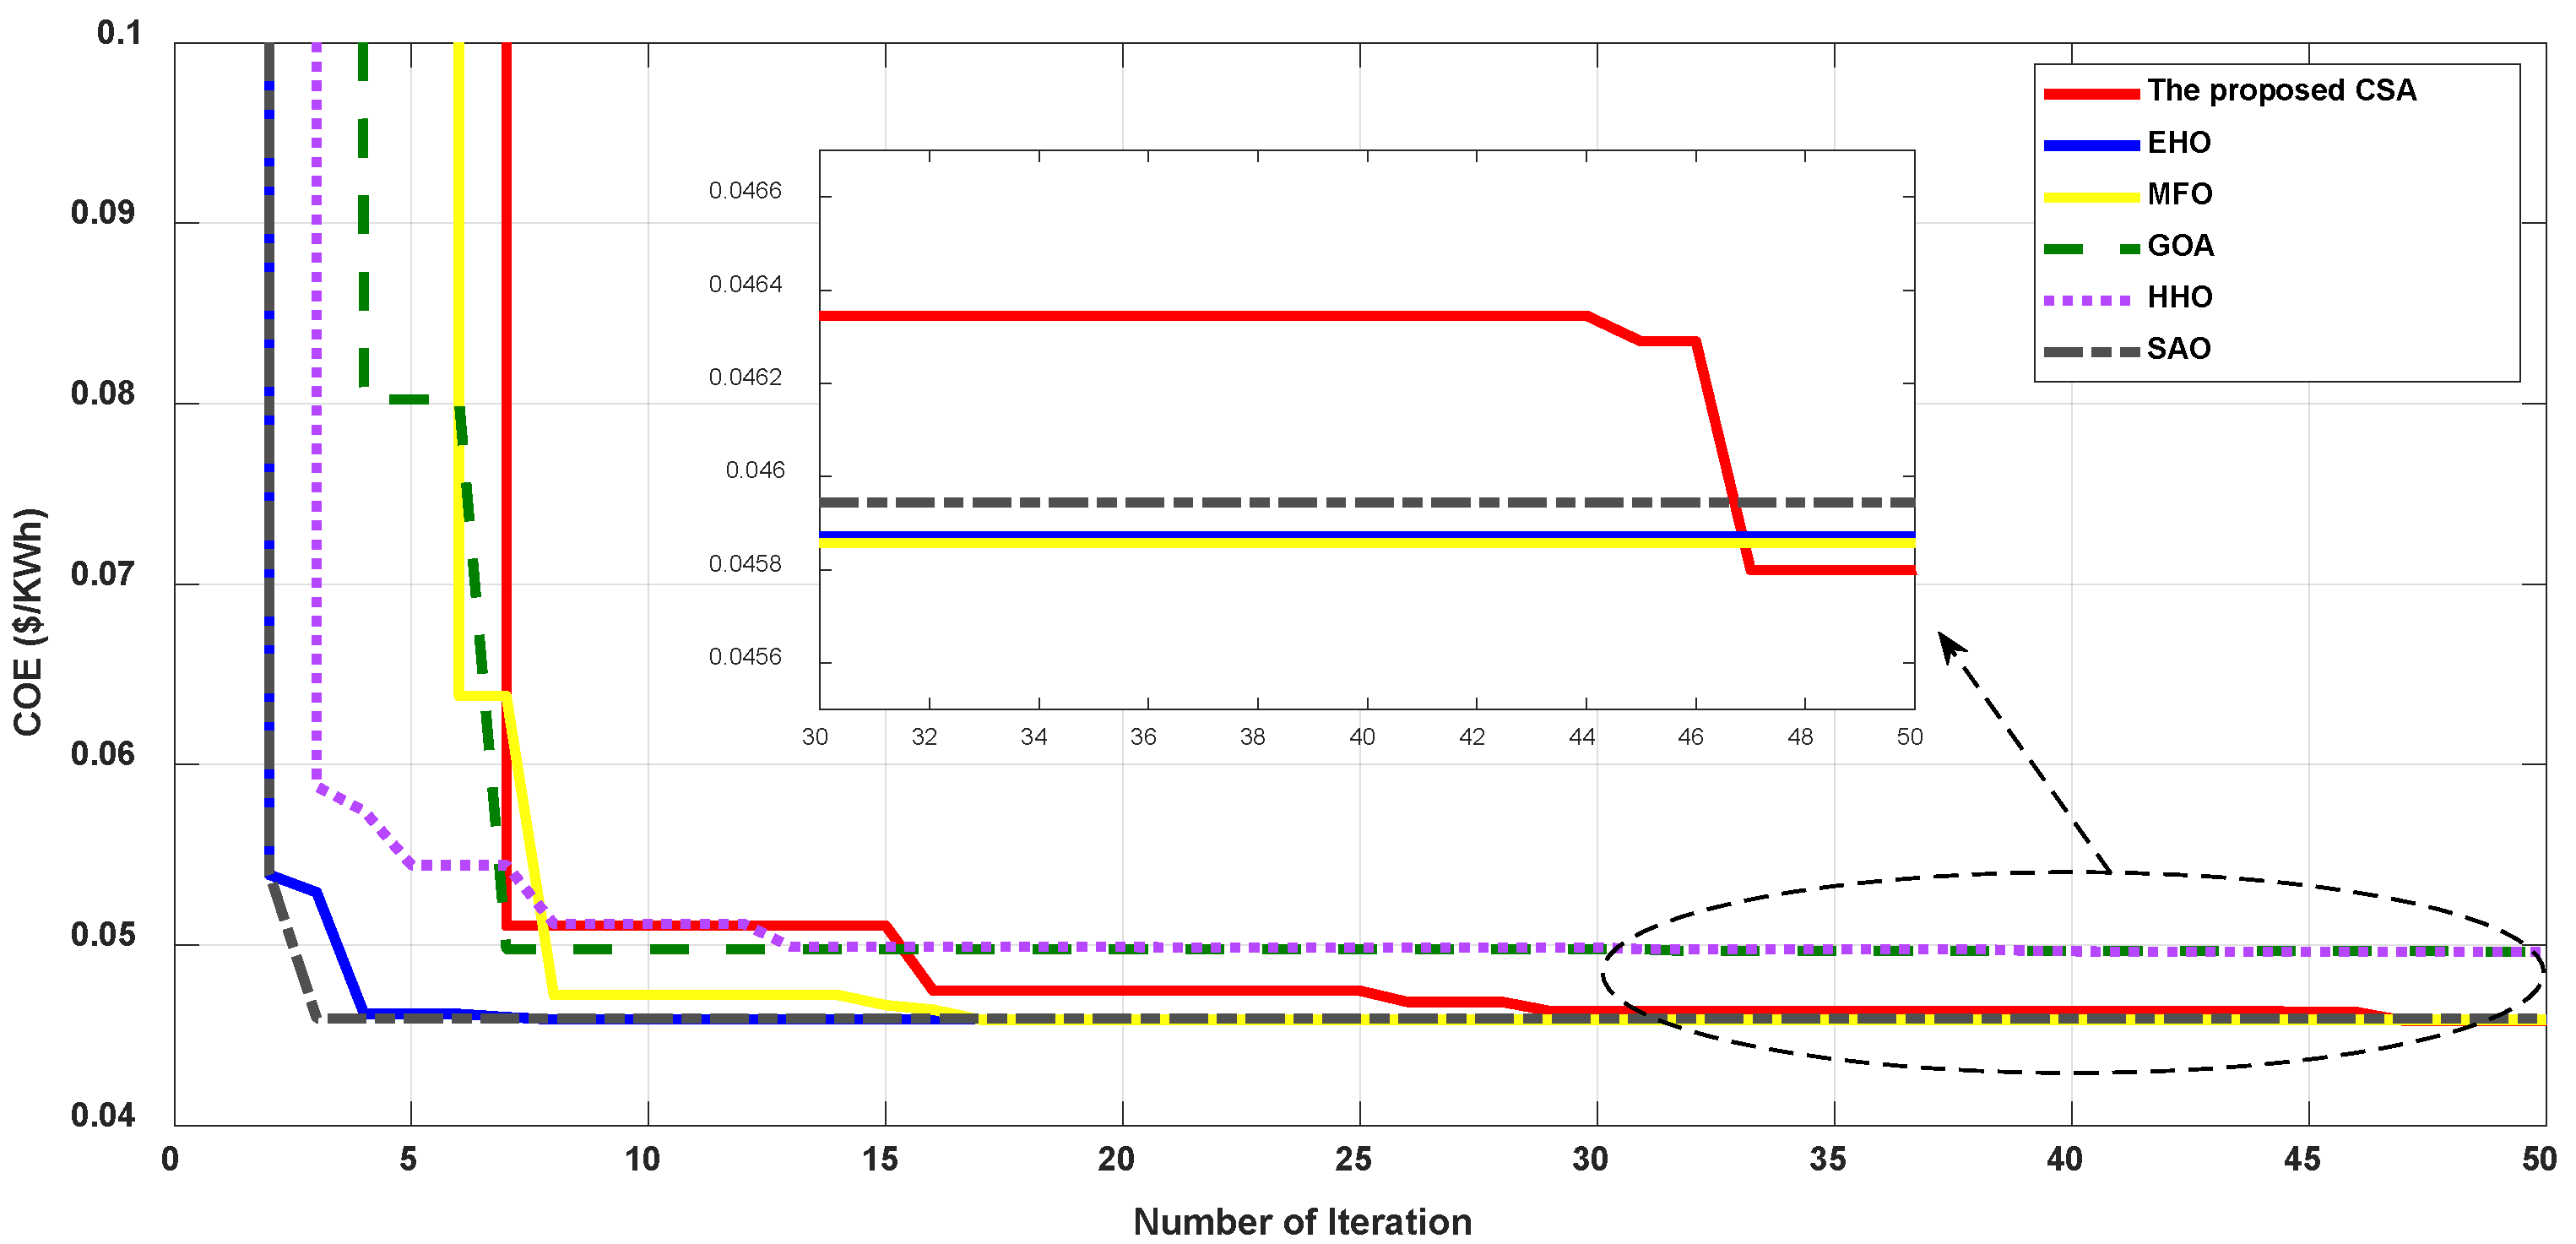
The last case is considered by excluding the PV system from the microgrid and keeping the other components to cover the load. The obtained results in such case are given in Table 5. The reader can see that the proposed CSA is the best one among the options, achieving a minimum COE of 0.04585 USD/kWh and LPSP of 0.9999. This achieved by installing 279 WTs. The AD of the battery is 3 days. The time responses of the microgrid generation and demand are shown in Figure 16. The curves confirmed that the constructed microgrid via the proposed CSA is reliable as the load is always covered. The COE versus the iteration number in that case is given in Figure 17. The proposed CSA outperformed the others in achieving the best fitness value.
The fetched results confirmed that the proposed CSA is efficient in obtaining the optimal configuration of the microgrid comprising hybrid renewable energy sources installed in the northeastern region of Saudi Arabia.

6. Conclusions

This paper proposes a new methodology incorporating the crow search algorithm (CSA) to evaluate the optimal configuration of a hybrid renewable energy-based microgrid comprising a WT, PV panels, a DG, a battery, and an inverter. The target is to mitigate the cost of energy (COE); moreover, the loss of power supply probability (LPSP) is calculated to assess the constructed generating system’s reliability. Three design variables are considered in the formulated optimization problem: the number of PV panels, WT number, and number of battery AD. The designed microgrid serves a load installed in the northeastern region of Saudi Arabia. Real data of wind speed, temperature, and solar radiation are collected via the National Aeronautics and Space Administration (NASA), while the electrical load data are provided by Saudi Water and Electricity Regulatory Authority. All outcomes from the proposed CSA are compared to the elephant herding optimizer (EHO), Harris hawks optimizer (HHO), grasshopper optimization algorithm (GOA), seagull optimization algorithm (SOA), and spotted hyena optimizer (SHO). The best optimal design of the microgrid is obtained via the proposed CSA with a minimum COE of 0.03883 USD/kWh and LPSP of 0.9574. Moreover, a sensitivity analysis with the scaling of various RESs is conducted. The results proved the robustness of the proposed CSA in constructing an effective, robust, reliable, and optimum off-grid generating system with renewable energy sources in the northeastern region of Saudi Arabia. Future work will involve constructing an HRES microgrid connected to an electrical grid.

Author Contributions

Conceptualization, S.A. and A.F.; methodology, S.A. and A.F.; software; validation, A.F.; formal analysis, S.A.; investigation, S.A. and A.F.; resources, A.F.; data curation, S.A. and A.F; writing—original draft preparation, A.F.; writing—review and editing, S.A.; visualization, A.F.; supervision, A.F. All authors have read and agreed to the published version of the manuscript.

Funding

This research received no external funding.

Institutional Review Board Statement

Not applicable.

Informed Consent Statement

Not applicable.

Data Availability Statement

Not applicable.

Acknowledgments

The authors would like to thank the Deanship of Graduate Studies at Jouf University for funding and supporting this research through the initiative of DGS, Graduate Students Research Support (GSR) at Jouf University, Saudi Arabia.

Conflicts of Interest

The authors declare no conflict of interest.

References

  1. Gonzalez, A.; Riba, J.R.; Rius, A.; Puig, R. Optimal sizing of a hybrid grid-connected photovoltaic and wind power system. Appl. Energy 2015, 154, 752–762. [Google Scholar] [CrossRef] [Green Version]
  2. Kaabeche, A.; Belhamel, M.; Ibtiouen, R. Sizing optimization of grid-independent hybrid photovoltaic/wind power generation system. Energy 2011, 2, 1214–1222. [Google Scholar] [CrossRef]
  3. Fathy, A.; Kaaniche, K.; Alanazi, T.M. Recent approach based social spider optimizer for optimal sizing of hybrid PV/wind/battery/diesel integrated microgrid in Aljouf region. IEEE Access 2020, 8, 57630–57645. [Google Scholar] [CrossRef]
  4. Daming, X.; Kang, L.; Chang, L.; Cao, B. Optimal Sizing of Standalone Hybrid Wind/PV Power Systems Using Genetic Algorithms. In Proceedings of the 18th Canadian Conference on Electrical and Computer Engineering, Saskatoon, SK, Canada, 1–5 May 2005; pp. 1722–1725. [Google Scholar]
  5. Hadidian-Moghaddam, M.J.; Arabi-Nowdeh, S.; Bigdeli, M. Optimal sizing of a stand-alone hybrid photovoltaic/wind system using new grey wolf optimizer considering reliability. J. Renew. Sustain. Energy 2016, 8, 035903. [Google Scholar] [CrossRef]
  6. Nedim, T.; Çelebi, N.; Bozok, N. Optimum unit sizing of wind-PV-battery system components in a typical residential home. In Proceedings of the 4th International Renewable and Sustainable Energy Conference (IRSEC), Marrakesh, Morocco, 14–17 November 2016; pp. 432–436. [Google Scholar]
  7. Jihane, K.; Cherkaoui, M. Optimal sizing of hybrid renewable PV/Wind battery system using LPSP methods. In Proceedings of the 6th International Conference on Systems and Control (ICSC), Batna, Algeria, 7–9 May 2017; pp. 226–230. [Google Scholar]
  8. Rachid, B.; Zhang, L.; Barakat, G. Optimal sizing study of hybrid wind/PV/diesel power generation unit. Sol. Energy 2011, 85, 100–110. [Google Scholar]
  9. Lu, Z.; Barakat, G.; Yassine, A. Design and optimal sizing of hybrid PV/wind/diesel system with battery storage by using DIRECT search algorithm. In Proceedings of the 15th International Power Electronics and Motion Control Conference (EPE/PEMC), Novi Sad, Serbia, 4–6 September 2012; p. DS3b-19. [Google Scholar]
  10. Azah, M.; Khatib, T. Optimal sizing of a PV/wind/diesel hybrid energy system for Malaysia. In Proceedings of the IEEE International Conference on Industrial Technology (ICIT), Cape Town, South Africa, 25–28 February 2013; pp. 752–757. [Google Scholar]
  11. Mariem, S.; Abdelkafi, A.; Krichen, L. Optimal sizing of stand-alone photovoltaic/wind/hydrogen hybrid system supplying a desalination unit. Sol. Energy 2015, 120, 263–276. [Google Scholar]
  12. Fathy, A. A reliable methodology based on mine blast optimization algorithm for optimal sizing of hybrid PV-wind-FC system for remote area in Egypt. Renew. Energy 2016, 95, 367–380. [Google Scholar] [CrossRef]
  13. Tégani, I.; Aboubou, A.; Ayad, M.Y.; Becherif, M.; Saadi, R.; Kraa, O. Optimal sizing design and energy management of stand-alone photovoltaic/wind generator systems. Energy Procedia 2014, 50, 163–170. [Google Scholar] [CrossRef] [Green Version]
  14. Yusuf, G.; Vaidya, R.; Nunna, H.S.V.S.K.; Kamalasadan, S.; Doolla, S. Optimal pv–battery sizing for residential and commercial loads considering grid outages. In Proceedings of the IEEE International Conference on Power Electronics, Smart Grid and Renewable Energy (PESGRE2020), Kerala, India, 2–4 January 2020; pp. 1–5. [Google Scholar]
  15. Nabiha, B.; Chaabene, M. Sizing optimization tool for wind/photovoltaic/battery plant considering potentials assessment and load profile. In Proceedings of the IREC2015 The Sixth International Renewable Energy Congress, Sousse, Tunisia, 24–26 March 2015; pp. 1–6. [Google Scholar]
  16. Bilal, B.O.; Sambou, V.; Ndiaye, P.A.; Kébé, C.M.F.; Ndongo, M. Study of the influence of load profile variation on the optimal sizing of a standalone hybrid PV/wind/battery/diesel system. Energy Procedia 2013, 36, 1265–1275. [Google Scholar] [CrossRef] [Green Version]
  17. Hamanah, W.M.; Abido, M.A.; Alhems, L.M. Optimum sizing of hybrid pv, wind, battery and diesel system using lightning search algorithm. Arab. J. Sci. Eng. 2020, 3, 1871–1883. [Google Scholar] [CrossRef]
  18. Shafiqur, R.; El-Amin, I. Study of a solar pv/wind/diesel hybrid power system for a remotely located population near Arar, Saudi Arabia. Energy Explor. Exploit. 2015, 4, 591–620. [Google Scholar]
  19. Khalid, A.; Dehshiri, S.S.H.; Dehshiri, S.J.H.; Mostafaeipour, A.; Issakhov, A.; Techato, K. Use of a Hybrid Wind–Solar–Diesel–Battery Energy System to Power Buildings in Remote Areas: A Case Study. Sustainability 2021, 13, 8764. [Google Scholar]
  20. Diab, A.A.Z.; Sultan, H.M.; Mohamed, I.S.; Kuznetsov, O.N.; Do, T.D. Application of different optimization algorithms for optimal sizing of PV/wind/diesel/battery storage stand-alone hybrid microgrid. IEEE Access 2019, 7, 119223–119245. [Google Scholar] [CrossRef]
  21. Abbassi, A.; Ben Mehrez, R.; Abbassi, R.; Jerbi, H.; Saidi, S.; Jemli, M. Eco-feasibility study of a distributed power generation system driven by renewable green energy sources. Energy Sources Part A Recovery Util. Environ. Eff. 2022, 44, 3981–3999. [Google Scholar] [CrossRef]
  22. Zhao, L.; Jerbi, H.; Abbassi, R.; Liu, B.; Latifi, M.; Nakamura, H. Sizing renewable energy systems with energy storage systems based microgrids for cost minimization using hybrid shuffled frog-leaping and pattern search algorithm. Sustain. Cities Soc. 2021, 73, 103124. [Google Scholar] [CrossRef]
  23. Abbassi, A.; Mehrez, R.B.; Abbassi, R.; Saidi, S.; Albdran, S.; Jemli, M. Improved off-grid wind/photovoltaic/hybrid energy storage system based on new framework of Moth-Flame optimization algorithm. Int. J. Energy Res. 2022, 46, 6711–6729. [Google Scholar] [CrossRef]
  24. Li, N.; Su, Z.; Jerbi, H.; Abbassi, R.; Latifi, M.; Furukawa, N. Energy management and optimized operation of renewable sources and electric vehicles based on microgrid using hybrid gravitational search and pattern search algorithm. Sustain. Cities Soc. 2021, 75, 103279. [Google Scholar] [CrossRef]
  25. Suresh, M.; Meenakumari, R.; Panchal, H.; Priya, V.; El Agouz, E.S.; Israr, M. An enhanced multiobjective particle swarm optimisation algorithm for optimum utilisation of hybrid renewable energy systems. Int. J. Ambient. Energy 2022, 43, 2540–2548. [Google Scholar] [CrossRef]
  26. Nuvvula, R.S.; Devaraj, E.; Elavarasan, R.M.; Taheri, S.I.; Irfan, M.; Teegala, K.S. Multi-objective mutation-enabled adaptive local attractor quantum behaved particle swarm optimisation based optimal sizing of hybrid renewable energy system for smart cities in India. Sustain. Energy Technol. Assess. 2022, 49, 101689. [Google Scholar] [CrossRef]
  27. Al-Othman, A.; Tawalbeh, M.; Martis, R.; Dhou, S.; Orhan, M.; Qasim, M.; Olabi, A.G. Artificial intelligence and numerical models in hybrid renewable energy systems with fuel cells: Advances and prospects. Energy Convers. Manag. 2022, 253, 115154. [Google Scholar] [CrossRef]
  28. He, Y.; Guo, S.; Zhou, J.; Ye, J.; Huang, J.; Zheng, K.; Du, X. Multi-objective planning-operation co-optimization of renewable energy system with hybrid energy storages. Renew. Energy 2022, 184, 776–790. [Google Scholar] [CrossRef]
  29. Derick, M.; Rani, C.; Rajesh, M.; Farrag, M.E.; Wang, Y.; Busawon, K. An improved optimization technique for estimation of solar photovoltaic parameters. Sol. Energy 2017, 157, 116–124. [Google Scholar] [CrossRef]
  30. Das, S. Development of a Low-cost, Portable, and Programmable Solar Module to Facilitate Hands-on Experiments and Improve Student Learning. In Proceedings of the ASEE Annual Conference & Exposition, New Orleans, LA, USA, 26 June 2016. [Google Scholar]
  31. Rehman, S.; Alam, M.M.; Alhems, L.M.; Rafique, M.M. Horizontal axis wind turbine blade design methodologies for efficiency enhancement—A review. Energies 2018, 11, 506. [Google Scholar] [CrossRef] [Green Version]
  32. Khan, M.J.; Iqbal, M.T. Pre-feasibility study of stand-alone hybrid energy systems for applications in Newfoundland. Renew. Energy 2005, 6, 835–854. [Google Scholar] [CrossRef]
  33. El-Hefnawi, S.H. Photovoltaic diesel-generator hybrid power system sizing. Renew. Energy 1998, 1, 33–40. [Google Scholar] [CrossRef]
  34. Ashari, M.; Nayar, C.V. An optimum dispatch strategy using set points for a photovoltaic (PV)–diesel–battery hybrid power system. Sol. Energy 1999, 1, 1–9. [Google Scholar] [CrossRef]
  35. Askarzadeh, A. A novel metaheuristic method for solving constrained engineering optimization problems: Crow search algorithm. Comput. Struct. 2016, 169, 1–12. [Google Scholar] [CrossRef]
  36. Kaabeche, A.; Belhamel, M.; Ibtiouen, R. Techno-economic valuation and optimization of integrated photovoltaic/wind energy conversion system. Sol. Energy 2011, 10, 2407–2420. [Google Scholar] [CrossRef]
  37. Ashraf, M.A.; Liu, Z.; Alizadeh, A.A.; Nojavan, S.; Jermsittiparsert, K.; Zhang, D. Designing an optimized configuration for a hybrid PV/Diesel/Battery Energy System based on metaheuristics: A case study on Gobi Desert. J. Clean. Prod. 2020, 270, 122467. [Google Scholar] [CrossRef]
  38. Bukar, A.L.; Tan, C.W.; Lau, K.Y. Optimal sizing of an autonomous photovoltaic/wind/battery/diesel generator microgrid using grasshopper optimization algorithm. Sol. Energy 2019, 188, 685–696. [Google Scholar] [CrossRef]
  39. Al-Shamma’a, A.A.; Hussein Farh, H.M.; Noman, A.M.; Al-Shaalan, A.M.; Alkuhayli, A. Optimal Sizing of a Hybrid Renewable Photovoltaic-Wind System-Based Microgrid Using Harris Hawk Optimizer. Int. J. Photoenergy 2022, 2022, 4825411. [Google Scholar] [CrossRef]
Figure 1. The constructed hybrid renewable energy microgrid.
Sustainability 14 13274 g001
Figure 2. Electrical circuit of the PV panel.
Sustainability 14 13274 g002
Figure 3. V–I and V–P curves of the PV panel.
Sustainability 14 13274 g003
Figure 4. WT power versus wind speed.
Sustainability 14 13274 g004
Figure 5. The crow flight length influence on the global optima (a) f l i ˂ 1 (b) f l i > 1.
Sustainability 14 13274 g005
Figure 6. CSA flowchart.
Sustainability 14 13274 g006
Figure 7. Weekly demand of northeast sector in KSA.
Sustainability 14 13274 g007
Figure 8. Average weekly temperature of the Aljouf region.
Sustainability 14 13274 g008
Figure 9. Average weekly solar radiation of the Aljouf region.
Sustainability 14 13274 g009
Figure 10. Average weekly wind speed of the Aljouf region.
Sustainability 14 13274 g010
Figure 11. The powers generated from PV, WT, battery, DG, and demand obtained via the proposed CSA.
Sustainability 14 13274 g011
Figure 12. Variation in fitness value during iterative process followed in the considered approaches.
Sustainability 14 13274 g012
Figure 13. The power generated from PV, WT, battery, DG, and demand obtained via (a) EHO, (b) MFO, (c) GOA, (d) HHO, and (e) SAO.
Sustainability 14 13274 g013aSustainability 14 13274 g013bSustainability 14 13274 g013c
Figure 14. The produced powers from each generating unit and demand obtained via the proposed CSA in the absence of WT.
Sustainability 14 13274 g014
Figure 15. Variation in fitness value during iterative process followed in the considered approaches in the absence of WT.
Sustainability 14 13274 g015
Figure 16. The power generated from PV, WT, battery, DG, and demand obtained via the proposed CSA in the absence of PV.
Sustainability 14 13274 g016
Figure 17. Variation in fitness value during iterative process followed in the considered approaches in the absence of PV.
Sustainability 14 13274 g017
Table 1. Specifications of the considered components in microgrid.
ComponentParameterValue
PV panelModule NameChsm66 12P/HV-345
Maximum power (Pmp)345 W
Voc46.37 V
Isc9.67 A ± 5%
Vmp37.38 V
Imp9.23 A
Maximum voltageDC 1500 V
Nominal temperature46 °C
Cell TechnologyPoly-Si
WTNominal power4.0 /4.2 MW
V c u t i n 3 m/s
V c u t o u t 22.5 m/s
Re cut-in wind speed20 m/s
Rotor diameter150 m
Swept area17,671 m2
Frequency50/60 Hz
Nominal temperature−20 °C ~+45 °C
BatteryRated Power1 Mwh
Efficiency90%
Normal capacity1600 Ah
Nominal Voltage690 V
Normal charging current200 A
Normal discharging current500 A
Internal Resistance≤1 mΩ
Maximum SOC90%
Minimum SOC10%
DGRated Power70 MW
Armature current3849 A
Armature voltage13,800 V
Field current 766 A
Excited voltage 300 V
Power factor 0.8
InverterTechnical specifications SUN2000-60KTL-HV-D1-001
η I n v 98%
Maximum input voltage 1500 V
Maximum current 22 A
Maximum Isc30 A
Starting voltage 650 V
Nominal input voltage 1080 V
Table 2. Capital cost of the considered components and the economic parameters of the microgrid.
ParameterValue
Photovoltaic panel1066.7 USD/kW
Wind Turbine1250 USD/KW
Battery774.8 USD/kWh
DG952 % USD/kW
Inverter1075 % USD
Project lifetime24
Discount rate8%
Inflation rate of fuel5%
Interest0.13%
O&M cost0.2%
Table 3. The optimal fetched solution via the proposed CSA and others.
OptimizerPVWTADCOE (USD/kWh)LPSP
The proposed CSA16112292130.038830.9574
EHO [37]156432733100.038920.5504
GOA [38]14870386370.039080.5659
HHO [39]12493757570.039570.6131
SOA148662843100.039080.5664
MFO13651055670.039330.60734
Table 4. The optimal results via the proposed CSA and others in the absence of WT.
OptimizerPVADCOE (USD/kWh)LPSP
The proposed CSA170621730.038627840.9999
EHO [37]170622430.038627850.5099
GOA [38]170622810.038627860.5028
HHO [39]170623310.038627860.5028
SOA1706241100.038627880.5028
MFO170622520.038627850.5099
Table 5. The optimal solutions obtained by the proposed CSA and others in the absence of PV.
OptimizerWTADCOE (USD/kWh)LPSP
The proposed CSA27930.045850.9999
EHO [37]34610.045870.9996
GOA [38]57850.049630.9971
HHO [39]57810.049630.9971
SOA36510.045940.9998
MFO30510.045861.0000
Publisher’s Note: MDPI stays neutral with regard to jurisdictional claims in published maps and institutional affiliations.