1. Introduction
According to the United Nations estimations, since 2018, more than 55% of our planet’s inhabitants live in cities; by 2050, this percentage is expected to rise to 68% [
1]. A growing urbanization process is increasing environmental, economic, and social pressures in urban planning [
2], highlighting smart city development’s role in promoting initiatives in terms of circular economy objectives [
3] that can diminish associated negative socio-economic impacts [
4,
5].
All over the world, smart city administrators are confronted with difficult decisions to balance sustainability and smart measures with improved well-being and quality of life of their citizens. Amid rapid advancement in information and communication technologies (i.e., digital intelligence), [
6] pointed out the importance of knowledge (i.e., human intelligence) to support the smart city development process. In another paper considering fifteen cities, the same author [
7] stated that for a successful smart city strategy, it is essential to raise citizens’ awareness and improve their skills with technology. In their attempt to cover the critical aspects of local citizens’ urban life, [
8] provided a conceptual model, using Vienna as a study case, to compare stakeholders’ (citizens’) perceptions related to smart city concept implementation and discourses. We can note here that a massive survey among the citizens of 102 cities showed that, in many cities, the citizens did not feel their needs were adequately satisfied through considerable investment in smart technologies [
9]. More studies [
10,
11,
12,
13,
14] showed that the needs of the citizens are not beneficently considered in smart city project implementations. As a result, how the widely recognized elements of a smart city (i.e., economy, mobility and infrastructures, environment, living, and people) are related to the universality of benefits for people in various national contexts [
15] remains unclear. Moreover, given the limited local budgets, additionally threatened by the COVID-19 pandemic and the war in Ukraine, city administrators needed to carefully set priorities for optimizing projects that are urgently needed and appropriateness for their citizens [
16]. However, currently, there is a lack of scientific findings detailing how to set priorities in the smart city development process accurately considering the needs and preferences of the citizens.
In response to this research gap, our study mainly aimed to analyze the citizens’ perceptions related to the attributes of a smart city and their usefulness in helping city administrators to set priorities to develop it further successfully.
Specifically, we searched for answers related to citizens’ perceptions regarding the attributes of a smart city, followed by an importance–performance analysis to set priorities that could help high-quality smart city development.
Oradea, a smart city with a population of 188,351 residents, located in the north-west part of Romania at about 13 km east of the Hungarian border, is a particularly rich example for a study of this kind. The first report from 2018 related to smart cities in Romania [
17] highlighted that “
Romania’s top public administrations are headed by Oradea, the city with the highest administrative efficiency among the 320 cities in Romania … Oradea has the best capital expenditure performance, with an investment of 1,225 Euros per capita over the last eight years and with an attraction of European funds of 716 Euros per capita” (p. 3). It is of particular interest to note that in 2018, Oradea was situated in second place with 20 projects after Alba-Iulia smart city, with 76 projects [
18]. After three years (i.e., 2021) [
19,
20], Alba-Iulia remains the leader but with a stagnant number of projects. Oradea, with 26 projects, was situated in eighth place in the chart of the first Romanian cities [
21]. Therefore, it is interesting to foster Oradea citizens’ perceptions as keyholders in every phase of smart city development. Moreover, a recent study by [
22] indicated that “
smart city promotional strategies potentially create an illusory sense among the public that shifts their attention away from the project’s associated socio-economic impacts and existing urban realities, including unfulfilled promises” (p. 5). Along with that, different scholars (e.g., [
23]) are increasingly considering city inhabitants’ preferences and perceptions to improve the functioning of cities to support sustainable economic development, as well as finding new ways to provide a higher quality of life. In short, it is hoped that our investigation will help Oradea city administrators and other city governments shape future smart and sustainable city development to meet citizens’ needs and preferences and improve their well-being and quality of life.
2. Literature Review
2.1. Smart City and Citizens’ Perspective
In the middle of the largest wave of urban growth in history, accompanied by rapid technological advancement in urban planning, the smart city topic attracted considerable interest. The
smart city concept with all its various precursors—“eco cities “ [
24], “intelligent cities “ [
25], “sustainable cities“ [
26], “compact cities“ [
27], “liveable cities“ [
28], “digital cities“ [
29], “innovative cities“ [
30], “biocities“ [
31], and “green cities“ [
32]—historically reflects the influential impact of information and communication technology (ICT) [
12,
25,
26,
33,
34,
35,
36,
37,
38,
39,
40,
41,
42,
43,
44,
45,
46,
47,
48,
49,
50,
51,
52,
53,
54,
55,
56,
57,
58,
59,
60,
61], followed by sustainability [
12,
20,
21,
45,
46,
47,
48,
49,
50,
55,
56,
57,
58,
59,
60,
61]. In summary, the smart city concept has been evolutionarily enriched from two approaches. On the one hand, the technological approach focuses on “technological means” related to the power of ICT systems to improve the city’s functioning (e.g., [
33]), and on the other hand, the sustainable approach focuses on “desired ends” (e. g., [
34]). In the light of reviewed literature, it is obvious it tends to focus on the technological aspects, a trend mainly sustained by American technological companies, as [
26] highlighted.
Nevertheless, over time, different scientists have driven the further development of the smart city concept closer to the “desired ends” such as urban services that serve citizens’ day-to-day needs (e.g., [
34,
57,
62]). As a result, some of them explicitly mentioned people-related aspects in their research [
26,
51,
52,
55,
56,
57,
58,
59,
60,
61]. A findings overview related to technology, sustainability, and people in smart city literature is presented in
Table 1.
The large implementation of smart city projects worldwide raises research to assess the citizens’ actual and future physical and psychological needs related to information organization, identification, and interpretation of their living environment [
4,
7,
34,
43,
50,
57]. The people approach was successfully tapered by the European Commission, which pointed out that
“a smart city aims at the well-being of its inhabitants, businesses, visitors, organizations, and administrators by offering digitally enabled services that contribute to a better quality of life [
63]
”. In line with this, Giffinger et al. [
57] presented an early seminal contribution from a previous study [
58]. Their comprehensive description understands the smart city as a joining together of the following elements: “Governance”, “Economy”, “Environment”, “Mobility”, “People”, and “Living” articulated by ICT and technology tools as Morozov and Bria [
45] pointed out. These fundamental elements affecting cities in the European region were adopted by the Commission in 2011 and confirmed by the European Parliament in its 2014 Mapping Smart City Report [
63]. According to the European Commision, “
recognizing the growing and indeed critical importance of technologies (especially ICT) for improving a city’s competitiveness, a smart has to ensure a more sustainable future, across networks of people, businesses, technologies, infrastructures, consumption, energy and spaces” [
64]. In light of their literature review, Winkowska [
65] concluded that a smart city should comply with Smart Economy, Smart Mobility, Smart Governance, Smart Living, Smart Environment, and Smart People. Nowadays, the idea of being “smart” refers not only to technologies that are intelligent by their definition but also to people that use user-friendly technologies in different smart city activities; these operations create a smart environment. In
Table 2, we summarize some characteristics of a smart city combined with Giffinger et al.’s works [
57,
58] and the 2014 European Parliament Mapping Smart City Report [
63].
The large acceptance of the above-mentioned six elements or “verticals” does not ensure either sustainable economic resilience or a higher quality of citizens’ life. Different studies have emphasized that using citizens’ perspectives can successfully contribute to the better future development of a smart city [
8,
9,
10,
16,
22,
23,
46]. Furthermore, the scientific literature provided a conceptual model, using Vienna as a study case [
8], and stated that smart city initiatives are developed through sector-based measures and projects in one or a few specific areas [
10,
23,
26,
34]. Over the years, different sets of indicators have been recommended for the analysis of smart cities’ development process [
66,
67,
68]. Despite this, the existing literature has many problems in making them practical for smart city managers. Thus, it is time to try, on the one hand, to find empirical evidence about citizens’ perceptions regarding their smart city development and, on the other hand, to provide a simple and efficient tool to aid city administrators in making better decisions [
59]. All these outcomes would provide indications that are cost-effective, people-centric, and locally specific. However, despite this usefulness, empirical studies focusing on operationalizing citizens’ perceptions related to the characteristics of a smart city to help city administrators to set priorities remain relatively scarce [
66,
67,
68].
2.2. The Current State of Smart Cities in Romania
In Romania, the Romanian Smart City Association (ARSC) [
17] has existed since 2016 (ARSC, 2016–2022) and has over 280 members: town halls, county councils, universities, and companies. The purpose of this association is the development of creative-intelligent communities in Romania. The declared objectives of the ARSC are promoting smart city concepts among decision makers, strengthening Romanian legislation for better development of urban centers, promoting the interests of local communities with central bodies, creating the necessary channels for presenting the products and services of the smart city industry, and facilitating access to technology and expertise of less developed communities [
69,
70]. In 2019, the ARSC launched the “Romania 2030 Charter”, which aims to encourage local administration on the road to the digitization and adoption of new technologies. Another key document in Romania’s digitization efforts is the “X-ray of Smart City Projects in Romania”, a report produced and presented annually by the consulting firm Vegacomp Consulting. Vegacomp Consulting was founded in 2004 and publishes an annual report on smart city projects in Romania. In 2021, it reached the fifth edition of the Radiography of Smart City projects in Romania [
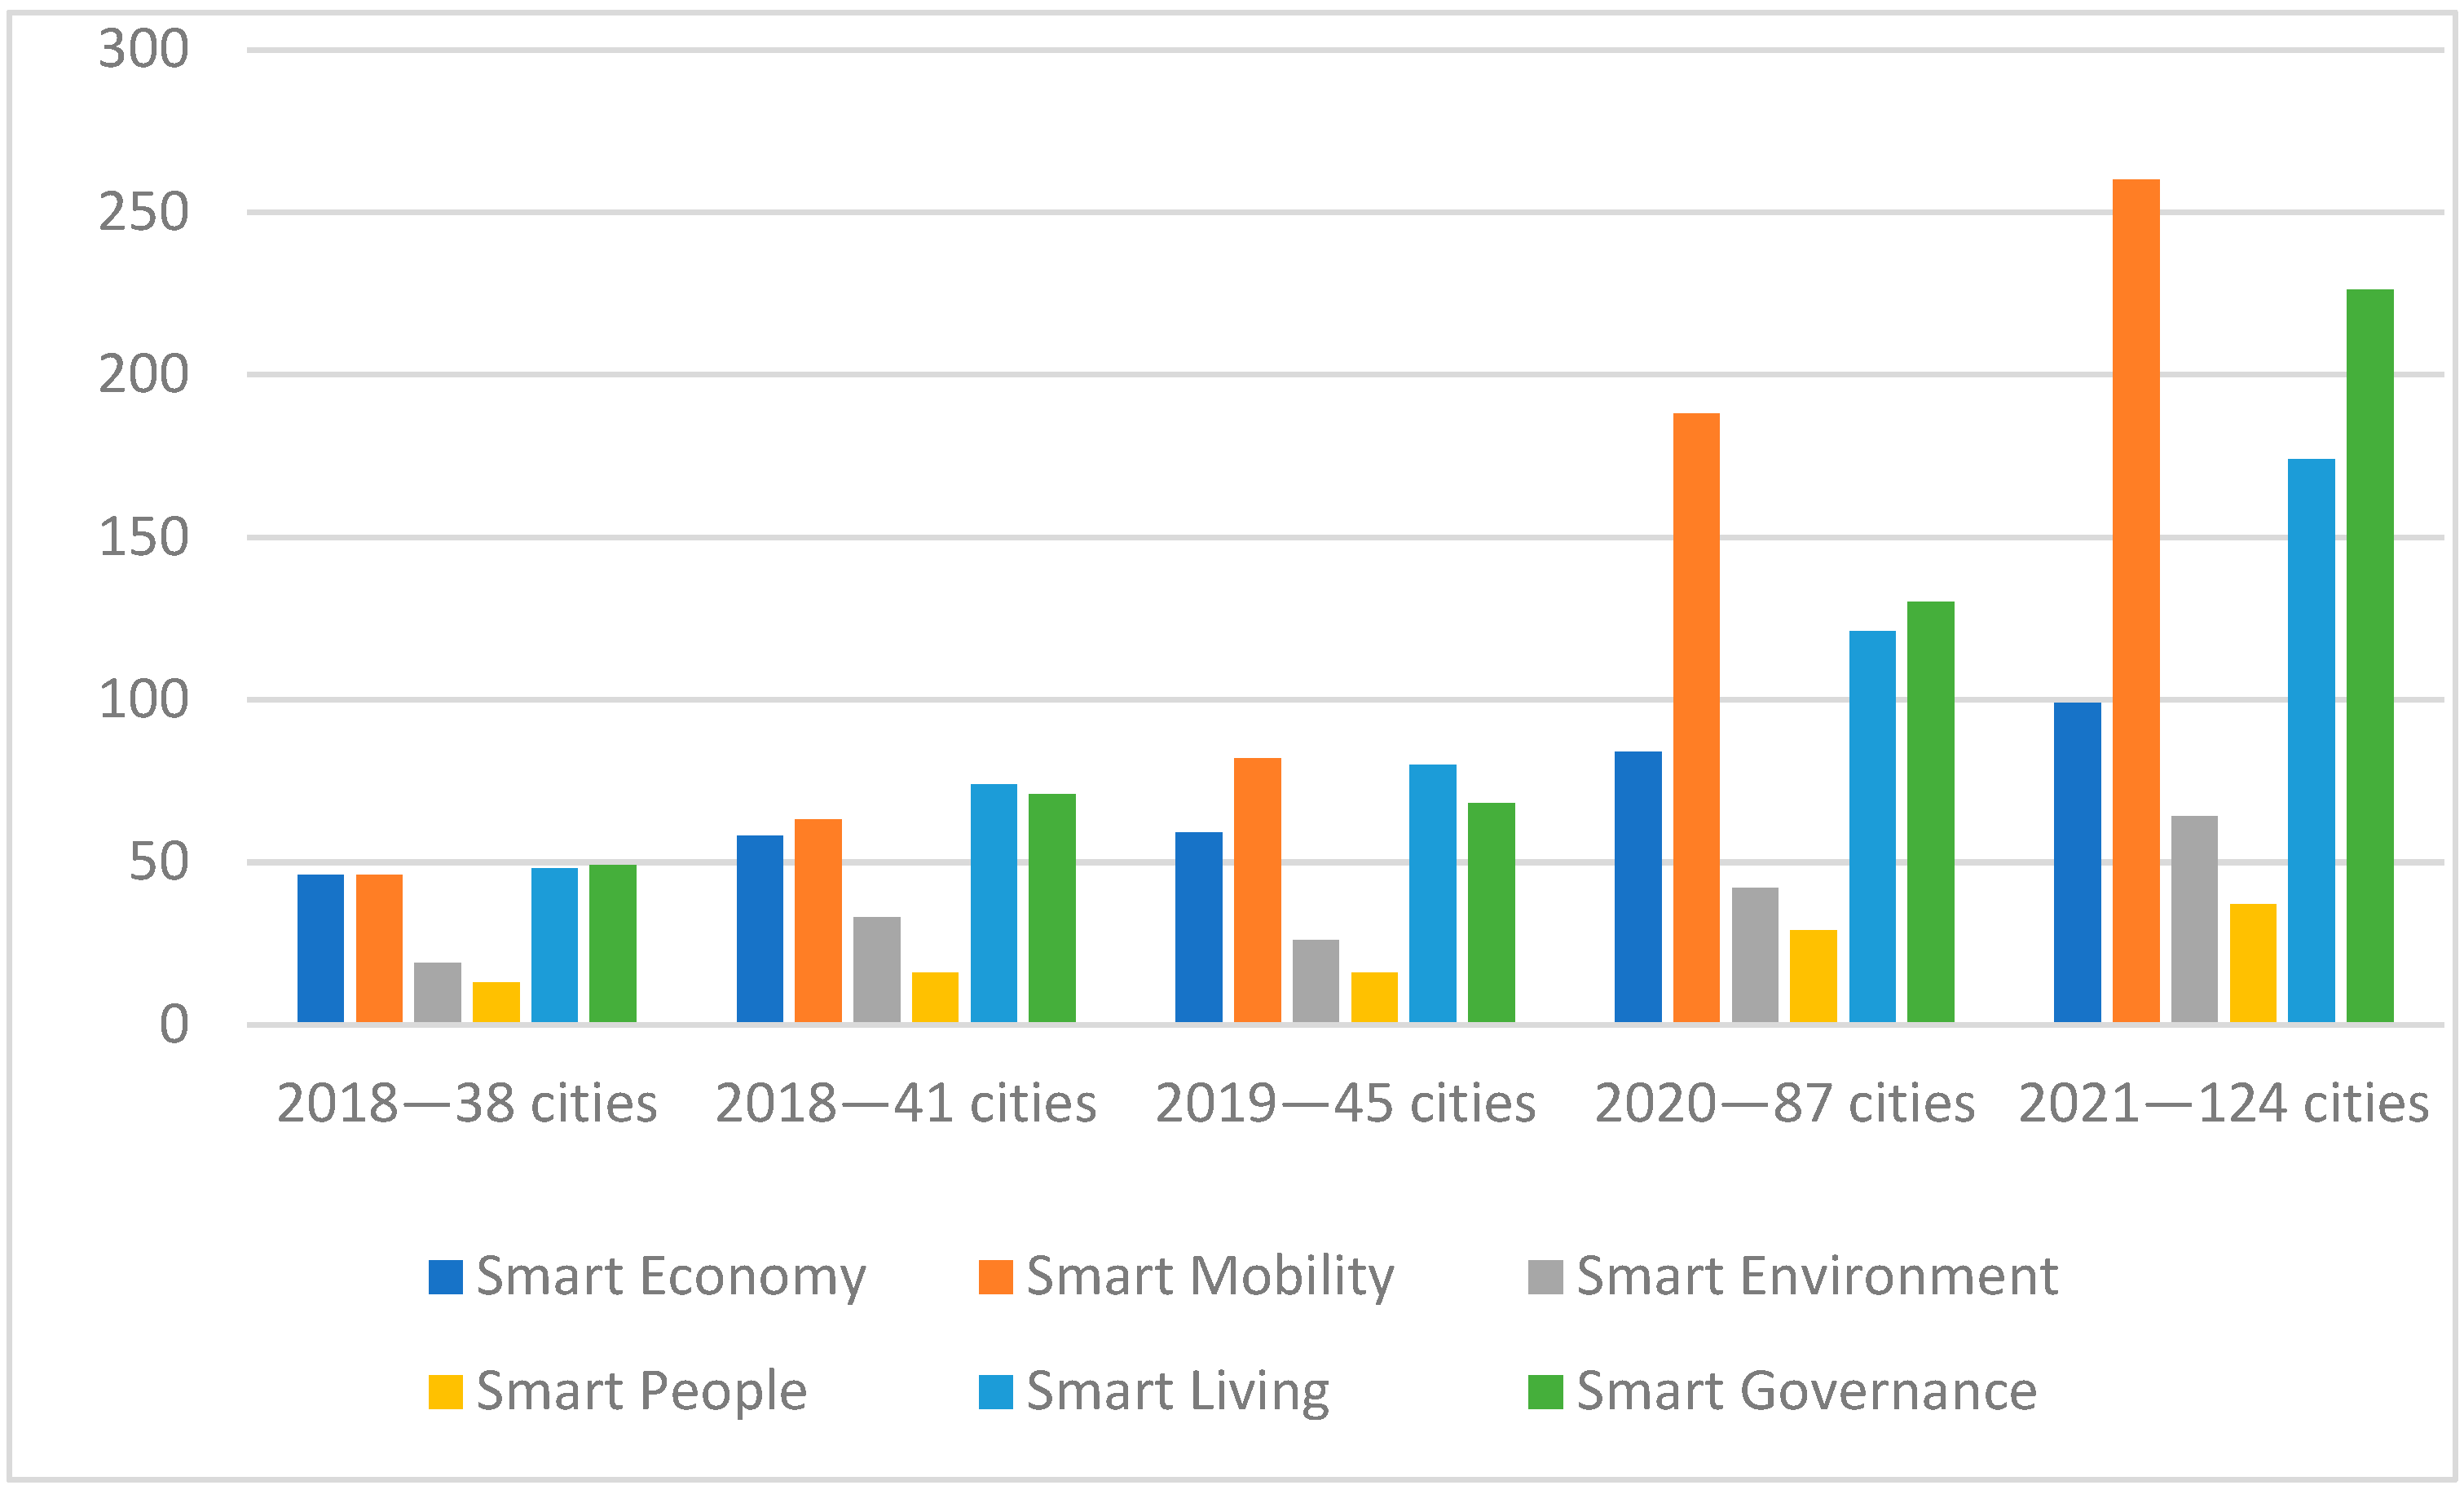
21]. In 2020, the first standard for smart cities appeared, published in Romanian, namely “ASRO: SR ISO 37120. Sustainable cities and territorial communities. Indicators for urban services and quality of life”. In the Annual Reports presented by Vegacomp Consulting (the “X-ray of Smart City Projects in Romania”), we can see an increase in interest in projects from the six smart verticals (Economy, Environment, Mobility, Living, People, and Governance) both by increasing the number of projects and by increasing the number of cities involved (
Figure 1). In 2018, there was a pilot report followed by the first X-ray of Smart City Projects in Romania, and in 2019, 2020, and 2021, a report per year was made.
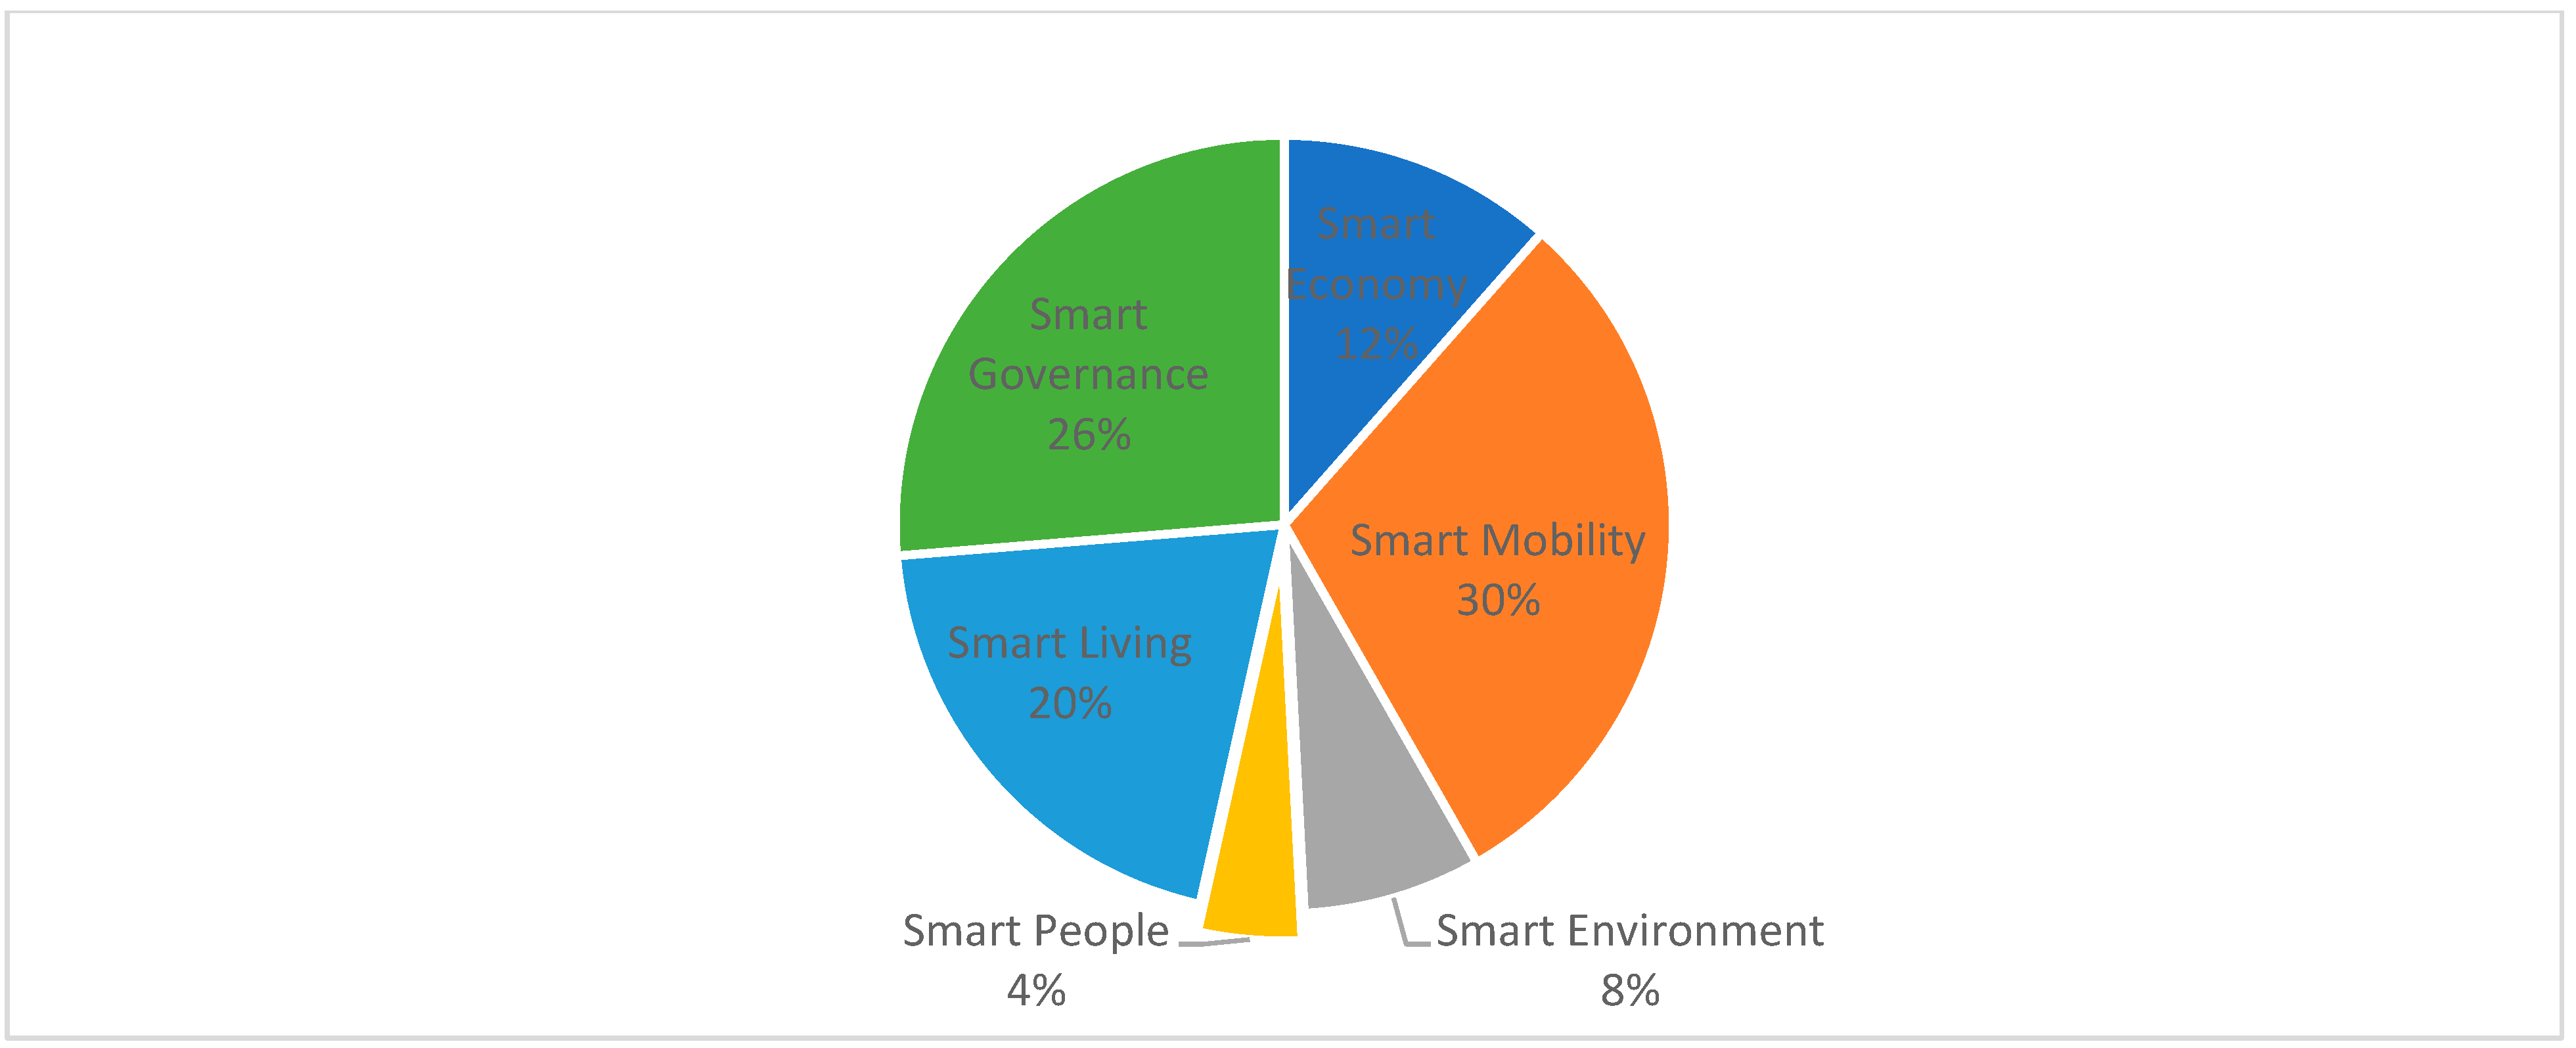
The verticals with the most projects at the level of 2021 are Smart Mobility and Smart Governance, and the verticals with the fewest projects are Smart People and Smart Environment (
Figure 2). From the Smart Mobility category, the completed projects are divided into three categories, by volume in this order: electric charging stations, traffic management and parking optimizations. In the Smart Governance category, the applied projects were, by volume in this order: document management and management, IT systems reporting and analysis. From the Smart Living category, the applied projects were, by volume in this order: public Wi-Fi, including public transport, intelligent video monitoring and surveillance, and tourism and promotion. The projects implemented in the Smart Economy vertical fall into the following categories: utilities management and dispatch, intelligent promotion of enterprises, and intelligent public lighting. Unfortunately, projects in the Smart People and Smart Environment verticals maintain their modest positions in terms of number. The projects in the Smart Environment vertical are distributed in order of number in these categories: waste management, renewable energy, and monitoring of environmental parameters. Despite the COVID-19 pandemic, Smart People has only 35 projects in 2021 in areas such as: education, information, and city health.
In 2021 compared to 2018, the number of projects increased to 860 (
Table 3) from 216, and the number of cities with smart projects increased to 124 from 38. The cities with minimum ten projects are presented in
Figure 3. It should be appreciated that the average value per project also increased by over EUR 600, from EUR 30 million in 2018 to EUR 120 million in 2021.
To be analyzed is the evolution in the smart direction of Romanian cities, regardless of their size. We can observe in
Figure 3 differing developments in the last four years for cities with more than ten projects per year (planned, ongoing, or completed).
Some cities started earlier on the road to smart such as Targu Mures, introduced on the smart city map in Romania by IBM and Visa in 2010, Alba-Iulia, introduced by Siemens in 2015, and Bucharest—sector 4 introduced through the collaboration between Telekom Romania and CISCO also in 2015. Other cities had a good start, but along the way, they declined. The most notable case in Romania is that of the smart city of Oradea, which lost six positions in just four years. In first place in 2021, according to the number of projects, is Alba-Iulia, which has maintained this position since entering the Romanian smart city market. Oradea is in 8th place with 26 projects, distributed as follows: Smart Mobility (9), Smart Living (10), Smart Governance (5), Smart Environment (1), and Smart Economy (1).
In the current literature, we found papers that assessed the insertion, evolution, and implementation of the smart city concept in Romanian cities (e.g., [
70]). However, research including the needs and preferences of the citizens seems to be missing in the literature.
2.3. Attributes/activities of a Smart City from Citizens’ Perspective
Capturing and analyzing citizens’ preferences for the attributes/activities of a smart city could help drive up projects’ rates of acceptance and consequently move further the city development. The need theory of human behavior has given rise to research that considers the way in which urban consideration fits peoples’ day-to-day needs [
15,
24,
41]. However, studies that discuss attributes/activities of a smart city from a citizens’ perspective are especially rare. By adopting both peer-reviewed literature (e.g., [
26,
34,
44,
57,
62]) and website literature that have the term “smart city” in their name and the publications related to “smart city” and “Romania” existing in Romanian and English searched on “Google” and “Google academic”, we created a framework to explore attributes/activities of a smart city from a citizen’s perspective in consonance with the widely accepted six pillars, as can be seen in
Table 4.
The literature review provides support for the importance of attributes/activities of a smart city on its performance [
7,
9,
24,
34]. Yet, even though the people of smart cities are declared key stakeholders, they are often treated as peripheral [
10,
11,
13]. Moreover, citizens’ perceptions are analyzed with common instruments/methods, e.g., [
22], and results are limited in their application. Exceptions include, for example, the work of Ji et al. [
23], but they did not further set priorities for city managers. Hence, by investigating citizens’ needs and preferences for smart cities and using a simple and efficient instrument to prioritize, city administrators could advance smart city development. In other words, by analyzing citizens’ perceptions with a proper instrument, such as the importance–performance analysis (IPA), city administrators could increase awareness of the role of citizens in better managing a smart city. As it is well-known, IPA is widely used as a managerial tool that helps practitioners to evaluate their competitiveness potential and to set priorities. Moreover, its efficacy was historically proved by the fact that the matrix developed by Martilla and James (1977) had numerous variants and solutions to increase precision and relevance over time.
To sum up the literature review, the current research explores the citizens’ perceptions regarding the attributes of a smart city using IPA to prioritize them by seeking detailed answers to the following research questions:
RQ1: What are the citizens’ perceptions regarding the attributes of a smart city, and how do they vary across the thematic content analysis?
RQ2: What are the designated attributes of a smart city that could be expected to advance smart city development?
3. Research Methodology
A survey-based empirical exploratory study consisting of three stages was conducted to investigate Oradea citizens’ perceptions about smart city attributes.
3.1. Research Design
To answer our research questions, we shaped a questionnaire consisting of three parts and a total of 57 questions. The first part included questions regarding “Authorization”, or the respondent’s agreement to participate in the study. The second part aimed at the collection of socio-demographic data of the respondents (gender, age, last school graduated) and the global perception of Oradea (how satisfied they are with Oradea in general, what they appreciate and what they disapprove about Oradea—open questions). The third part of our questionnaire contained twenty-five questions regarding the attributes’ importance, followed by twenty-five questions regarding the same attributes’ (mentioned in
Table 4) performance. The questionnaire items of the third part were responded to using an attached 5-point Likert scale, ranging from 1 = unimportant to 5 = very important for attribute importance and from 1 = very poor to 5 = very good for attribute performance.
The questionnaires, online with assistance related to the type of completion that was answered and paper format administered directly through the operator, were distributed in May and July 2022, employing the snowball sampling method. We gathered the responses of a total of 209 participants. From these, 173 participants (82.77%) responded to all questions (with the help of an operator of 115 questionnaires and the online assisted application of 58 questionnaires). The demographic characteristics of the 173 participants were as follows: 107 women, 66 men; the age of the respondents was as follows: 18–30 years (53), 31–40 years (49), 41–50 years (51), 51–60 years (17), over 60 years (3); most are university graduates (85), postgraduate studies (60), high school graduates (25), secondary school (0), and other (3). More women and individuals with a bachelor’s degree than the whole population of Oradea were sampled, which can be explained by these two population groups being more readily available. We were encouraged to consider that more answers would not have radically changed the results due to the fact that between the answers recorded in Excel (in the order of completing the questionnaires), no big variations are observed, and the averages obtained are not made up of extremes. Moreover, as Norman [
71] pointed out, “parametric statistics can be used with Likert data, with small sample sizes, with unequal variances, and with non-normal distributions, with no fear of coming to the wrong conclusion” (p. 631).
3.2. Analysis Methods
The data analysis was carried out with recognized research methods. Data internal consistency of tests was examined by Cronbach’s alpha resulting 0.94 value, which is an excellent value [
72]. Specifically, to analyze the answers to the open questions related to citizens’ perceptions of how satisfied they are with Oradea in general, what they appreciate, and what they dislike about Oradea, we used open questions included in the questionnaire and the Atlas.ti 22 program. This program is widely used to assist the analysis of qualitative data and was found as a promising research instrument for conducting content analysis [
73]. For the application of the Atas.ti 22 program, the answers to the opened questions were translated, the connecting words were removed, and the roots of the words with the highest frequency were used as codes.
The importance–performance analysis (IPA) was used to prioritize the importance of the twenty-five attributes mentioned above on the six smart city pillars and questions regarding Oradea’s performance. The analyzed attributes/activities (see
Table 4) were distributed in the IPA (
Figure 4).
For the collected data, considering the minuses of the Likert scale and the fact that “modeling with fuzzy sets ensures greater elasticity compared to the classic Likert scale”, we used the fuzzy method considering that the input data, i.e., performance and importance, are fuzzy triangular numbers [
74].
4. Data Analysis and Results
The data analysis shows that, in the 2018–2021 interval, the “smart city” concept in Romania gained considerable ground. The number of smart city projects increased from 216 to 860, and the number of Romanian cities where these projects are implemented increased from 38 to 124. The average value per project increased from EUR 30 million to EUR 120 million. Therefore, we can deduce that the implementation of the smart city concept in Romania has expanded in the above-mentioned period. The evolution of smart city projects on the six verticals evolved differently in the analyzed time interval. Verticals/pillars Smart Economy, Smart Mobility, Smart People, Smart Living, and Smart Governance have registered an increasing trend. The verticals with the most projects in 2021 were: Smart Mobility (260), followed by Smart Governance (226), Smart Living (174), Smart Economy (99), and Smart People (37). We note the small number of projects in the Smart People vertical, despite the COVID-19 pandemic and the attention paid to health. A small number of projects are also registered in the Smart Environment vertical (64), and the evolution in the analyzed time interval was variable, with increases and decreases. In 2018, the projects on four verticals (Smart Economy, Smart Mobility, Smart Governance, Smart Living) were at relatively equal levels, but in the 2018–2021 interval, they had different growth rates. In 2021 compared to 2018, the highest growth rate was recorded by Smart Mobility (5.65), followed by Smart Governance (4.61), and Smart Living (3.62). Smart Environment and Smart People verticals held more modest positions in 2018 and maintained low growth rates of 3.36 and 2.84, respectively.
We chose the city of Oradea to be studied because, in 2018, it occupied the first position at the national level (out of 320 cities) in terms of the efficiency of its administration, that is, the projects in the Smart Governance vertical. The public administration in Oradea has made considerable progress in recent years toward the implementation of smart projects. Oradea was in second place in 2018 in terms of the number of smart projects, but in 2021, it dropped to the eighth position, ranking even after smaller cities such as Alba-Iulia, Arad, and Sibiu. Among medium-sized cities, Oradea is in fourth place with 26 smart city projects, distributed across verticals as follows: Smart Governance (5), Smart Economy (1), Smart Mobility (9), Smart People (0), Smart Living (10), and Smart Environment (1).
4.1. The Citizens’ Perceptions Regarding the Attributes of Oradea as a Smart City
Two open questions related to the positive and negative characteristics of the city and a closed question with a 5-point Likert scale regarding the global impression of Oradea as a city of residence were introduced in the applied questionnaire. On a 5-point Likert scale, an average of 4.15 points was obtained, which shows a favorable overall perception of Oradea as a smart city. The open questions highlighted what Oradea residents appreciate and what they do not appreciate about the city (
Table 5).
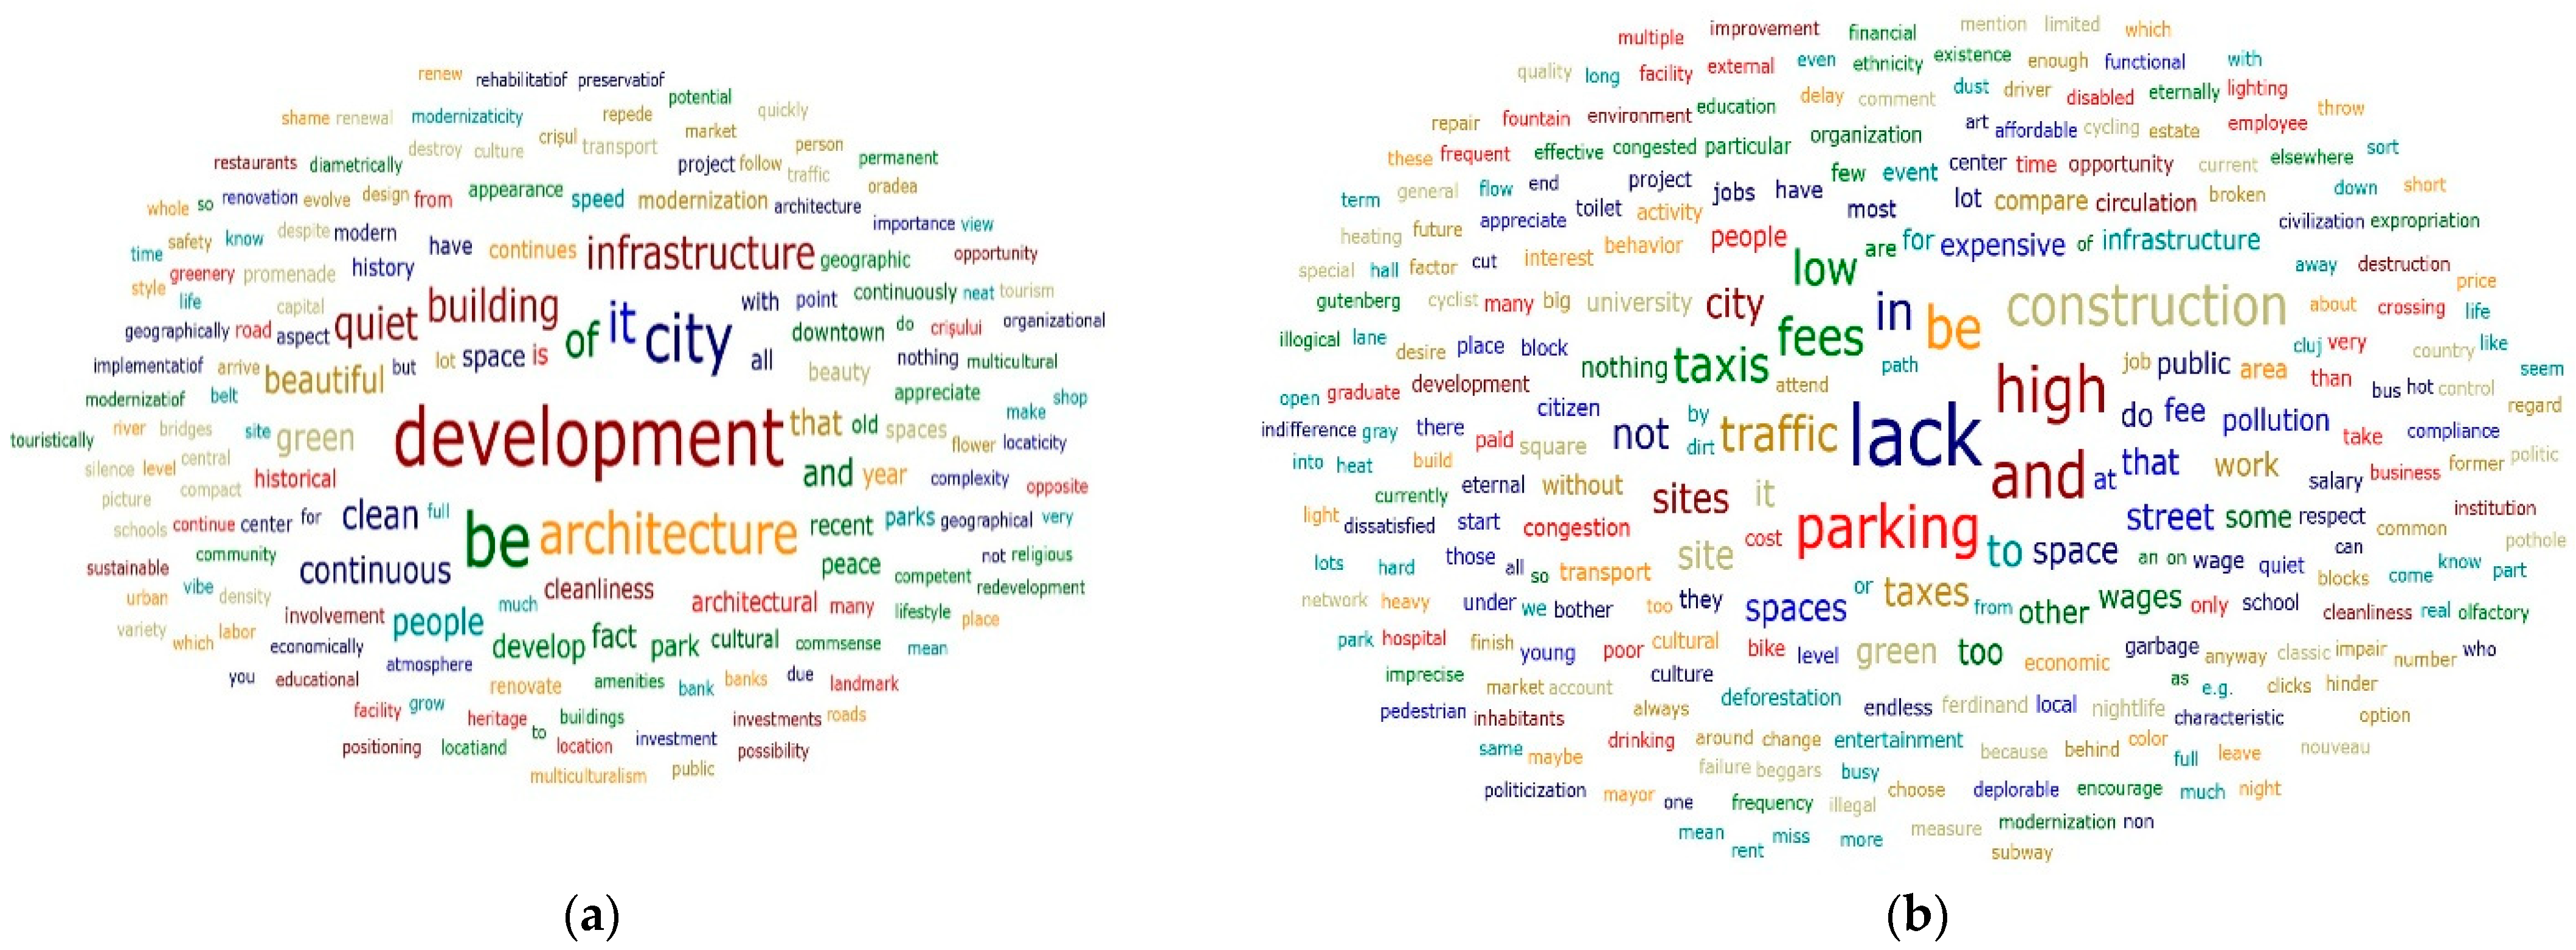
The grouping of answers by representation with Atlas.ti 22 showed the most obvious aspects mentioned by Oradea residents (
Figure 5a,b).
4.2. The Designated Attributes of Oradea as a Smart City That Could be Expected to Advance Future Development
To fitting well the attributes of a smart city in the IPA matrix, we used the fuzzy method considering that attributes’ performance and importance are fuzzy triangular numbers [
74]. The followed steps were:
Step 1: Assign fuzzy triangular numbers to the responses displayed on the Likert scale.
The proposed method involves associating responses 1, 2, 3, 4, and 5 on the Likert scale with fuzzy triangular numbers (
Table 6). The choice of fuzzy numbers agrees, to a greater extent, with the Likert scale, with equidistant values, and on the other hand, the Good response regarding the performance is drastically penalized compared to Very Good.
Step 2: Calculate the importance and performance of attributes as triangular fuzzy numbers for Oradea.
A triangular fuzzy number is a fuzzy set on the set of real numbers given by its membership function after [
74]:
where:
,
a ≤
b ≤
c. If
a =
b or/and
b =
c then the membership function
μ is adapted in an obvious way. In fact, if
a =
b =
c =
k then we obtain the real number
k.
The real numbers
a,
b, and
c can be viewed as the smallest possible value, the most promising value, and the largest possible value that describe a fuzzy quantity, respectively [
74,
75,
76,
77].
Usually, a triangular fuzzy number as above is represented as a triple (
a,
b,
c). In addition, difference and multiplication under a positive scalar are defined by:
Between the most common approaches to convert triangular fuzzy numbers into real numbers is the expected value (EV) [
75,
76] defined by:
The calculation of triangular fuzzy numbers (moderate choice) related to importance and performance was performed in Excel, as well as their defuzzification. The results obtained are in
Table 7.
Step 3: Representation of the Importance–Performance Matrix.
Depending on the distribution of the attributes in the quadrants, the measures to be taken to increase the satisfaction of Oradea residents regarding the smart quality of the city of Oradea are formulated.
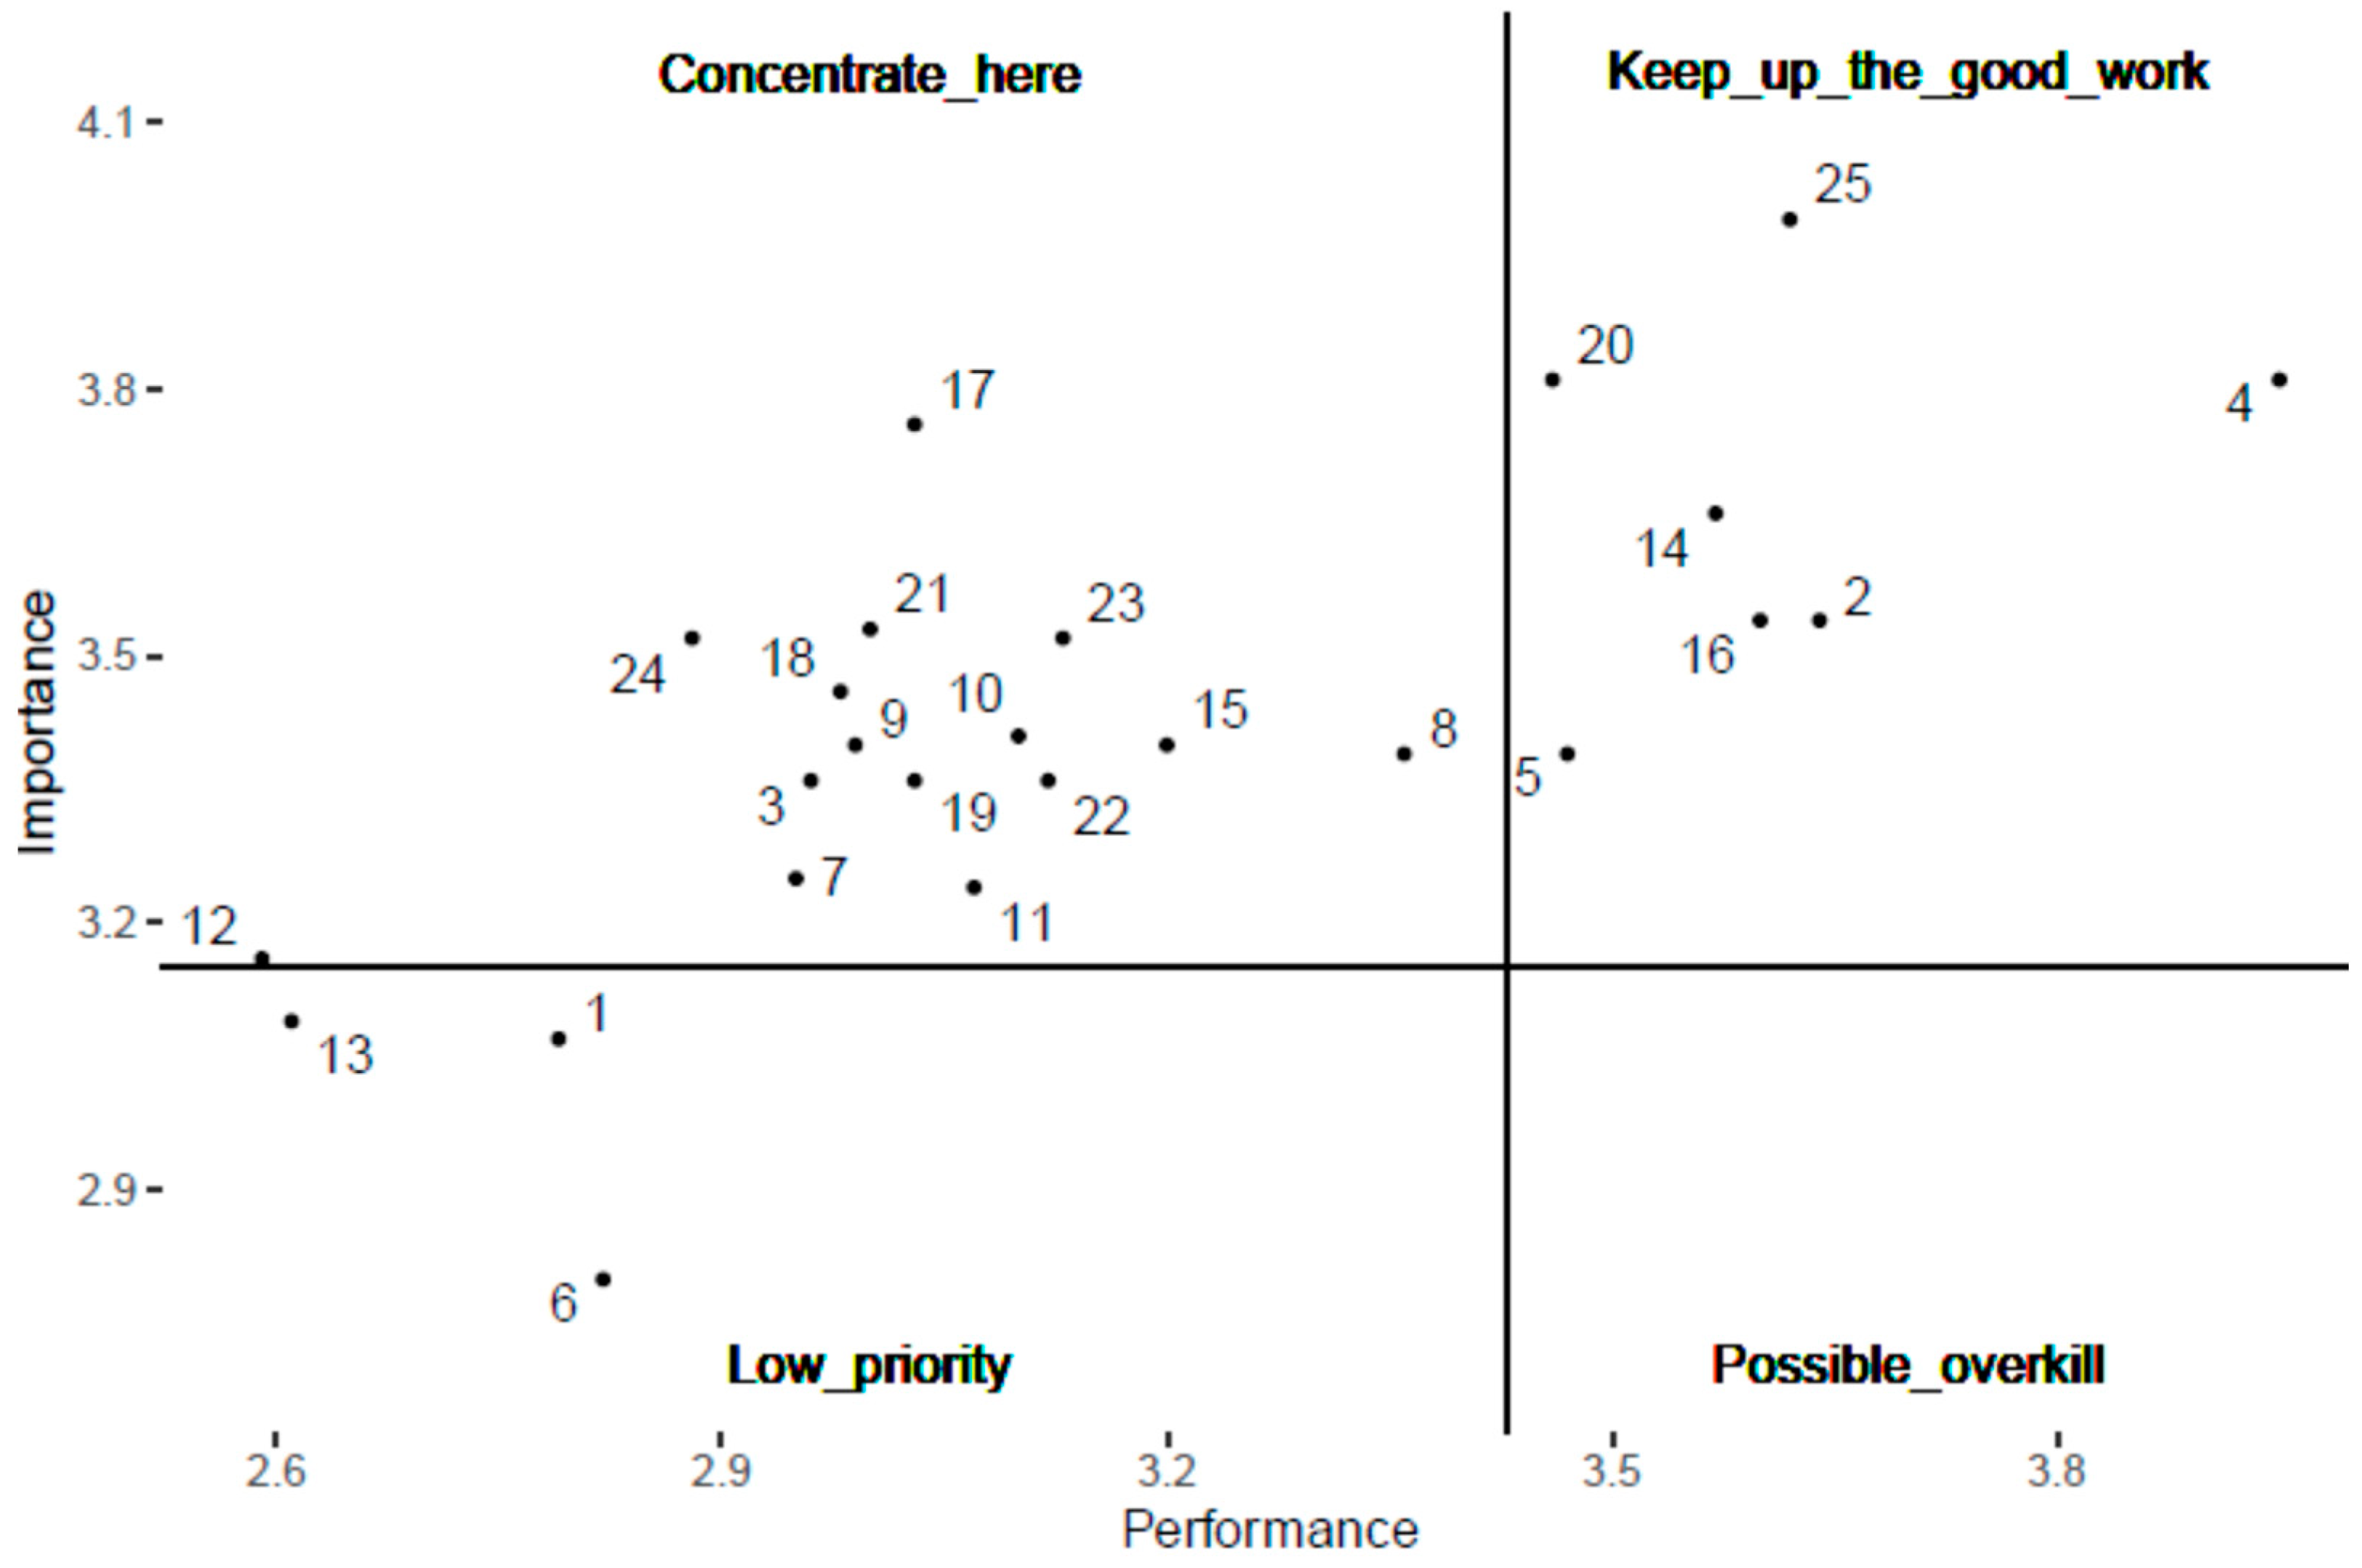
The construction of the IPA allowed the identification of recommended measures for each analyzed attribute, respectively, A1–A25 from
Table 3 (
Figure 6). Among the 25 attributes: (1) 7 attributes are found in the “Keep up the good work” quadrant, which means maintaining the current level; (2) 15 attributes are in the “Concentrate here” quadrant, which implies acting on them, as they are below the citizens’ expectations; and (3) 3 attributes are in the “Low priority” quadrant, meaning they deserve little attention. It should be noted that no attribute should be eliminated, from the citizens’ perspective.
In short, we could appreciate that the residents of Oradea support the city’s smart activities.
5. Discussion
In general terms, we found that most of the Oradea citizens we surveyed positively perceive Oradea as a smart city. The citizens’ responses to the open questions are considered in the framework of the theoretical reflection of content analysis, associated with the software tool Atlas.ti 22 (
Table 5 and
Figure 5a and
Figure 5b), showing the satisfactions and dissatisfactions of the residents of Oradea about the city; the satisfactions far outweighed the dissatisfactions. Therefore, this is the first answer to
RQ1: What are the citizens’ perceptions regarding the attributes of a smart city, and how do they vary across the thematic content analysis? Using this method, we can notice that the citizens of Oradea appreciate the city administrators’ efforts toward restoring historical buildings and transforming the city into a tourist destination. The respondents are proud of the “development” of the city, the “architecture”, the “beauty”, the “urban green spaces”, etc. The introduction of online public services and the possibility of online trading with economic operators are also appreciated. On the opposite end are situated transport, traffic, and pollution services, although considerable efforts have been made in recent years. These findings comply with a previous study that evaluated the perception of quality of life in the city of Curitiba in Southern Brazil [
4] and called for a better decision-making process for smart cities in conjunction with the quality of life and their effects on citizens. One explanation could be the congestion and traffic disturbance due to the many construction sites existing simultaneously in the city. We can evaluate it as a temporary and inherent problem of the modernization and development of the city. Moreover, Oradea citizens are perhaps unusually aware of the advantages of a smart city and expect their well-being and quality of life to improve if they live there [
78]. A more consistent answer to
RQ1 can be provided if the IPA method is used. Accordingly, the smart direction of the city of Oradea is supported by citizens who gave an above-average score regarding their satisfaction with Oradea, which shows the citizens’ consideration of the efforts to transform Oradea into a smart city. This finding is consistent with the remarks of other empirical studies [
79,
80,
81] that suggest a possible trend. However, the IPA showed that none of the evaluated Oradea smart city attributes were classified as “Possible overkill.”
Specifically relevant is that using the IPA method makes answers to the research questions more refined. As a result, a detailed answer can be offered to
RQ2: What are the designated attributes of a smart city that could be expected to advance smart city development? According to IPA, the most appreciated attributes and how Oradea performs regarding them, i.e., the designated attributes of a smart city that could be expected to advance future development (“Keep the good work” quadrant), are
A2 Electronic public services (email response, online tax payment, online public services); A4 Possibility to order/buy/pay online; A5 The existence of services based on information and communication technology; A14 Renovation of buildings and facilities, green buildings, urban ecological planning; A16 Electronic urban services such as street lighting; A20 Access to information regardless of age or ethnicity, and A25 Opening the city to tourists through facilities supported by information and communication technology. Our IPA analysis also identifies those smart city attributes of Oradea on which the local authorities should focus from the citizens’ perspective (“Concentrate here” quadrant). This category included 15 attributes/activities: four from Smart Mobility (all), three from Smart People, three from Smart Environment, three from Smart Living, one from Smart Economy, and one from Smart Governance. The activities are from all six verticals, but it is evident that some have more problems than others: Smart Mobility, Smart People, Smart Living, and Smart Environment. We note that all Smart Mobility activities (A7–A11) require increased performance, although Oradea has nine Smart Mobility projects out of the 26 existing in 2021. Smart Mobility remains a sensitive issue for Oradea, reinforced by the criticism from the free comments on the questionnaire through “traffic” and “parking” in
Table 4. Moreover, all activities from Smart People require increased performance (A18–A21), with Oradea having zero projects in this vertical. The related fifteen attributes/activities (
A3, A7, A8, A9, A10, A11, A12, A15, A17, A18, A19, A21, A22, A23, A24) require a concentration of efforts to increase performance at the level of Oradea municipality. The idea that Oradea citizens look to attributes primarily to meet existence is connected to [
19] findings. The respondents who expressed that smart city attributes are conducive to fulfilling concrete needs outnumbered those who saw them as conducive to meeting the abstract need category, such as smart governance. IPA analysis of Oradea smart city citizens’ evaluation reveals the smart city attributes to which city administrators should pay great attention. Therefore, city administrators should preferentially put smart city resources into strengthening attributes with the highest weight on performance. For example, they should be taking into account the following attributes ranked by IPA analysis in descending order:
A24 Active cultural life; A23 Healthy life supported by information and communication technology; A22 Improved lifestyle based on information and communication technology; A21 Participation of the population in public decisions with the help of information and communication technology; A19 Jobs based on information and communication technology. More resources put into these attributes, more benefits for a smart city. As a result, allocating limited resources to the attributes belonging to the high-growth smart city performance will be most effective for city management.
Finally, decisions related to smart city development appear to be better made using a mixed approach that encircles both the quantitative and the qualitative aspects of phenomena and processes. This approach adds to the economic aspects—social, political, cultural, environmental, and human aspects. Moreover, it explains the complex combination of reasons for choosing a particular decision that would enhance smart city development. For example, regarding attribute A19 Jobs based on information and communication technology, considering that the dissatisfaction of the Oradea respondents can also be found in the free comments through criticism of “low wages” and “jobs” (
Table 5), city managers can choose to prioritize this attribute to accelerate smart city development.
6. Conclusions and Implications
The connection between smart cities’ development and attributes or characteristics improvement requires city administrators to have a clear, detailed understanding of citizens’ perceptions. Taking Oradea as a case study, we analyzed 173 citizens’ responses regarding their perceptions related to the attributes of Oradea as a smart city to help city administrators to set priorities to develop it further successfully. We found that most respondents appreciated the city administrators’ effort to transform Oradea into a smart city. The citizens’ responses were in the first phase considered in the framework of the theoretical reflection of content analysis, associated with the software tool Atlas.ti 22. In the second phase, our IPA analysis identified three sets of attributes, i.e., Concentrate here, Keep the good work, and Low priority, ranked by their contribution to smart city performance. We advocate for a hybrid approach that encircles a quantitative and qualitative analysis and improves the decision-making process. For example, the Concentrate category included 15 attributes/activities, ranked by IPA analysis in descending order. On this basis, one can list, for example, the most important five attributes as follows: Active cultural life; Healthy life supported by information and communication technology; Improved lifestyle based on information and communication technology; Participation of the population in public decisions with the help of information and communication technology; Jobs based on information and communication technology. Considering that the qualitative analyses made with the software tool Atlas.ti 22 showed that citizens’ dissatisfaction is linked to “low wages” and “jobs”, city managers can choose to prioritize Jobs based on information and communication technology to accelerate smart city development. This choice adds, on the one hand, citizens’ preferences and, accordingly, their support. On the other hand, the choice mentioned above enclosed the city administrators’ rationality in evaluating different alternatives that are often very close in performance scores.
The present research brings valuable insight into the strategic decision making related to smart city development, which can serve academics and practitioners. To the best of our knowledge, our questioning is the first evidence-based research on the citizens’ perceptions of the attributes of a smart city using a mixed Atlas.ti 22–IPA approach. Previous empirical studies investigating smart cities’ attributes did not go further in linking citizens’ perceptions with ranking priorities for city administrators. Consequently, our study helps local governments’ decision making on smart city development in a people-centric and locally specific manner. It complements existing literature on operationalizing the citizens’ perception of sustainable and smart city development. However, at least two limitations should be noticed. The first is that data collection was conducted via snowball sampling, and the demographic configuration of the sample was not totally matched to that of the overall Oradea population. We hope that with the city administrators’ support, our future study will be conducted via random sampling techniques to be in no doubt with the sample. Second, some personal determinants influencing citizens’ perceptions about a smart city were not considered in the present questionnaire formula. Nonetheless, it would be interesting to have questionnaire items related to marital status or the number of children.
Meanwhile, due to its easy application, using the IPA method combined with the Atlass.ti 22 program has important practical implications. Our results provide evidence of the benefits of including citizens’ perceptions in strategic decision making to improve smart city performance and its future development. Our findings do not undermine the importance of having financial resources or EU-founded projects; rather, they direct the attention of smart city administrators to align citizens’ perceptions with a better strategic decision related to smart city development and strategy. For such a formula to be effective, city managers must establish routines for citizens’ perception capture and effective use. Further, those routines must be linked to objectives related to smart city attribute improvement and their accomplishments facilitated by all the other stakeholders and reinforced by political-decision makers. It is crucial to train IT professionals and citizen services employees in skills needed to build strong links with smart city citizens. To achieve this, city managers must incorporate citizens’ perspective in all the smart city’s policies and plans. This operation includes building citizens’ relationship programs to support effective such behavior, followed by the development of reward and incentive schemas that openly reinforce personnel behavior consistent with citizens’ orientation.
Author Contributions
Conceptualization, O.-I.B., M.-E.F. and E.-A.B.; Funding acquisition, F.Ș.; Investigation, O.-I.B. and J.G.; Methodology, O.-I.B. and E.-A.B.; Project administration, E.-A.B.; Resources, O.-I.B., M.-E.F., E.-A.B., F.Ș. and J.G.; Software, O.-I.B.; Supervision, E.-A.B.; Validation, O.-I.B.; Visualization, M.-E.F.; Writing—original draft, O.-I.B., E.-A.B., F.Ș. and J.G.; Writing—review and editing, M.-E.F. and E.-A.B. All authors have read and agreed to the published version of the manuscript.
Funding
The research has been funded by the University of Oradea, within the Grants Competition “Scientific Research of Excellence Related to Priority Areas with Capitalization through Technology Transfer: INO-TRANSFER-UO”, Project No. 325/21.122021.
Institutional Review Board Statement
Not applicable.
Informed Consent Statement
Informed consent was obtained from all subjects involved in the study.
Data Availability Statement
Not applicable.
Conflicts of Interest
The authors declare no conflict of interest.
References
- United Nation. 2018 World Urbanization Prospects; United Nation: New York, NY, USA, 2018. [Google Scholar]
- Keough, N.; Ghitter, G. Sustainability Matters: Prospects for a Just Transition in Calgary, Canada’s Petro-City; University of Calgary Press: Calgary, AB, Canada, 2021. [Google Scholar]
- Dindarian, A. Chapter 20—Overview: The Smart Sustainable City Initiatives and the Circular Economy. In Circular Economy and Sustainability; Stefanakis, A., Nikolaou, I., Eds.; Elsevier: Amsterdam, The Netherlands, 2022. [Google Scholar] [CrossRef]
- Macke, J.; Casagrande, R.M.; Sarate, J.A.R.; Silva, K.A. Smart City and Quality of Life: Citizens’ Perception in a Brazilian Case Study. J. Clean. Prod. 2018, 182, 717–726. [Google Scholar] [CrossRef]
- Yigitcanlar, T.; Kamruzzaman, M.; Foth, M.; Sabatini-Marques, J.; da Costa, E.; Ioppolo, G. Can Cities Become Smart without Being Sustainable? A Systematic Review of the Literature. Sustain. Cities Soc. 2019, 45, 348–365. [Google Scholar] [CrossRef]
- Angelidou, M. Smart Cities: A Conjuncture of Four Forces. Cities 2015, 47, 95–106. [Google Scholar] [CrossRef]
- Angelidou, M. The Role of Smart City Characteristics in the Plans of Fifteen Cities. J. Urban Technol. 2017, 24, 3–28. [Google Scholar] [CrossRef]
- Fernandez-Anez, V.; Fernández-Güell, J.M.; Giffinger, R. Smart City Implementation and Discourses: An Integrated Conceptual Model. The Case of Vienna. Cities 2018, 78, 4–16. [Google Scholar] [CrossRef]
- Bris, A. Smart Cities: World’s Best Don’t Just Adopt New Technology, They Make It Work for People. Imd. 2019. Available online: https://www.imd.org/researchknowledge/articles/Smart-cities-Worlds-best-dont-just-adopt-new-technology-theymake-it-work-for-people/ (accessed on 25 January 2021).
- Bouzguenda, I.; Alalouch, C.; Fava, N. Towards Smart Sustainable Cities: A Review of the Role Digital Citizen Participation Could Play in Advancing Social Sustainability. Sustain. Cities Soc. 2019, 50, 101627. [Google Scholar] [CrossRef]
- Nicolas, C.; Kim, J.; Chi, S. Quantifying the Dynamic Effects of Smart City Development Enablers Using Structural Equation Modeling. Sustain. Cities Soc. 2020, 53, 101916. [Google Scholar] [CrossRef]
- Kim, H.; Choi, H.; Kang, H.; An, J.; Yeom, S.; Hong, T. A Systematic Review of the Smart Energy Conservation System: From Smart Homes to Sustainable Smart Cities. Renew. Sustain. Energy Rev. 2021, 140, 110755. [Google Scholar] [CrossRef]
- Porumbescu, G.A.; Cucciniello, M.; Gil-Garcia, J.R. Accounting for Citizens When Explaining Open Government Effectiveness. Gov. Inf. Q. 2020, 37, 101451. [Google Scholar] [CrossRef]
- Wu, W.-N. Determinants of Citizen-Generated Data in a Smart City: Analysis of 311 System User Behavior. Sustain. Cities Soc. 2020, 59, 102167. [Google Scholar] [CrossRef]
- Buttazzoni, A.; Veenhof, M.; Minaker, L. Smart City and High-Tech Urban Interventions Targeting Human Health: An Equity-Focused Systematic Review. Int. J. Environ. Res. Public Health 2020, 17, 2325. [Google Scholar] [CrossRef] [Green Version]
- Lin, C.; Zhao, G.; Yu, C.; Wu, Y.J. Smart City Development and Residents’ Well-Being. Sustainability 2019, 11, 676. [Google Scholar] [CrossRef] [Green Version]
- Bărbuț. Scanning Smart Cities in Romania—First Report; Vegacomp Consulting: Bucharest, Romania, 2018. [Google Scholar]
- Bărbuț. Scanning Smart Cities in Romania—Second Report; Vegacomp Consulting: Bucharest, Romania, 2018. [Google Scholar]
- Bărbuț. Scanning Smart Cities in Romania—Report; Vegacomp Consulting: Bucharest, Romania, 2019. [Google Scholar]
- Bărbuț. Scanning Smart Cities in Romania—Report; Vegacomp Consulting: Bucharest, Romania, 2020. [Google Scholar]
- Bărbuț. Mapping of Smart Counties, Cities and Villages in Romania—Report; Vegacomp Consulting: Bucharest, Romania, 2021. [Google Scholar]
- Arku, R.N.; Buttazzoni, A.; Agyapon-Ntra, K.; Bandauko, E. Highlighting Smart City Mirages in Public Perceptions: A Twitter Sentiment Analysis of Four African Smart City Projects. Cities 2022, 130, 103857. [Google Scholar] [CrossRef]
- Ji, T.; Chen, J.-H.; Wei, H.-H.; Su, Y.-C. Towards People-Centric Smart City Development: Investigating the Citizens’ Preferences and Perceptions about Smart-City Services in Taiwan. Sustain. Cities Soc. 2021, 67, 102691. [Google Scholar] [CrossRef]
- Tang, W.; Niu, Z.; Wei, Z.; Zhu, L. Sustainable Development of Eco-Cities: A Bibliometric Review. Sustainability 2022, 14, 10502. [Google Scholar] [CrossRef]
- Zhang, D.; Pee, L.G.; Pan, S.L.; Cui, L. Big Data Analytics, Resource Orchestration, and Digital Sustainability: A Case Study of Smart City Development. Gov. Inf. Q. 2022, 39, 101626. [Google Scholar] [CrossRef]
- Sodiq, A.; Baloch, A.A.B.; Khan, S.A.; Sezer, N.; Mahmoud, S.; Jama, M.; Abdelaal, A. Towards Modern Sustainable Cities: Review of Sustainability Principles and Trends. J. Clean. Prod. 2019, 227, 972–1001. [Google Scholar] [CrossRef]
- Bibri, S.E. Compact Urbanism and the Synergic Potential of Its Integration with Data-Driven Smart Urbanism: An Extensive Interdisciplinary Literature Review. Land Use Policy 2020, 97, 104703. [Google Scholar] [CrossRef]
- Ergler, C.R.; Freeman, C.; Guiney, T. Pre-Schoolers’ Vision for Liveable Cities: Creating ‘Care-Full’Urban Environments. Tijdschr. Voor Econ. En Soc. Geogr. 2022, 113, 131–150. [Google Scholar] [CrossRef]
- Feeney, M.K.; Fusi, F.; Camarena, L.; Zhang, F. Towards More Digital Cities? Change in Technology Use and Perceptions across Small and Medium-Sized US Cities. Local Gov. Stud. 2020, 46, 820–845. [Google Scholar] [CrossRef]
- Heinelt, H.; Terizakis, G. Innovative Cities: How to Explain Differences between Cities? An Answer Based on an Interpretive Approach. Urban Res. Pract. 2021, 14, 487–501. [Google Scholar] [CrossRef]
- Guallart, V. From Digital Cities to Biocities: Harnessing the Power of the Digital Revolution to Reinvent the Urban Ecology Model. Archit. Des. 2020, 90, 72–75. [Google Scholar] [CrossRef]
- Breuste, J. The Urban Nature Concept—Of What Urban Green Consists of. In Making Green Cities; Springer: Berlin/Heidelberg, Germany, 2020; pp. 17–48. [Google Scholar]
- Harrison, C.; Eckman, B.; Hamilton, R.; Hartswick, P.; Kalagnanam, J.; Paraszczak, J.; Williams, P. Foundations for Smarter Cities. IBM J. Res. Dev. 2010, 54, 1–16. [Google Scholar] [CrossRef]
- Caragliu, A.A.; Del Bo, C.; Kourtit, K.; Nijkamp, P. Comparative Performance Assessment of Smart Cities around the North Sea Basin. Netw. Ind. Q. 2011, 13, 15–17. [Google Scholar]
- Dirks, S.; Keeling, M. A Vision of Smarter Cities: How Cities Can Lead the Way into a Prosperous and Sustainable Future; IBM Institute for Business Value: Armonk, NY, USA, 2009; Volume 8. [Google Scholar]
- Su, K.; Li, J.; Fu, H. Smart City and the Applications. In Proceedings of the 2011 International Conference on Electronics, Communications and Control (ICECC), Ningbo, China, 9–11 September 2011; pp. 1028–1031. [Google Scholar] [CrossRef]
- Neirotti, P.; Marco, A.D.; Cagliano, A.C.; Mangano, G.; Scorrano, F. Current Trends in Smart City Initiatives: Some Stylised Facts. Cities 2014, 38, 25–36. [Google Scholar] [CrossRef] [Green Version]
- Camero, A.; Alba, E. Smart City and Information Technology: A Review. Cities 2019, 93, 84–94. [Google Scholar] [CrossRef]
- Hassan, R.J.; Zeebaree, S.; Ameen, S.Y.; Kak, S.F.; Sadeeq, M.; Ageed, Z.S.; Adel, A.; Salih, A.A. State of Art Survey for Iot Effects on Smart City Technology: Challenges, Opportunities, and Solutions. Asian J. Res. Comput. Sci. 2021, 22, 32–48. [Google Scholar] [CrossRef]
- Nam, K.; Dutt, C.S.; Chathoth, P.; Khan, M.S. Blockchain Technology for Smart City and Smart Tourism: Latest Trends and Challenges. Asia Pac. J. Tour. Res. 2021, 26, 454–468. [Google Scholar] [CrossRef]
- Anthopoulos, L.G. Understanding the Smart City Domain: A Literature Review. In Transforming City Governments for Successful Smart Cities. Public Administration and Information Technology; Rodríguez-Bolívar, M.P., Ed.; Springer: Cham, Switzerland, 2015; Volume 8, edition 127; pp. 9–21. [Google Scholar] [CrossRef]
- Kasznar, A.P.P.; Hammad, A.W.A.; Najjar, M.; Linhares Qualharini, E.; Figueiredo, K.; Soares, C.A.; Haddad, A.N. Multiple Dimensions of Smart Cities’ Infrastructure: A Review. Buildings 2021, 11, 73. [Google Scholar] [CrossRef]
- Bakici, T.; Almirall, E.; Wareham, J. A Smart City Initiative: The Case of Barcelona. J. Knowl. Econ. 2013, 4, 135–148. [Google Scholar] [CrossRef]
- Xu, C.; Wu, H.; Zhang, Y.; Dai, S.; Liu, H.; Tian, J. A Real-Time Complex Road AI Perception Based on 5G-V2X for Smart City Security. Wirel. Commun. Mob. Comput. 2022, 2022, 4405242. [Google Scholar] [CrossRef]
- Morozov, E.V.; Bria, F. Rethinking the Smart City; Rosa Luxemburg Stiftung: New York, NY, USA, 2018; pp. 1–56. [Google Scholar]
- Laufs, J.; Borrion, H.; Bradford, B. Security and the Smart City: A Systematic Review. Sustain. Cities Soc. 2020, 55, 102023. [Google Scholar] [CrossRef]
- Al-Turjman, F.; Zahmatkesh, H.; Shahroze, R. An Overview of Security and Privacy in Smart Cities’ IoT Communications. Trans. Emerg. Telecommun. Technol. 2022, 33, e3677. [Google Scholar] [CrossRef]
- Capdevila, I.; Zarlenga, M.I. Smart City or Smart Citizens? The Barcelona Case. J. Strategy Manag. 2015, 8, 266–282. [Google Scholar] [CrossRef]
- Chu, Z.; Cheng, M.; Song, M. What Determines Urban Resilience against COVID-19: City Size or Governance Capacity? Sustain. Cities Soc. 2021, 75, 103304. [Google Scholar] [CrossRef]
- Shamsuzzoha, A.; Nieminen, J.; Piya, S.; Rutledge, K. Smart City for Sustainable Environment: A Comparison of Participatory Strategies from Helsinki, Singapore and London. Cities 2021, 114, 103194. [Google Scholar] [CrossRef]
- Chourabi, H.; Nam, T.; Walker, S.; Gil-Garcia, J.R.; Mellouli, S.; Nahon, K.; Pardo, T.A.; Scholl, H.J. Understanding Smart Cities: An Integrative Framework. In Proceedings of the 2012 45th Hawaii International Conference on System Sciences, Maui, HI, USA, 4–7 January 2012; pp. 2289–2297. [Google Scholar] [CrossRef]
- Batty, M. Big Data, Smart Cities and City Planning. Dialogues Hum. Geogr. 2013, 3, 274–279. [Google Scholar] [CrossRef]
- Meijer, A.; Bolívar, M.P.R. Governing the Smart City: A Review of the Literature on Smart Urban Governance. Int. Rev. Adm. Sci. 2016, 82, 392–408. [Google Scholar] [CrossRef] [Green Version]
- Nam, T.; Pardo, T. Conceptualizing Smart City with Dimensions of Technology, People, and Institutions. In Proceedings of the 12th Annual International Conference on Digital Government Research, College Park, MD, USA, 12–15 June 2011; pp. 282–291. [Google Scholar] [CrossRef]
- Dameri, R. Searching for Smart City Definition: A Comprehensive Proposal. Int. J. Comput. Technol. 2013, 11, 2544. [Google Scholar] [CrossRef]
- Chatterjee, S.; Kar, A.K.; Mustafa, S.Z. Securing IoT Devices in Smart Cities of India: From Ethical and Enterprise Information System Management Perspective. Enterp. Inf. Syst. 2021, 15, 585–615. [Google Scholar] [CrossRef]
- Giffinger, R.; Fertner, C.; Kramar, H.; Meijers, E. Smart Cities Ranking of European Medium-Sized Cities; UT: Centre of Regional Science: Vienna, Austria, 2007; pp. 1–12. [Google Scholar]
- Giffinger, R.; Gudrun, H. Smart Cities Ranking: An Effective Instrument for the Positioning of the Cities? ACE Archit. City Environ. 2010, 4, 7–26. [Google Scholar] [CrossRef] [Green Version]
- Lombardi, P.; Giordano, S.; Farouh, H.; Yousef, W. Modelling the Smart City Performance. Innov. Eur. J. Soc. Sci. Res. 2012, 25, 137–149. [Google Scholar] [CrossRef]
- Huovila, A.; Bosch, P.; Airaksinen, M. Comparative Analysis of Standardized Indicators for Smart Sustainable Cities: What Indicators and Standards to Use and When? Cities 2019, 89, 141–153. [Google Scholar] [CrossRef]
- Bjørner, T. The Advantages of and Barriers to Being Smart in a Smart City: The Perceptions of Project Managers within a Smart City Cluster Project in Greater Copenhagen. Cities 2021, 114, 103187. [Google Scholar] [CrossRef]
- Lee, J.; Lee, H. Developing and Validating a Citizen-Centric Typology for Smart City Services. Gov. Inf. Q. 2014, 31, S93–S105. [Google Scholar] [CrossRef]
- Millard, J.; Thaarup, R.; Pederson, J.; Cave, J.; Cochrane, G.; Manville, C.; Liebe, A.; Wissner, M.; Massink, R.; Kotterink, B.; et al. Mapping Smart Cities in the EU; European Parliament, Directorate-General for Internal Policies of the Union: Brussels, Belgium, 2014. [Google Scholar]
- The European Commision. Smart Cities and Communities. 2022. Available online: https://digital-strategy.ec.europa.eu/en/policies/smart-cities-and-communities (accessed on 15 June 2022).
- Winkowska, J.; Szpilko, D.; Pejić, S. Smart City Concept in the Light of the Literature Review. Eng. Manag. Prod. Serv. 2019, 11, 70–86. [Google Scholar] [CrossRef]
- Pira, M. A novel taxonomy of smart sustainable city indicators. Humanit. Soc. Sci. Commun. 2021, 8, 197. [Google Scholar] [CrossRef]
- Cohen, B. Smart City Index Master Indicators Survey; Smart Cities Council Inc.: Reston, VA, USA, 2014. [Google Scholar]
- Hass, J.L.; Brunvoll, F.; Hoie, H. Overview of Sustainable Development Indicators Used by National and International Agencies; OECD Statistics Working Paper; OECD: Paris, France, 2003. [Google Scholar]
- Dodescu, A.O.; Botezat, E.A.; Constăngioară, A.; Boloș, M.I. An Exploratory Analysis of the Territorial Capital and Economic Growth: Evidence from Romania. Econ. Comput. Econ. Cybern. Stud. Res. 2018, 4, 95–112. [Google Scholar] [CrossRef]
- Ibănescu, B.-C.; Pascariu, G.C.; Bănică, A.; Bejenaru, I. Smart city: A critical assessment of the concept and its implementation in Romanian urban strategies. J. Urban Manag. 2022, 11, 246–255. [Google Scholar] [CrossRef]
- Norman, G. Likert scales, levels of measurement and the “laws” of statistics. Adv. Health Sci. Educ. 2010, 15, 625–632. [Google Scholar] [CrossRef]
- Taber, K.S. The use of Cronbach’s alpha when developing and reporting research instruments in science education. Res. Sci. Educ. 2018, 48, 1273–1296. [Google Scholar] [CrossRef] [Green Version]
- Soratto, J.; Pires, D.E.P.D.; Friese, S. Hematic Content Analysis Using ATLAS.Ti Software: Potentialities for Researchs in Health. Rev. Bras. De Enferm. 2020, 73, e20190250. [Google Scholar] [CrossRef] [Green Version]
- Ban, O.I.; Droj, L.; Tușe, D.; Droj, G.; Bugnar, N. Data Processing by Fuzzy Methods in Social Sciences Researches. Example in Hospitality Industry. Int. J. Comput. Commun. Control 2022, 17, 4741. [Google Scholar] [CrossRef]
- Li, H.X.; Zhang, L.; Cai, K.Y.; Chen, G. An improved robust fuzzy-PID controller with optimal fuzzy reasoning. IEEE Trans. Syst. Man Cybern. Part B (Cybern.) 2005, 35, 1283–1294. [Google Scholar] [CrossRef] [Green Version]
- Heilpern, S. The expected value of a fuzzy number. Fuzzy Sets Syst. 1992, 47, 81–86. [Google Scholar] [CrossRef]
- Ban, O.I.; Droj, L.; Tușe, D.A.; Botezat, E. Operationalization of Importance-Performance Analysis with Nine Categories and Tested for Green Practices and Financial Evaluation. Technol. Econ. Dev. 2022, 1–28. [Google Scholar] [CrossRef]
- Nunes, S.A.S.; Ferreira, F.A.F.; Govindan, K.; Pereira, L.F. “Cities Go Smart!”: A System Dynamics-Based Approach to Smart City Conceptualization. J. Clean. Prod. 2021, 313, 127683. [Google Scholar] [CrossRef]
- Yeh, H. The Effects of Successful ICT-Based Smart City Services: From Citizens’ Perspectives. Gov. Inf. Q. 2017, 34, 556–565. [Google Scholar] [CrossRef]
- El Hilali, S.; Azougagh, A. Smart City Research Between 1997 and 2020: A Systematic Literature. In Innovations in Smart Cities Applications Volume 5. Proceedings of the International Conference on Smart City Applications, Safranbolu, Turkey, 27–29 November 2021; Springer: Berlin/Heidelberg, Germany, 2022; Volume 5, p. 3. [Google Scholar]
- Georgiadis, A.; Christodoulou, P.; Zinonos, Z. Citizens’ Perception of Smart Cities: A Case Study. Appl. Sci. 2021, 11, 2517. [Google Scholar] [CrossRef]
| Publisher’s Note: MDPI stays neutral with regard to jurisdictional claims in published maps and institutional affiliations. |
© 2022 by the authors. Licensee MDPI, Basel, Switzerland. This article is an open access article distributed under the terms and conditions of the Creative Commons Attribution (CC BY) license (https://creativecommons.org/licenses/by/4.0/).


 ,
, 


