


Influence of Mesoscopic Parameters of Weakly Cemented Rocks on Macroscopic Mechanical Properties

Abstract
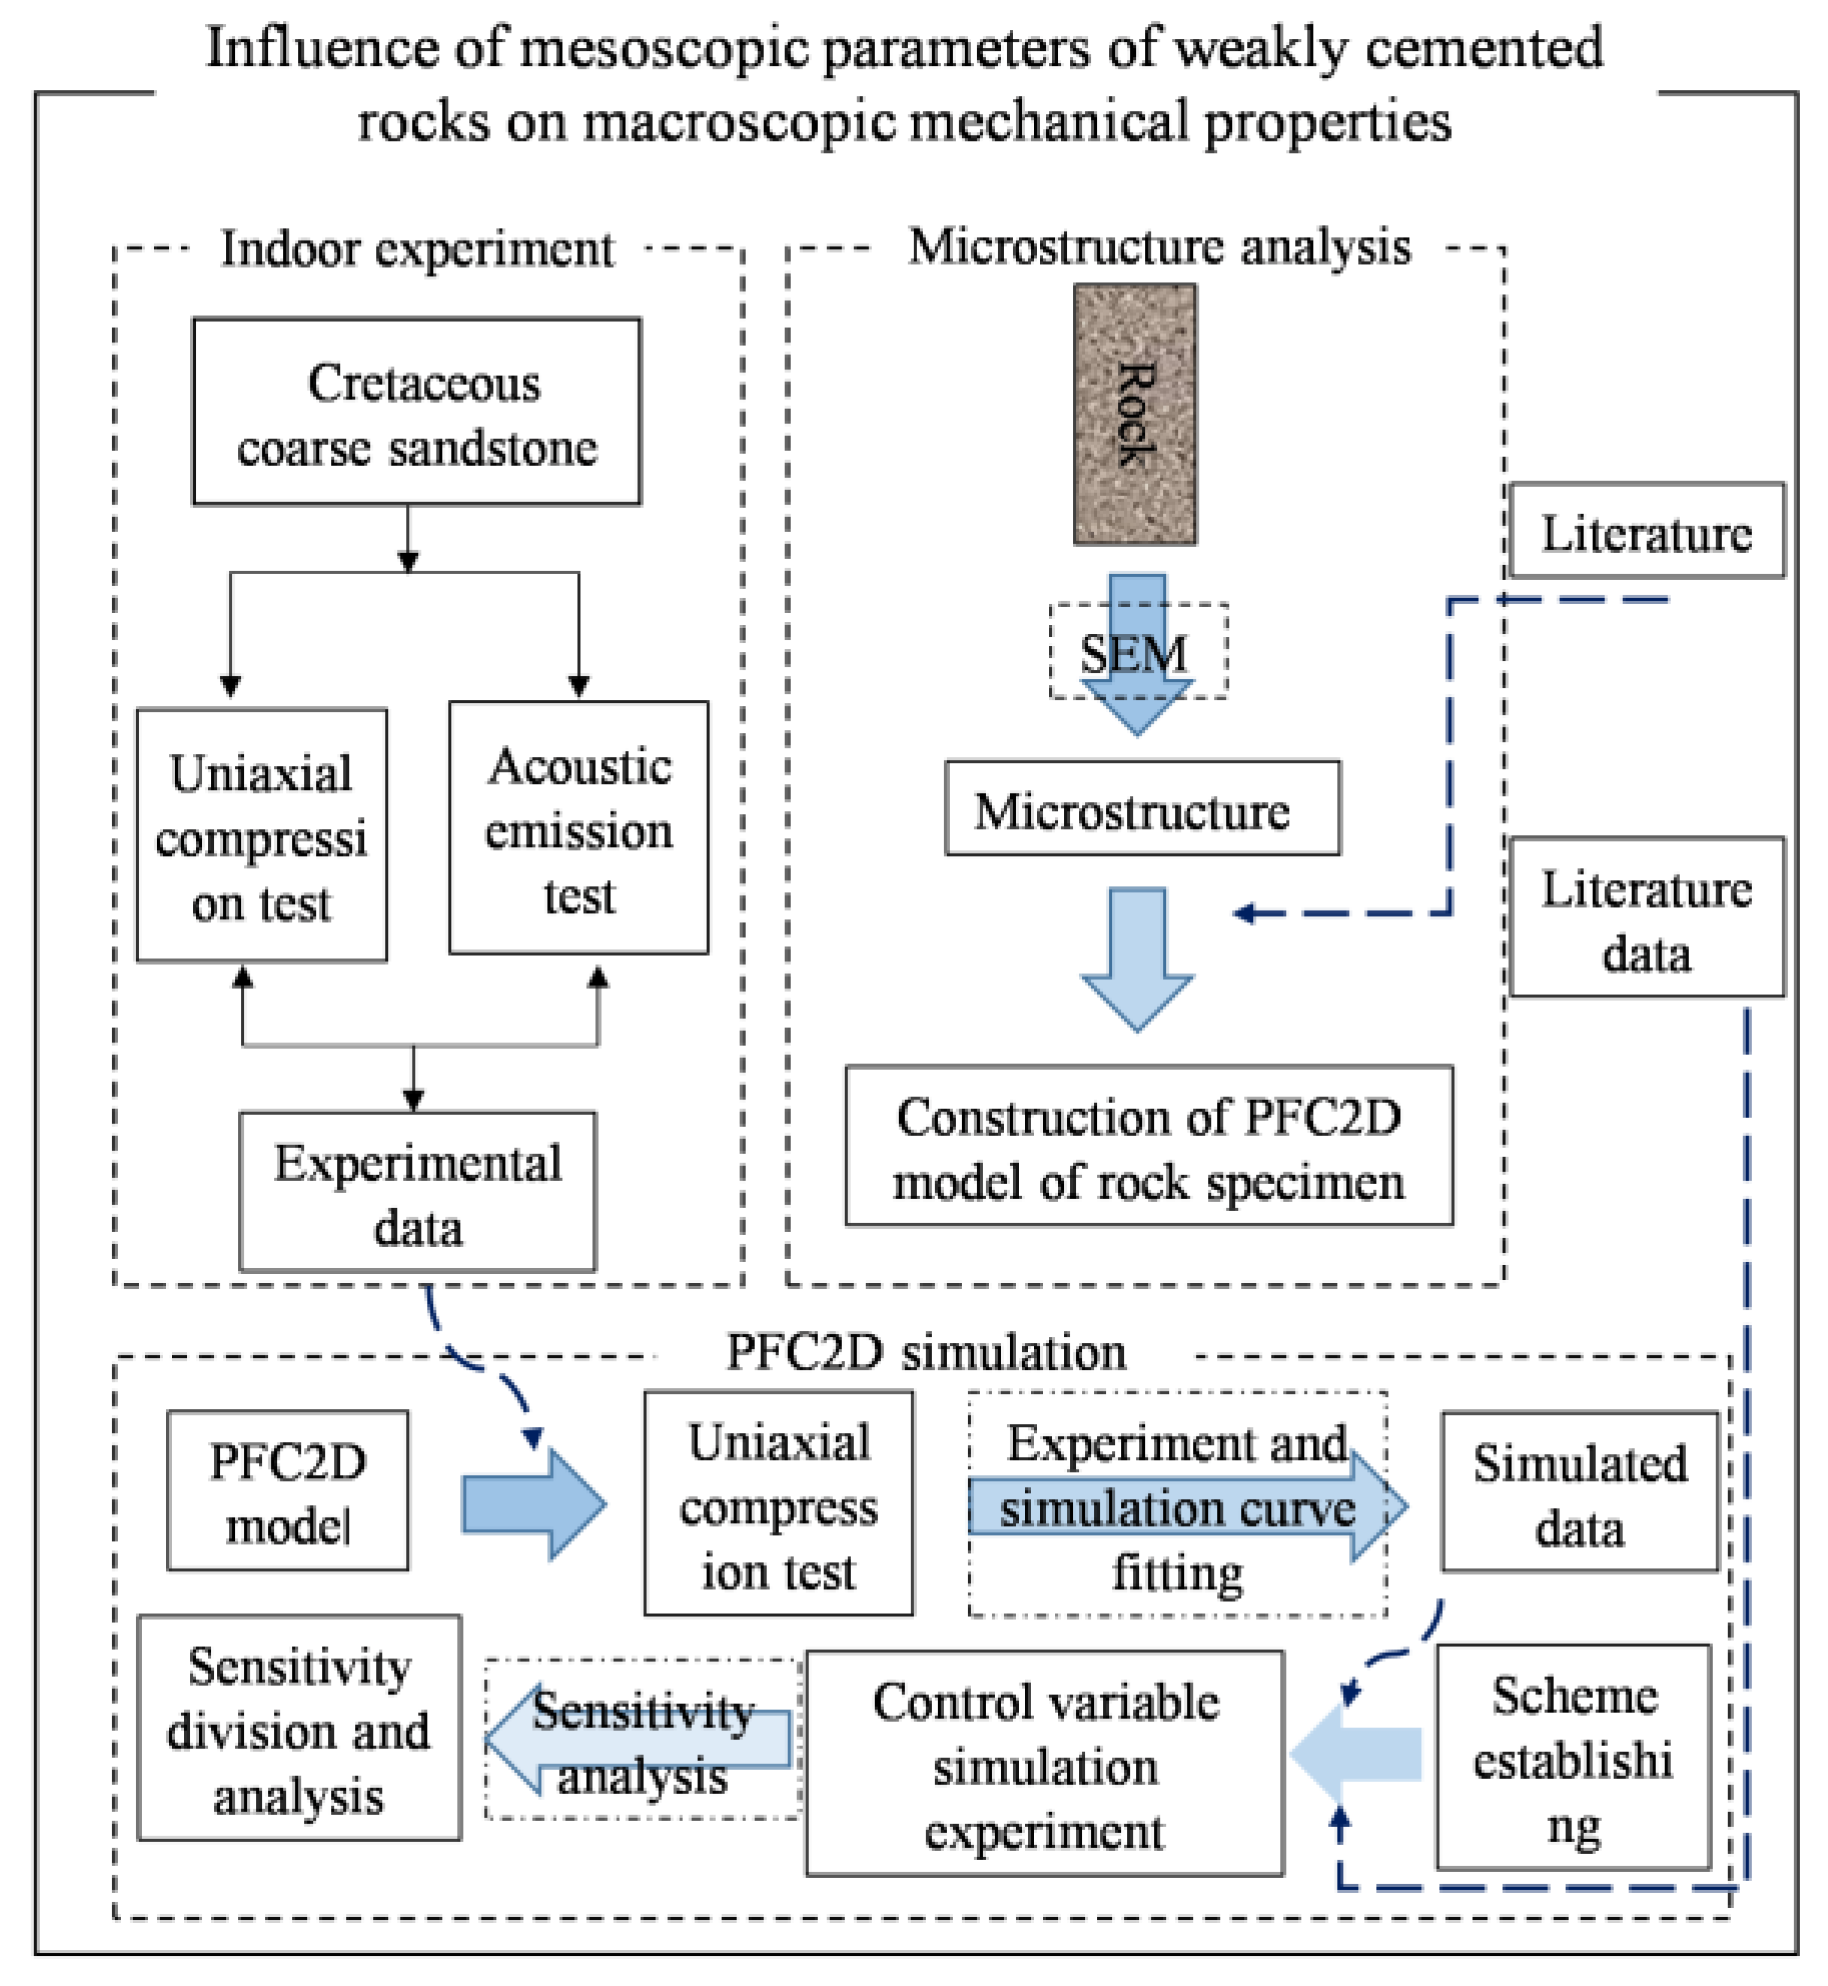
:1. Introduction
2. Indoor Physical Mechanics Experiment
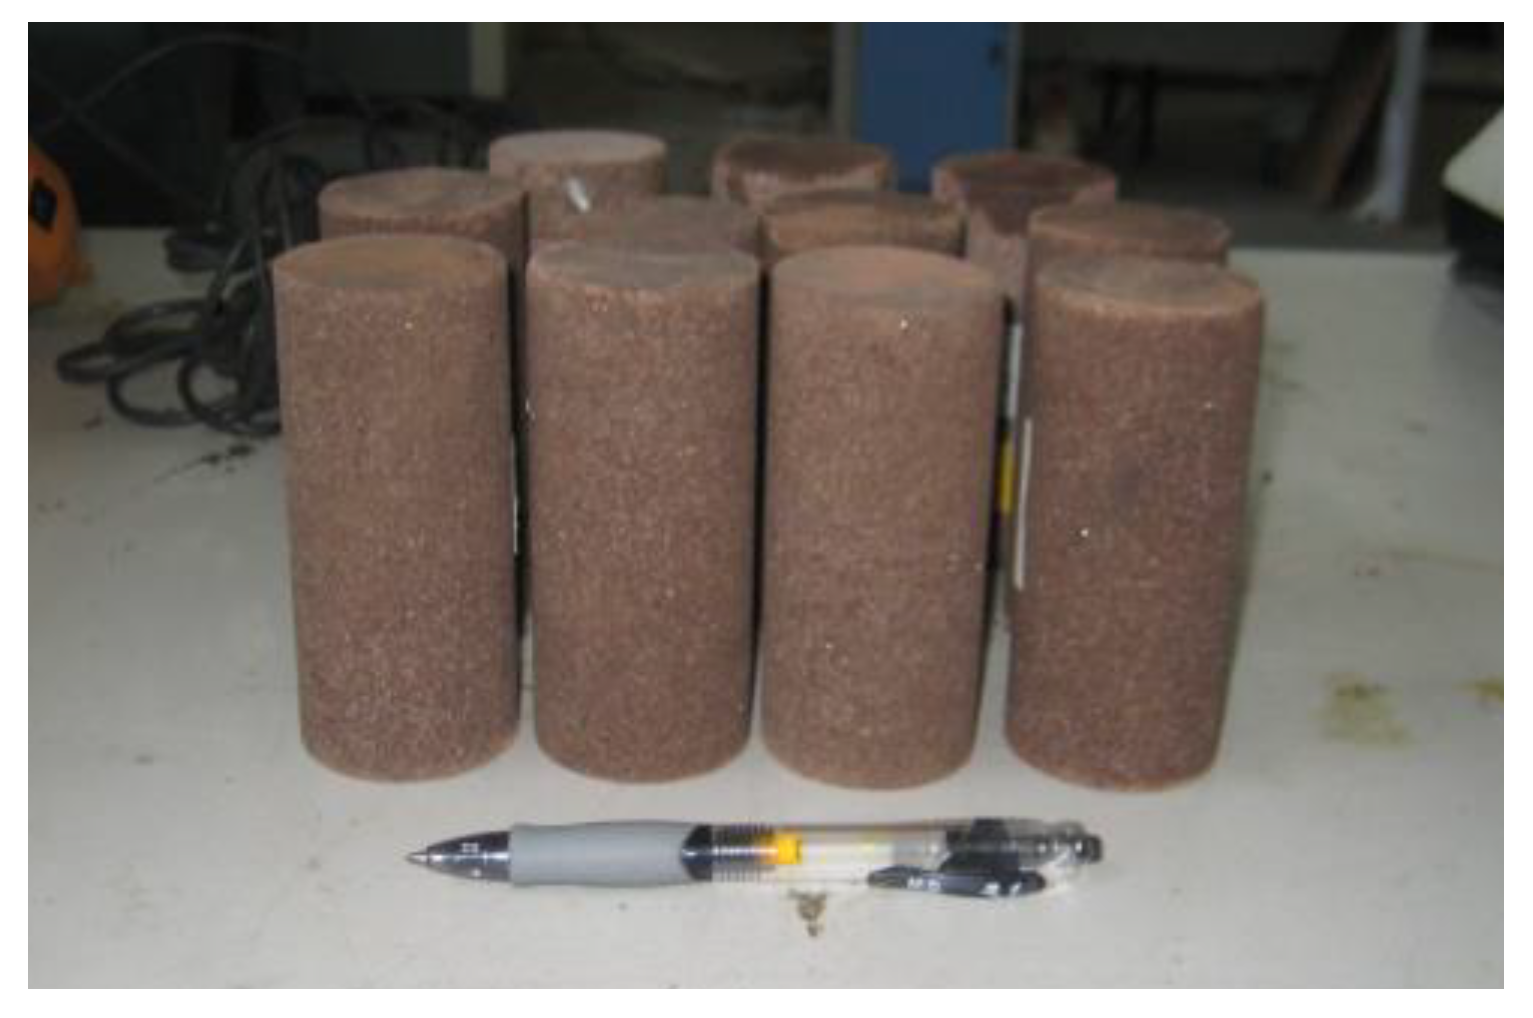
2.1. Experimental Sampling and Preparation
2.2. Experimental Results and Analysis
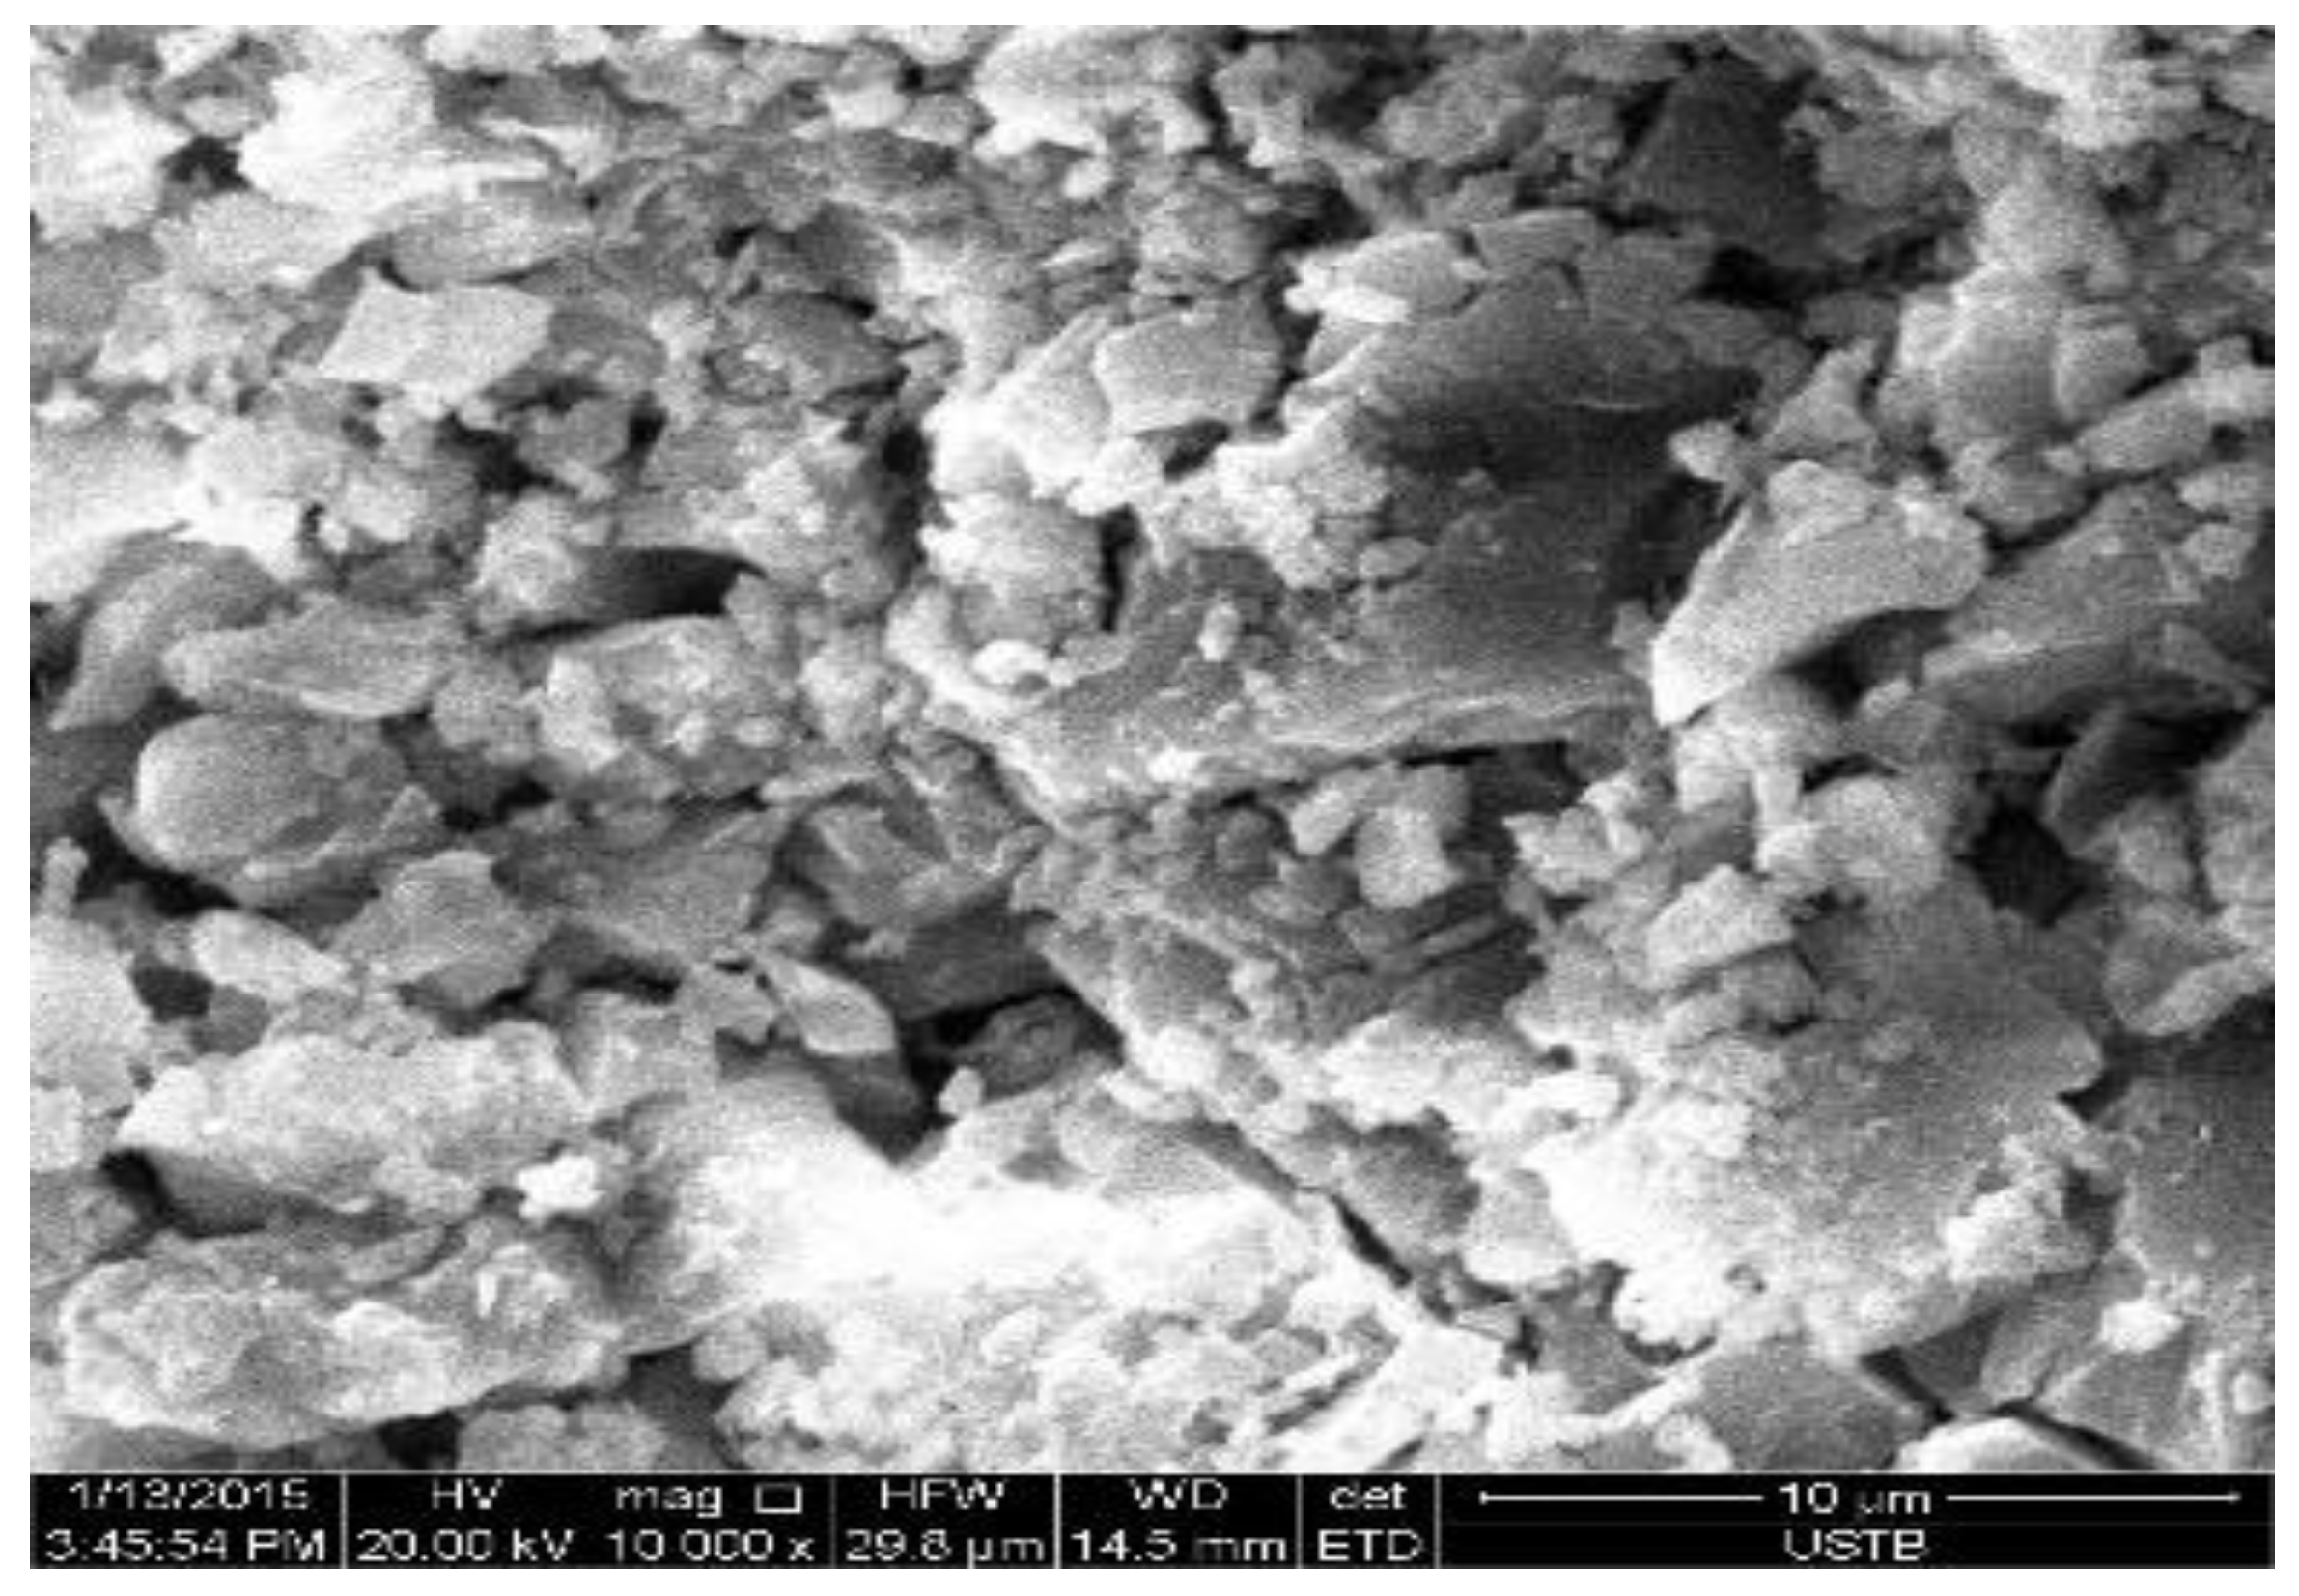
2.2.1. Characteristics of Rock Mesostructure
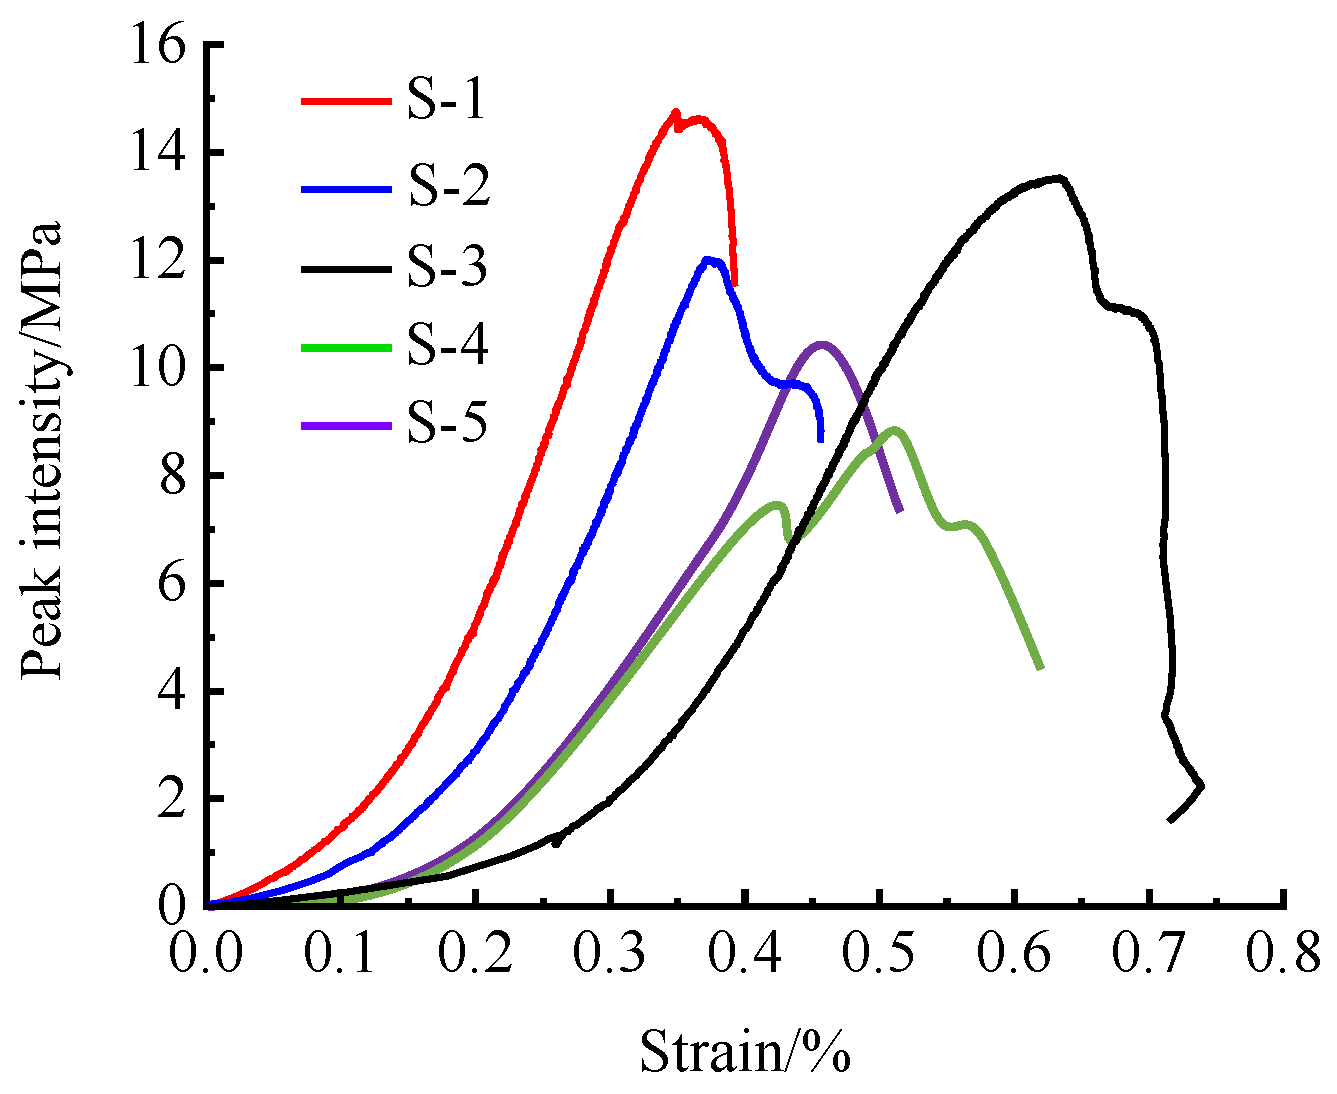
2.2.2. Rock Stress–Strain Law
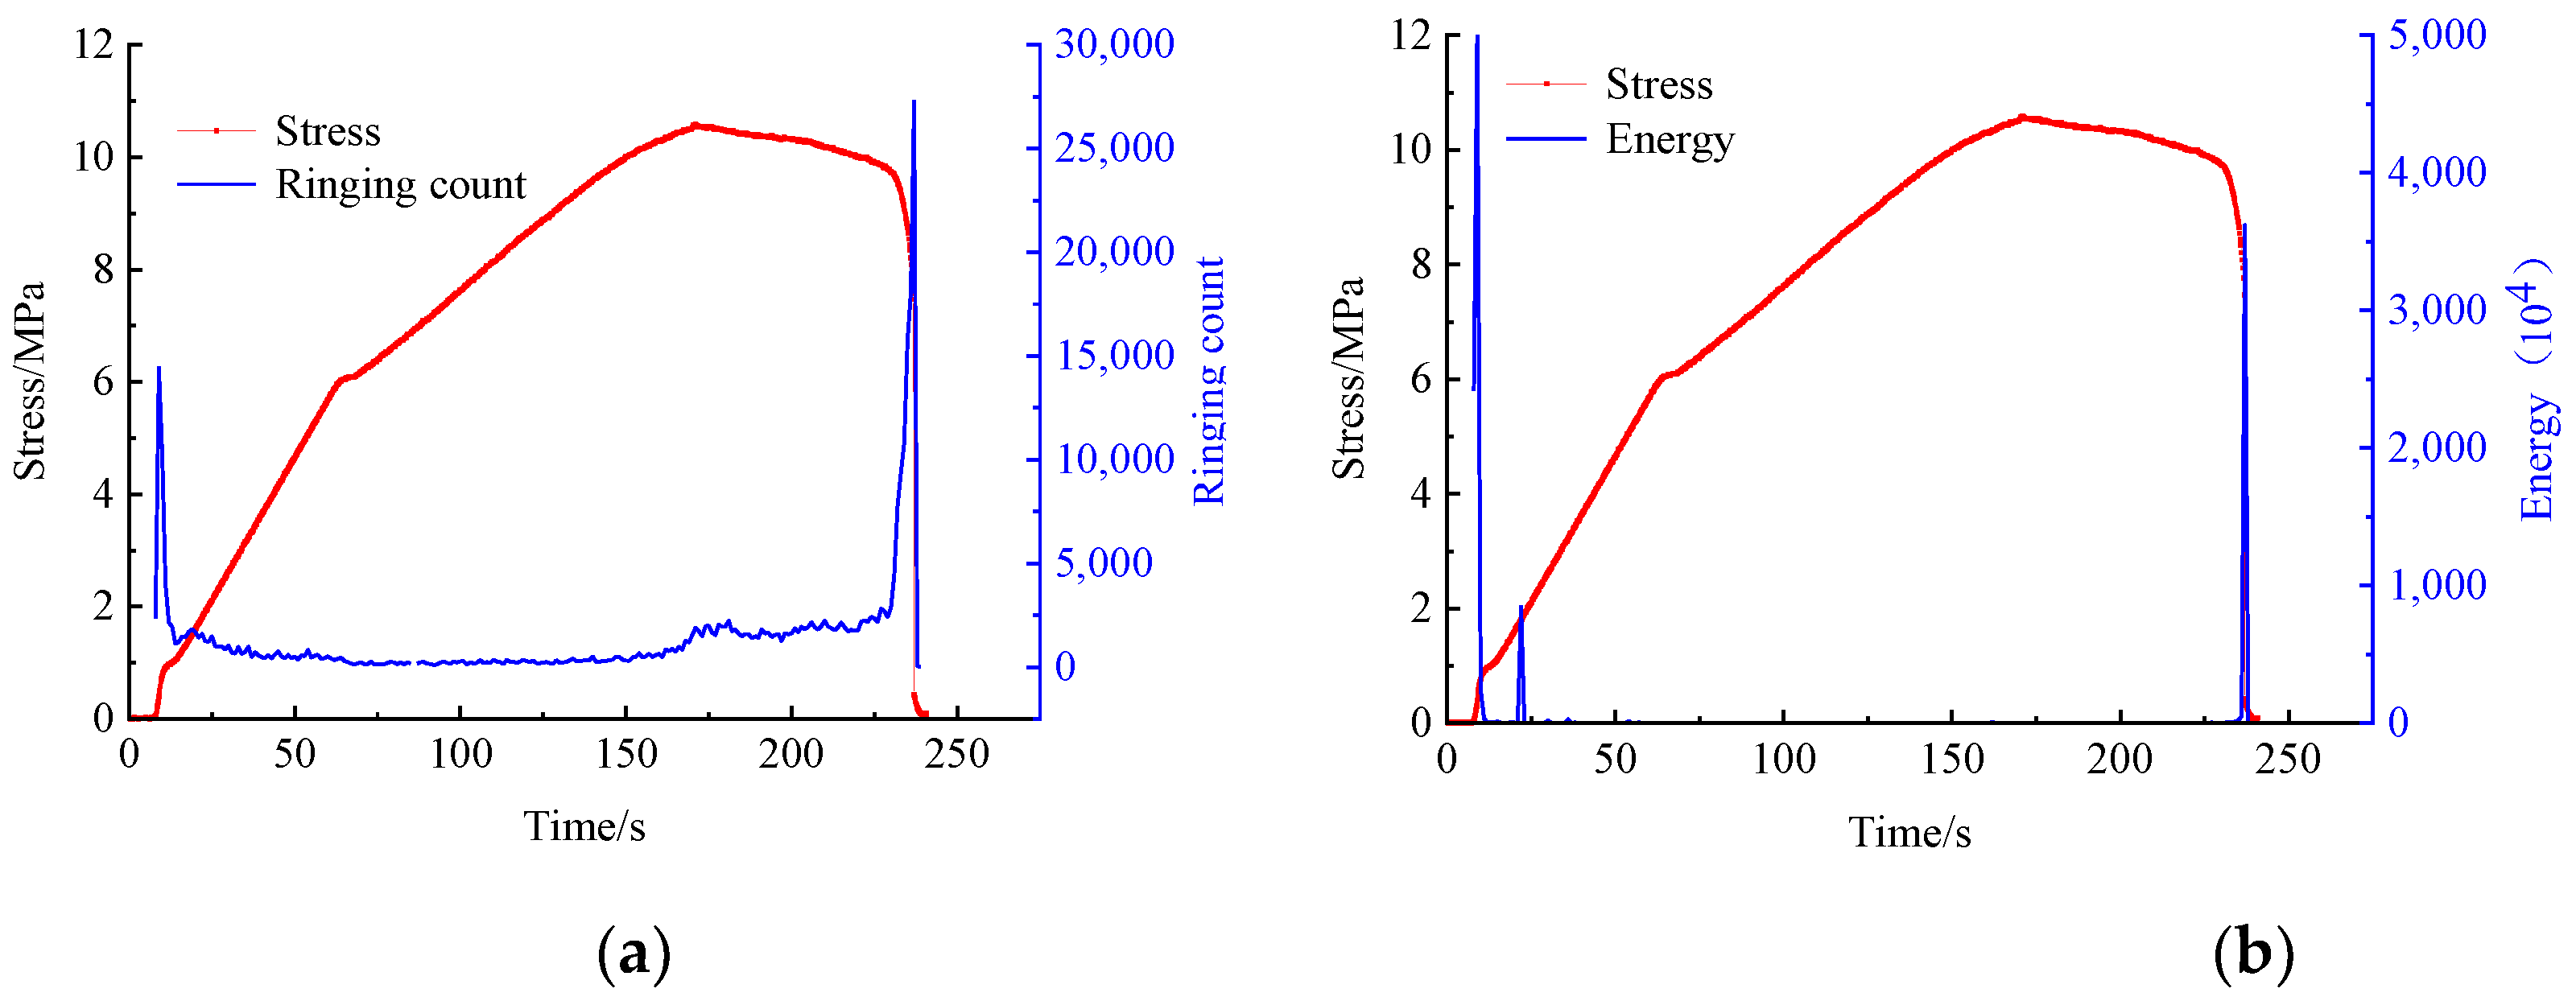
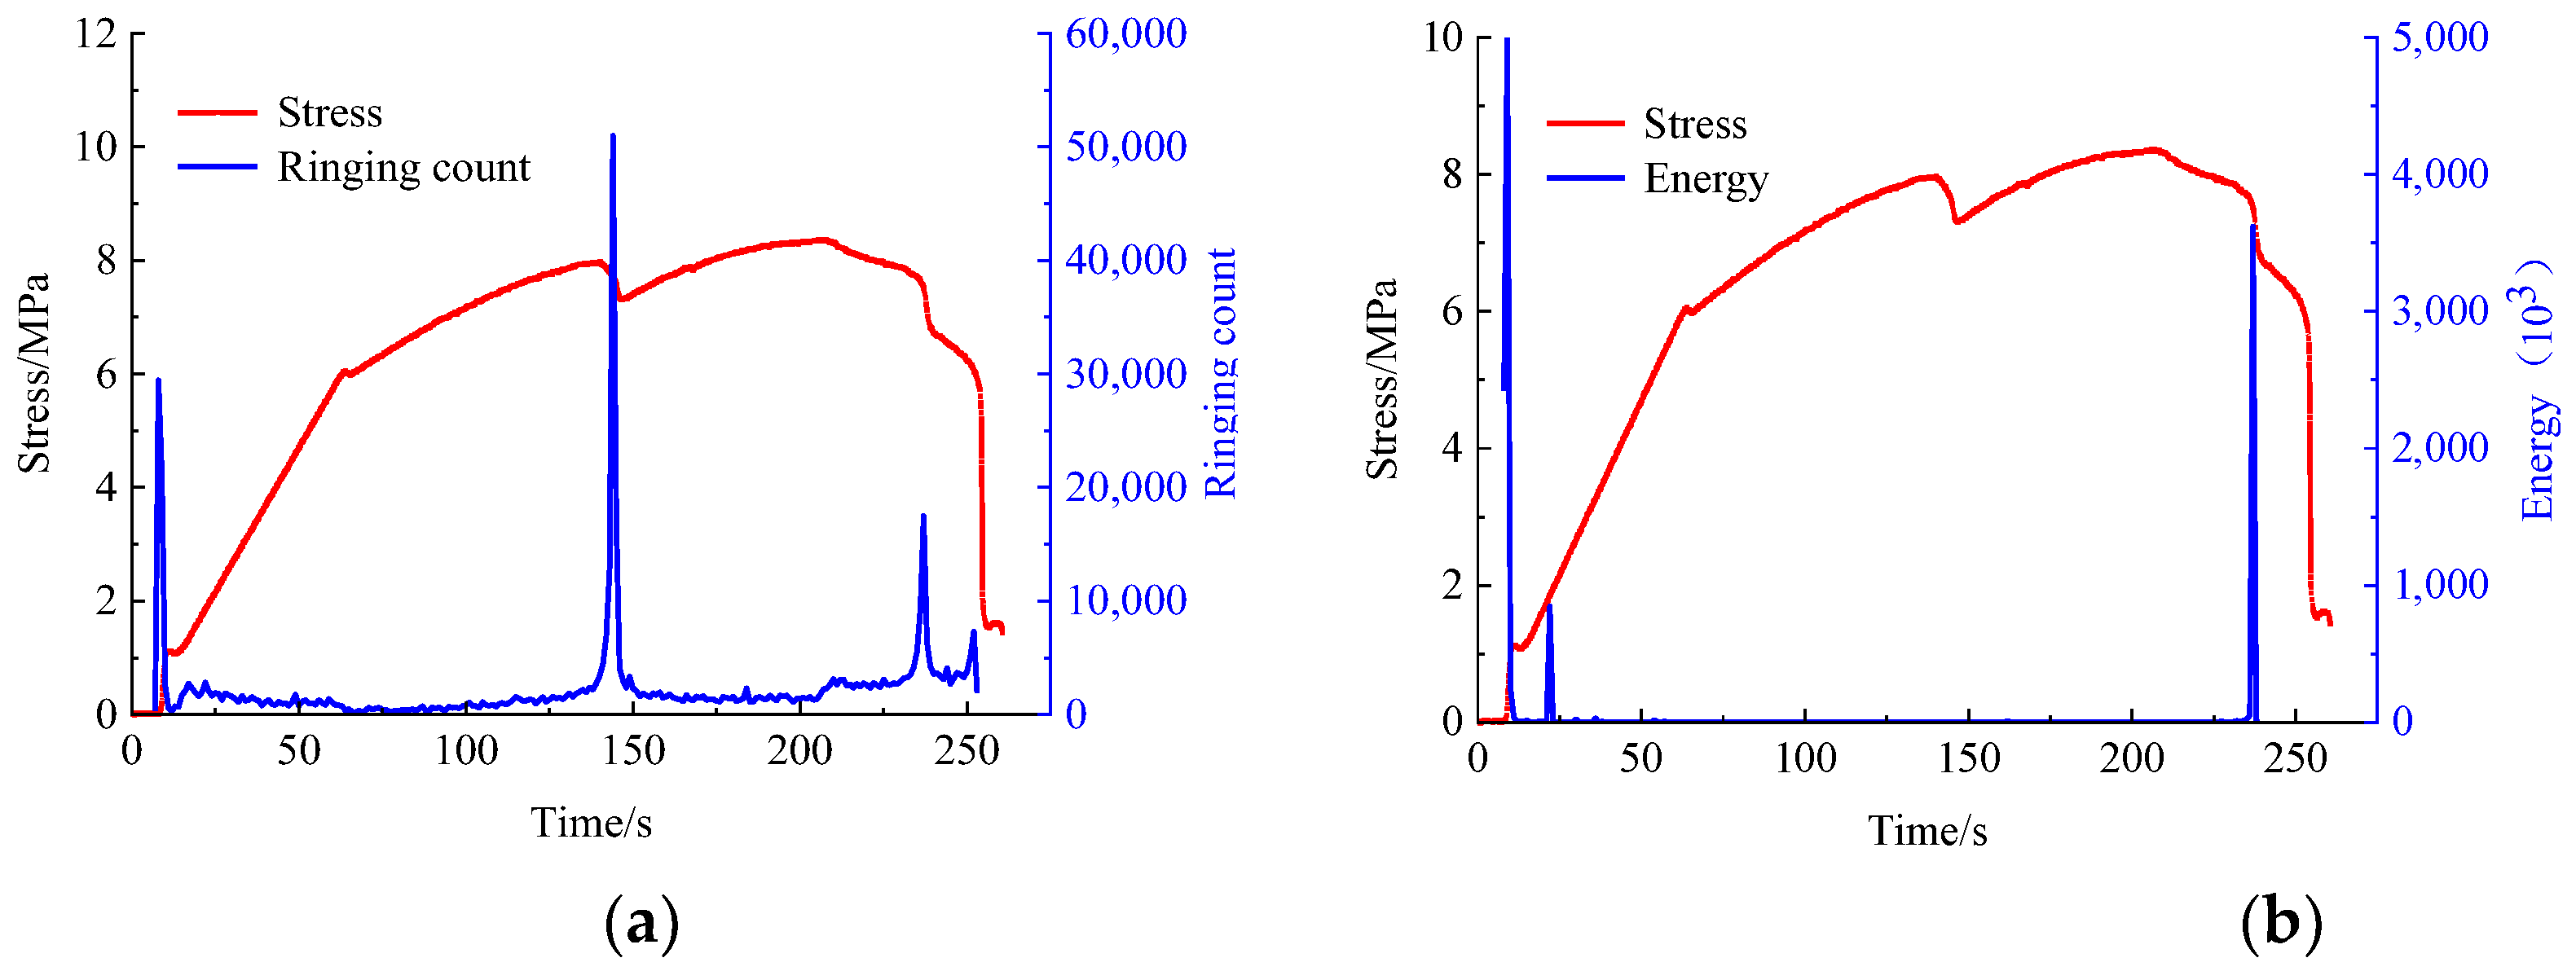
2.2.3. Acoustic Emission Characteristics of Rocks
3. Numerical Simulation Experiment Scheme
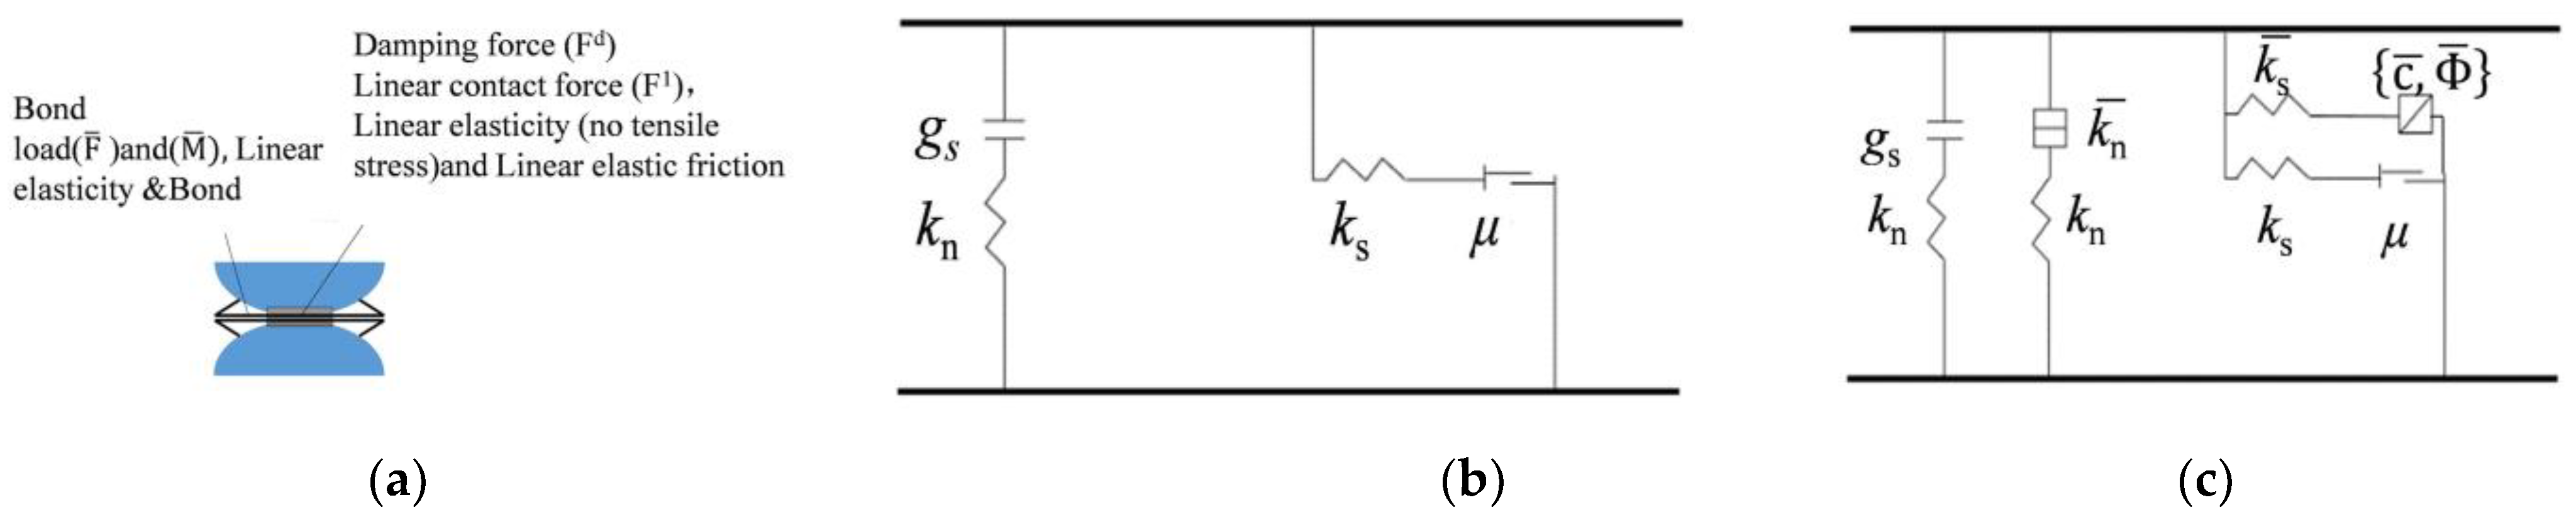
3.1. Bonding Model Selection
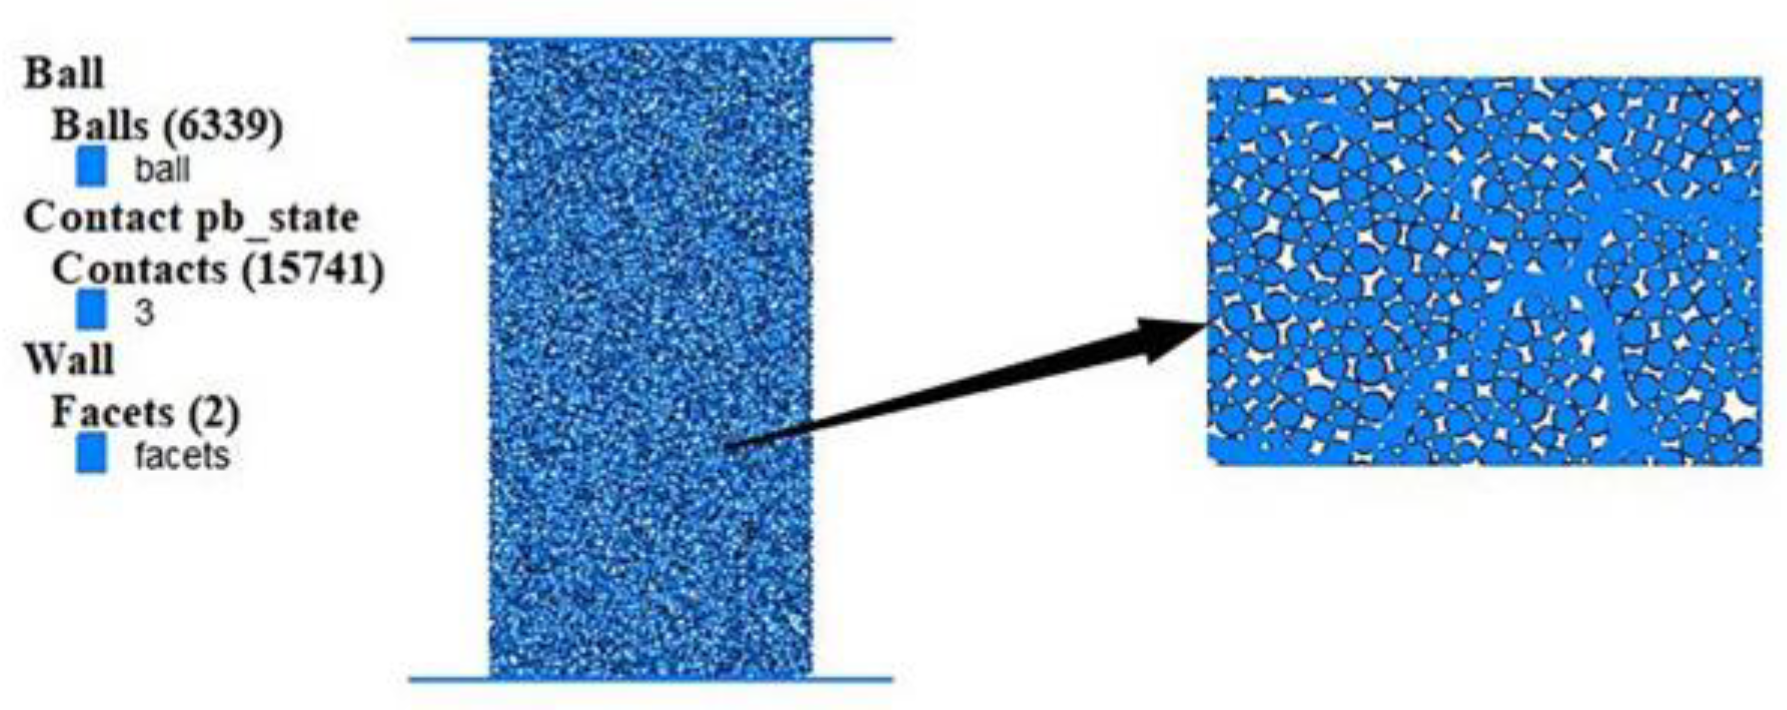
3.2. Model Construction
3.3. Test Plan
4. Correlation Analysis of Rock Meso-Parameters and Macro-Mechanical Properties
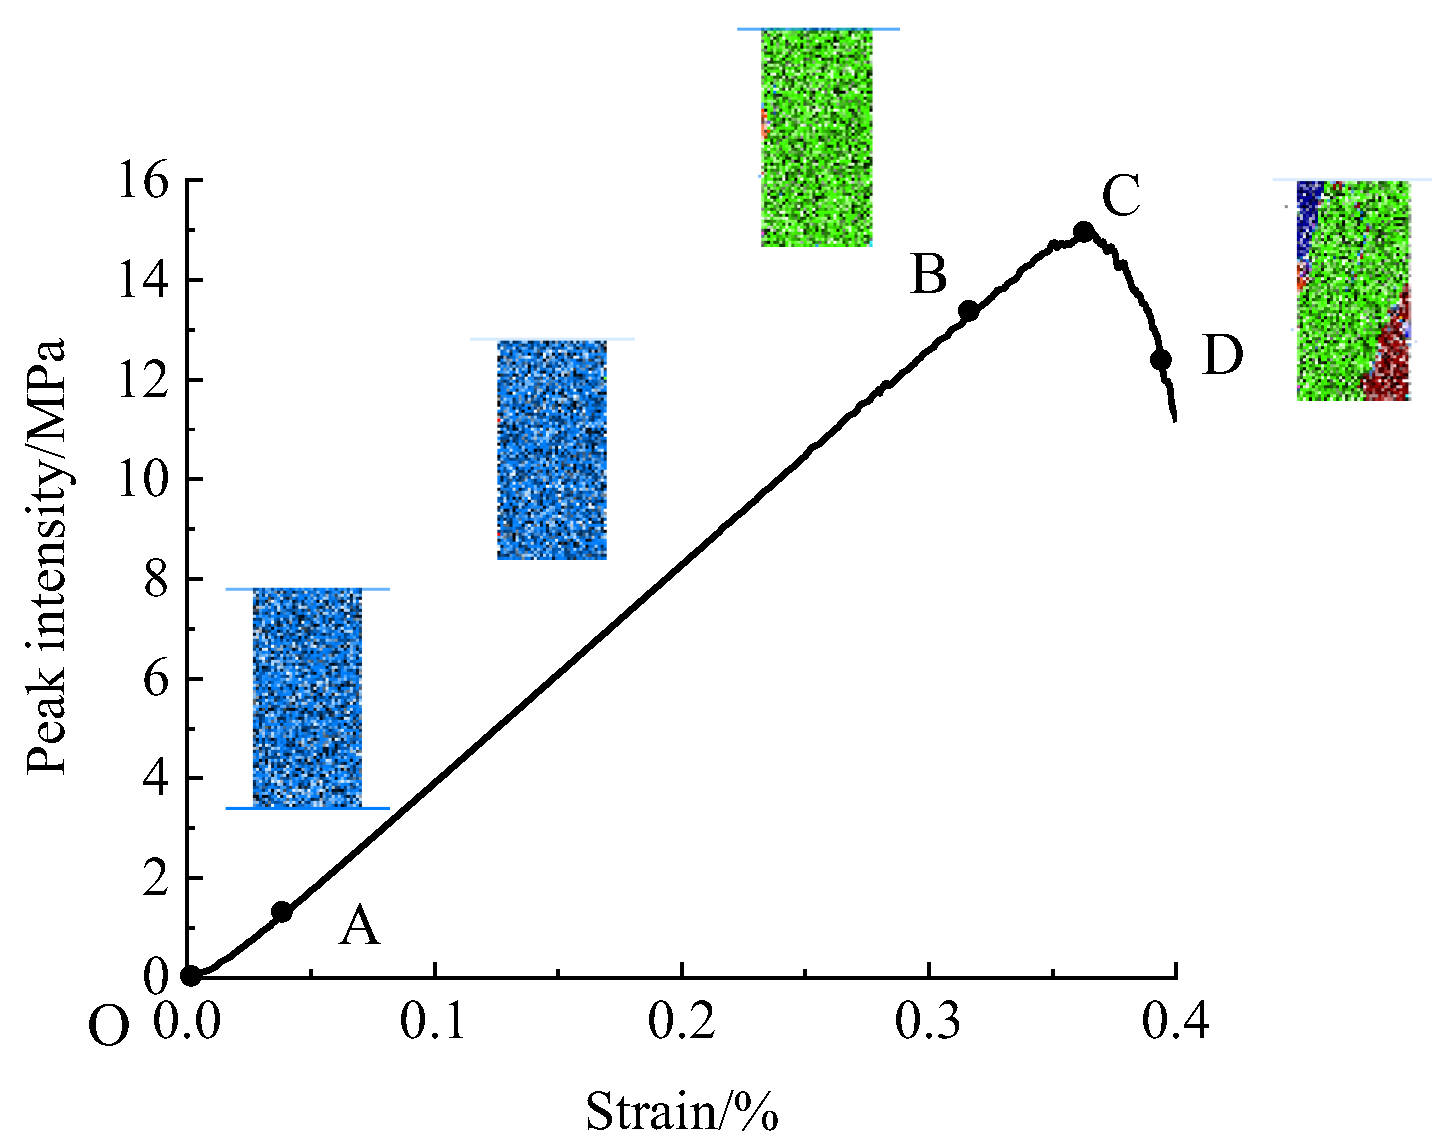
4.1. Deformation Law of Rock under Uniaxial Compression
4.2. Parameter Sensitivity Analysis
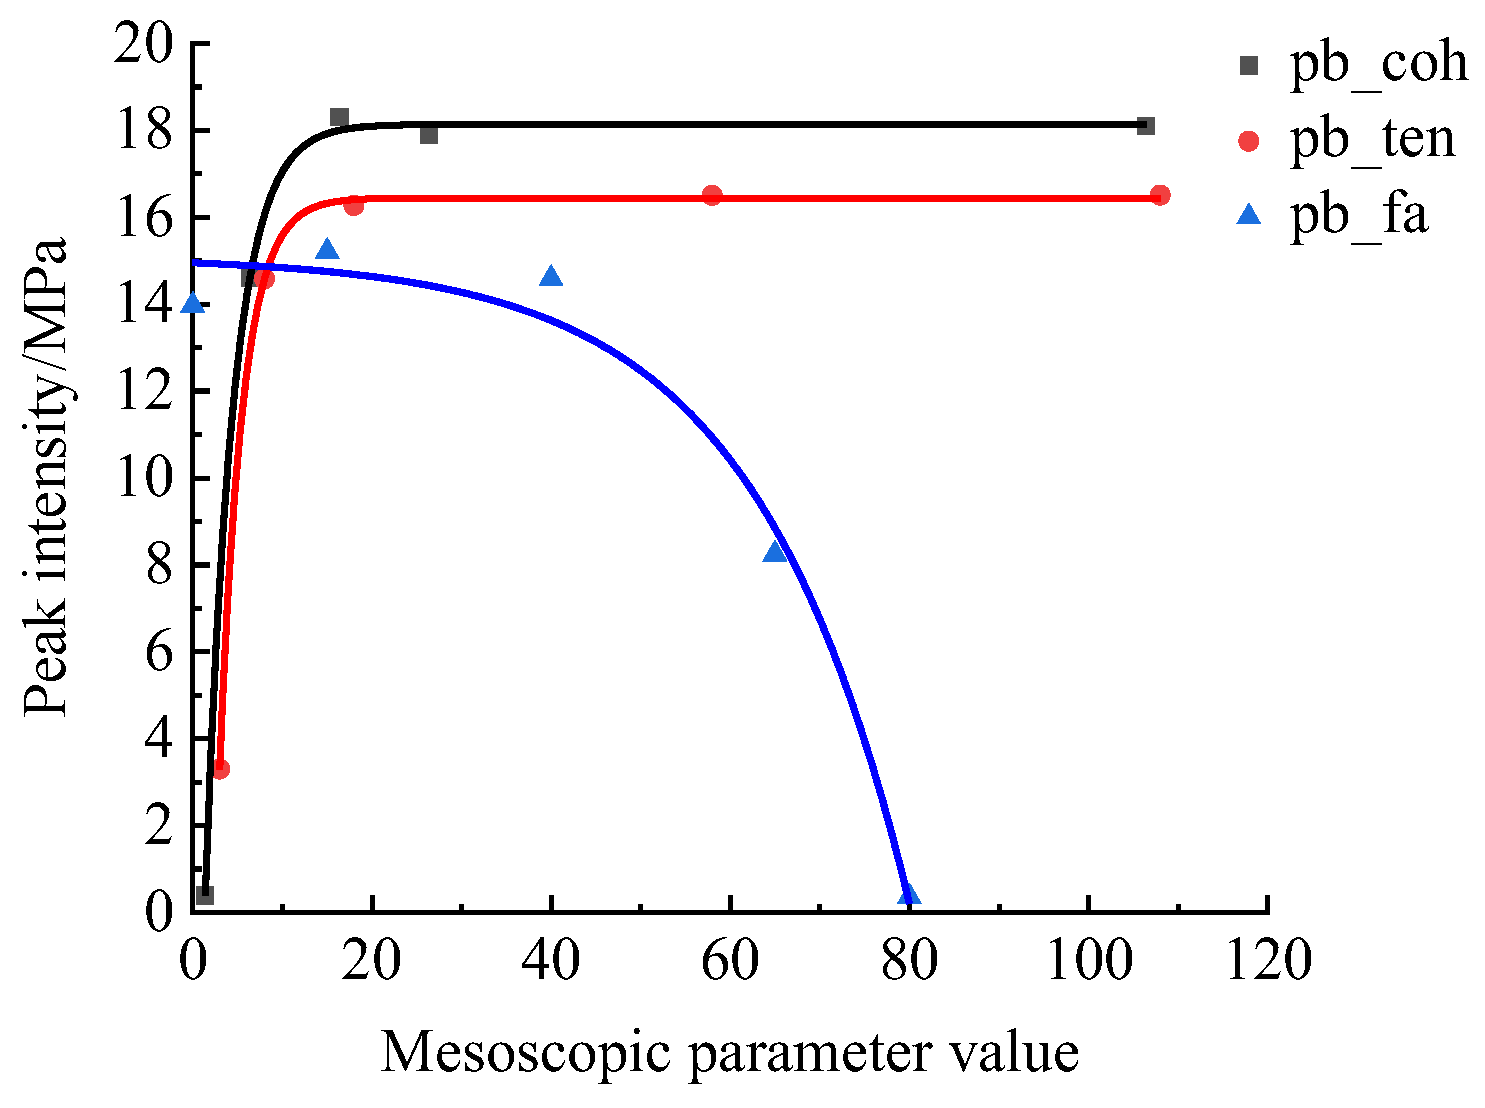
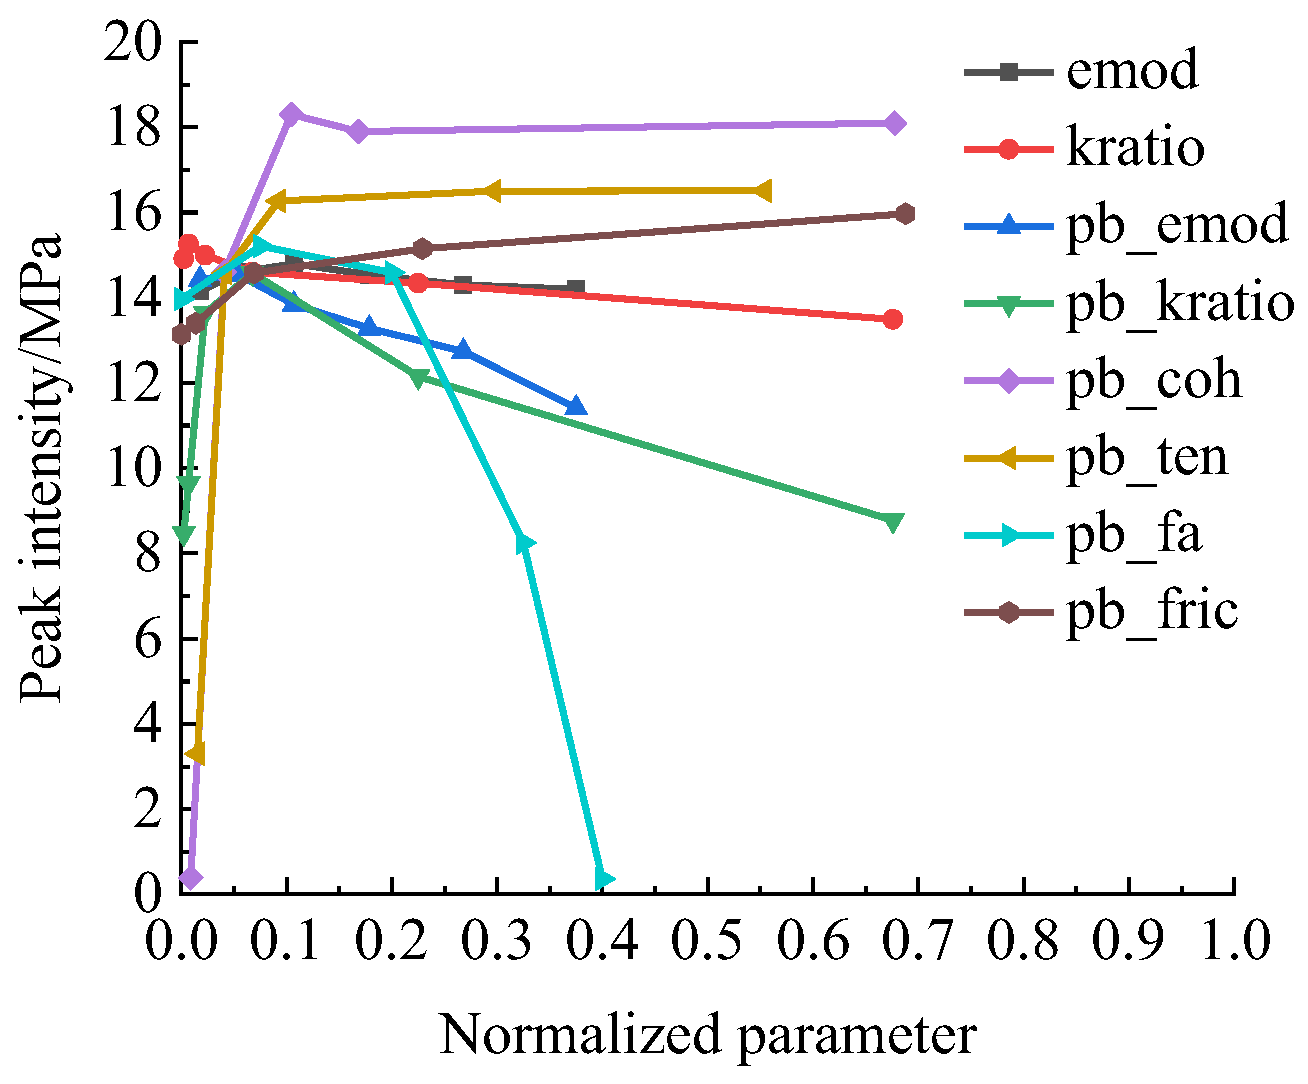
4.2.1. Sensitivity Analysis of Peak Intensity
- σ—peak intensity (MPa);
- —pb_coh (MPa);
- —pb_fa (MPa); and
- —pb_ten (°).
- —ultimate shear stress under normal stress (MPa);
- —cohesion of rock (MPa); and
- —internal friction angle of rock (°).
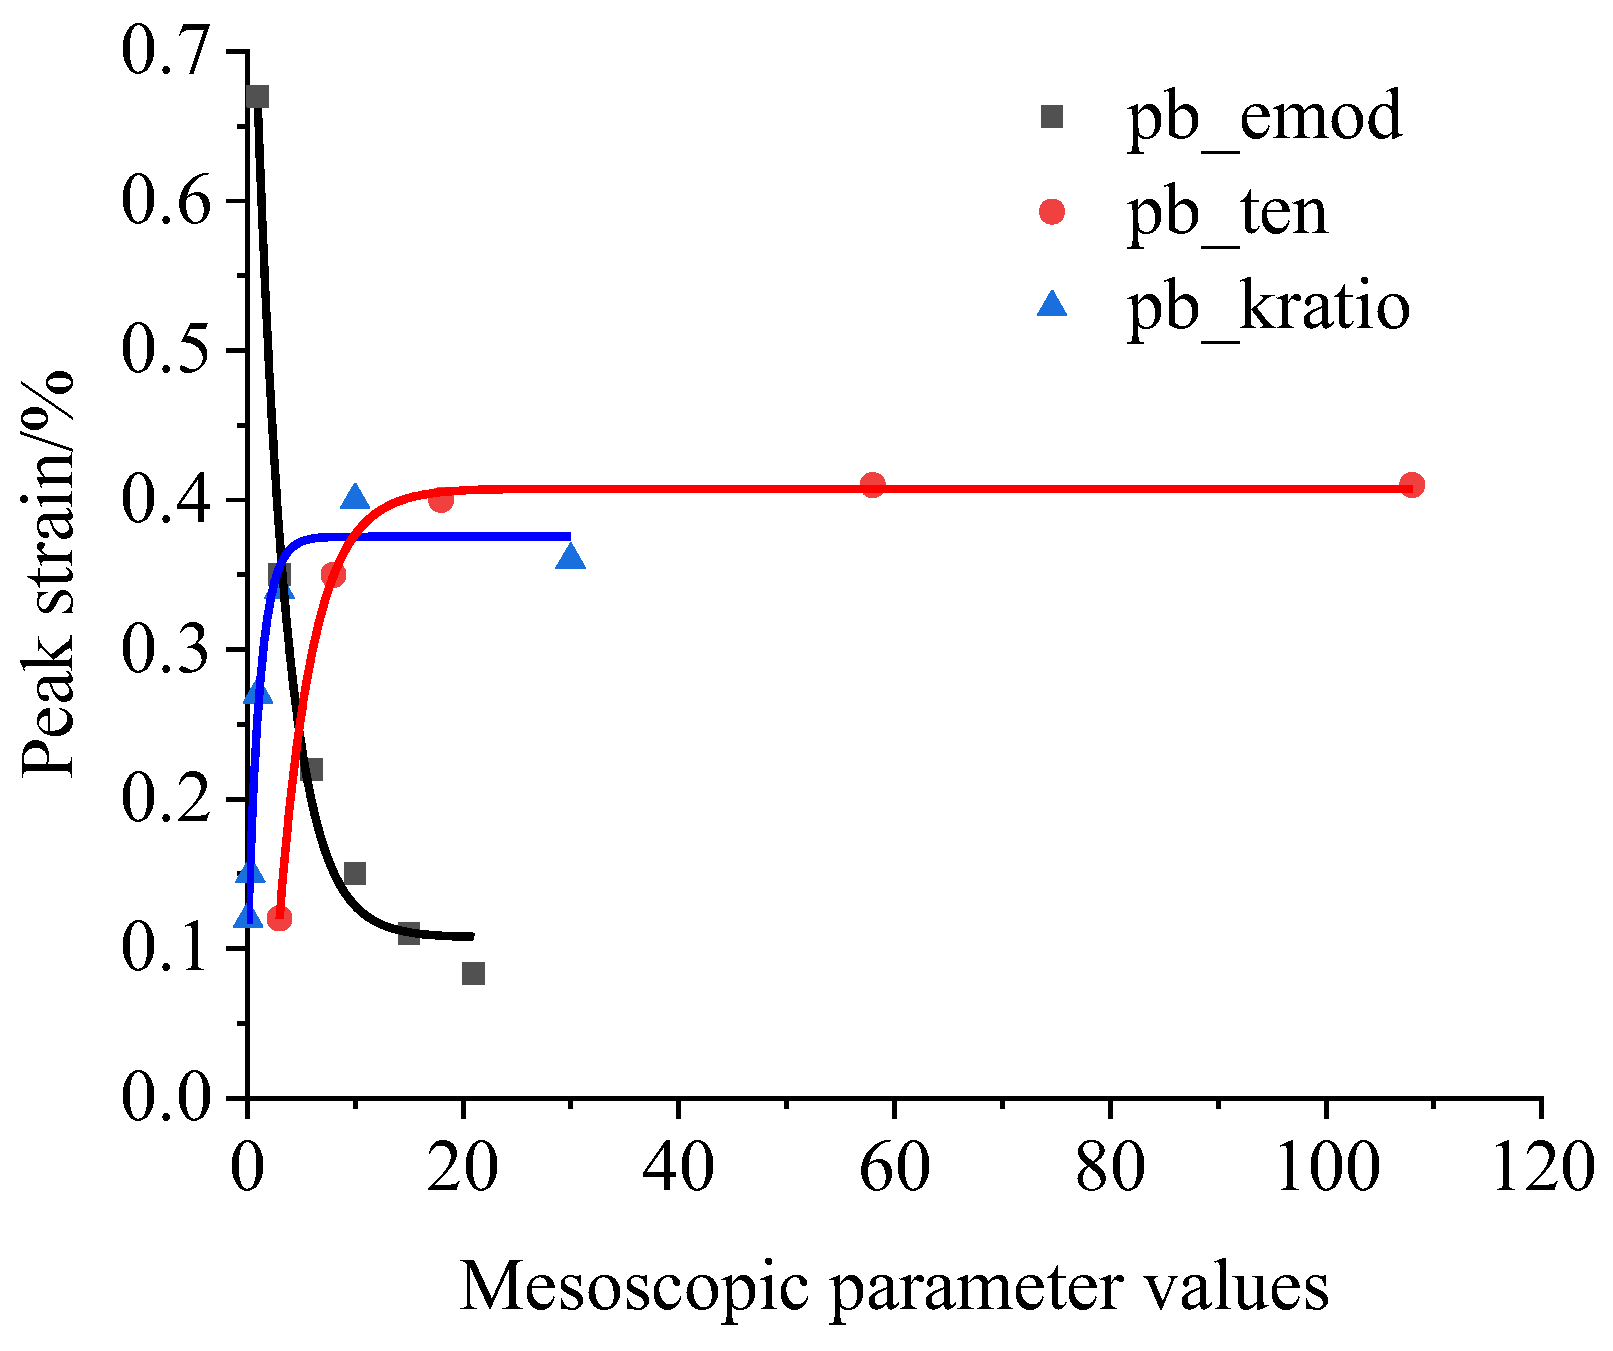
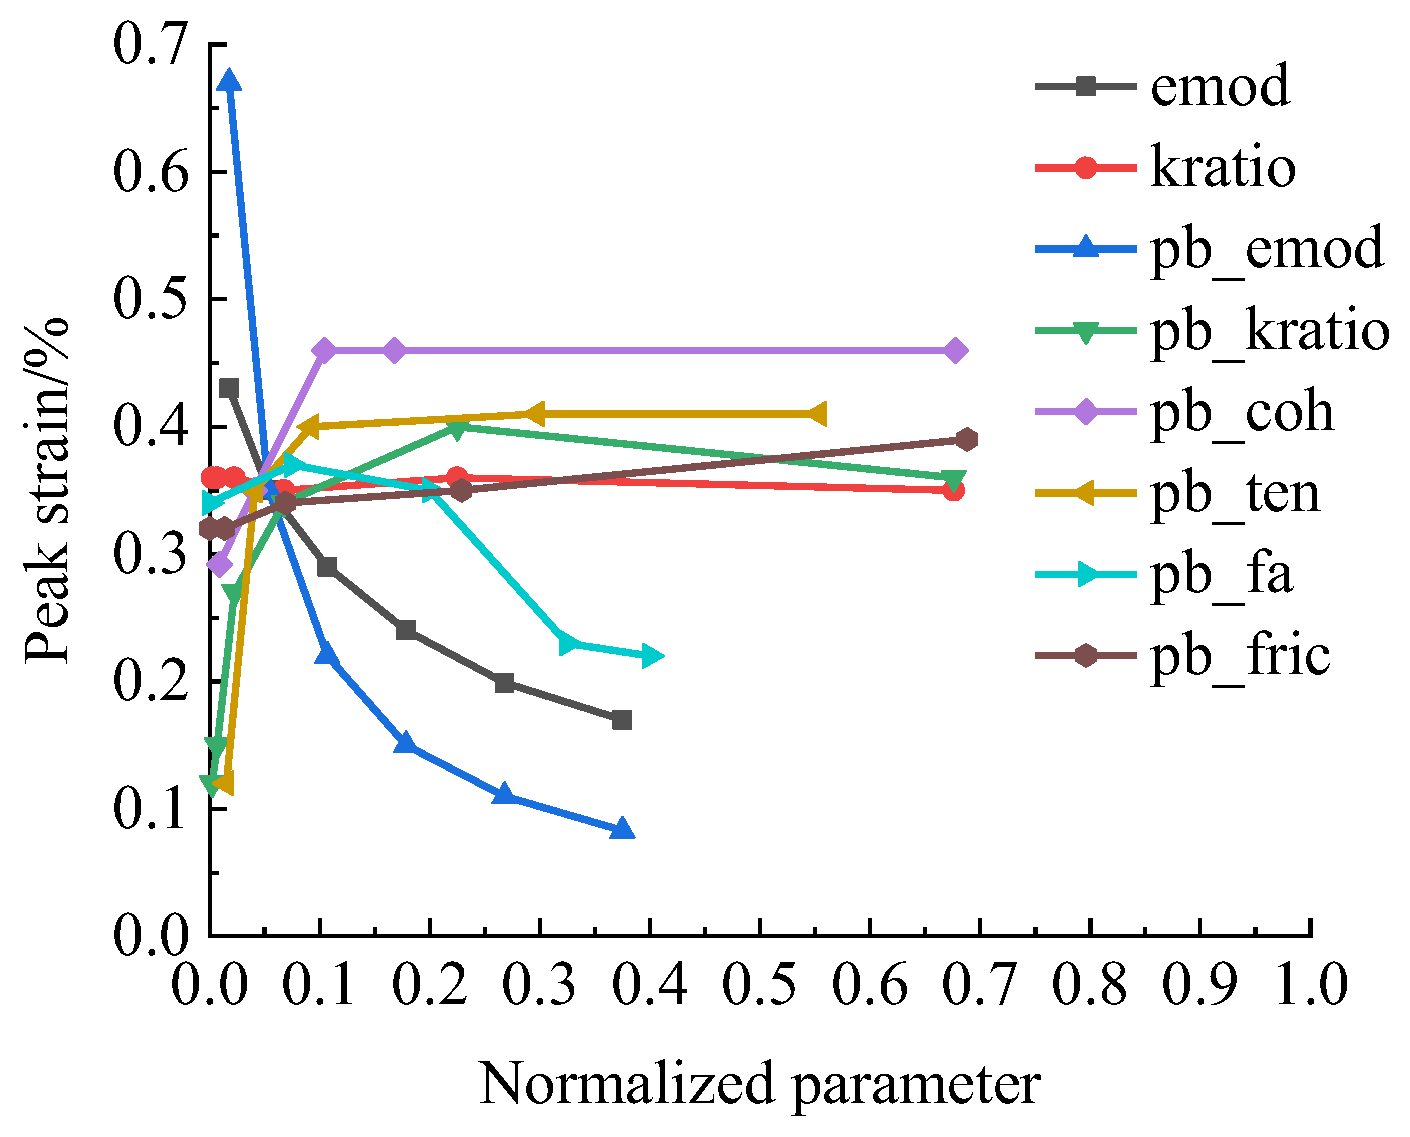
4.2.2. Peak Strain Sensitivity Analysis
- —peak strain (%);
- —pb_emod (MPa);
- —pb_ten (MPa); and
- —pb_kratio.
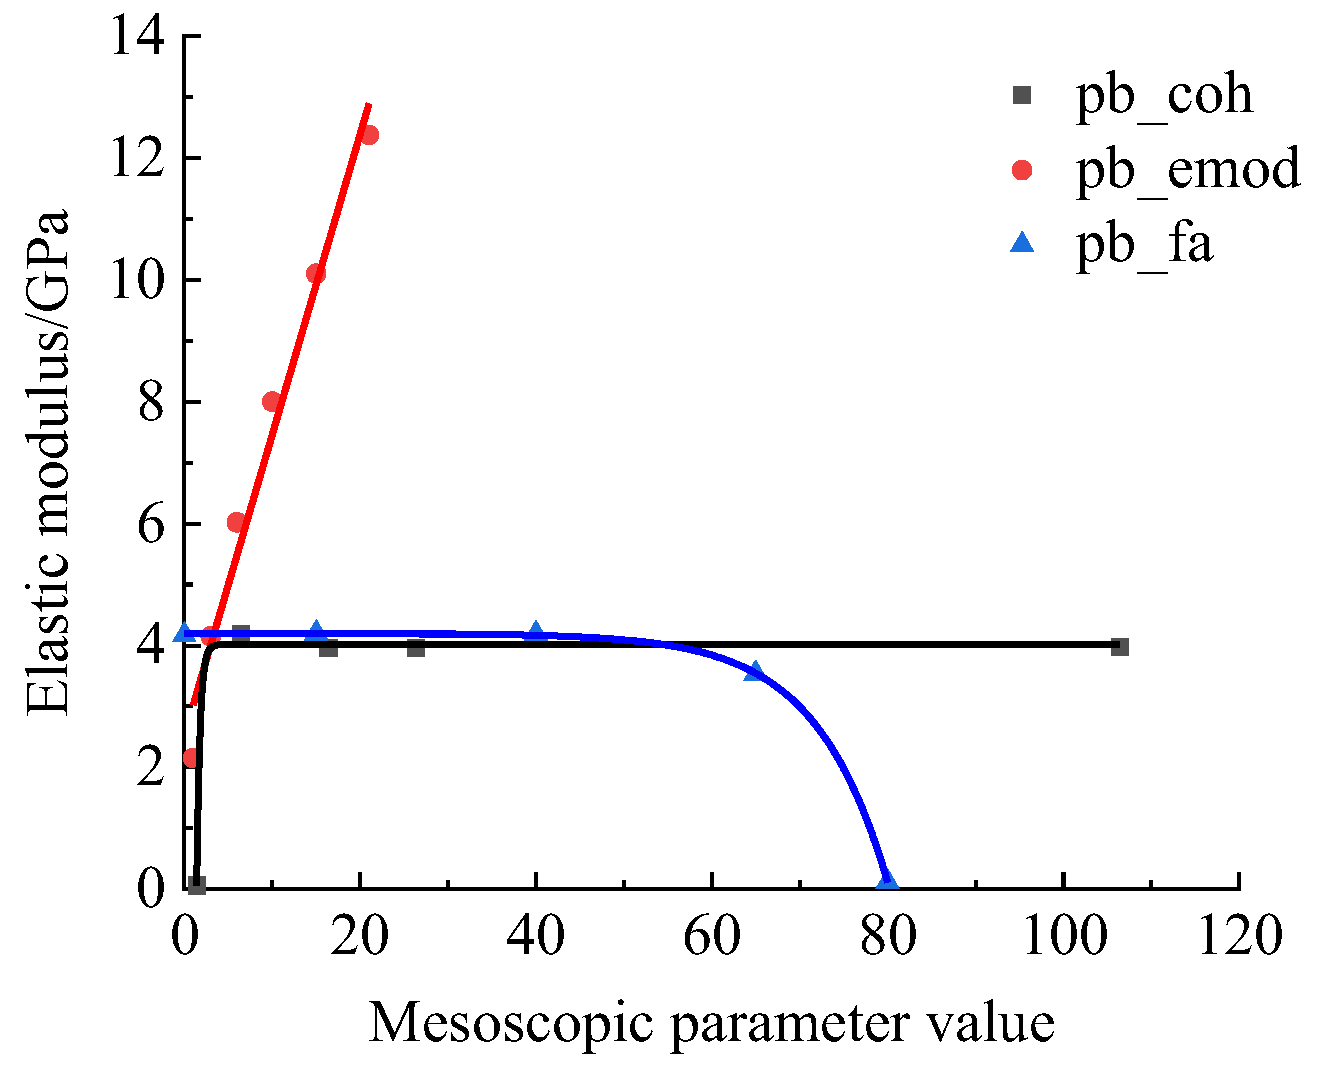
4.2.3. Sensitivity Analysis of Elastic Modulus
- —Young’s modulus (GPa);
- —pb_coh (MPa);
- —pb_emod (MPa); and
- —pb_fa (°).
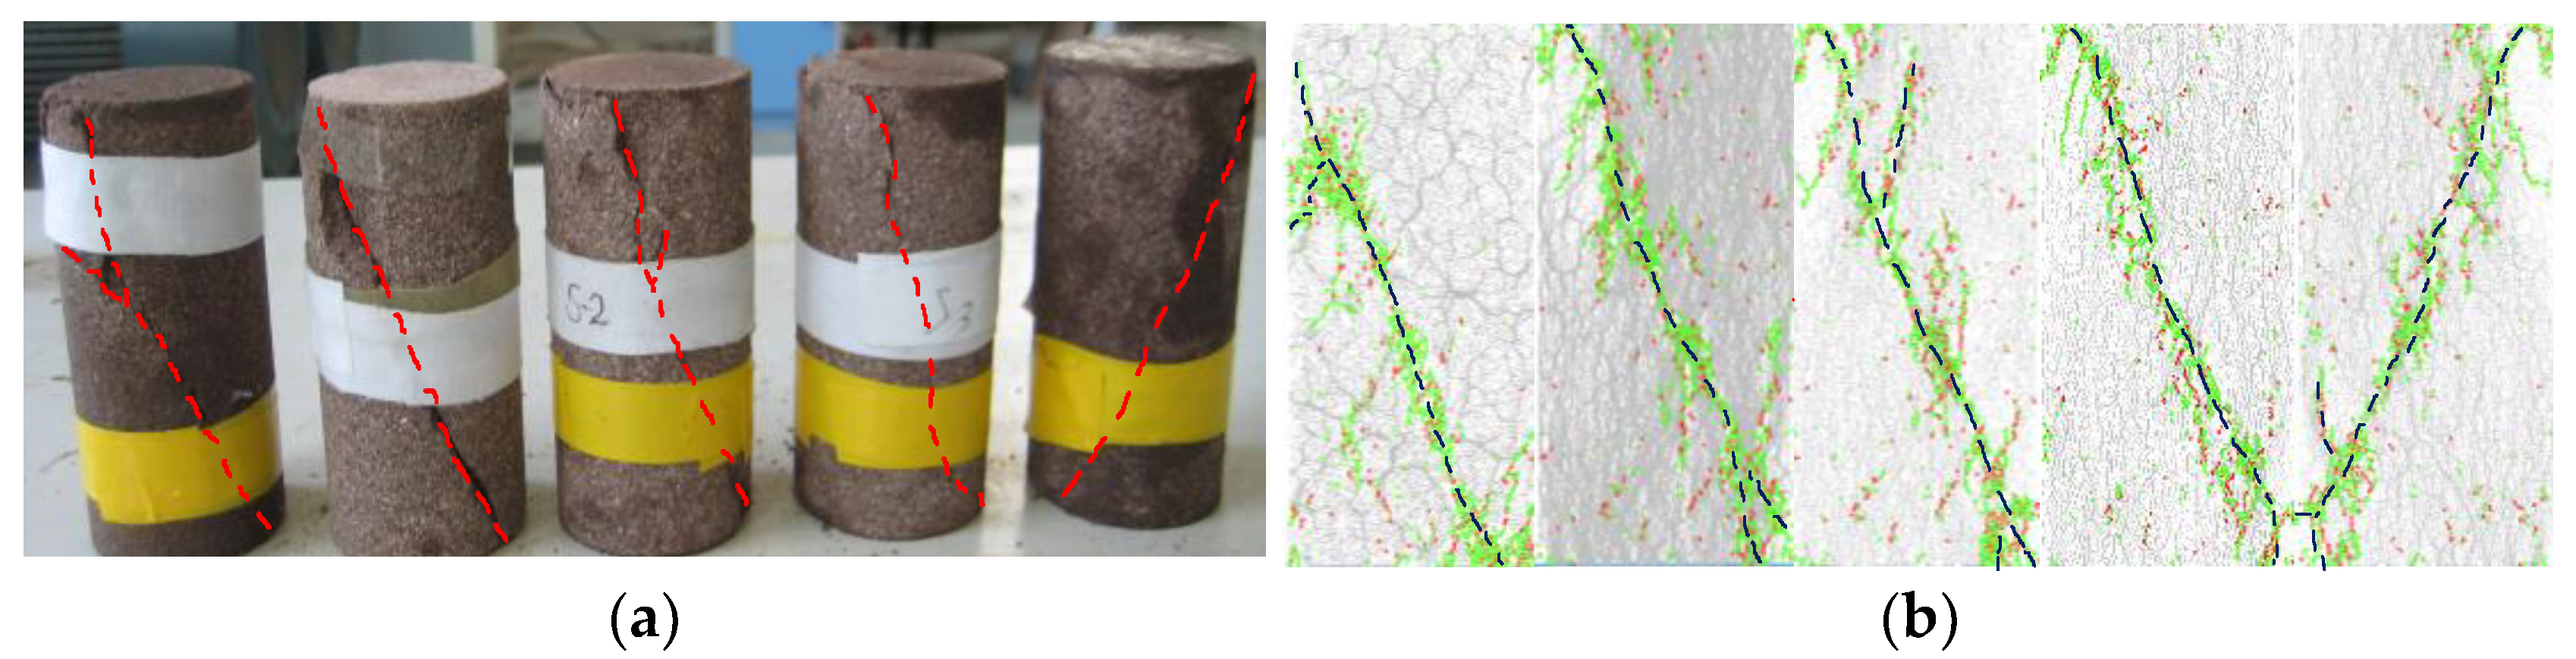
4.3. Analysis of Breakage of Specimen
5. Conclusions
- Typical weakly cemented coarse sandstone, which was collected onsite, was subjected to meso-structure and uniaxial compression experiments. The results show that the mesoscopic structure of the rock is characterized by numerous pores and that the distribution of fine particles is loose; that the uniaxial compressive strength of the rock ranges from 8.35 to 14.7 MPa, with an average value of 11.83 MPa; that the strength of the rock is extremely low; and that the rock is evidently characterized by looseness and weakness.
- The degrees of influence of mesoscopic parameters on the peak strength of weakly cemented rock can be divided into three grades from high to low: grade I includes the parallel bond cohesion, parallel bond tensile strength, and parallel bond friction angle; grade II includes the parallel bond stiffness ratio, parallel bond friction coefficient, and parallel bond effective modulus; and grade III includes the particle effective modulus and particle stiffness ratio.
- The degrees of influence of mesoscopic parameters on peak strain can similarly be divided into three grades from high to low: grade I includes the parallel bond effective modulus, parallel bond tensile strength, and parallel bond stiffness ratio; grade II includes the particle effective modulus, parallel bond cohesion, and parallel bond friction angle; and grade III includes the particle stiffness ratio and parallel bond friction coefficient.
- The degrees of influence of mesoscopic parameters on the elastic modulus can also be divided into three grades from high to low: grade I includes the parallel bond cohesion, parallel bond effective modulus, and parallel bond friction angle; grade II includes the particles effective modulus, parallel bond stiffness ratio, and parallel bond tensile strength; and grade III includes the particle stiffness ratio and parallel bond friction coefficient.
Author Contributions
Funding
Data Availability Statement
Conflicts of Interest
References
- Liu, L.J.; Cao, Z.; Wang, J.J. Selection methods of rock micro—Parameters based on the linear parallel bond contact model. J. Water Res. Const. Eng. 2017, 15, 123–128. [Google Scholar]
- Cong, Y.; Wang, Z.Q.; Zheng, Y.R.; Feng, X.T. Experimental study on microscopic parameters of brittle materials based on particle flow theory. Chin. J. Geotech. Eng. 2015, 37, 1031–1040. [Google Scholar]
- Cheng, A.P.; Tan, C.S.; Wang, W.Q.; Nie, D.Q.; Li, N.C. Sensibility analysis of backfill microscopic parameters based on particle flow theory. Met. Mine 2016, 45, 165–169. [Google Scholar]
- Chen, P.Y.; Kong, Y.; Zhu, H.M. Research on the calibration method of microparameters of a uniaxial compression PFC2DModel for rock. Chin. J. Und. Sp. Eng. 2018, 14, 1240–1249. [Google Scholar]
- Jiang, M.J.; Fang, W.; Sima, J. Calibration of micro-parameters of parallel bonded model for rocks. J. Shandong Univ. Eng. Sci. 2015, 45, 50–56. [Google Scholar]
- Song, C.Y.; Ning, F.B. Progress on the association between mesostructural parameters and macromechanical behaviors of weakly cemented rocks. Met. Mine 2018, 47, 1–9. [Google Scholar]
- Xu, M.; Liu, X.S. Influence of particle friction coefficient on mechanical characteristics of cemented sandstone. J. Cent. South Univ. Nat. Sci. Ed. 2014, 45, 299–305. [Google Scholar]
- Huang, Y.S.; Xia, X.D. Calibration method of mesoscopic parameters for parallel bonding model of sandstone particle flow. J. China Three Gorges Univ. Nat. Sci. 2021, 43, 7–12. [Google Scholar]
- Hou, X.G. Mechanical Properties and Acoustic Emission Characteristics of Weakly Cemented Sandstone under Uniaxial Compression; Northeast University: Liaoning, China, 2014. [Google Scholar]
- Liu, X.S.; Xu, M. Effects of particle size distribution on mechanical characteristics of cemented sandstone. J. China Univ. Petro. Nat. Sci. 2014, 38, 142–148. [Google Scholar]
- Liu, X.S.; Dong, C.J. Research on mechanical characteristics of the cemented sandstone based on 3Dimensional PFC numerical model. J. Chongqing Univ. 2013, 36, 37–44. [Google Scholar]
- Meng, Q.B.; Liu, J.F.; Huang, B.X.; Pu, H.; Wu, J.Y.; Zhang, Z.Z. Effects of confining pressure and temperature on the energy evolution of rocks under triaxial cyclic loading and unloading conditions. Rock Mech. Rock Eng. 2022, 55, 773–798. [Google Scholar] [CrossRef]
- Shi, C.; Zhang, Q.; Wang, S.N. Numerical Simulation Technology and Application with Particle Flow (PFC5.0), 1st ed.; China Architecture and Building Press: Beijing, China, 2018; pp. 259–260. [Google Scholar]
- Guo, H.; Wang, P.; Zhang, K.Q.; Zhang, Z.W.; Ma, S.S.; Chen, N.Y. Microscopic parameter calibration of parallel bonding model in DEM simulation. China Sciencepap. 2019, 14, 610–613. [Google Scholar]
- Obermayr, M.; Dressler, K.; Vrettos, C.; Eberhard, P. A bonded-particle model for cemented sand. Comput. Geotech. 2013, 49, 299–313. [Google Scholar] [CrossRef]
- Potyondy, D.O.; Cundall, P.A. A bonded-particle model for rock. Int. J. Rock Mech. Min. Sci. 2004, 41, 1329–1364. [Google Scholar] [CrossRef]
- Filgueira, U.C.; Alejano, L.R.; Arzúa, J.; Ivars, D.M. Sensitivity analysis of the micro-parameters used in a PFC analysis towards the mechanical properties of rocks. Procedia Eng. 2017, 191, 488–495. [Google Scholar] [CrossRef]
- Holt, R.M.; Kjølaas, J.; Larsen, I.; Li, L.; Pillitteri, A.G.; Sønstebø, E.F. Comparison between controlled laboratory experiments and discrete particle simulations of the mechanical behaviour of rock. Int. J. Rock Mech. Min. Sci. 2005, 42, 985–995. [Google Scholar] [CrossRef]
- Yoon, J. Application of experimental design and optimization to PFC model calibration in uniaxial compression simulation. Int. J. Rock Mech. Min. Sci. 2007, 44, 871–889. [Google Scholar] [CrossRef]
- Li, X.; Peng, J.; Xie, Y.; Li, Q.; Zhou, T.; Wang, J.; Zheng, W. Influence of high-temperature treatment on strength and failure behaviors of a quartz-rich sandstone under true triaxial condition. Lithosphere 2022, 2022, 3086647. [Google Scholar] [CrossRef]
- Wei, Z.H. Research on the Geomaterials Structure; Beijing Jiaotong University: Beijing, China, 2012. [Google Scholar]
- Sun, L.H.; Ji, H.G.; Jiang, H.; Zeng, P.; Yang, B.S. Experimental study on characteristics of broken caving and regularity of compaction deformation of rocks in caving zone in the weakly cemented strata. J. China Coal Soc. 2017, 42, 2565–2572. [Google Scholar]
- Zhang, X.; Li, X.; Liu, Y.; Liu, W.; Li, Q.; Li, L. Experimental study on crack propagation and failure mode of fissured shale under uniaxial compression. Theor. Appl. Fract. Mec. 2022, 121, 103512. [Google Scholar] [CrossRef]
- Ji, S.Y. The Quasi-solid-liquid phase transition of non-uniform granular materials and their constitutive equation. Chin. J. Mech. 2007, 39, 223–237. [Google Scholar]
- Song, C.Y. The Analysis Application of Mesoscopic Structure Characteristic and Deformation and Failure Mechanism of Weak Cemented Sandstone; University of Science and Technology Beijing: Beijing, China, 2017. [Google Scholar]
- Li, X.; Li, Q.; Hu, Y.; Chen, Q.; Peng, J.; Xie, Y.; Wang, J. Study on three-dimensional dynamic stability of open-pit high slope under blasting vibration. Lithosphere 2022, 2021, 6426550. [Google Scholar] [CrossRef]
- Li, X.; Li, Q.; Hu, Y.; Teng, L.; Yang, S. Evolution characteristics of mining fissures in overlying strata of stope after converting from open-pit to underground. Arab. J. Geosci. 2021, 14, 2795. [Google Scholar] [CrossRef]
- Sun, L.H.; Ji, H.G.; Yang, B.S. Physical and mechanical characteristic of rocks with weakly cemented strata in Western representative mining area. J. China Coal Soc. 2019, 44, 865–873. [Google Scholar]
- Cao, X.S.; Lai, X.Y.; E, L.S.; Li, G.W.; Yuan, J.P.; Wu, J.T. Study on the influence of parallel bond parameters in PFC2D on the direct shear strength parameters. J. Hebei Univ. Eng. Nat. Sci. 2019, 36, 16–20. [Google Scholar]
- Zhao, G.Y.; Dai, B.; Ma, C. Study of effects of microparameters on macroproperties for parallel bonded model. Chin. J. Rock Mech. Eng. 2012, 31, 1491–1498. [Google Scholar]
- Chen, J.T.; Li, H.; Chu, Y.Y.; Zhang, Y.; Tang, D.Z.; Zhu, J.; Li, W.X.; Wang, K.Y. Influence of stiffness difference on rock fracture based on particle flow simulation. J. ShandongUniv. Sci. Technol. Nat. Sci. 2022, 41, 51–59. [Google Scholar]
- Liu, X.S.; Xu, M.; Xiong, W.H. Effect of change in particle stiffness on the mechanical response of cemented sandstone. J. Beijing Univ. Sci. Technol. 2014, 36, 1427–1435. [Google Scholar]
- Abi, E.; Zheng, Y.R.; Feng, X.T.; Cong, Y. Relationship between particle micro and macro mechanical parameters of parallel-bond model. Rock Soil Mech. 2018, 39, 1289–1301. [Google Scholar]
- Saadat, M.; Taheri, A. A numerical approach to investigate the effects of rock texture on the damage and crack propagation of apre-cracked granite. Comput. Geotech. 2019, 111, 89–111. [Google Scholar] [CrossRef]


| Samples | Density ρ (kg·m−1) | Elastic Modulus E/GPa | Compressive Strength σc/MPa | Peak Strain ε/% |
|---|---|---|---|---|
| S-1 | 2440 | 1.75 | 13.5 | 0.63 |
| S-2 | 2460 | 3.48 | 14.7 | 0.35 |
| S-3 | 2380 | 2.65 | 12.0 | 0.37 |
| S-4 | 2320 | 1.79 | 8.35 | 0.51 |
| S-5 | 2420 | 2.03 | 10.6 | 0.47 |
| Rock Category | Minimum Particle Radius Rmin/mm | Ratio of Particle Radius Rmax/Rmin | Friction Coefficient | Particle Density ρ (kg·m−1) | Particle Effective Modulus Ec*/GPa | Particle Stiffness Ratio kn/ks |
|---|---|---|---|---|---|---|
| Weakly cemented coarse sandstone | 0.35 | 1:1.66 | 0.3 | 2460 | 3.1 | 3.0 |
| Parallel Bond Effective Modulus /GPa | Parallel Bond Stiffness Ratio | Parallel Bond Cohesion pb-coh/MPa | Parallel Bond Tensile Strength pb-ten/MPa | Parallel Bond Friction Angle pb-fa (°) | Parallel Bond Friction Coefficient | |
| 3.1 | 3.0 | 6.4 | 8 | 40 | 0.3 | |
| Group | Mesoscopic Parameter Name | Value | |
|---|---|---|---|
| Parallel Bond Material Group | Linear Group | emod/GPa | 1 3 6 10 15 21 |
| Kratio | 0.1 0.3 1 3 10 30 | ||
| Parallel Bond Group | pb_emod/GPa | 1 3 6 10 15 21 | |
| pb_kratio | 0.1 0.3 1 3 10 30 | ||
| pb-coh/MPa | 1.4 6.4 16.4 56.4 106.4 | ||
| pb-ten/MPa | 3 8 18 58 108 | ||
| pb_fric | 0 0.06 0.3 1 3 | ||
| pb_fa (°) | 0 15 40 65 80 | ||
| Mesoscopic Parameters | Extent of Peak Increase/% | Extent of Peak Decrease/% | Grade |
|---|---|---|---|
| pb-coh | 454.1 | 97.8 | I |
| pb_fa | 412.5 | 97.6 | I |
| pb-ten | 400.3 | 80.0 | I |
| pb_kratio | 72.14 | 41.9 | II |
| pb_emod | 27.5 | 21.6 | III |
| pb_fric | 21.5 | 17.7 | III |
| kratio | 13.12 | 11.6 | III |
| emod | 4.2 | 4.1 | III |
| Mesoscopic Parameters | Extent of Strain Increase/% | Extent of Strain Decrease/% | Grade |
|---|---|---|---|
| pb_emod | 707.2 | 87.6 | I |
| pb-ten | 241.6 | 70.7 | I |
| pb_kratio | 233.3 | 70 | I |
| emod | 152.9 | 60.47 | II |
| pb_fa | 68.2 | 40.5 | II |
| pb-coh | 57.53 | 36.5 | II |
| pb_fric | 21.9 | 18 | III |
| kratio | 2.85 | 2.78 | III |
| Mesoscopic Parameters | Extent of Elastic Modulus Increase/% | Extent of Elastic Modulus Decrease/% | Grade |
|---|---|---|---|
| pb-coh | 639.1 | 98.45 | I |
| pb_emod | 475.8 | 82.6 | I |
| pb_fa | 352 | 97.2 | I |
| emod | 139.7 | 58.3 | II |
| pb_kratio | 98.8 | 49.7 | II |
| pb-ten | 91.4 | 47.75 | II |
| kratio | 8 | 7.45 | III |
| pb_fric | 4.2 | 4 | III |
Publisher’s Note: MDPI stays neutral with regard to jurisdictional claims in published maps and institutional affiliations. |
© 2022 by the authors. Licensee MDPI, Basel, Switzerland. This article is an open access article distributed under the terms and conditions of the Creative Commons Attribution (CC BY) license (https://creativecommons.org/licenses/by/4.0/).
Share and Cite
Sun, L.; Jiang, Z.; Long, Y.; Ji, Q.; Wang, Z.; Fan, Y.; Hao, Y. Influence of Mesoscopic Parameters of Weakly Cemented Rocks on Macroscopic Mechanical Properties. Sustainability 2022, 14, 13308. https://doi.org/10.3390/su142013308
Sun L, Jiang Z, Long Y, Ji Q, Wang Z, Fan Y, Hao Y. Influence of Mesoscopic Parameters of Weakly Cemented Rocks on Macroscopic Mechanical Properties. Sustainability. 2022; 14(20):13308. https://doi.org/10.3390/su142013308
Chicago/Turabian StyleSun, Lihui, Zhixin Jiang, Yaxin Long, Quancai Ji, Zongze Wang, Yu Fan, and Yingbin Hao. 2022. "Influence of Mesoscopic Parameters of Weakly Cemented Rocks on Macroscopic Mechanical Properties" Sustainability 14, no. 20: 13308. https://doi.org/10.3390/su142013308
APA StyleSun, L., Jiang, Z., Long, Y., Ji, Q., Wang, Z., Fan, Y., & Hao, Y. (2022). Influence of Mesoscopic Parameters of Weakly Cemented Rocks on Macroscopic Mechanical Properties. Sustainability, 14(20), 13308. https://doi.org/10.3390/su142013308