Article

Optimal Power Dispatch of DGs in Radial and Mesh AC Grids: A Hybrid Solution Methodology between the Salps Swarm Algorithm and Successive Approximation Power Flow Method

by
Andrés Alfonso Rosales-Muñoz
1,*,
Jhon Montano
2,
Luis Fernando Grisales-Noreña
1,*,
Oscar Danilo Montoya
3,4 and
Fabio Andrade
5
1
MATyER Research Group, Faculty of Engineering, Instituto Tecnológico Metropolitano, Robledo Campus, Medellín 050036, Colombia
2
Department of Electronics and Telecommunications, Instituto Tecnológico Metropolitano, Medellín 050028, Colombia
3
Grupo de Compatibilidad e Interferencia Electromagnética, Facultad de Ingeniería, Universidad Distrital Francisco José de Caldas, Bogotá 110231, Colombia
4
Laboratorio Inteligente de Energía, Universidad Tecnológica de Bolívar, Cartagena 131001, Colombia
5
Electrical and Computer Engineering Department, University of Puerto Rico at Mayaguez, Mayaguez, PR 00680, USA
*
Authors to whom correspondence should be addressed.
Sustainability 2022, 14(20), 13408; https://doi.org/10.3390/su142013408
Submission received: 15 September 2022 / Revised: 13 October 2022 / Accepted: 13 October 2022 / Published: 18 October 2022
(This article belongs to the Special Issue Smart Grid Technologies and Applications)

Abstract

:
In this paper, we address the problem of the optimal power dispatch of Distributed Generators (DGs) in Alternating Current (AC) networks, better known as the Optimal Power Flow (OPF) problem. We used, as the objective function, the minimization of power losses ( P l o s s ) associated with energy transport, which are subject to the set of constraints that compose AC networks in an environment of distributed generation. To validate the effectiveness of the proposed methodology in solving the OPF problem in any network topology, we employed one 10-node mesh test system and three radial text systems: 10, 33, and 69 nodes. In each test system, DGs were allowed to inject 20 % , 40 % , and 60 % of the power supplied by the slack generator in the base case. To solve the OPF problem, we used a master–slave methodology that integrates the optimization method Salps Swarm Algorithm (SSA) and the load flow technique based on the Successive Approximation (SA) method. Moreover, for comparison purposes, we employed some of the algorithms reported in the specialized literature to solve the OPF problem (the continuous genetic algorithm, the particle swarm optimization algorithm, the black hole algorithm, the antlion optimization algorithm, and the Multi-Verse Optimizer algorithm), which were selected because of their excellent results in solving such problems. The results obtained by the proposed solution methodology demonstrate its superiority and convergence capacity in terms of minimization of P l o s s in both radial and mesh systems. It provided the best reduction in minimum P l o s s in short processing times and showed excellent repeatability in each test system and scenario under analysis.

1. Introduction

1.1. General Context

As is well known, access to electricity is a fundamental right and is one of the United Nations’ Sustainable Development Goals, given its importance in the development of society, as electricity provides comfort and a wide range of benefits for people [1,2,3,4]. However, its consumption has risen exponentially in recent years, and its misuse has caused severe environmental and economic impacts on the planet due to the increased CO2 emissions and higher operating costs associated with its distribution [5,6,7]. Different solutions to these problems have been sought, including the development of new energy management technologies and strategies to increase electricity production around the world, as well as the development and application of new energy distribution technologies such as Distributed Generators (DGs) [8] and energy storage elements (e.g., batteries, capacitors, ultracapacitors, and superinductors) [9]. These solutions have lead us to reconsider the way conventional energy transport systems operate [10]. For the above reasons, network operators and researchers in this field have looked for energy alternatives other than fossil fuels and proposed the use of renewable energies and the integration of DGs into electric networks to meet energy demands while remaining environmentally friendly [11,12,13].
The integration of DGs into an Alternating Current (AC) network helps to minimize the system’s power losses ( P l o s s ), improve the voltage profiles, and reduce the currents flowing through the distribution lines, which could reduce the gauge of the conductor being employed, and thus the costs associated with energy distribution within the AC system, while respecting the technical and operational constraints of this type of electrical system. The positive or negative effects of installing DGs in electrical networks are closely related to their level of power injection, which depends on the power demanded by users and the characteristics of the electrical system itself [11,14,15].
The problem of the optimal power dispatch of DGs in electrical power networks is known as the Optimal Power Flow (OPF) problem, which entails determining the power to be injected by each DG to meet the goal established by the network operator. In this study, we selected the reduction in P l o s s as the objective function [16,17,18]. Importantly, to solve the OPF problem, it should be divided into two stages. The master stage is the first one. This is responsible for proposing the optimal power levels to be supplied by each DG in the AC networks, which are linked to their minimum and maximum power levels. The slave state is the second one. This is in charge of solving the power flow problem and evaluates the impact of each solution proposed by the master stage in the objective function and constraints that represent the problem under analysis. In this way, the slave stage allows us to determine both the P l o s s and the nodal voltages for each of the solutions proposed in the master stage [15,18,19]. The OPF problem is considered a nonlinear nonconvex problem that must be solved using methods that produce high-quality solutions in short processing times. Thus, we propose using numerical methods and optimization algorithms that allow us to find the global optimum for the objective function of the OPF problem [8,20,21,22,23].

1.2. State of the Art

In recent years, various authors have proposed solutions to the OPF problem in AC networks, with the goal of achieving proper power dispatch into the network and obtaining benefits from power injection by DGs. Some of the objective functions that have been used for this purpose are: (i) the minimization of P l o s s associated with the optimal location and sizing of DGs in the network, (ii) the proper management of energy through energy storage systems, (iii) the reduction of C O 2 emissions, and (iv) the minimization of related costs [24]. Considering the intelligent operation of DGs, the OPF problem in AC networks seeks (in most of the reported cases) to minimize the P l o s s associated with energy distribution [14]. To solve this problem, different studies in the specialized literature have proposed using commercial software, as well as optimization techniques based on sequential programming that can be replicated using open source software [17]. These solution methodologies help to determine the power levels to be injected by the DGs in order to minimize P l o s s in AC networks and ensure that the set of constraints that compose the OPF problem are respected [8,17,22,23].
The authors of [25,26,27] used commercial software to solve the problem of OPF in AC grids. In the particular case of [25], the OPF problem was tested in the IEEE 14- and 30-node systems, and a multi-objective mixed integer nonlinear programming model was proposed. The problem was modeled in the software GAMS (General Algebraic Modeling System) and solved using DICOPT solver. As objective functions, the authors of such study considered the reduction in total fuel cost, the minimization of active power losses, and the improvement of the system’s loadability. Their proposed model produced excellent results in terms of solution quality, and was compared with the following techniques: the Differential Evolution (DE) algorithm, Sequential Quadratic Programming (SQP), and Particle Swarm Optimization (PSO). Moreover, the authors analyzed processing times, as well as the reduction in minimum P l o s s , but did not evaluate the currents flowing through the lines (as part of the constraints), the repeatability of the obtained solutions, and the behavior of the proposed solution methodology in larger networks. In [26], the authors employed the PSO algorithm and DigSILENT as the solver, with the minimization of P l o s s as the objective function. The simulations were carried out in the 9- and 22-node test systems, taking into account the costs associated with power generation and the nodal voltages. In such study, however, the currents flowing through the lines and the processing times and standard deviations of the proposed solution methodology were not considered. In [27], the authors used a discrete-continuous programming method, which employs the Chu & Beasley genetic algorithm to identify the power levels to be injected by the DGs. They also employed DigSILENT to solve the load flow problem using as objective function the minimization of P l o s s in the 6-, 14-, and 39-node test systems under four different scenarios. The authors of such study took into account the nodal voltages, the processing times, and the loadability of the lines, but did not take into account the standard deviations of the proposed solution technique when executed (the repeatability of the solution was not analyzed). Additionally, the proposed solution methodology was not compared with other techniques, which does not allow the impact of its solution to be measured.
Furthermore, open-source software that uses optimization techniques based on sequential programming has been widely employed in the specialized literature to solve the OPF problem in AC networks, avoiding the need for commercial software, which is costly and highly complex [28,29,30]. For instance, in [28], the authors employed the Artificial Bee Swarm Optimization (ABSO) algorithm, with the minimization of P l o s s in AC networks as the objective function, and tested it in the IEEE 18- and 30-node test systems. They considered the nodal voltages bounds, without analyzing the processing times and standard deviations of the solution obtained; as well as the currents limits assigned to the lines (as part of the set of constraints). In [29], a bio-geography-based optimization algorithm was proposed, having, as the objective function, the minimization of P l o s s in the IEEE 30- and 57-node test systems. In such study, the authors took into account the processing times to evaluate the efficiency of the proposed solution methodology, but did not analyze the repeatability of the obtained solutions. Additionally, the currents flowing through the conductors of the AC network were not considered as part of the set of constraints proposed in the mathematical formulation. In [30], the PSO algorithm and two of its variants (TPSO and TCPSO) were used to solve the OPF problem, with the objective function being the minimization of P l o s s in the IEEE 57- and 118-node test systems. In such study, the authors took into account the nodal voltages (as part of the operational constraints) of the test systems under analysis, but did not consider the currents flowing through the conducting lines. Likewise, they did not analyze the processing times and standard deviations of the methodology they employed. Finally, Table 1 summarizes the commercial and sequential programming solution methods identified inside the state of the art reported for solving the problem addressed in this work.
Importantly, if the behavior of the currents flowing through the conductors is not considered in the proposed mathematical formulations, it is not possible to ensure that the results obtained by the implemented methodologies will satisfy the technical and operational constraints of the test systems under analysis. Moreover, after the literature review, we noticed that, the optimization techniques were not tuned in any of the studies mentioned above; hence, the conditions for the solution methodologies proposed in each paper are not guaranteed to be the same [17].
Considering the previous literature review, it was identified that the OPF problem is a very important problem for power engineering at any voltage level, and it continues to be an extensively studied problem. For this reason, new methodologies, preferably in free software, are needed to ensure good numerical results with low computational effort. Additionally, these methodologies should include, in their mathematical formulation, all the constraints associated with the operation of AC networks in an environment of distributed generation, such as active and reactive power balance, power limits associated with the DGs and conventional generators, and current limits through the power distribution lines of the systems under analysis. Additionally, to evaluate the repeatability of the proposed solution methodologies, their results must be statistically analyzed, taking into account the standard deviations obtained by the methodologies each time they are implemented. Furthermore, it is necessary to analyze the processing time required by each solution method. The purpose of these performance indices is to guarantee to the users that the algorithm will provide a high-quality solution every time it is executed.
In light of these current needs, this paper presents a master–slave methodology that can be used to solve the OPF problem and that can be replicated in any type of open-source software. The master stage uses the Salp Swarm Algorithm (SSA) presented in [34], which was selected because of its excellent performance in solving different research problems and its different applications in engineering problems focused on renewable energies, power generation, and distribution systems [22,23,35,36]. The slave stage employs the Successive Approximation (SA) numerical method proposed in [37], which was selected because of its outstanding performance in terms of convergence and processing time when solving the load flow problem. To validate the proposed solution methodology, we use one 10-node mesh test system and three radial text systems of 10, 33, and 69 nodes. For each test system, we consider the maximum power allowed for the DGs of 20 % , 40 % , and 60 % of the power supplied by the slack generator in a scenario with out DGs. Each scenario will be tested 100 times to evaluate standard deviation, repeatability, and average processing time of all solution methodologies used.

1.3. Scope and Main Contributions

In this study, we address the OPF problem in AC networks in an environment of DG and solve it using a master–slave methodology based on sequential programming to avoid the need for commercial software. Such methodology uses the SSA in the master stage to determine the power levels to be injected by the DGs and the SA numerical method in the slave stage to evaluate the load flows, and thus analyze the impact of the power configurations suggested by the master stage on the P l o s s and the limits of the problem. The purpose of this is to present a hybrid methodology that is highly efficient in terms of solution quality and processing times and with an adequate repeatability every time it is implemented. The following are the main contributions of this study to the electrical power literature field:
  • A new solution methodology for solving the AC OPF problem based on a master–slave strategy by considering the reduction of power loss as objective function and all sets of constraints that make up the operation of a AC grid under a distributed generation environmental.
  • An OPF solution approach that solves different distribution network topologies (radial and meshed) and improves recent literature reports based on combinatorial optimization algorithms such as continuous genetic algorithm, Multi-Verse Optimizer, black hole optimization, particle swarm optimization, and ant lion optimization.
  • The implementation of a global parameter-tuning optimization algorithm to guarantee the same conditions for each technique being employed in terms of solution quality, repeatability, and processing times.
Note that to validate the proposed optimization method, we selected the 10-bus grid and the IEEE 33- and IEEE-69 bus systems, since these are distribution networks typically employed for evaluating optimization models in AC distribution networks. Some of the studies in which these test feeders have been employed include: (i) power flow studies [38]; optimal placement and sizing-dispersed generation [39]; optimal siting and sizing capacitor banks [40]; optimal location of series reactive power compensators [41]; and optimal grid reconfiguration problems [42], among others. In addition, the proposed OPF solution approach is tested, considering that the DGs can inject 20%, 40%, or 60% of the total power injected by the slack where no DGs are connected to the distribution grid. These values were selected since previous literature reports have used these values to make multiple validations in OPF solution methodologies with excellent numerical results and multiple scenarios for making cross-validation [17].

1.4. Structure of the Paper

The rest of this paper is organized as follows. Section 2 explains the mathematical formulation and the set of constraints that compose the OPF problem, with the objective function being the minimization of P l o s s associated with energy distribution in AC networks. Section 3 reports the proposed master–slave methodology, which uses the SSA in the master stage and the SA numerical method in the slave stage. Section 4 shows the methods employed for comparison, as well as the parameters that allow each algorithm to find the best possible solution to the OPF problem. Section 5 details the radial and mesh test systems employed for the simulations. Section 6 presents the results obtained by the proposed optimization algorithm and the techniques used for comparison in the test systems under analysis. Finally, Section 7 draws the conclusions and proposes future lines of work.

2. Mathematical Formulation

This section shows the mathematical model used to solve the OPF problem in AC networks in an environment of distributed generation. This model employs as an objective function the minimization of P l o s s in AC networks, and considers the set of constraints that make up the problem. We selected such objective function because it is widely used to evaluate the efficiency, solution quality and convergence capability of the optimization algorithms that solve the OPF problem in AC networks [25,27,28,29,30].

2.1. Objective Function

The Equation (1) presents the selected objective function, which is entrusted to minimize the active power losses associated with the distribution of electric energy inside the AC networks.
m i n P l o s s = R e a l { v T Y L v }
In Equation (1), the variable P l o s s symbolizes the active power losses. Y L is a square symmetric matrix that is composed by the admittances of the lines that interconnect the nodes in the system; and v is a vector that contains all voltage nodes.

2.2. Set of Constraints

The equations from Equations (2)–(6) described all technical limits of an AC network under an environmental of the distributed generation.
S C G + S D G S D = D ( v ) [ Y L + Y N ] v
S D G m i n S D G S D G m a x
v m i n v v m a x
I B < I B m a x
1 T S D G α 1 T R e a l { S D }
Equation (2) presents the total power balance in the AC grid, where S C G , S D and P D G are the complex power provided by the slack generator, the complex power demanded by the loads, and the active complex power supplied by the DGs into the system, respectively. Y N and D ( v ) are the nodal admittances matrix, and the symmetric matrix that contains the complex voltages of the network in its diagonal. Equation (3) denotes the power limits fixed for each DG installed in the network, where S D G m i n and S D G m a x are the minimum and maximum power injected for each DG with respect to the active power allowed by the slack generator. It is good notice that, in this mathematical formulation, it is considered that the DGs just supply active power into the AC grid. Equation (4) expresses the voltage bounds for each node in the system, where v m i n is the minimum and v m a x the maximum voltage. Equation (5) describes the maximum current that can flow through the lines of the system, where I B is the maximum current flowing through the lines of the AC network, and I B m a x is the maximum current that the conductor used for the electrical system can support; by considering a non-telescopic grids. Equation (6) denotes the maximum active power percentage fix for each DG, where 1 T denotes a vector filled with ones, and α is the allowable penetration in percentage, which, in this study, can take a value of 20 % , 40 % , or 60 % . R e a l { S D } in this equation, corresponds to the real part of the complex demand power vector ( S D ), which is associated with the active power generated by the DGs installed in the network.
In addition to these equations, we present Equation (7), which is used to guarantee that each constraint of the OPF problem is respected, as it penalizes the algorithm if the limits established in Equations (2)–(6) are violated. As a result, an adaptation function is generated for the problem, which allows the algorithm to explore infeasible regions in order to improve the quality of its solution and reduce its processing time [17].
m i n z = P l o s s + β 1 1 T m a x { 0 , v v m a x } + β 2 1 T m i n { 0 , v v m i n } + β 3 1 T m i n { 0 , S C G S C G m i n } + β 4 1 T m a x { 0 , S D G S D G m a x } + β 5 1 T m i n { 0 , S D G S D G m i n } + β 6 m a x { 0 , 1 T S D G α 1 T R e a l { S D } }
In the Equation (7), penalty coefficients were determined using a heuristic strategy: by assigning the same penalty factor (1000) from β 1 to β 6 . When the whole set of constraints is satisfied, the adaptation function takes the same value of the objective function, so z becomes P l o s s .

3. Proposed Solution Methodology

As observed in the mathematical formulation, the OPF problem is of a nonlinear, nonconvex nature, which implies that it must be solved using specialized commercial software or optimization algorithms and numerical methods. In this paper, we propose using numerical methods and optimization algorithms that can be replicated in open-source software, thus limiting the use of commercial software. To solve the OPF problem, we propose dividing it into two stages. The first stage (master stage) uses the SSA [34,43] to determine the level of active power to be injected by each DG into the AC network. The second stage (slave stage) employs the SA numerical method [38] to run the load flow for each solution proposed by the master stage and calculate the P l o s s based on the power levels defined by the optimization algorithm. The proposed master–slave (SSA–SA) methodology is further described below.

3.1. Master Stage: Salp Swarm Algorithm (SSA)

The SSA is a bio-inspired optimization technique employed to solve discrete and continuous problems. This technique is based on the foraging behavior of salps, which pump water through their internal feeding filters to feed on phytoplankton while moving in swarms (in the form of a chain) in a coordinated and fast manner. This behavior can be modeled mathematically to be used as an optimization method [34].
Figure 1 presents the flowchart that describes the stages required for the computational development to obtain a solution to the OPF in AC networks through the SSA. All the steps developed within this algorithm are described below:

Generating the Initial Population

Initially, within the proposed SSA algorithm, the data must be read and then assigned the initial conditions that represent the problem under study. These conditions include, among others, the parameters of the electrical system, algorithm parameters for optimization and stop criteria of the SSA. It is important to highlight that for the parameterization of the optimization method, a PSO was used to tune and adjust the parameters of the algorithm to the needs of the problem under study. In other words, this is carried out with the aim of guaranteeing the equality of conditions between the validation methods and ensuring that each optimization algorithm obtains the best solution for the selected objective function) [24].
After loading the parameters and main data of the problem, the initial population is generated, taking into consideration the restrictions of the problem and a random variable to form the chain of Salps. Within this population, each individual corresponds to a salp, which is composed of the possible power supply by each DGs located in the AC network. To generate each component of the salts that are part of the initial population ( S a l p s ( i , j ) ) , Equation (8) is used, where i represents the number of Salps to be used within the solution space and j represents the number of variables to be determined (the powers to be injected by each of the DGs installed within the CA network). Equation (8) is focused on the creation of Salps particles and allows larger regions of the search space to be explored, which generates the values contained within each Salp chain from the upper and lower limits ( u b ) and ( l b ) , which correspond to the maximum and minimum power levels allowed in each DG within the electrical grid. It is important to highlight that the diversity among the individuals of the population is achieved through the implementation of random values ( r a n d ) between [0–1]. These random numbers multiplied by the difference of the limits allow a larger distribution of the particles to be generated within the search space.
S a l p s ( i , j ) = u b ( 1 , j ) l b ( 1 , j ) r a n d ( i , j ) + l b ( 1 , j )
After the creation of the initial population of Salps, it is necessary to evaluate their impact on the objective function and the restrictions of the problem. To perform this task, the ability of the ( S a l p s ( i , j ) ) within the objective function is evaluated for each Salp chain (adaptation function) by using the slave stage. Then, each of the obtained values are stored in Equation (9), which is in a matrix of size n x 1 called M O S a l p ( n , 1 ) ; this matrix stores the impact of each of the Salps in the adaptation function; we use these values to carry out the advance strategy of the algorithm. The algorithm advance considering the best solution achieved by each Salp and the best solution of the chain (incumbent).
M O S a l p s ( n , 1 ) = f S 1 , 1 , S 1 , 2 , , S 1 , d f S 2 , 1 , S 2 , 2 , , S 2 , d f S n , 1 , S n , 2 , , S n , d
Once the evaluation of the adaptation function of the initial population has been carried out, Equation (10) stores the incumbent of the problem as the leading Salp (X) or individual of the population that presents the best fitness function, which is the X that presents the best solution within the chain of S a l p s ( i , j ) ; becoming the Salp leader of the problem, while the rest of the individuals that make up the chains of Salps will be called followers.
X = S 1
It should be noted that the value obtained by the leading Salp will be stored in Equation (11), where it refers to phytoplankton (incumbent F) and it is represented as an information vector of size 1 x d , which allows the storage of said Salps chain information.
F ( 1 , j ) = X
After selecting the incumbent of the problem in the Iterative process of the SSA, the process starts with the advancing of the algorithm through the displacement of the leading Salp to half of the individuals corresponding to the chain of Salps, which allows the generation of new populations and the improvement of the incumbent F within the iterative process. It should be noted that the advance mechanism is given by a random variable that guarantees exploration of the region surrounding the incumbent, this with the aim of safely exploring the solution space. Equation (12), represents the advancement method of half of individuals updating the S a l p s ( i , j ) . Where C 1 , is a coefficient that controls the exploration and exploitation of the solution and the displacement of Salps, l and L represent the current iteration and the maximum number of iterations, respectively. Parameters C 2 and C 3 are random values given between [ 0 , 1 ] . It should be noted that the parameter C 3 is used as a condition for addition or subtraction between the values calculated from the best population F ( i , j ) and the maximum and minimum limits given by the constraints of the problem.
S a l p s ( i , j ) = F ( 1 , j ) + C 1 u b ( 1 , j ) l b ( 1 , j ) C 2 + l b ( 1 , j ) C 3 0.5 F ( 1 , j ) C 1 u b ( 1 , j ) l b ( 1 , j ) C 2 + l b ( 1 , j ) C 3 > 0.5
To complete the advance method, it is necessary to update the rest of the individuals in the Salps chain (from the middle plus one to the end of the population), using Equation (13). This equation allows information to be shared between Salps with the best response and those with the worst in the population of the chain of Salps. This equation is used in order to obtain a higher probability of generating new locations within the solution space.
S i = 1 2 S i S ( i 1 )
The particle advance method is repeated until the stopping criteria established for the algorithm are reached. The optimal solution of the problem is provided by the leader Salp F ( 1 , j ) and X obtained when the iterative process ends. Finally, for the master stage (SSA), two stopping or convergence criteria were used to control the exploration and processing times of the algorithm:
The first criterion ends the process when a maximum number of iterations is reached. While the second stop criterion terminates the algorithm after reaching a certain number of iterations without obtaining improvements in the response or without obtaining a better response. This is done in order to avoid scans that only affect the convergence times of the algorithm.

3.2. Slave Stage

To perform the calculation of the power flow, it is necessary to apply the SA method to determine the voltages profile in the electrical system by considering the power demanded and supplied by the loads and DGs. These voltages profiles will be used inside the objective function to calculate the P l o s s , and with this information and the penalty calculated with the voltages profiles too, we will calculate the adaptation function used inside the master stage. The selection of the SA [38] in this paper is due to its ability to solve the load flow in any type of electrical network (meshed and radial), and the excellent results reported by the author for this power flow method in terms of convergence and processing time. This method is based on the following equation:
Y d d · v d = D d 1 ( v d * ) S d * Y d g · v g ,
In this equation, Y d d and Y d g represent the components of the nodal admittance related to the load and generator nodes, respectively. Furthermore, the voltage related to the Slack generator is defined as v g , and v d is a vector that contains the voltages at the demand nodes. Given this equation, a mathematical development can be performed in order to obtain the equation that allows us to determine the nodal voltages at the demand nodes:
v d = Y d d 1 [ D d 1 ( v d * ) S d * Y d g · v g ] .
To compute the voltages in the nodes other than the slack node in an iterative manner and with an almost-null convergence error, a t counter must be used. Such counter is thus added to Equation (15). As a result, the following equation can be used to calculate the voltage profiles:
v d t + 1 = Y d d 1 [ D d 1 ( ( v d * ) t ) S d * Y d g · v g ] .

4. Optimization Algorithms Employed for Comparison and Parameters

To evaluate the robustness, convergence capacity, and quality of the solution provided by the methodology proposed in this paper, we employed the most widely used techniques in the literature field to solve the OPF problem in AC networks: the Black Hole (BH) [44], the Ant Lion Optimization (ALO) [33], the Multi-Verse Optimizer (MVO) [45], the Continuous Genetic Algorithm (CGA) [46] and the Particle Swarm Optimization (PSO) [46]. In addition, the selection of these optimization methodologies was based on the excellent performance in terms of quality of the solution and processing times reported by the authors. Each one of them was employed as a master–slave, using the SA as slave stage in all scenarios.
The simulations were performed in the 10-, 33-, and 69-node radial test systems and in the 10-node mesh test system [17,37,47]. These test systems were selected with the aim of evaluating the convergence capacity and quality of the solution provided by each optimization algorithm in networks of any size with both radial and mesh topologies.
To guarantee a fair comparison between the optimization algorithms used, it is necessary to perform a tuning of each optimization methodologies with the aim of finding the optimization parameters that allow us to obtain the best results for the problem studied. Given this, a PSO algorithm [46] is used, to perform such tuning. This PSO uses a population of 10 individuals and 300 iterations. The ranges used to tune all parameters were: number of particles or individuals over a range of [1–100], the maximum number of iterations [1–1000] and a non-improvement or convergence counter with a range of [1–1000]. The parameters obtained for each algorithm are presented in Table 2, which is ordered as follows from left to right: the first column shows the optimization algorithm, the second column shows the number of individuals, the third column shows the maximum number of iterations, and finally, the fourth column shows the number of non-improvement iterations. These parameters allow each algorithm to find the best possible solution for the OPF problem in AC networks.

5. Test Scenarios and Considerations

To assess the impact and convergence capacity of each optimization algorithm, as well as the precision and repeatability of their solution to the OPF problem in AC grids with mesh and radial topologies, we employed one 10-node mesh test system and three radial text systems with 10, 33, and 69 nodes, respectively. These test systems were selected because they are widely employed in the specialized literature to solve the OPF problem [8,17,28,48]. Each test system features a single slack generator and no DGs in the base case.

5.1. Radial Test Systems

This subsection describes the radial test systems employed in this study to carry out the simulations.

5.1.1. 10-Node Radial Test System

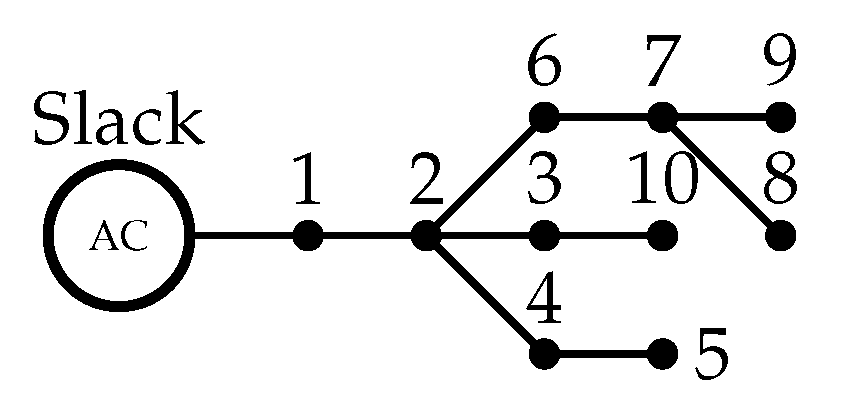
Figure 2 shows the electrical diagram of a 10-node radial test system, which has 9 lines and 10 nodes (see Table 3 without considering information regarding lines 5–10, and 8–10, respectively.). In the base case, this system employs a base voltage of 23 kV and a base apparent power of 100 kVA. The power losses of this system amount to 223.4181 kW, and the slack generator injects a complex power of (12591.4181-4493.9356i) kVA. The electrical parameters of this system were taken from [38], and the DGs were located at nodes 5, 9 and 10, allowing them to inject 20 % , 40 % , and 60 % of the active power supplied by the slack generator in the base case. For all the DGs, the minimum power to be injected was 0 kW for all the three penetration levels of distributed generation, and the maximum power to be injected was 2518.2836 kW, 5036.5673 kW and 7554.8509 kW for the 20 % , 40 % and 60 % penetration levels, respectively. After running a load flow analysis for this system, the maximum operating current was 581.2757 A. Hence, a 1250-kcmil conductor operating at 75 °C was selected, which was located in all the segments of the network. This conductor can support a maximum current of 590 A. Additionally, the voltage at which this system operates should be within +/ 10 % of the nominal voltage.

5.1.2. 33-Node Radial Test System

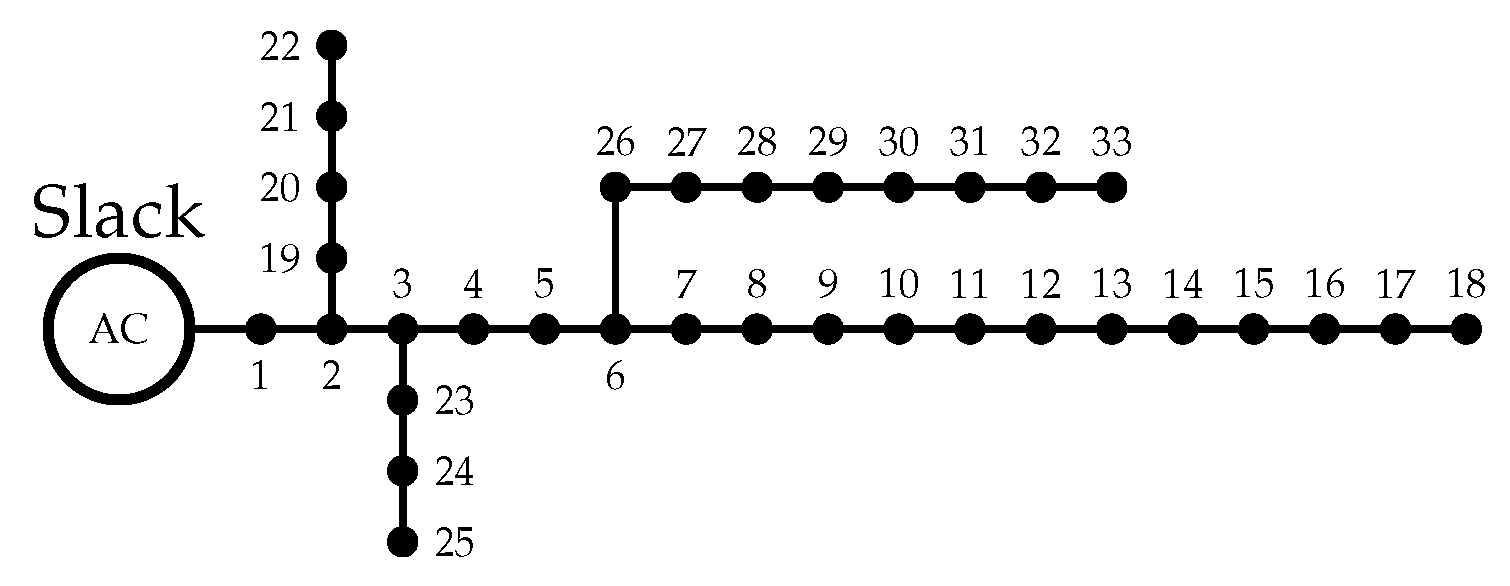
Figure 3 illustrates the 33-node radial test system, which consists of 32 lines and 33 nodes, and the way its components are interconnected. In a scenario with no DGs, this system employs a base voltage of 12.66 kV and a base power of 100 kVA. Additionally, the power losses of this system amount to 210.9785 kW, and the slack generator injects a complex power of (3925.9785 + 2443.1281i) kVA. The electrical variables that make up this system were taken from [47], and the DGs that were allowed to inject power were defined as in [17] and located at nodes 12, 15 and 31. As in the 10-node radial test system, the DGs were allowed to inject 20 % , 40 % , and 60 % of the power supplied by the slack generator. For all the DGs, the minimum power to be injected was 0 kW for each penetration level, and the maximum power to be injected was 785.1957 kW, 1570.3914 kW, and 2355.5871 kW for the 20 % , 40 % , and 60 % penetration levels, respectively. After running a load flow analysis using the SA numerical method, the maximum current was 365.2518 A. Hence, a 700 kcmil conductor operating at 60 °C was employed in each segment of the network, which allows a maximum current of 385 A. As in the previous test system, the voltage at which this system operates should be within +/ 10 % of the nominal voltage.

5.1.3. 69-Node Radial Test System

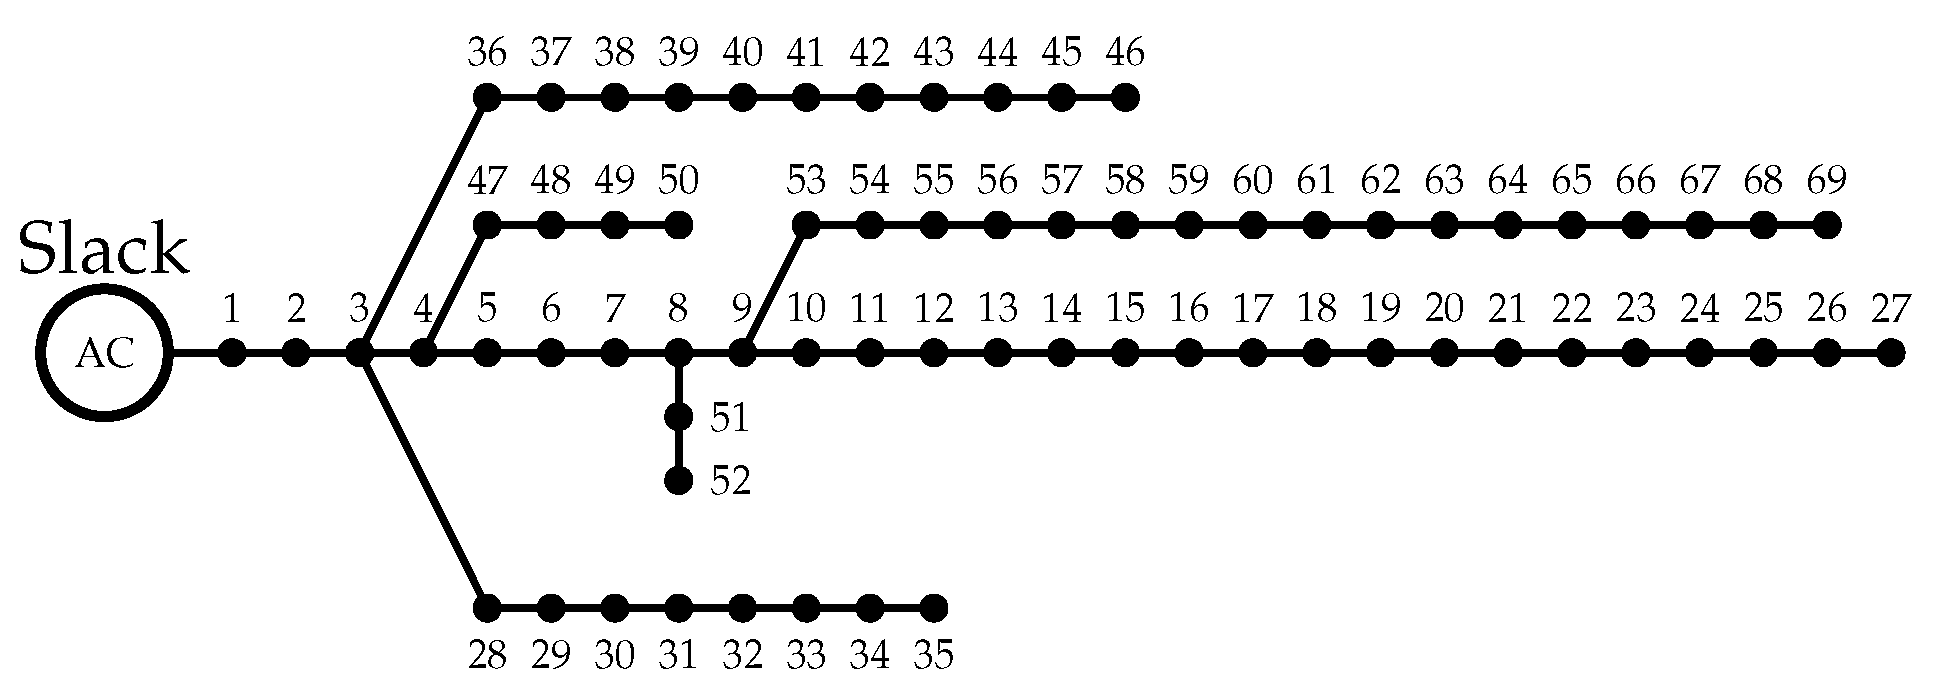
Figure 4 shows how the components of the 69-node radial test system, which consists of 68 lines and 69 nodes, are interconnected. This system employs a base voltage of 12.66 kV and an apparent base power of 100 kVA. In addition, the active power losses of this system amount to 242.1523 kW, and the slack generator supplies a complex power of (4132.8423 + 2803.0132i) kVA. The electrical parameters of this system were taken from [47], and the DGs were located as in [17] at nodes 26, 61, and 66. As in the previous two test systems, three penetration levels of distributed generation ( 20 % , 40 % , and 60 % ) were considered for this system. For all the DGs, the minimum power to be injected was 0 kW, and the maximum power to be injected was 826.5685 kW, 1653.1369 kW and 2479.7054 kW for the 20 % , 40 % and 60 % penetration levels, respectively. After running a load flow analysis, the maximum current was 394.4489 A. Hence, a 50 kcmil conductor operating at 60 °C was used, which was located in each section of the network, allowing a maximum current of 400 A. As in the previous two test systems, the voltage at which this system operates should be within +/ 10 % of the nominal voltage.

5.2. Mesh Test System

This subsection describes the mesh test system used in this study to perform the simulations.

10-Node Mesh Test System

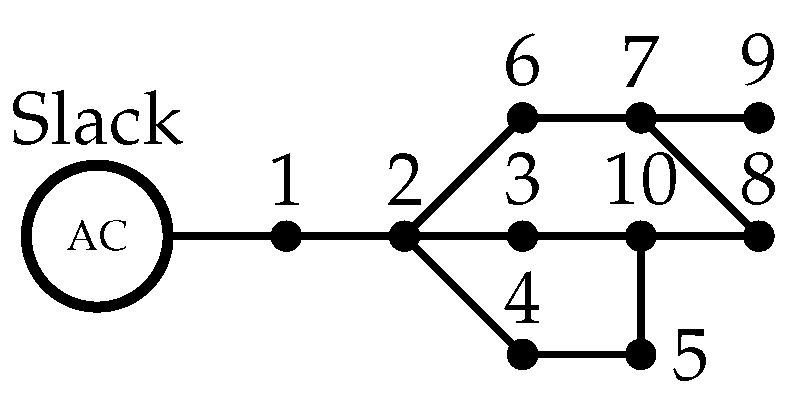
Figure 5 depicts the 10-node mesh test system, which is a variation of the 10-node radial test system presented in the previous subsection. However, in this case, it has 10 nodes and 11 lines (see Table 3). The information about the distribution lines and loads of this system was taken from [38]. In this system, the slack generator supplies complex power of (12,558.3237–4480.7386i) kVA, and the power losses amount to 190.3237 kW. For all the DGS, the minimum power to be injected was 0 kW, and the maximum power to be injected was 2511.6647 kW, 5023.3295 kW and 7534.9942 kW for the 20 % , 40 % , and 60 % penetration levels, respectively. The maximum current flowing through the segments of the system was 579.7276 A. Hence, a 1250 kcmil conductor operating at 75 °C was selected, which supports a maximum current of 590 A and was located in each segment of the network. As in the previous test systems, the voltage at which this system operates should be within +/ 10 % of the nominal voltage.

6. Simulations and Results

This section presents the results of the simulations carried out to solve the OPF problem in AC networks. All the simulations were performed in Matlab® (version 2021b) running on a laptop with an Intel® CoreTM [email protected] 1.80 GHz processor, 4 GB of RAM, a 225-GB solid-state drive, and Windows 11. To evaluate the repeatability and standard deviation of each technique and guarantee the same conditions for all, the techniques were tuned and executed 100 times.

6.1. Radial Test Systems

This subsection analyzes the results obtained by each optimization method employed to solve the OPF problem in AC grids with a radial topology.

6.1.1. 10-Node Radial Test System

Table 4 shows the results reached by each optimization method in the 10-node radial test system. From left to right, this table details the optimization algorithms used to solve the OPF problem; the nodes where the DGs are located and the active power they inject into the network (kW) while respecting the set of constraints of the problem; the minimum P l o s s (kW) and the percentage of reduction with respect to the base case (%); the average P l o s s (kW) and the percentage of reduction with respect to the base case (%); the processing time employed by each algorithm to solve the OPF problem (s); the standard deviation (STD) of each optimization algorithm (%); the worst potential difference in the system (p.u.) and the node where it occurs; and in the last column, the maximum current in the solution provided by each optimization algorithm (A). Importantly, this table also reports the behavior of the system in the base case, in which the P l o s s amount to 223.4181 kW and the maximum current supported by the conductor selected for this system is 590 A.
From the information presented in Table 4, it is possible to identify the differences between the proposed methodology (SSA) and the optimization techniques selected for comparison. Using these results, we constructed Figure 6, Figure 7 and Figure 8, which compare the results obtained by the different techniques used for comparison purposes to those of the SSA.
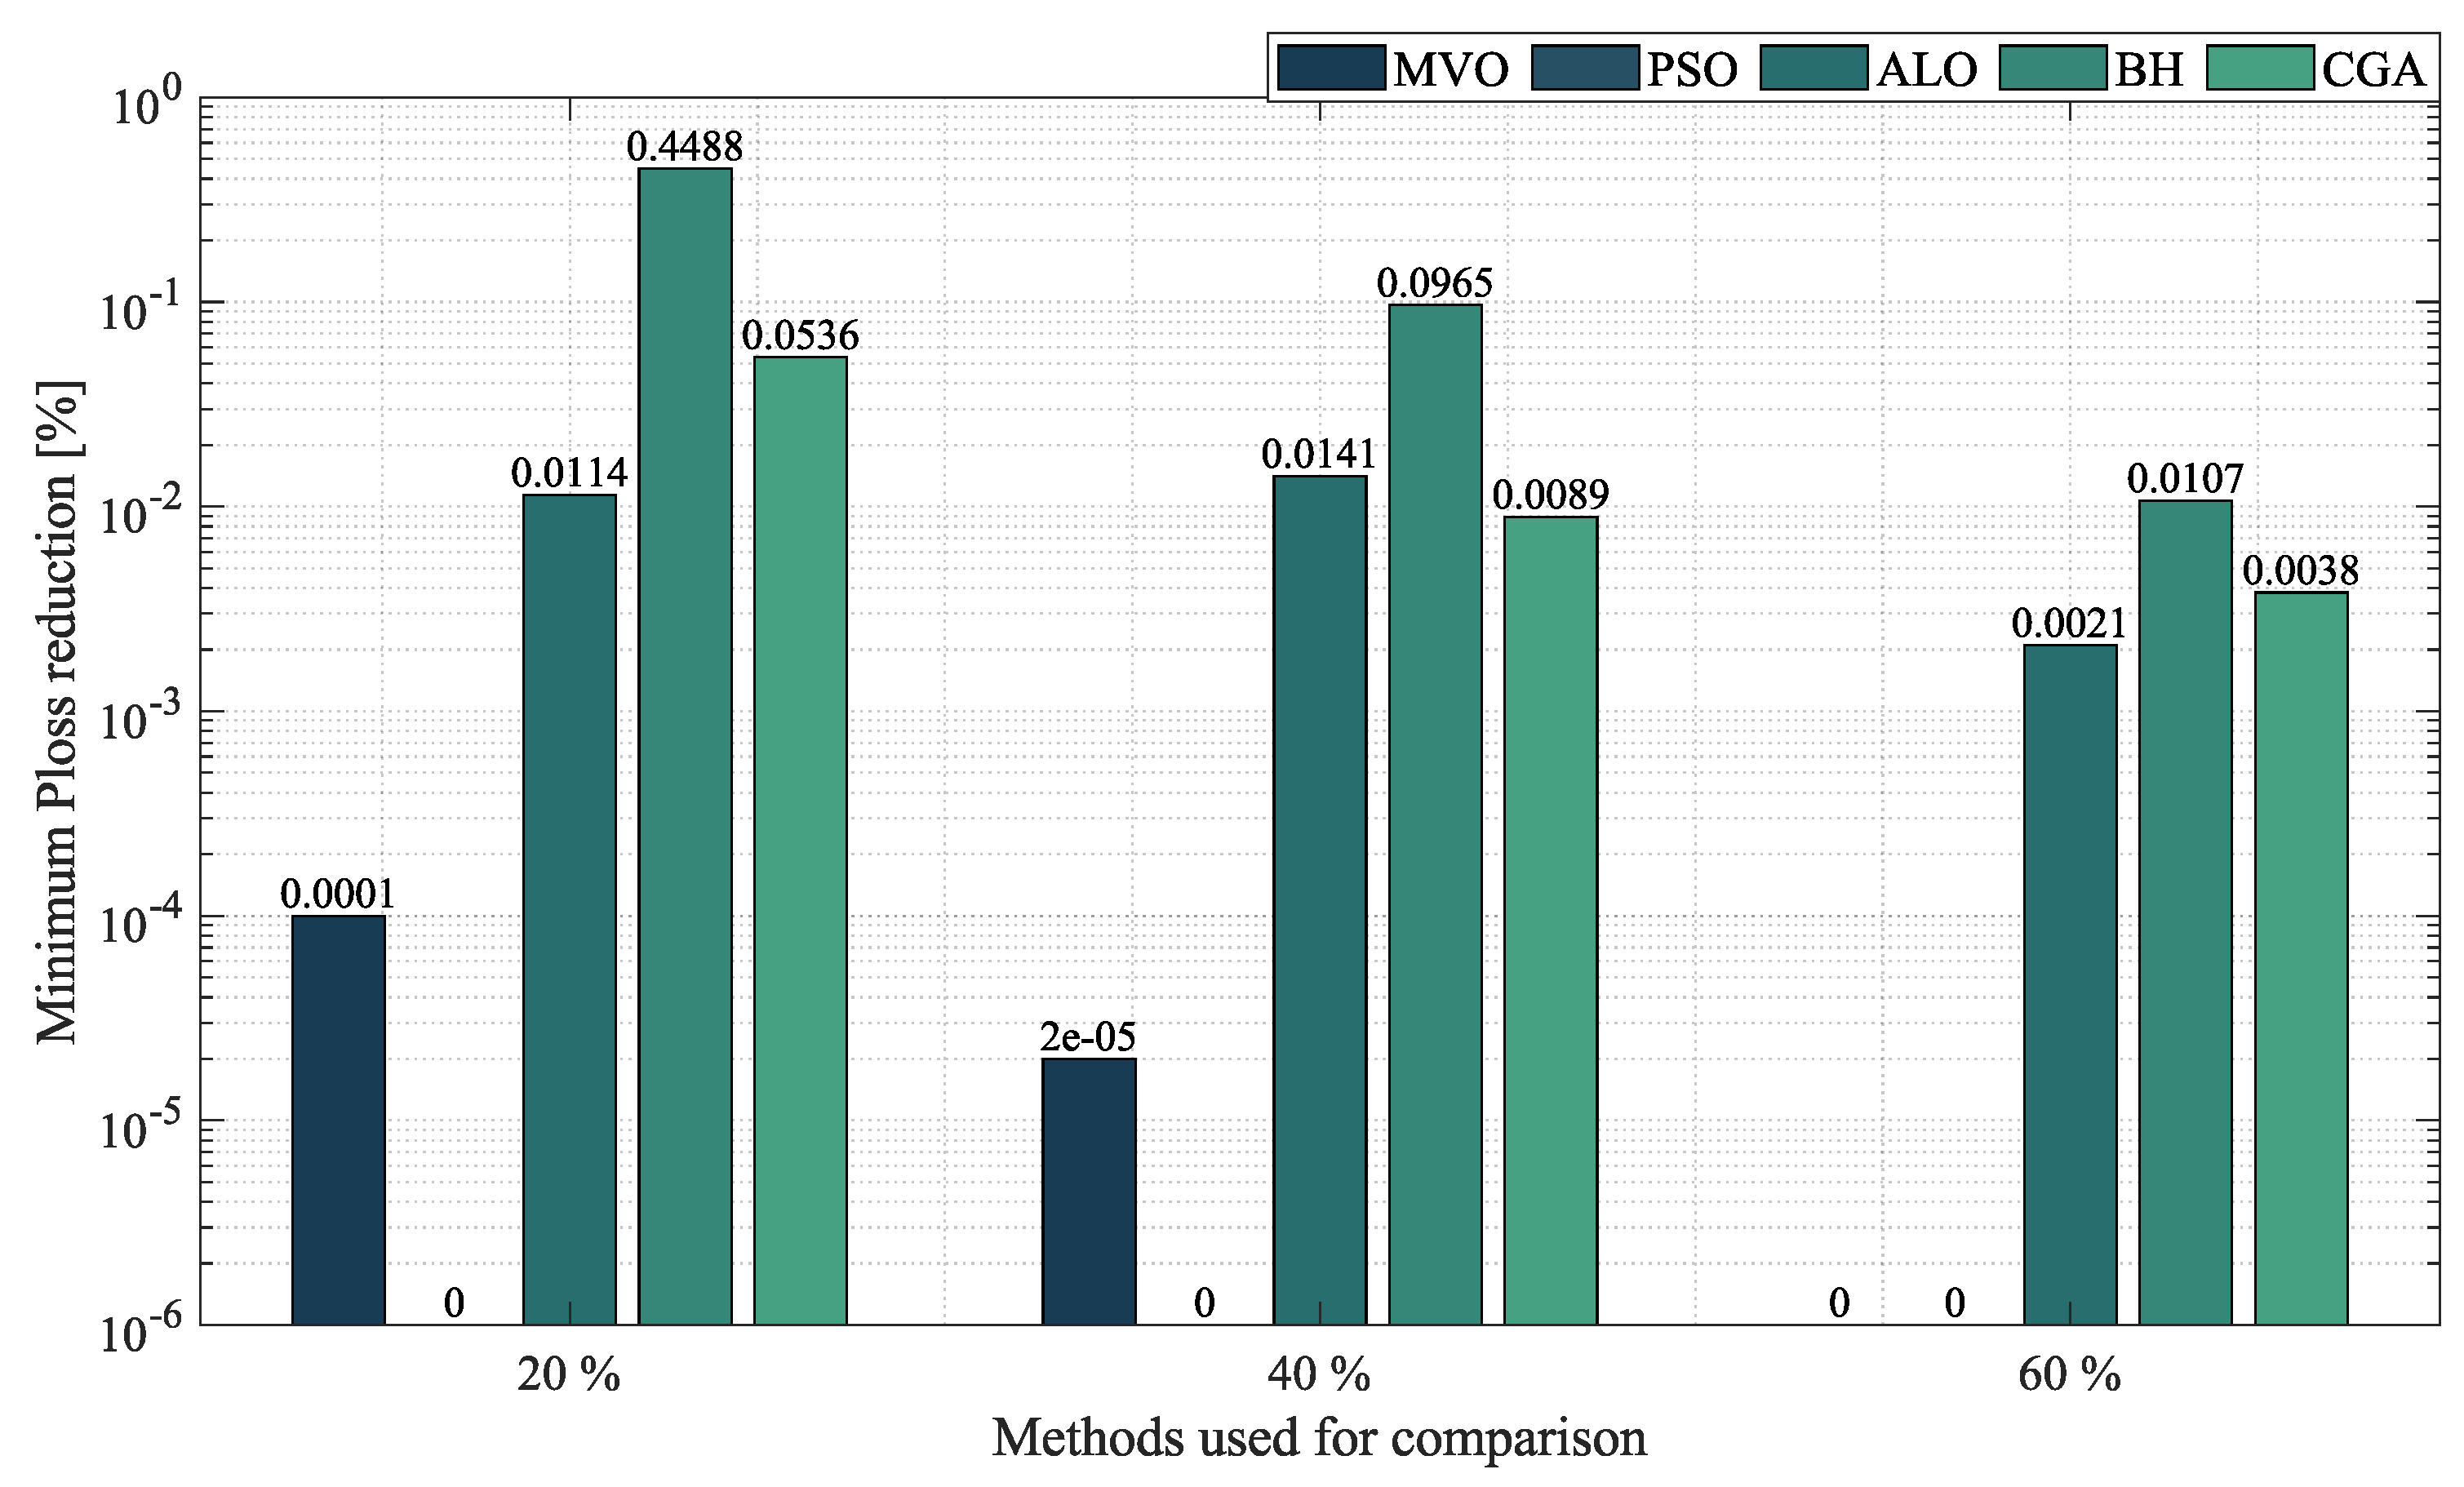
Figure 6 depicts the minimum P l o s s reduction obtained by each technique at the three penetration levels of distributed generation: 20 % , 40 % , and 60 % . In relation to the first penetration level (20%), the SSA and PSO obtained the best results in term P l o s s reduction with a reduction of 47.6668 % when is compared with the base case (an scenario without DGs), outperforming the MVO by 0.0001 % , the ALO by 0.0114 % , the CGA by 0.0536 % , and BH by 0.4488 % . With respect to penetration level of 40%, the SSA and PSO obtained the best solution, with a minimum P l o s s reduction of 63.8522 % , improving the results obtained by the MVO, the CGA, the ALO, and BH in 2 × 10 5 % , 0.0089 % , 0.0141 % , and 0.0965 % , respectively. Finally, for the third scenario (60%), the SSA, the MVO, and PSO achieved the best solution in relation to the minimum P l o s s with a value of 72.1260 % ; outperforming the ALO by 0.021 % , the CGA by 0.0038 % , and BH by 0.0107 % .
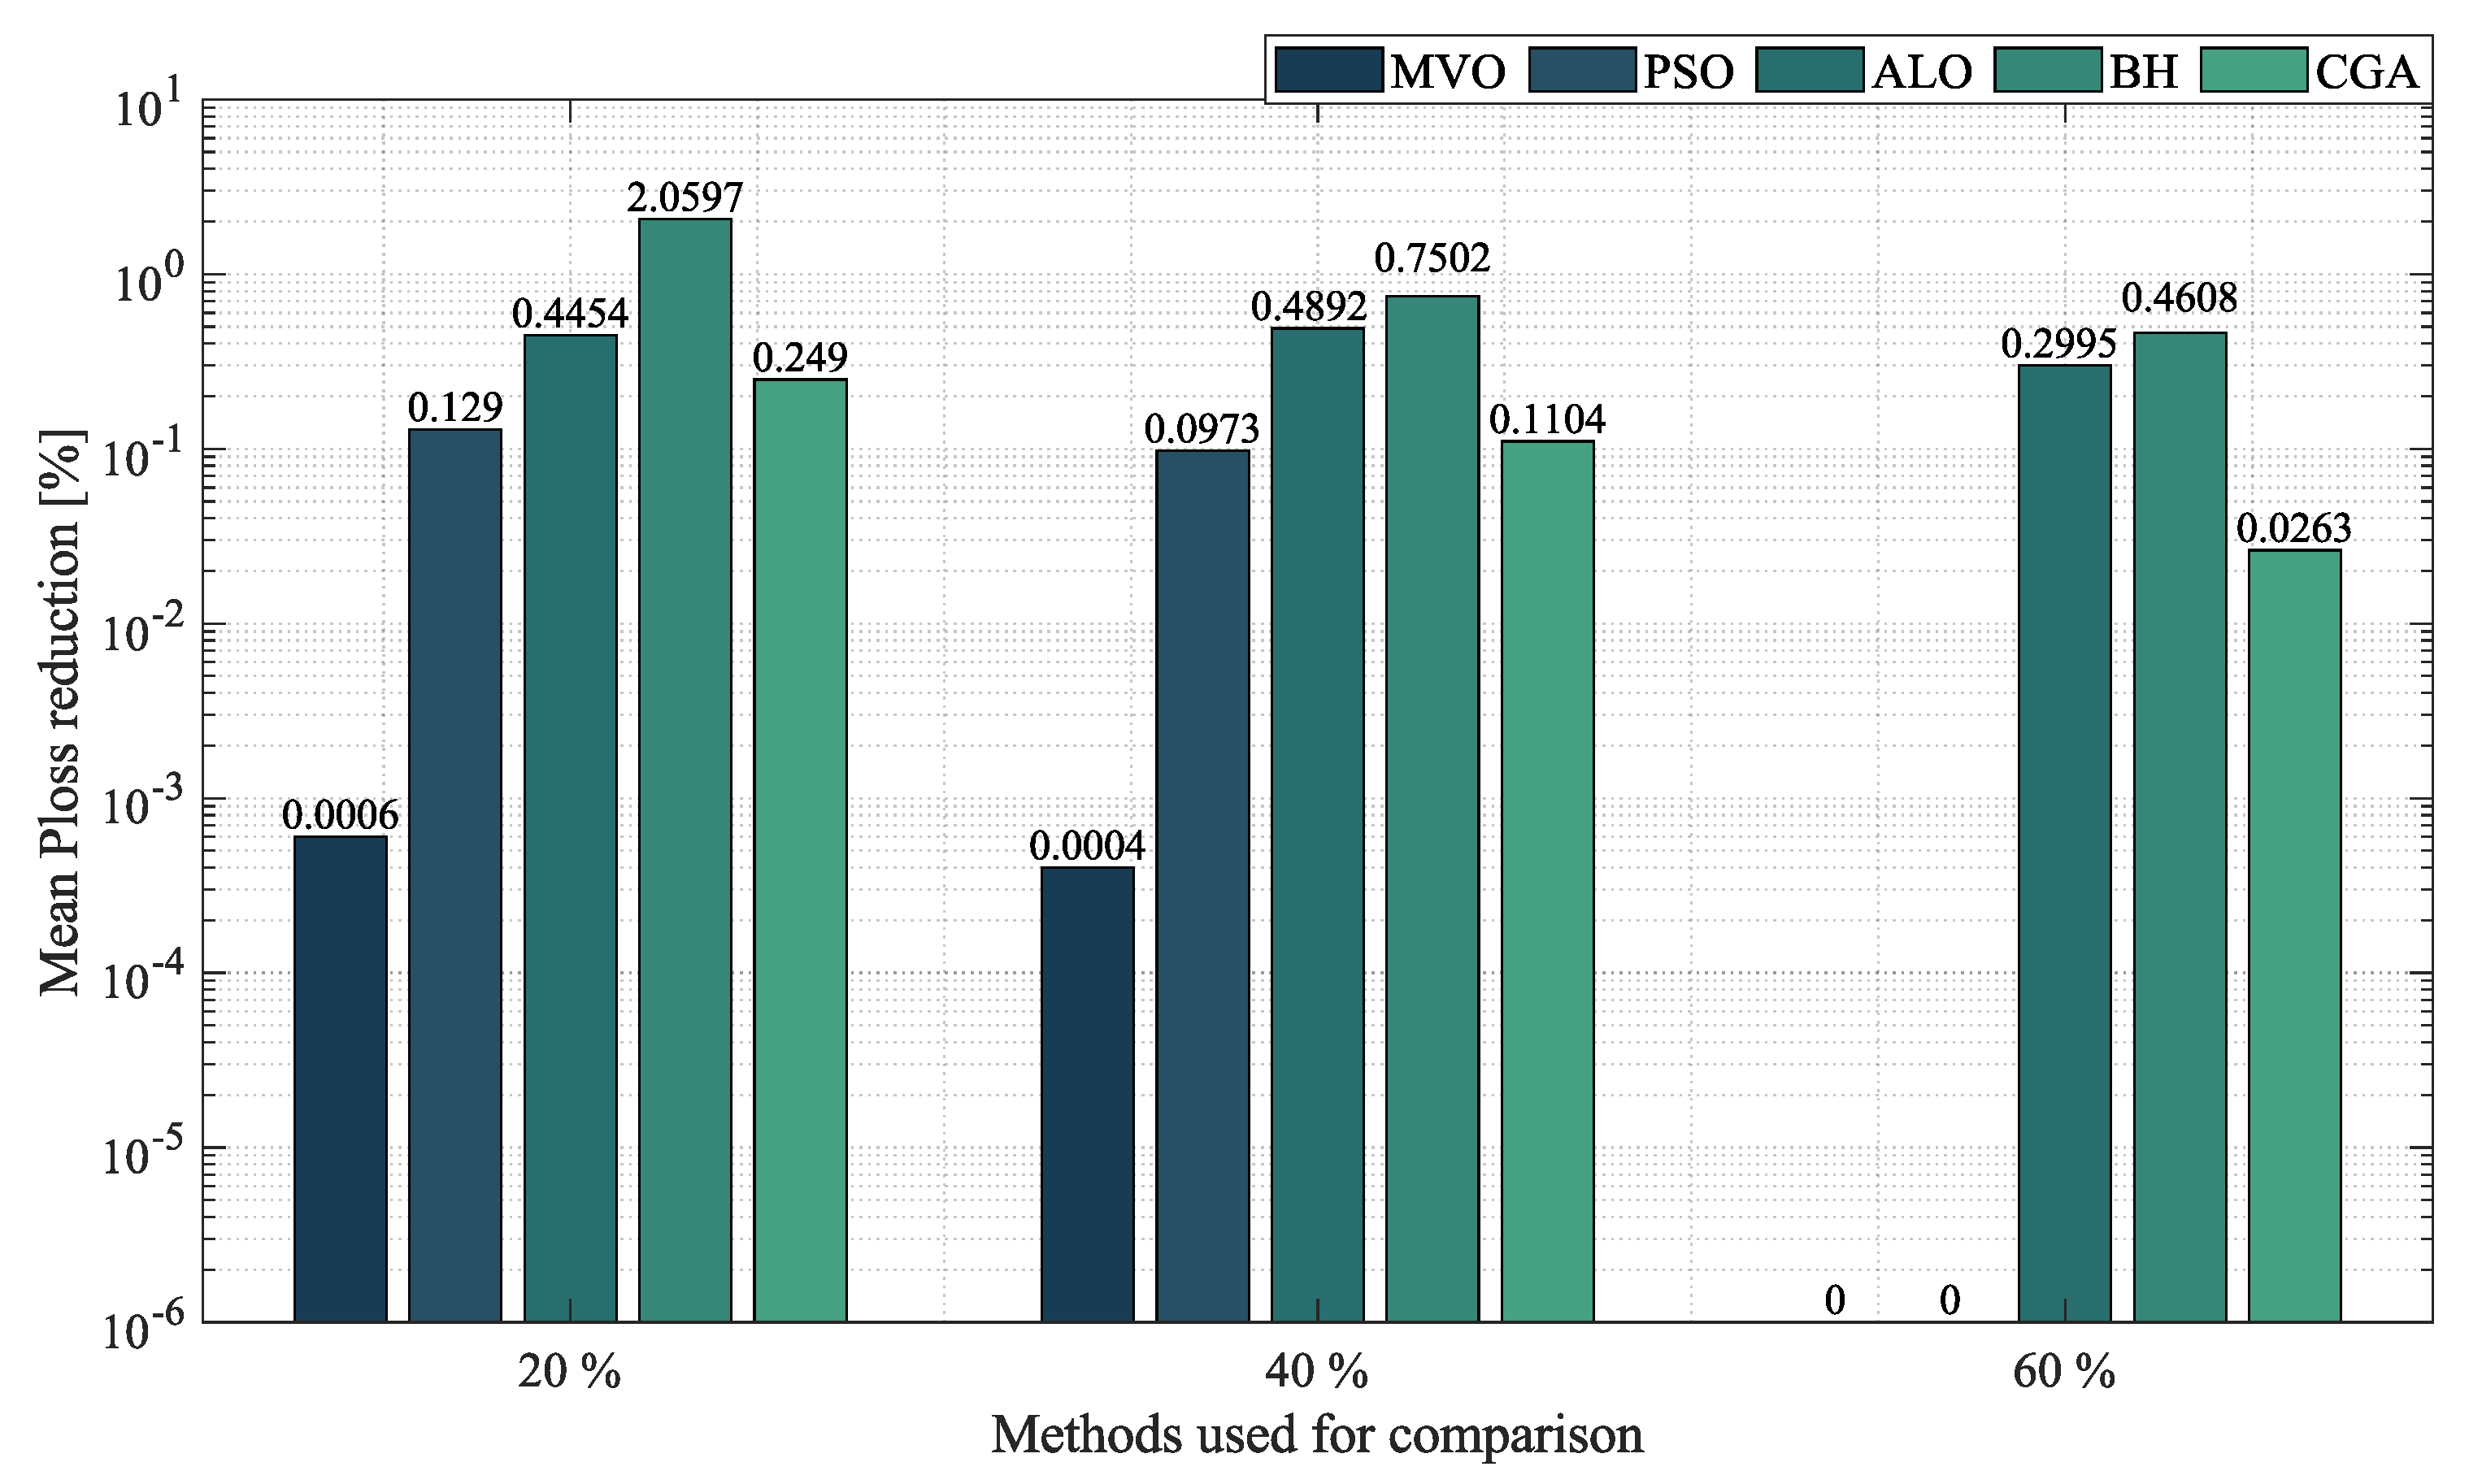
Figure 7 depicts the average P l o s s reduction reached by each optimization algorithm for the three penetration levels used. For the penetration level of 20 % , the SSA achieved the best average reduction of P l o s s in relation to the base case with a value of 47.6660 % ; by improving the results obtained by the comparison methods in a 0.5767 % . In the particular case of the penetration level of 40 % , the SSA obtained the best average P l o s s reduction with a percent of 63.8521 % , outperforming the MVO by 0.0004 % , PSO by 0.0973 % , the CGA by 0.1104 % , the ALO by 0.4892 % , and BH by 0.7502 % . Finally, for the penetration level of 60 % , the SSA, PSO, and the MVO exhibited an average P l o s s reduction of 67.1260 % , improving the results obtained by the ALO, the CGA, and BH in an average percentage of 0.0055 % .
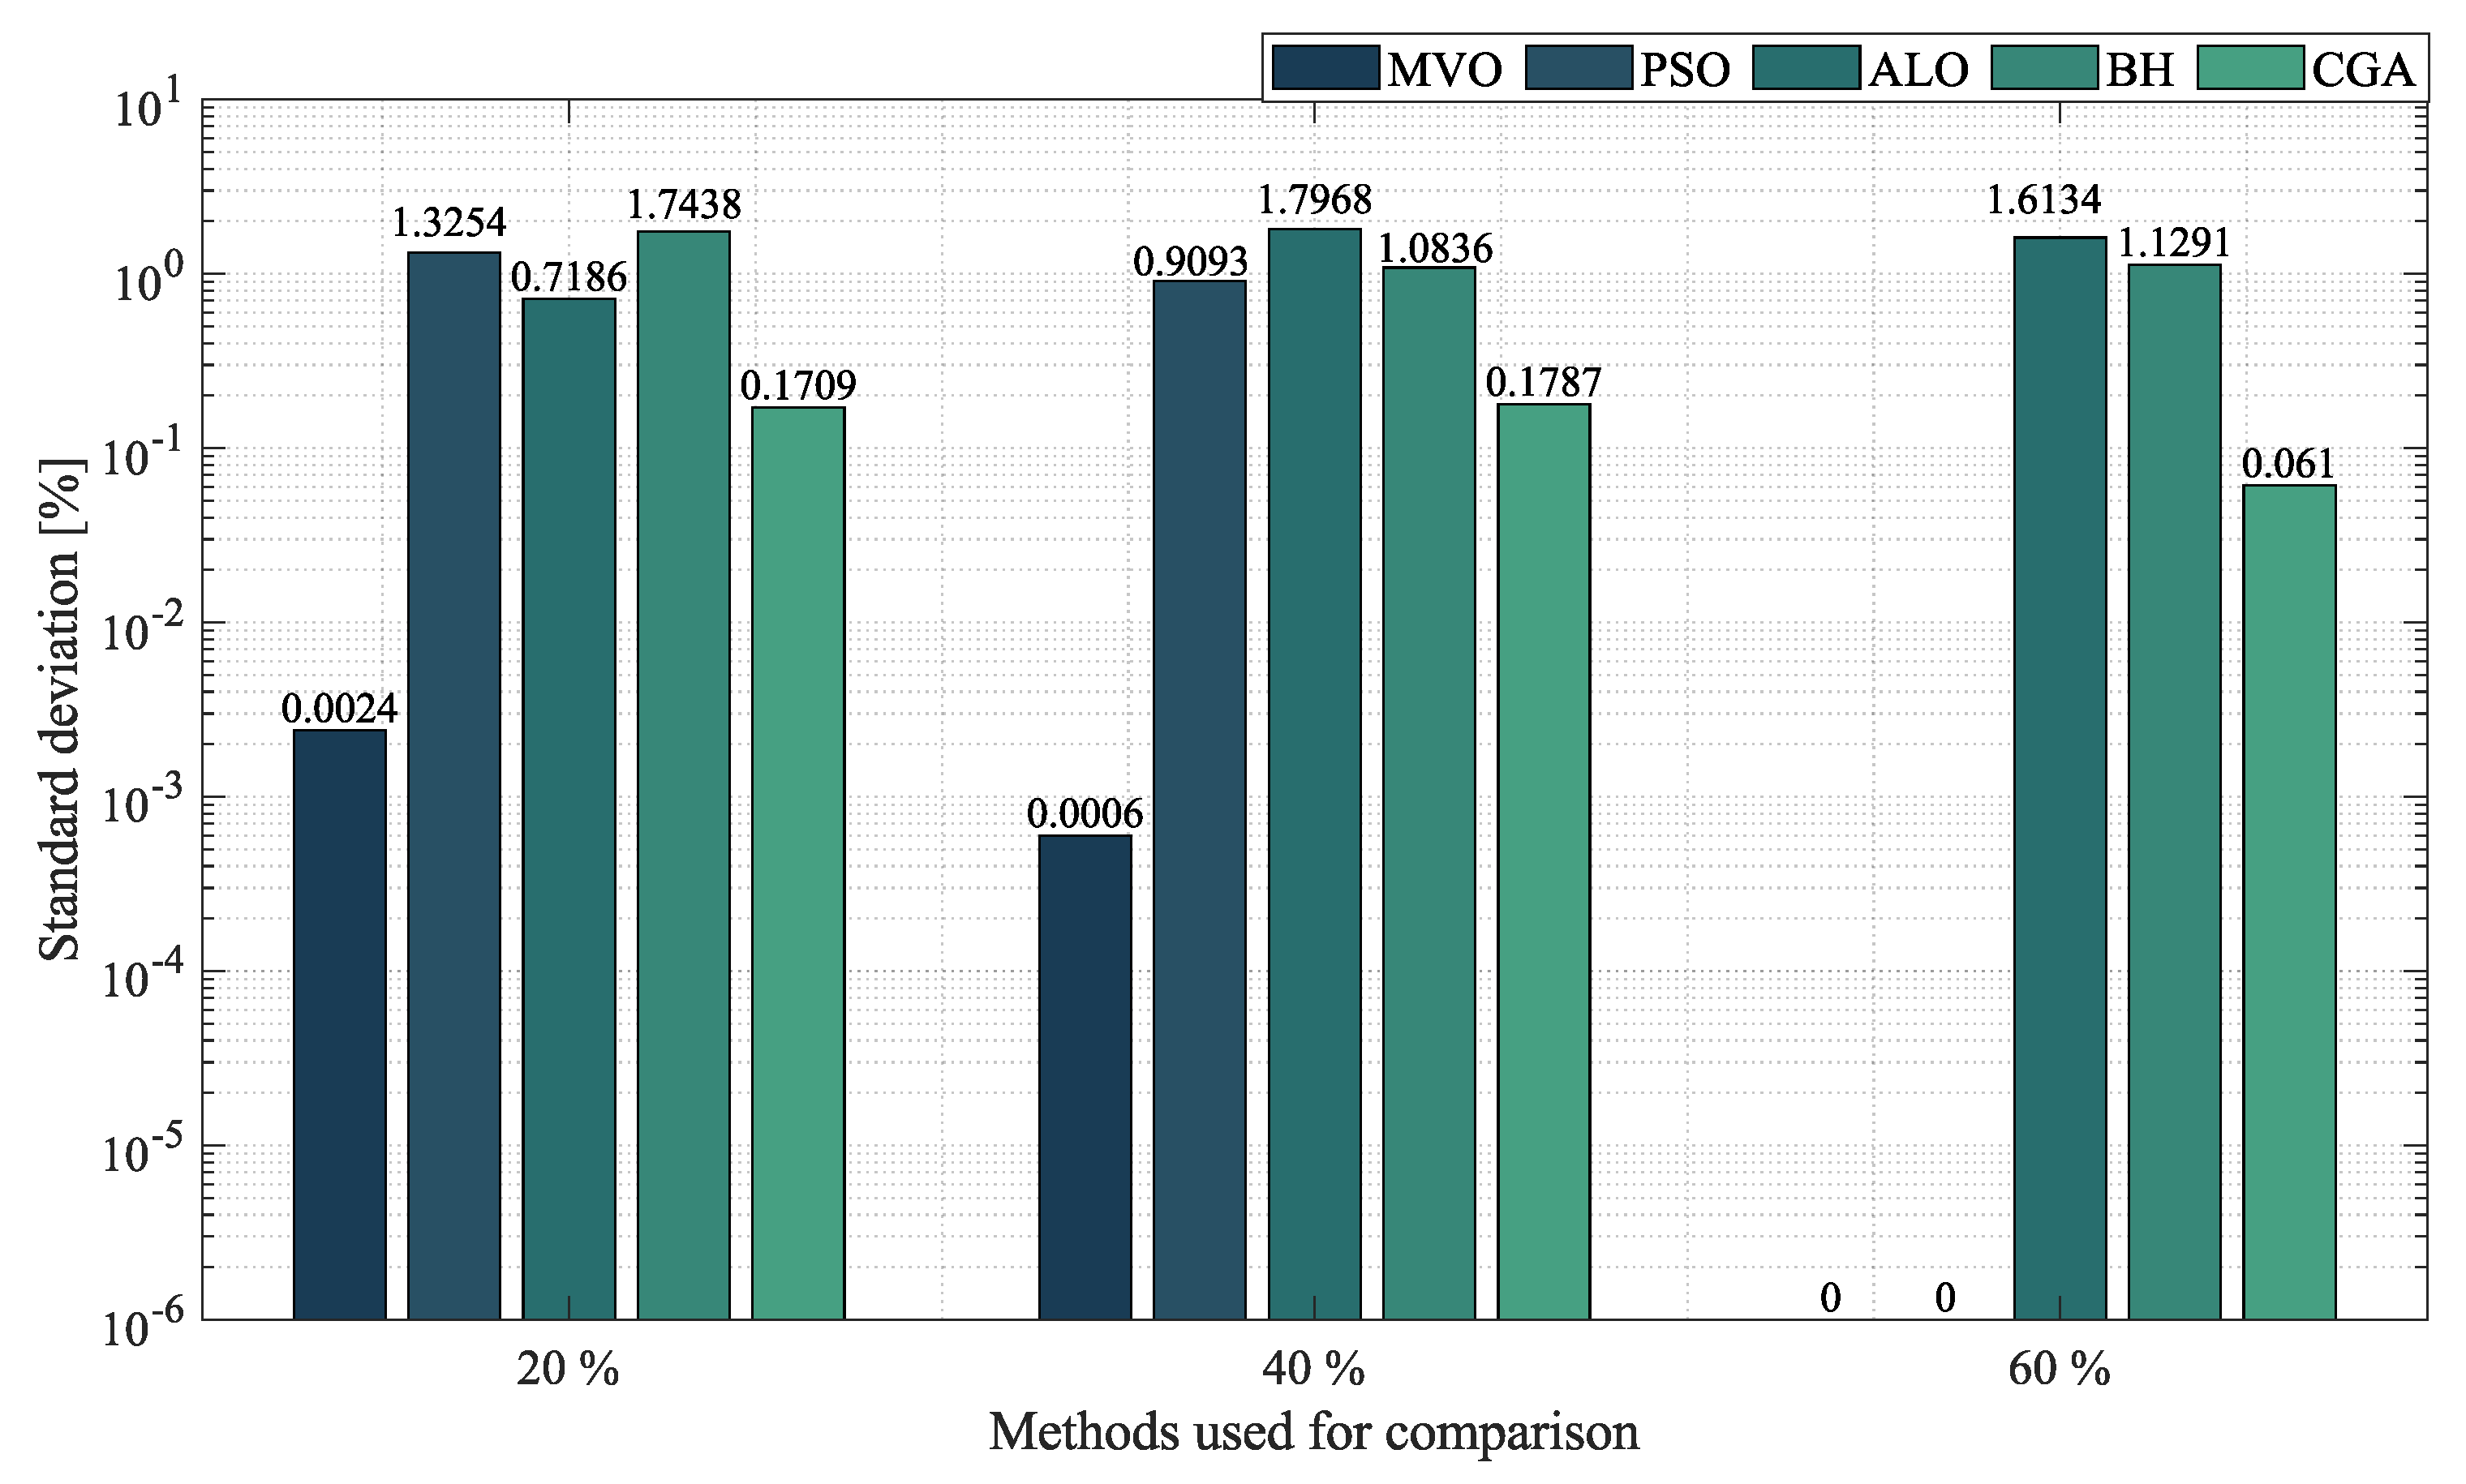
Figure 8 presents the STD reached by each optimization algorithm at the three percentages of penetration used. From this figure, one may determine how precise the algorithms are at finding a solution to the OPF problem in AC networks. At 20 % penetration, the SSA obtained the best STD ( 0.0025 % ), outperforming the MVO by 0.0024 % , the CGA by 0.1709 % , the ALO by 0.7186 % , PSO by 1.3254 % , and BH by 1.7438 % . At 40 % penetration, the SSA presented the best STD with a value of 3.47 % , outperforming the MVO, the CGA, PSO, BH and the ALO by 0.0006 % , 0.1787 % , 0.9093 % , 1.0836 % , and 1.7968 % , respectively. Finally, at 60 % penetration, the SSA exhibited a STD of 4.23 × 10 11 , outperforming the other techniques by an average percentage of 0.5607 % .
According to these results, the SSA provided the best solution to the OPF problem in small networks, in terms of both minimum P l o s s reduction and average P l o s s reduction. It also obtained an excellent STD, which guarantees that a high-quality solution can be found every time the algorithm is executed.

6.1.2. 33-Node Radial Test System

Table 5 shows the results obtained by each optimization technique in the 33-node radial test system. Based on the information reported in this table, which is organized the same way as Table 4, we constructed Figure 9, Figure 10 and Figure 11, which compare the minimum P l o s s reduction, the average P l o s s reduction, and the STD obtained by the optimization algorithms, respectively. Importantly, this table also includes (in its upper part) the P l o s s in the base case, i.e., 210.9785 kW, and the maximum current that can be supported by the conductor distributed throughout the network, i.e., 385 A.
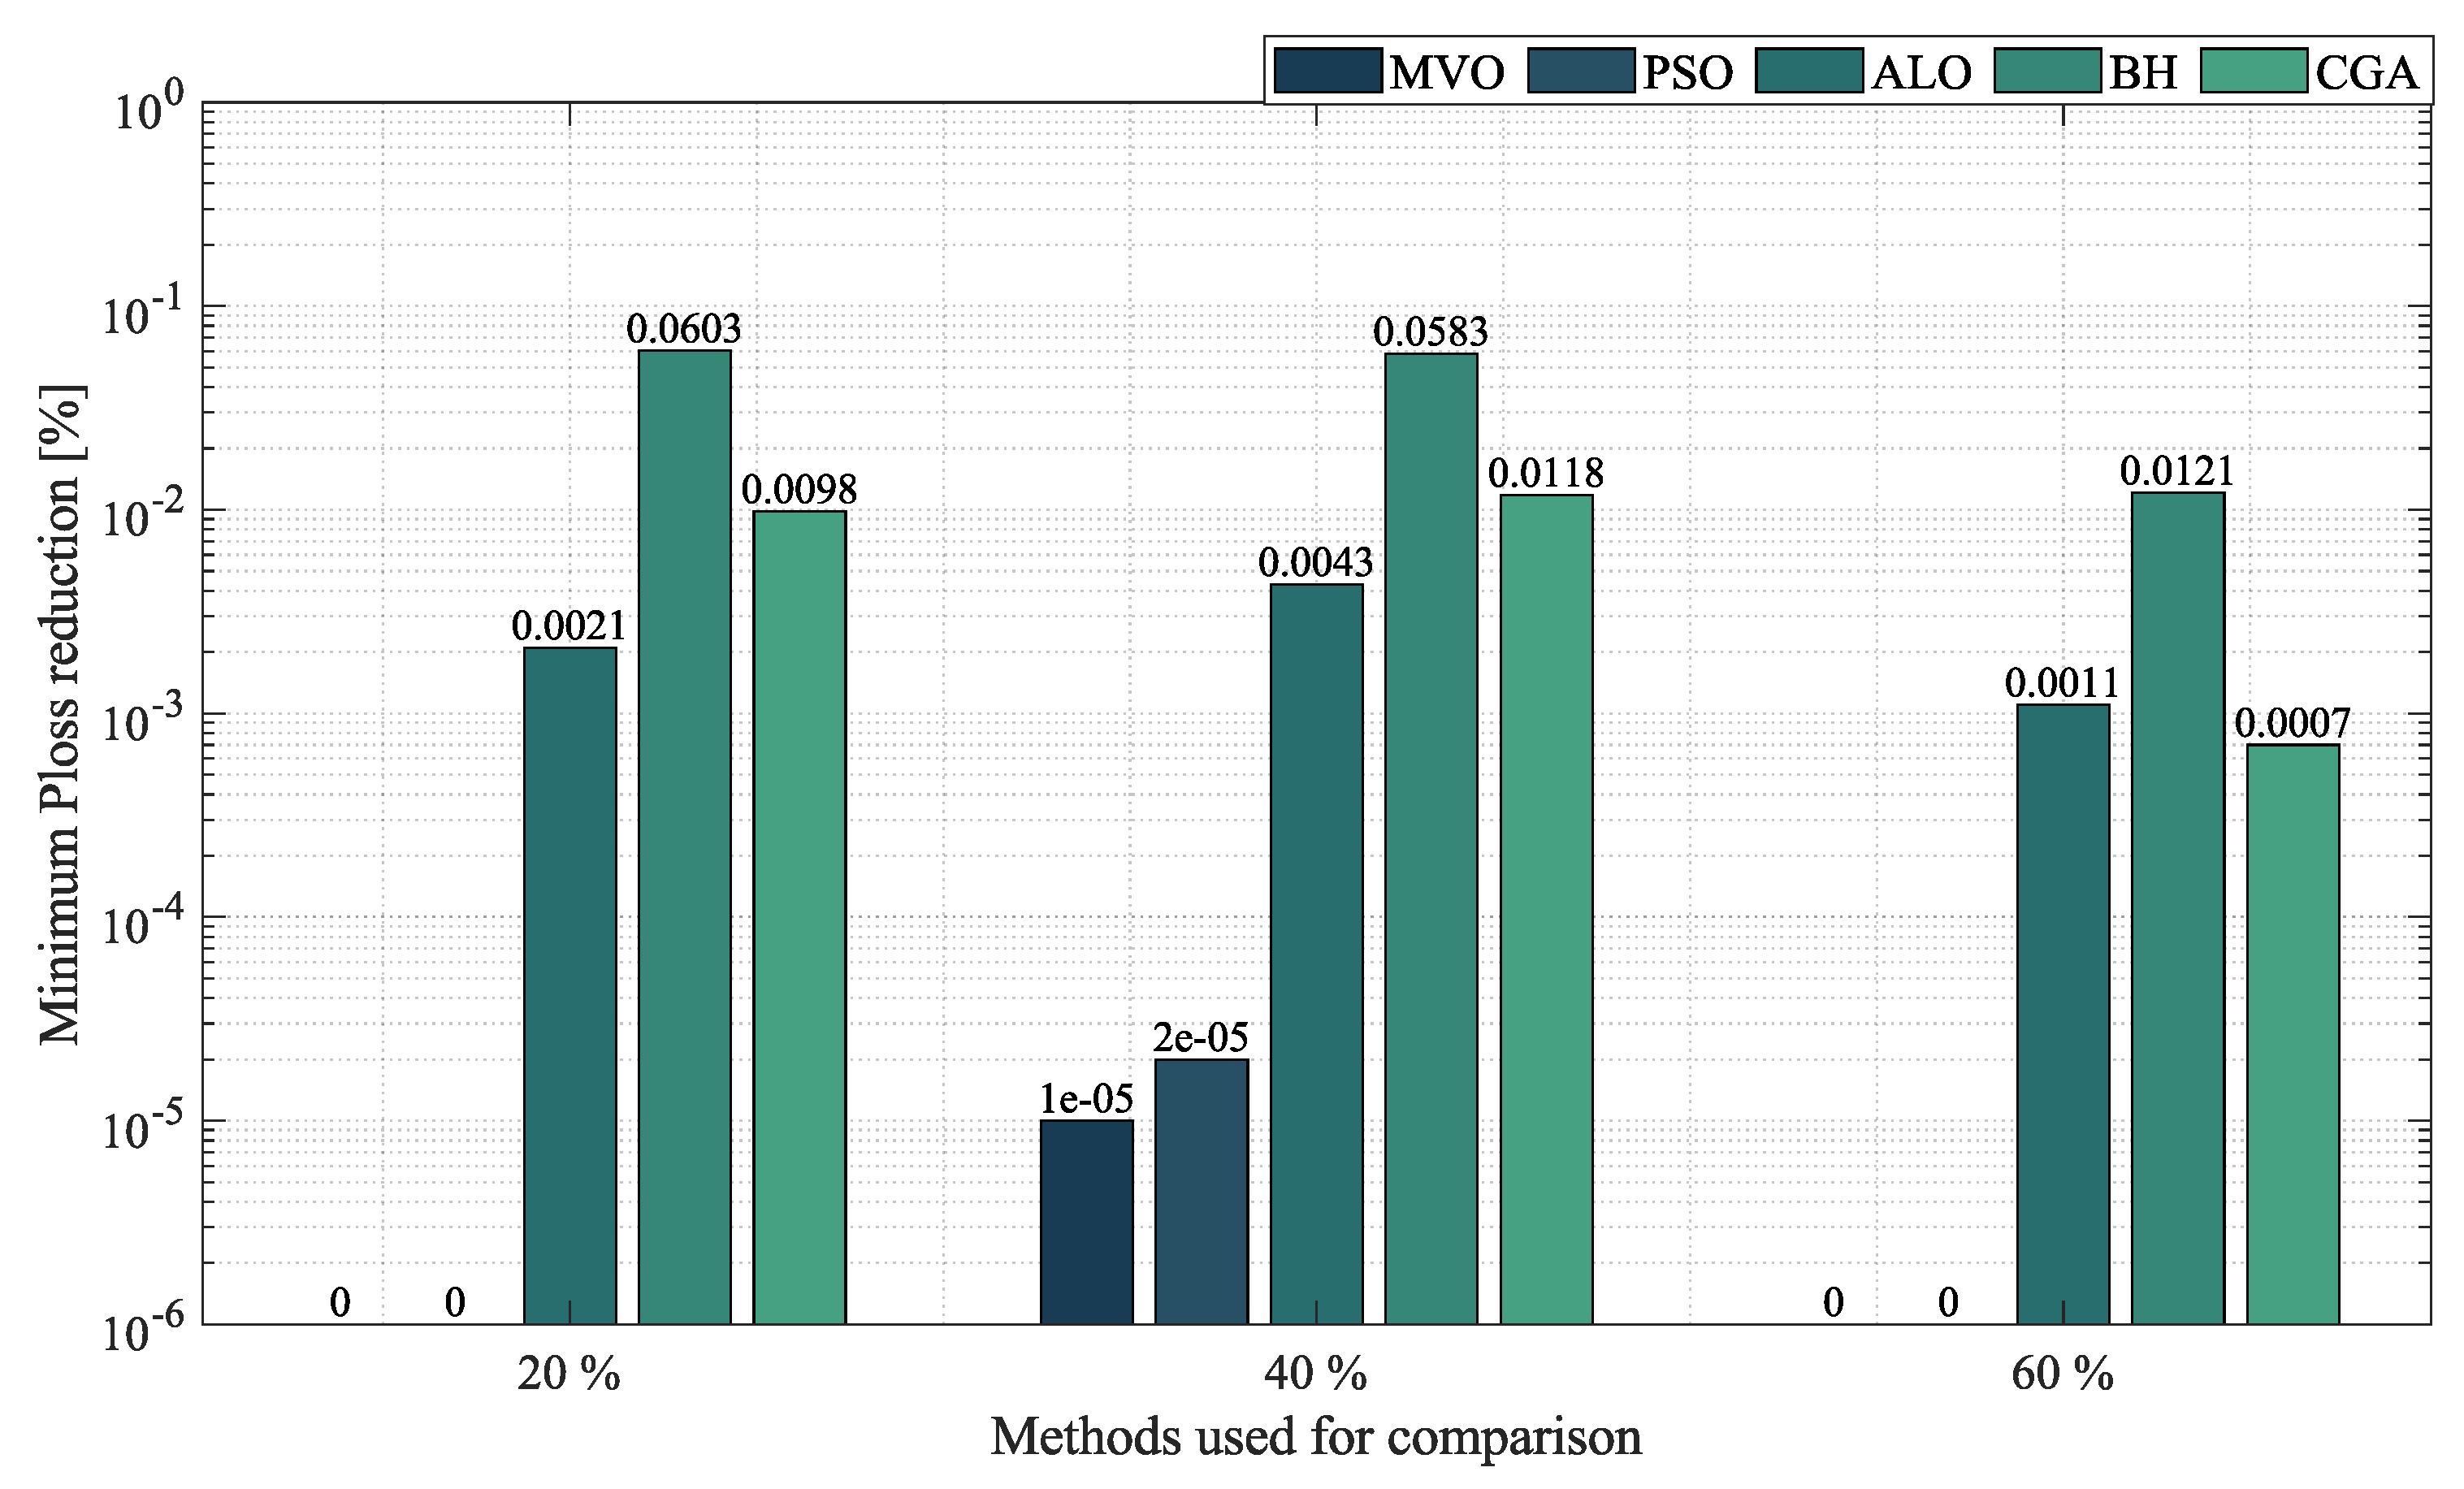
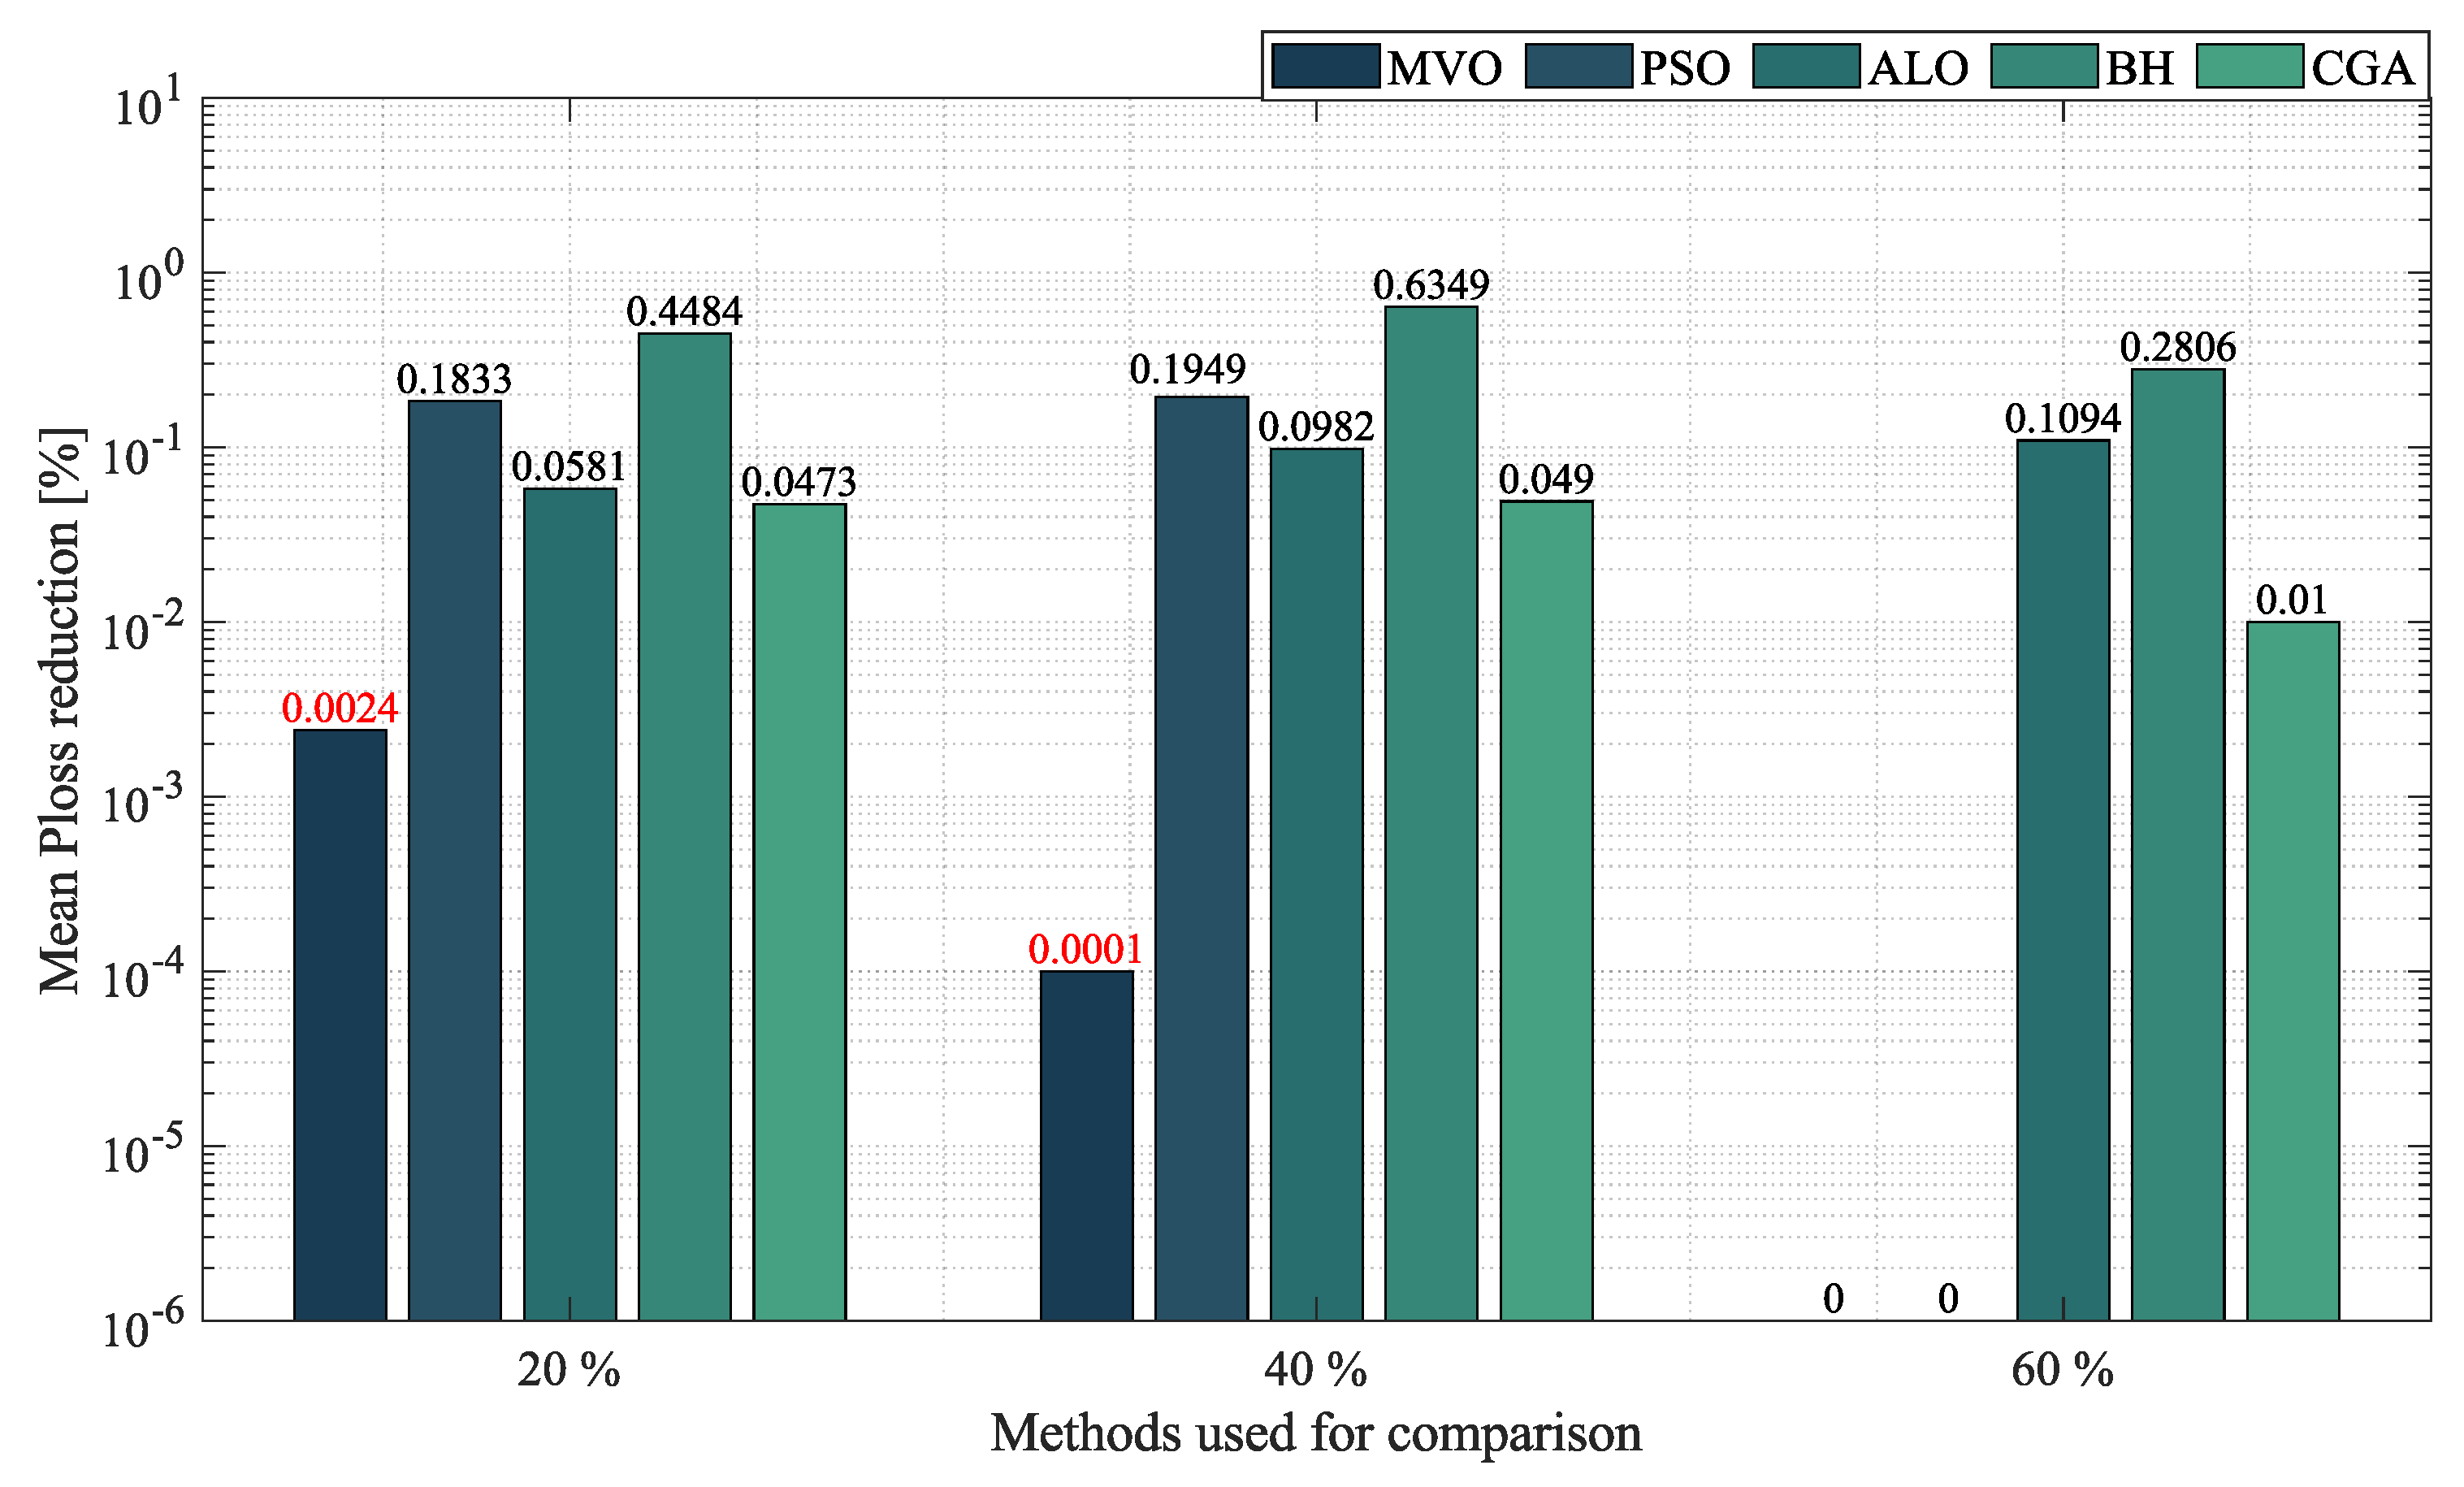
Figure 9 depicts the difference between each optimization technique used for comparison and the proposed methodology in terms of minimum P l o s s reduction at penetration levels of 20 % , 40 % and 60 % , respectively. In the first penetration level (20%), the SSA, the MVO, and PSO exhibited the same minimum power loss reduction ( 39.5680 % ), outperforming the ALO, the CGA and BH by 0.0021 % , 0.0098 % and 0.0603 % , respectively. For the second penetration level (40%), the SSA achieved the best minimum P l o s s reduction, outperforming the MVO by 1 × 10 5 % , PSO by 2 × 10 5 % , the ALO by 0.0043 % , the CGA by 0.0118 % and BH by 0.0583 % . Finally, at the third penetration level (60%), the SSA, the MVO, and PSO reached the best minimum P l o s s reduction with 59.3423 % , outperforming the CGA by 0.0007 % , the ALO by 0.0011 % , and BH by 0.0121 % .
To continue with the analysis, Figure 10 illustrates the difference between the SSA and the other optimization techniques in terms of average P l o s s reduction at the three penetration levels of distributed generation. At 20 % penetration, the SSA presented a reduction in average P l o s s of 39.5652 % . It was outperformed by the MVO by 0.0024 % , but it outperformed the CGA, the ALO, PSO, and BH by 0.0473 % , 0.0581 % , 0.1833 % and 0.4484 % , respectively. At 40 % penetration, the SSA achieved a reduction in average P l o s s of 57.1625 % . It was outperformed by the MVO by an almost negligible difference ( 0.0001 % ) and outperformed the CGA by 0.0490 % , the ALO by 0.0982 % , PSO by 0.1949 % and BH by 0.6349 % . Finally, at 60 % penetration, the SSA, the MVO and PSO obtained the same reduction in average P l o s s ( 59.3423 % ), outperforming the CGA, the ALO and BH by 0.0100 % , 0.1094 % and 0.2806 % , respectively.
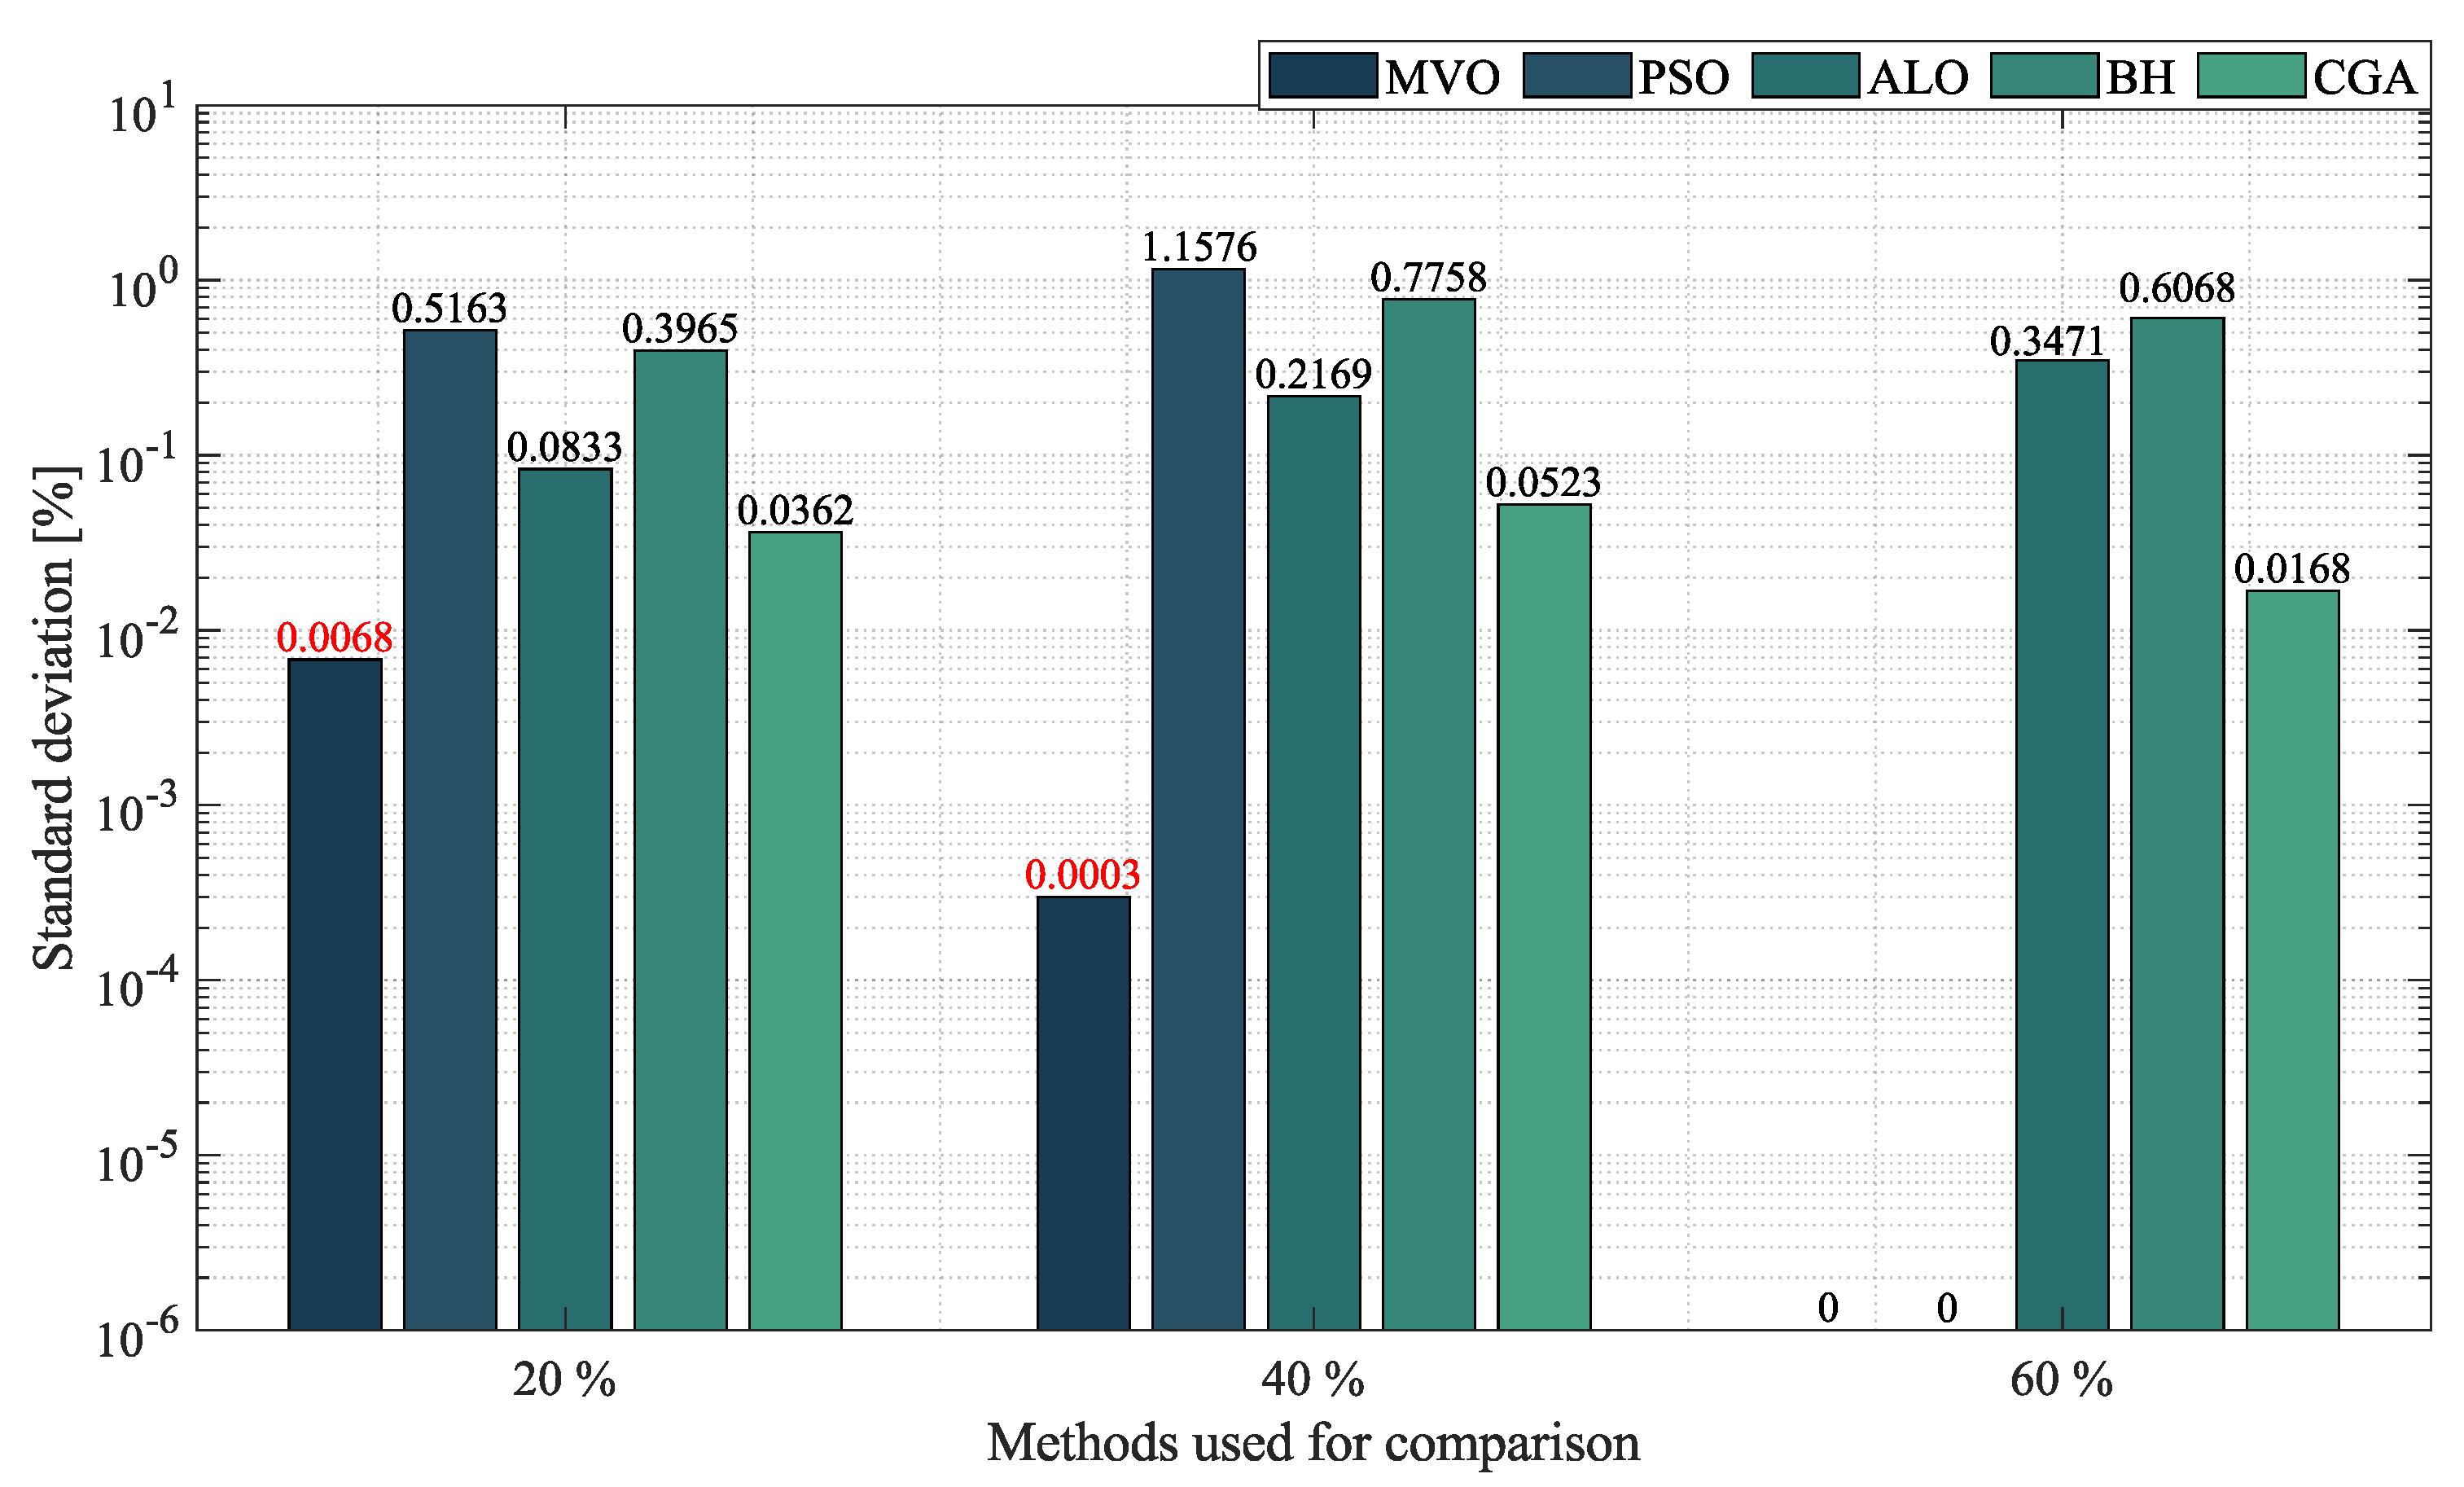
Figure 11 presents the STD reached by each optimization methodology at the three penetration levels used for the distributed generation. For 20 % penetration level, the SSA presented a STD of 0.0077 % . It was outperformed only by the MVO by 0.0068 % . By reducing the STD with respect to the CGA, ALO, BH and PSO in 0.0362 % , 0.0833 % , 0.3965 % and 0.5163 % , respectively. When the 40 % penetration level was analyzed, the proposed algorithm reached a STD of 0.0012 % . It was outperformed by the MVO again by just 0.0003 % and outperformed the CGA by 0.0523 % , the ALO by 0.2169 % , BH by 0.7758 % and PSO by 1.1576 % . Finally, at 60 % penetration level, the SSA, the MVO and PSO presented the same STD ( 8.65 × 10 11 ), outperforming the CGA by 0.0168 % , the ALO by 0.3471 % and BH by 0.6068 % .
According to these results, the solution methodology proposed in this study is the most suitable in terms of minimum P l o s s reduction. It also showed an outstanding performance in reducing the average P l o s s , as it outperformed most of the other techniques and was only outperformed by the MVO.

6.1.3. 69-Node Radial Test System

Table 6 shows the results reached by each algorithm in the 69-node radial test system. This table, which is organized the same way as Table 4 and Table 5, also includes (in its upper part) the P l o s s of the system in the base case, i.e., 242.1523 kW, and the maximum current that can be supported by the conductor selected for this system (a 50 kcmil conductor operating at 60 °C), i.e., 400 A. Based on the information reported in this table, we constructed Figure 12, Figure 13 and Figure 14, which illustrate the minimum P l o s s reduction, the average P l o s s reduction and the STD obtained by the optimization algorithms, respectively.
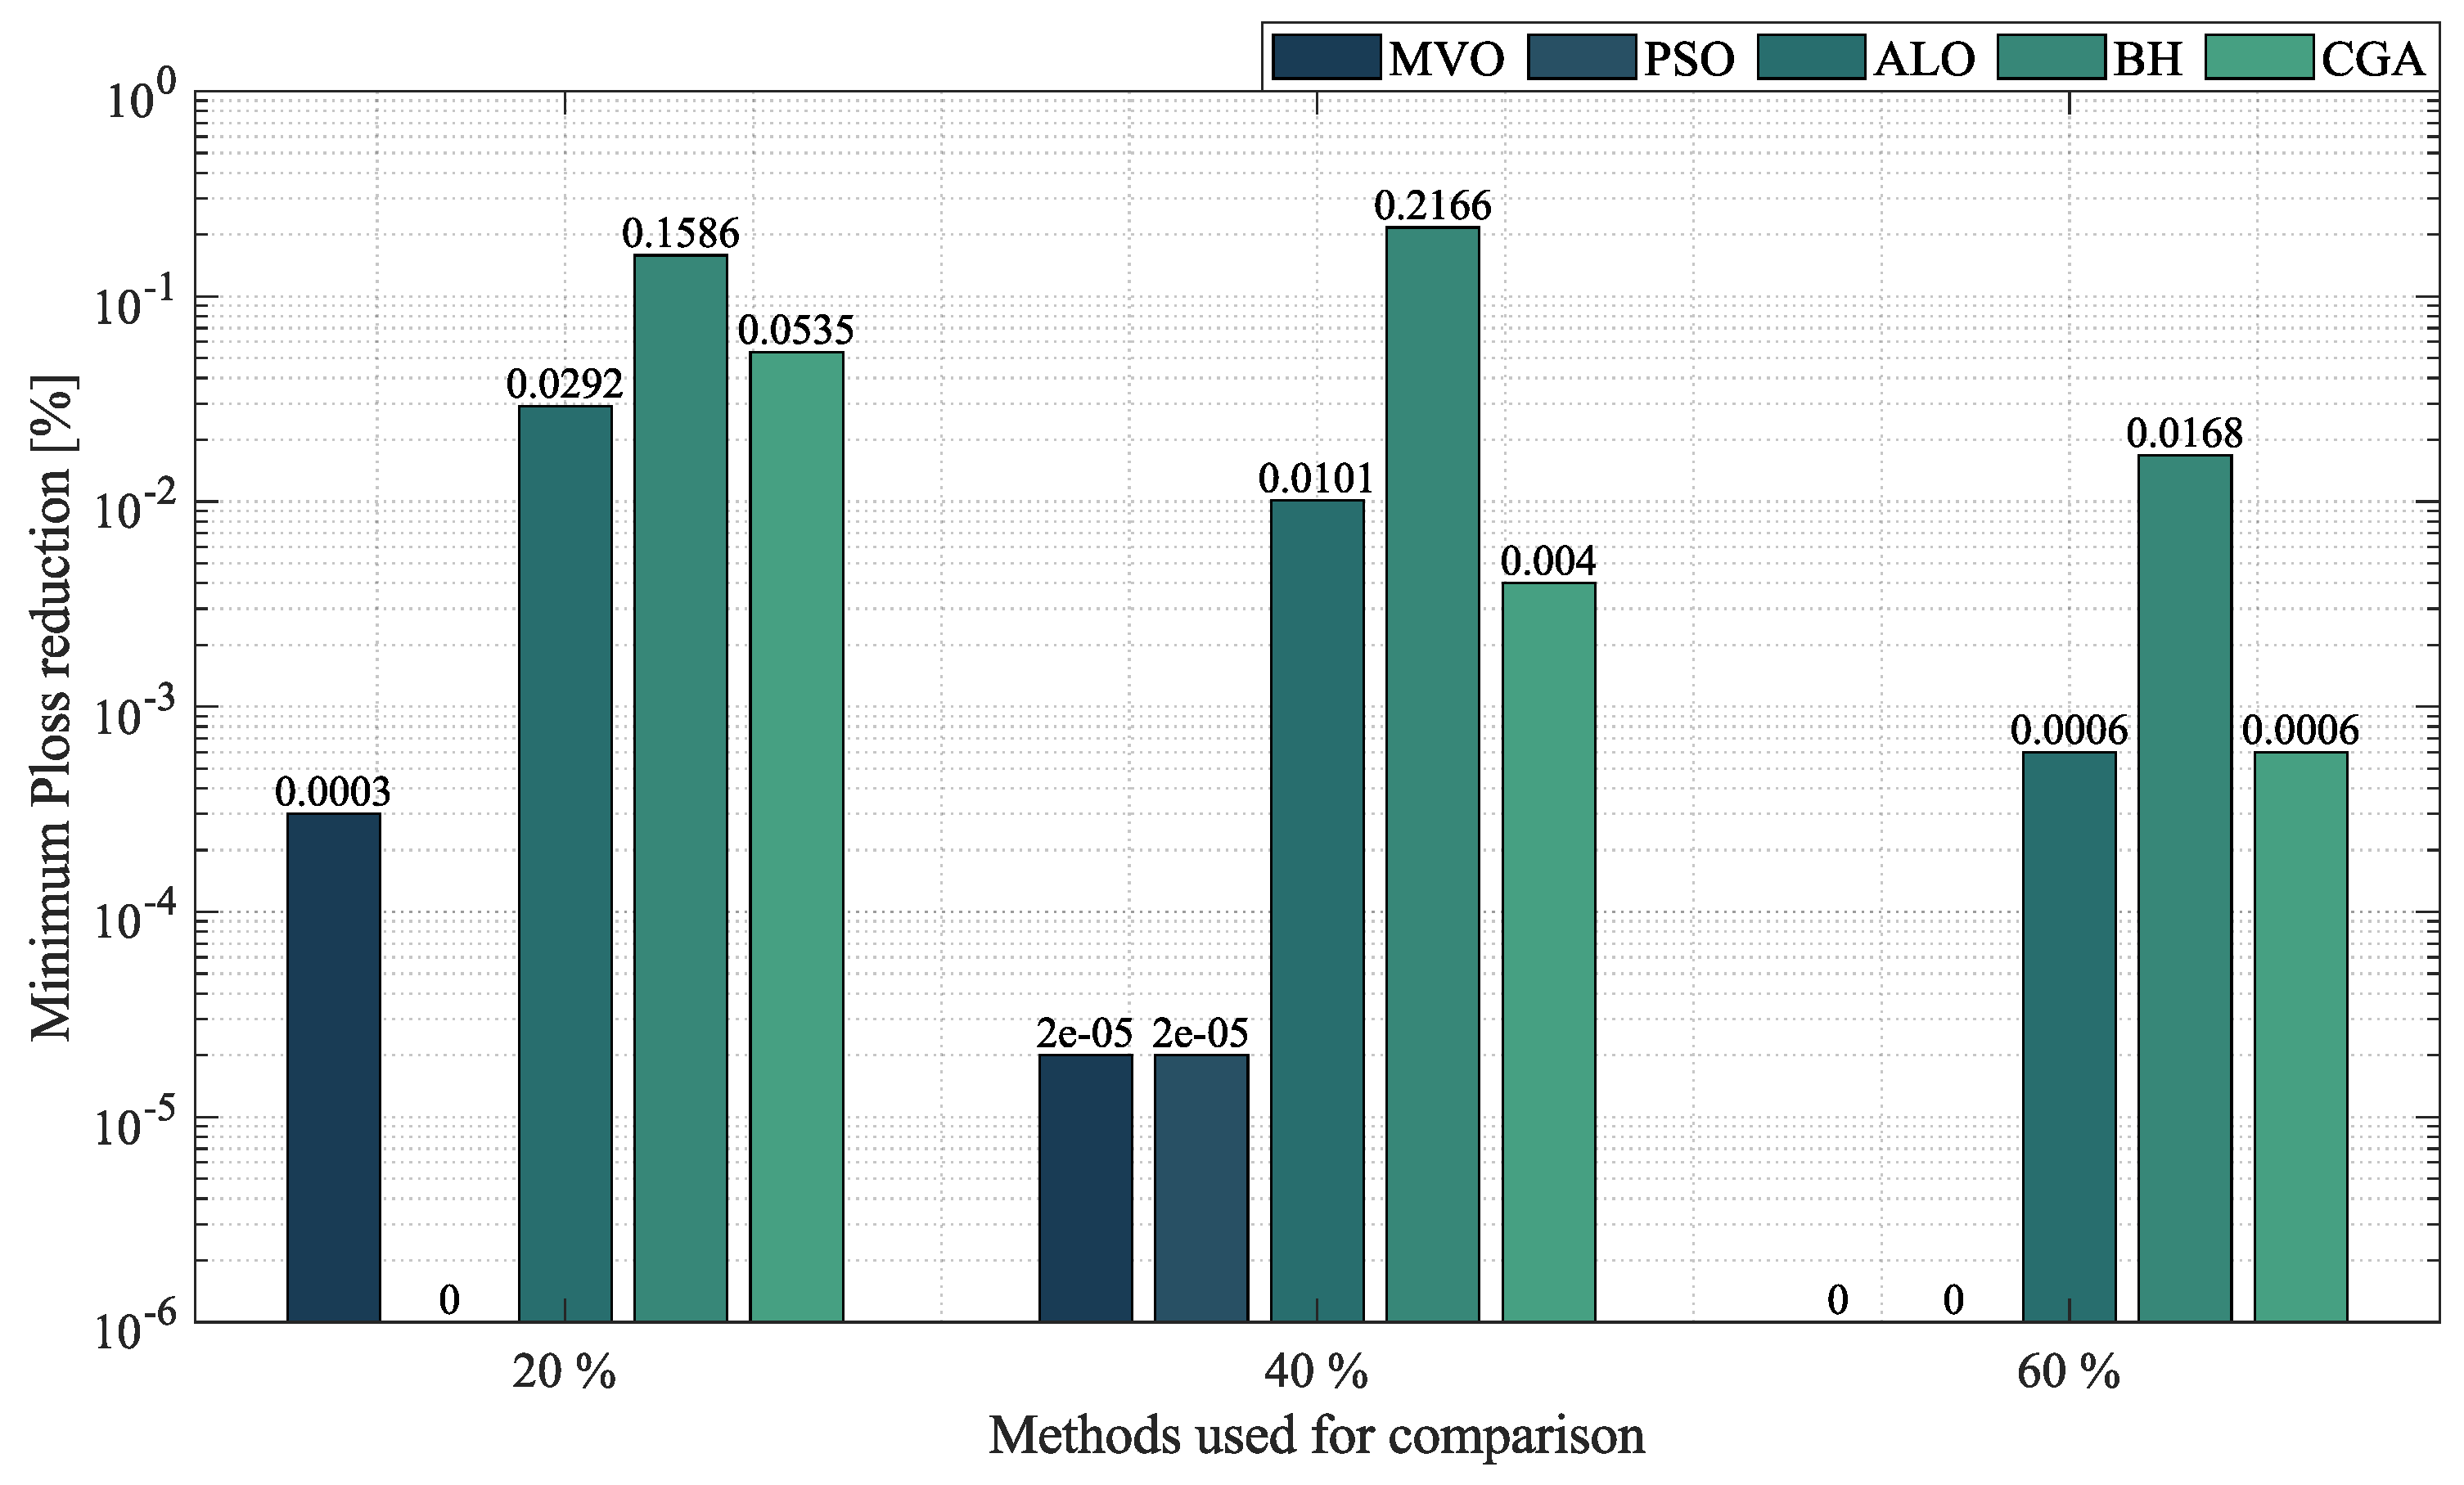
Figure 12 shows the difference between the SSA and the other optimization techniques in terms of minimum P l o s s reduction at the three penetration levels of distributed generation. At 20 % penetration, the SSA and PSO presented the same reduction in minimum P l o s s ( 44.8435 % ), outperforming the MVO, the ALO, the CGA and BH by an average percentage of 0.0604 % . At 40 % penetration, the minimum P l o s s obtained by the SSA was 86.4573 kW, for a reduction of 64.2963 % with respect to the base case. It outperformed the MVO and PSO by 2 × 10 5 , the CGA by 0.0040 % , the ALO by 0.0101 % and BH by 0.2166 % . Finally, at 60 % penetration, the SSA, the MVO and PSO exhibited the same reduction in minimum P l o s s ( 68.2193 % ), outperforming the CGA and the ALO by 0.0006 % and BH by 0.0168 % .
Regarding average P l o s s , Figure 13 compares the average P l o s s reduction obtained by each optimization algorithm at the three penetration levels of distributed generation. At 20 % penetration, the SSA achieved a reduction in average P l o s s of 44.8055 % . It was outperformed by the MVO by 0.0355 % , but it outperformed the other techniques by an average percentage of 0.6348 . At 40 % penetration, the SSA presented a reduction in average P l o s s of 64.2955 % . It was outperformed by the MVO by an almost negligible difference ( 0.0003 % ) and outperformed the CGA by 0.0584 % , PSO by 0.0785 % , the ALO by 0.2505 % and BH by 1.6598 % . Finally, at 60 % penetration, the SSA, the MVO and PSO exhibited the same reduction in minimum P l o s s ( 68.2193 % ), outperforming the CGA, the ALO, and BH by 0.0116 % , 0.1788 % , and 0.8731 % , respectively.
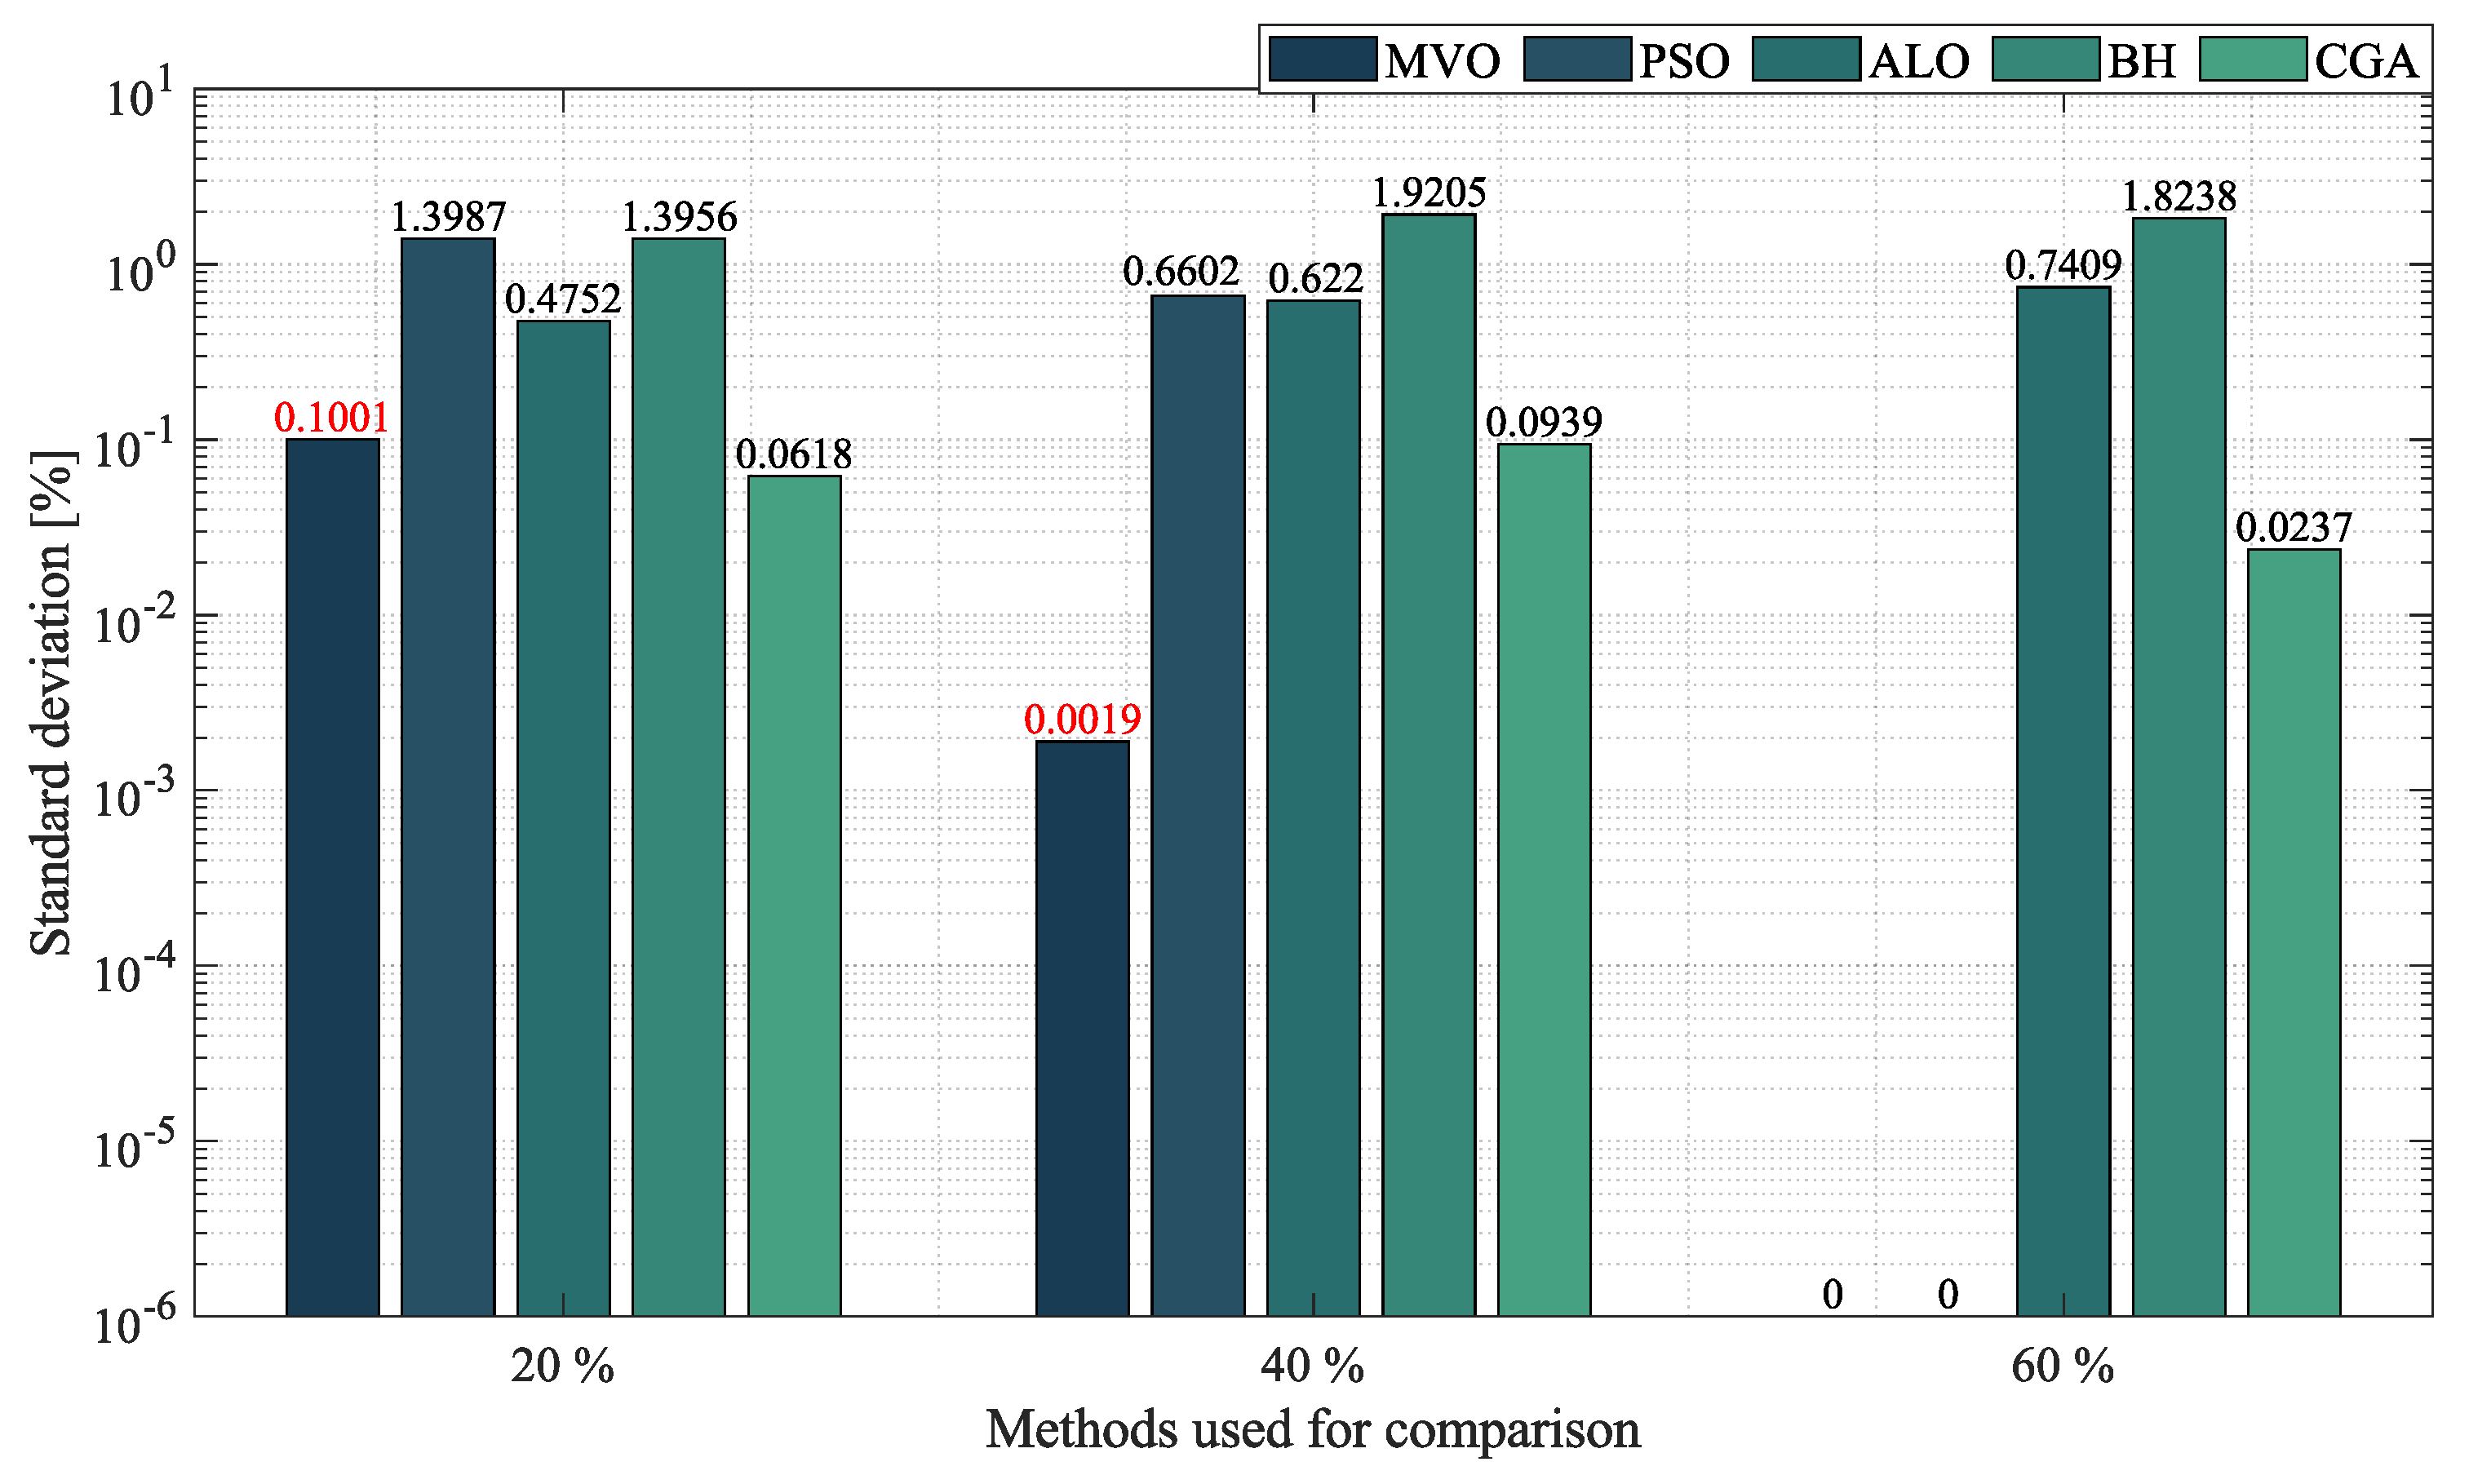
To finish the simulations of the 69-node radial test system, Figure 14 presents the STD reached by each method at the distribution generation penetration levels of 20 % , 40 % and 60 % . For the penetration level of 20%, the SSA obtained a STD of 0.1034 % . It was outperformed by the MVO by 0.1001 % by reducing the STD in relation to the other comparison methodologies in 0.8328 % . In relation to the penetration level of 40%, the MVO exhibited a STD of 0.0017 % , outperforming the SSA by only 0.0019 % . In this scenario, the SSA was followed by the CGA, the ALO, PSO and BH, with a difference in STD with respect to the SSA of 0.0939 % , 0.6222 % , 0.6602 and 1.9205 % , respectively. Finally, at the last penetration level (60%), the SSA, the MVO, and PSO reached the same STD (around 1 × 10 6 ). The SSA outperformed the other algorithms by an average percentage of 0.8628 % .
After a general analysis of these results, the SSA proved to be the most suitable algorithm in terms of minimum P l o s s reduction. It also produced excellent results in terms of average P l o s s reduction, and it was only outperformed by the MVO. Moreover, it obtained an excellent standard deviation, which guarantees that a high-quality solution can be found every time the algorithm is executed.

6.2. Mesh Test Systems

This subsection studies the results reached by each optimization method employed to solve the OPF problem in AC grids with a mesh topology.

10-Node Mesh Test System

Table 7 presents the results reached by each method used to solve the OPF problem in the 10-node mesh test system. Based on the information reported in this table, which is organized the same way as Table 4, Table 5 and Table 6, we constructed Figure 15, Figure 16 and Figure 17, which compare the minimum P l o s s reduction, the average P l o s s reduction, and the STD obtained by the optimization techniques, respectively. After running a load flow analysis for this system, the P l o s s in the base case was 190.3237 kW.
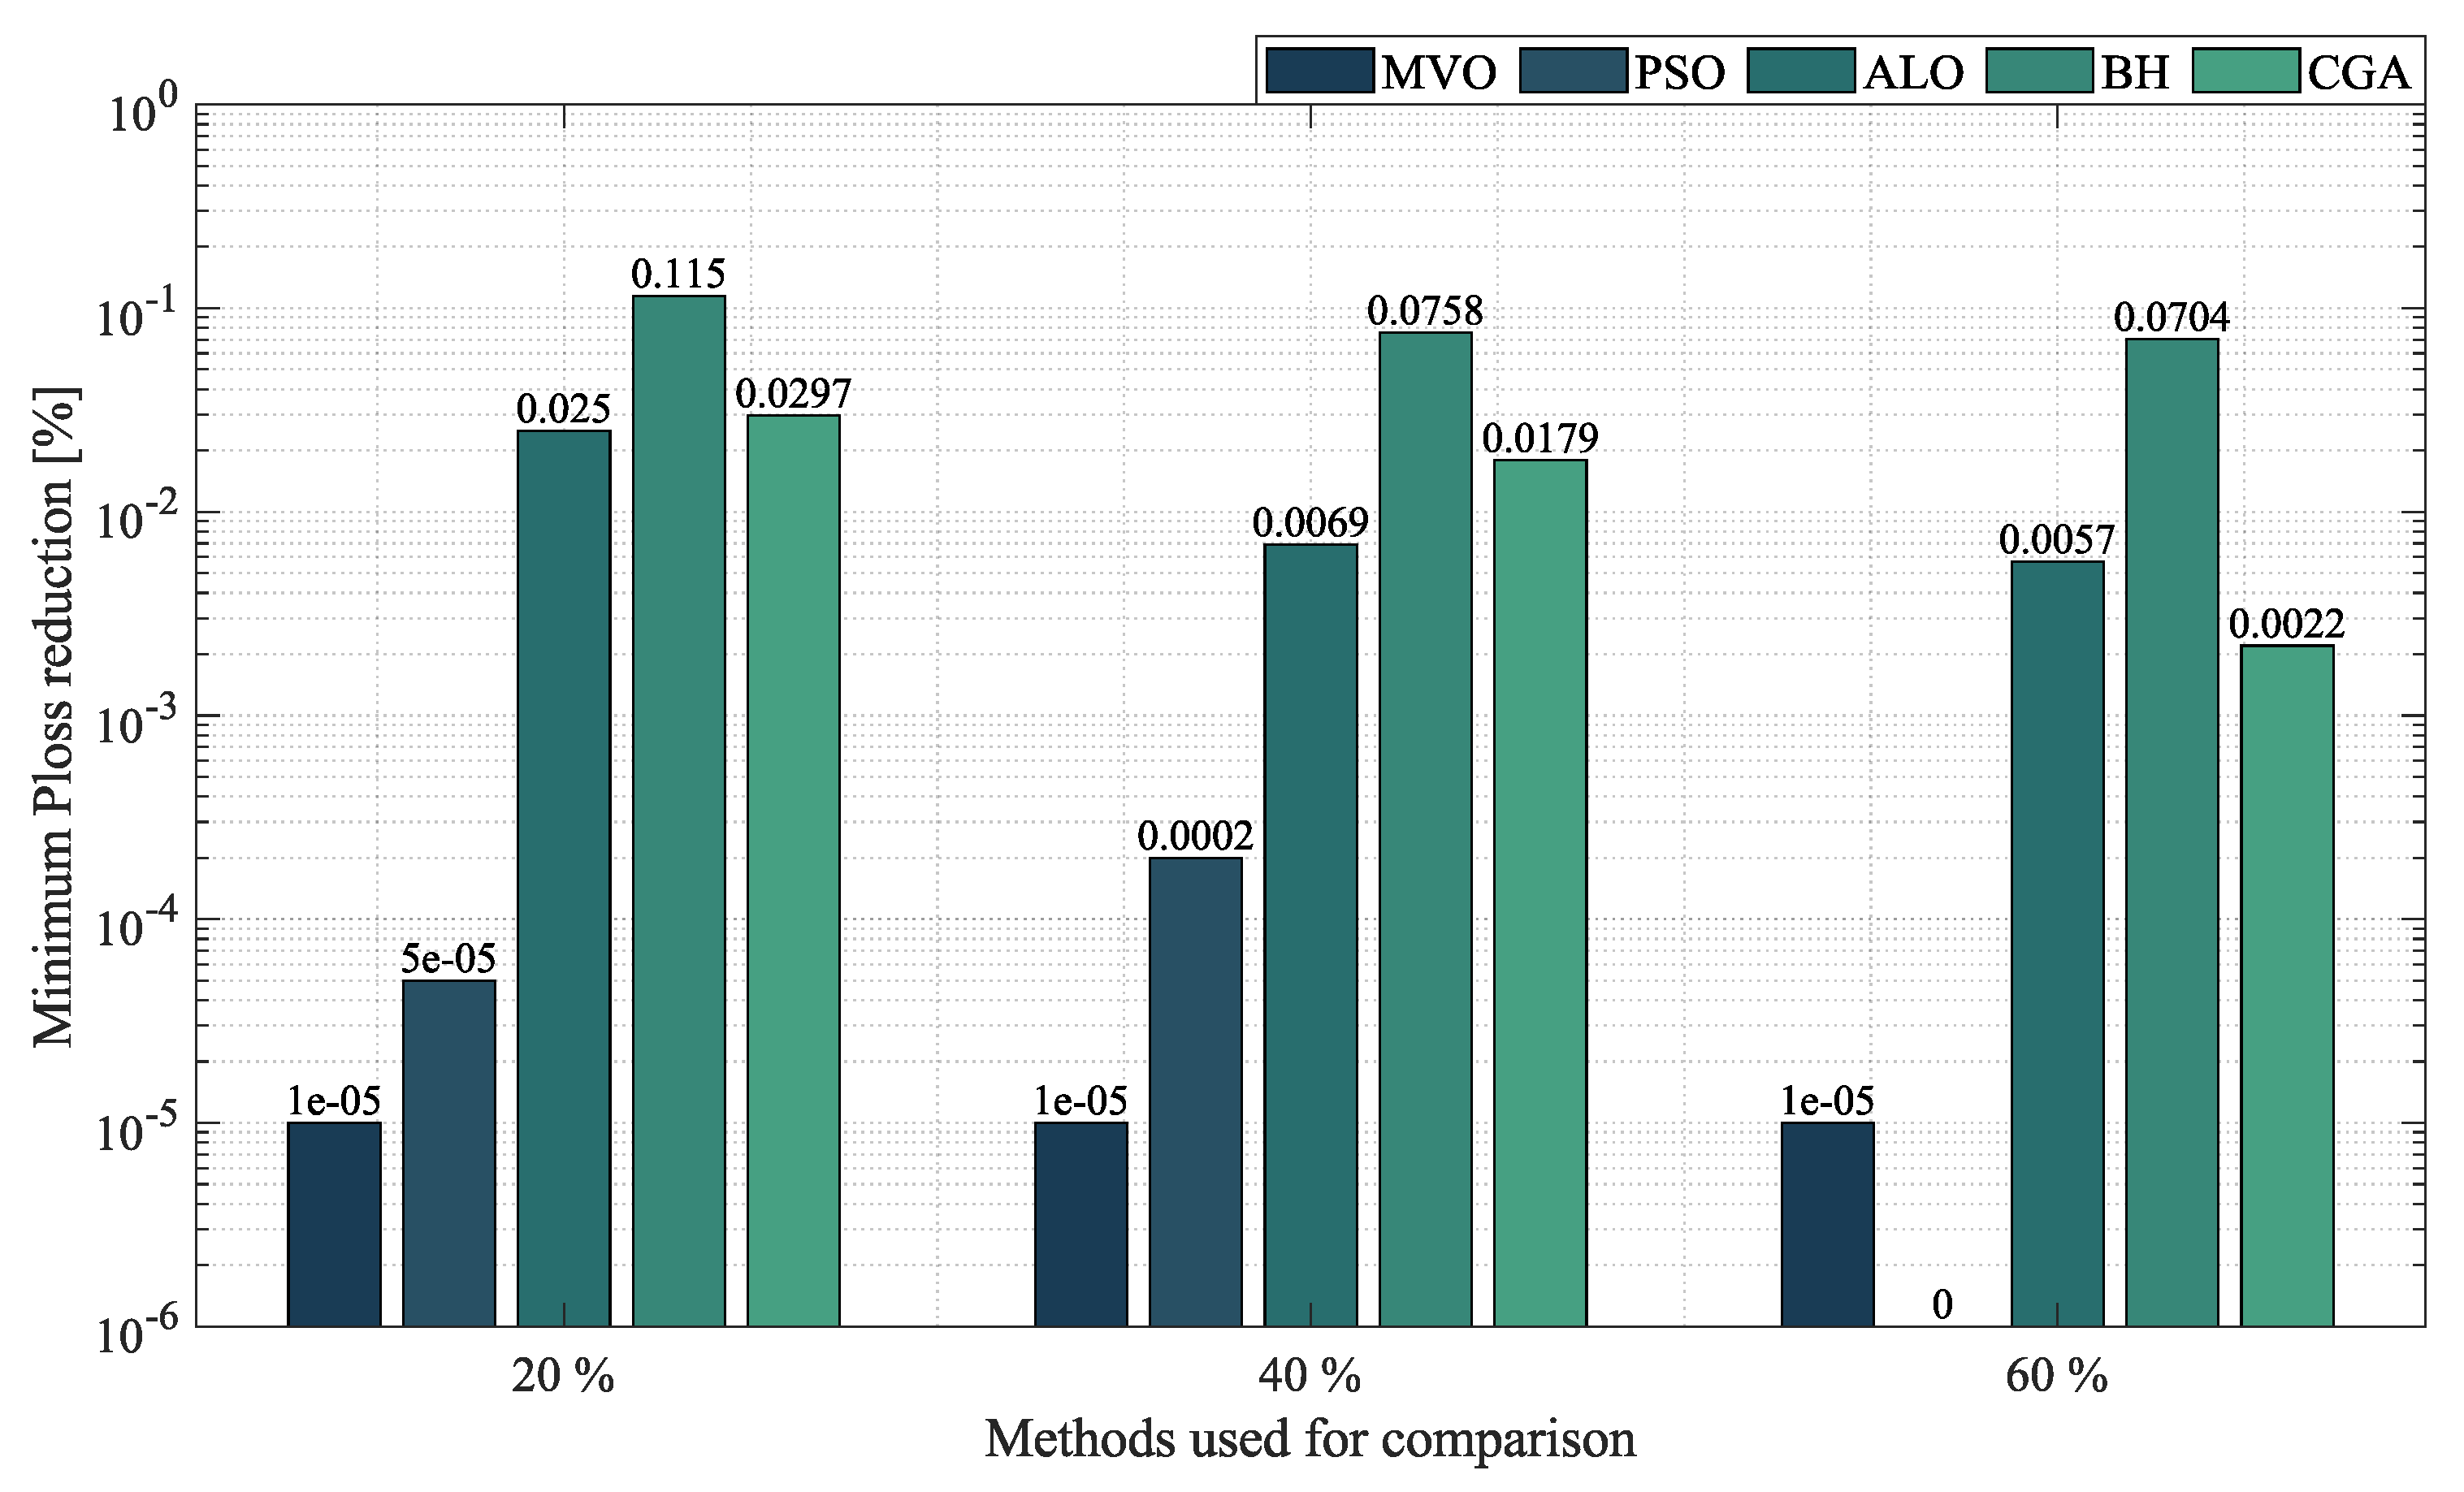
Figure 15 shows the difference between the proposed methodology and the other optimization techniques in terms of minimum P l o s s reduction at the three levels of penetration of distributed generation. At 20 % penetration, the SSA achieved the best reduction in minimum P l o s s ( 44.9617 % ), outperforming the MVO, PSO, the ALO, the CGA and BH by 1 × 10 5 % , 5 × 10 5 % , 0.0250 % , 0.0297 % and 0.115 % , respectively. At 40 % penetration, the SSA provided the best solution, with a reduction of 69.2705 % in minimum P l o s s , outperforming all the other techniques by an average percentage of 0.0202 % . Finally, at 60 % penetration, the SSA and PSO presented the best reduction in minimum P l o s s ( 79.3054 % ), outperforming the MVO by 1 × 10 5 , the CGA by 0.0022 % , the ALO by 0.0057 % and BH by 0.0704 % .
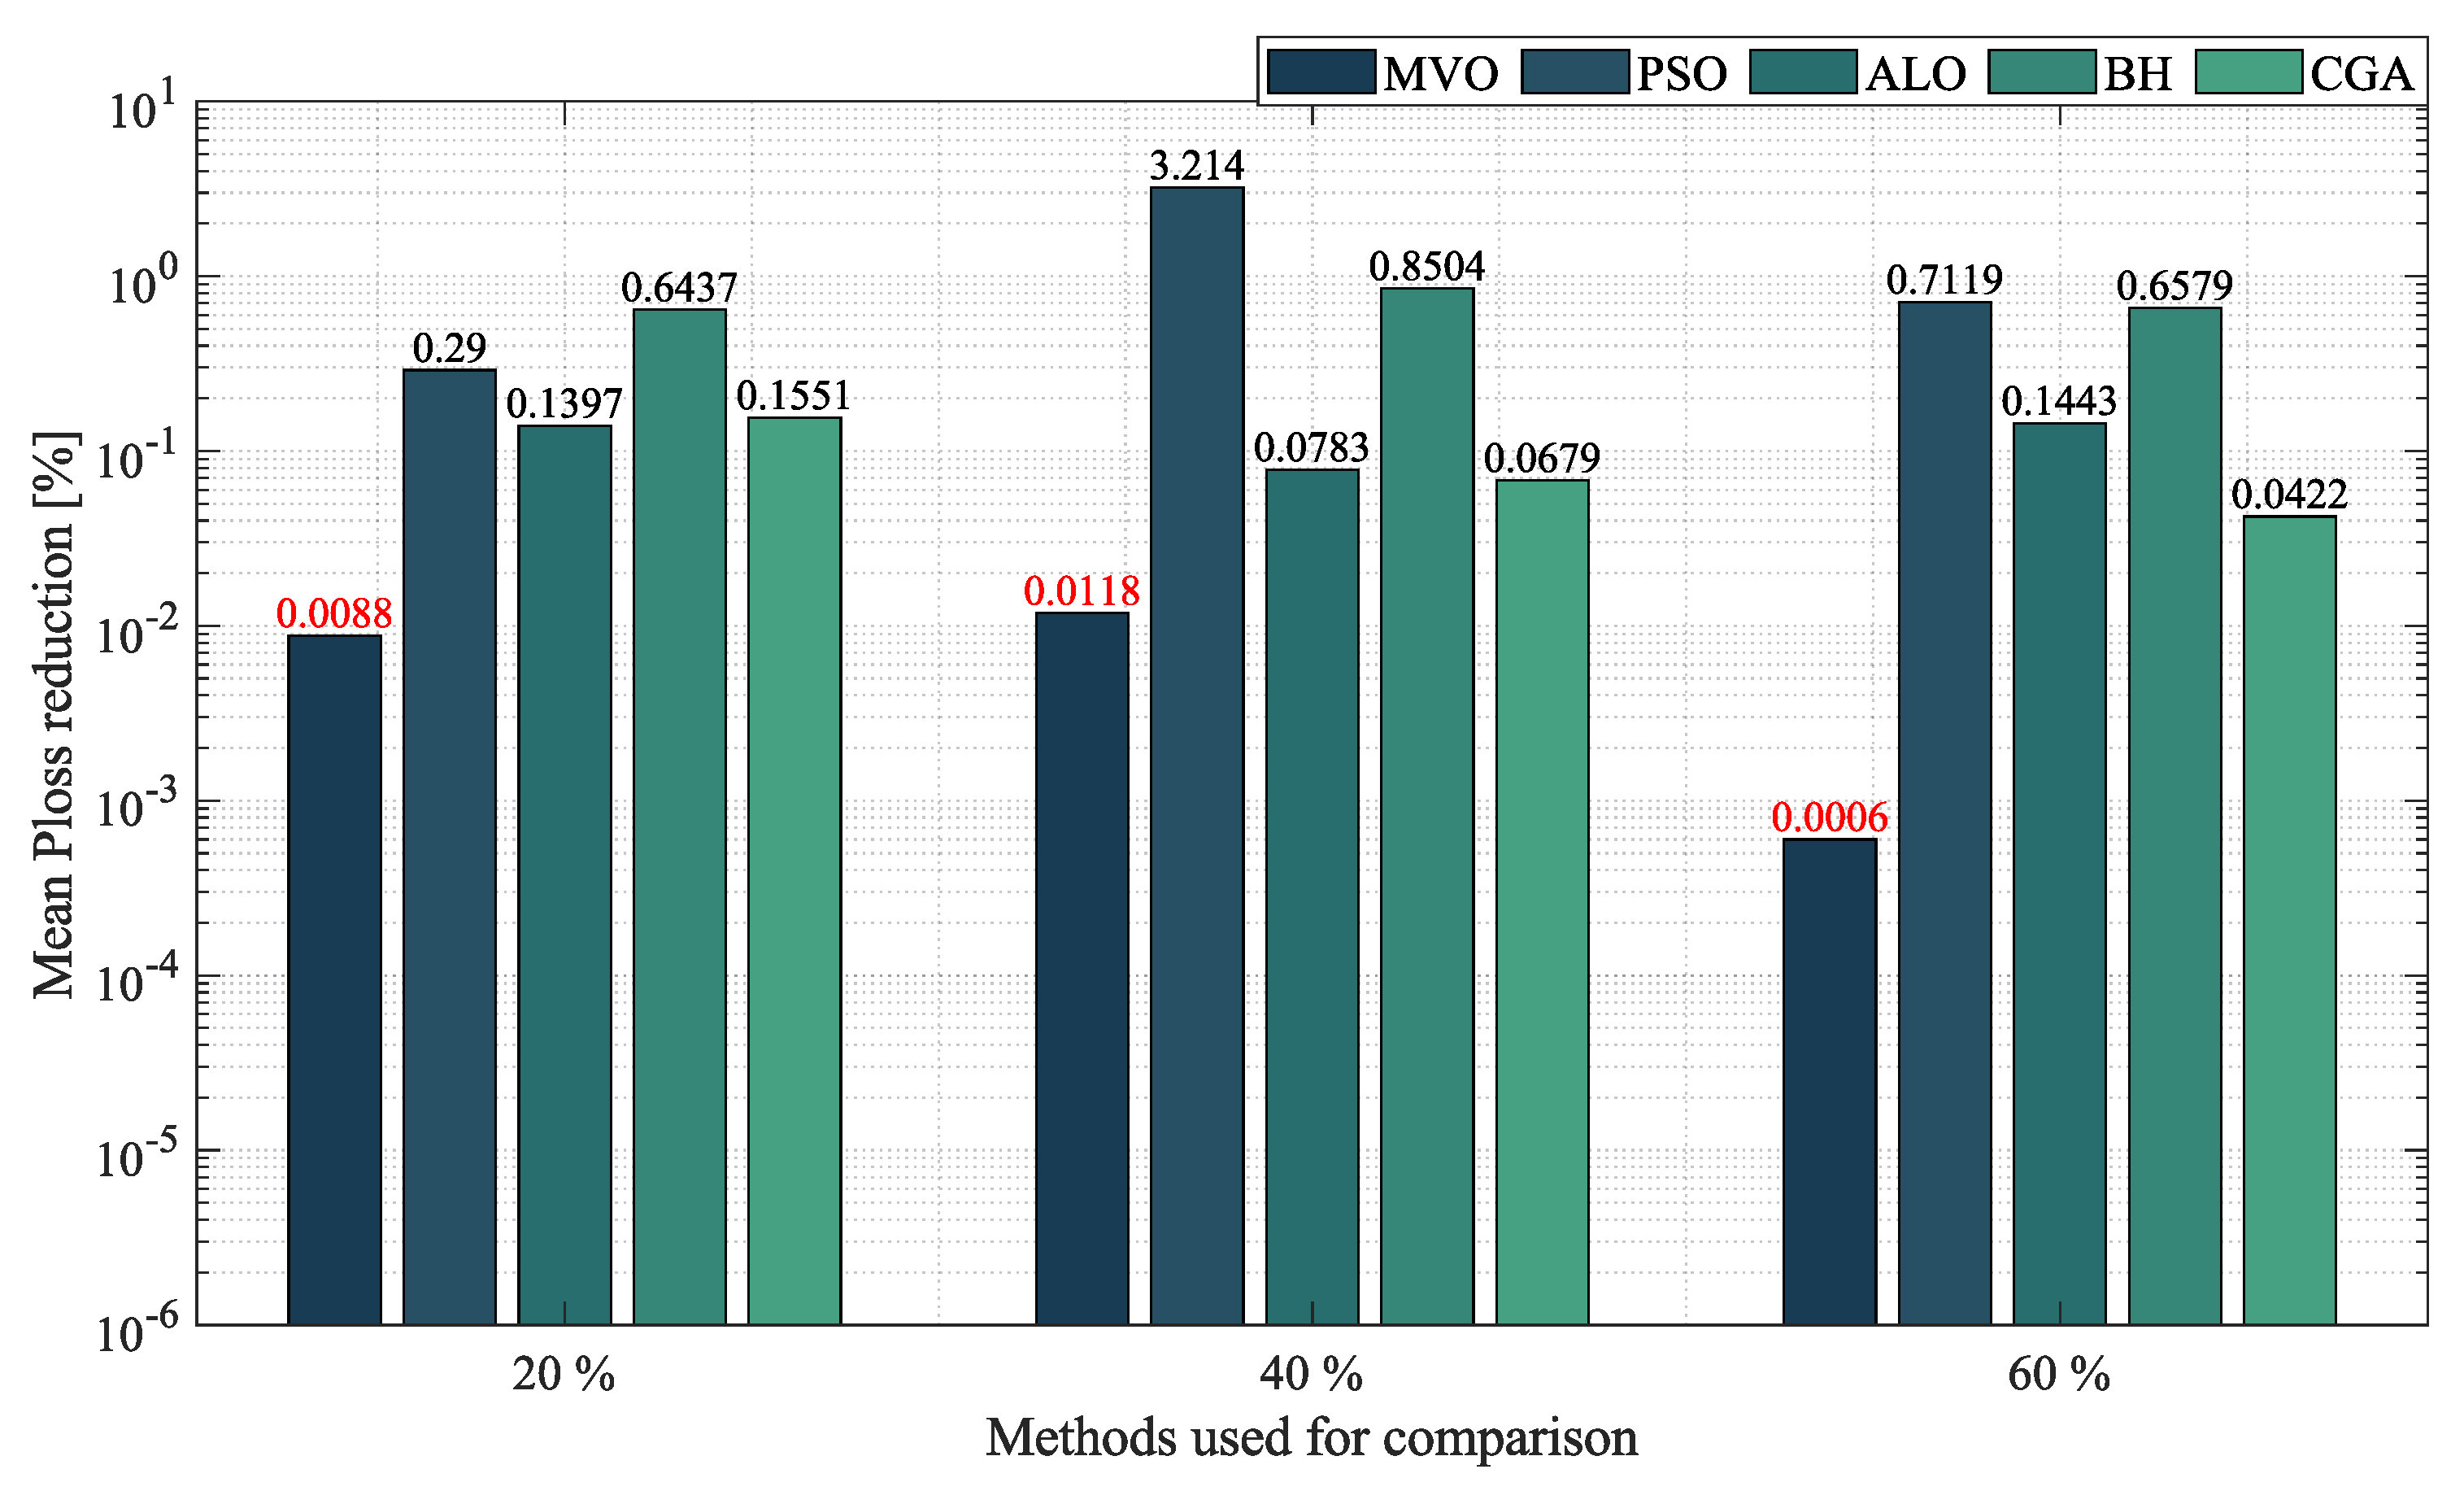
As for minimum P l o s s , Figure 16 compares the average P l o s s reduction reached by the SSA and the other methodologies at the penetration levels of 20 % , 40 % and 60 % . At the first penetration level, the SSA achieved a reduction in average P l o s s of 69.2573 % . It was outperformed by the MVO by 0.0088 % , but it outperformed the ALO, the CGA, PSO and BH by 0.1397 % , 0.1551 % , 0.2900 % and 0.6437 % , respectively. At the second penetration level, the SSA reduced the average P l o s s by 69.2573 % . It was outperformed by the MVO by 0.0118 % , but it outperformed the CGA, the ALO, BH and PSO by an average percentage of 1.0527 % . Finally, at the last penetration level, the SSA was outperformed by the MVO by just 0.0006 % , but it outperformed the other optimization techniques by an average percentage of 0.3891 % .
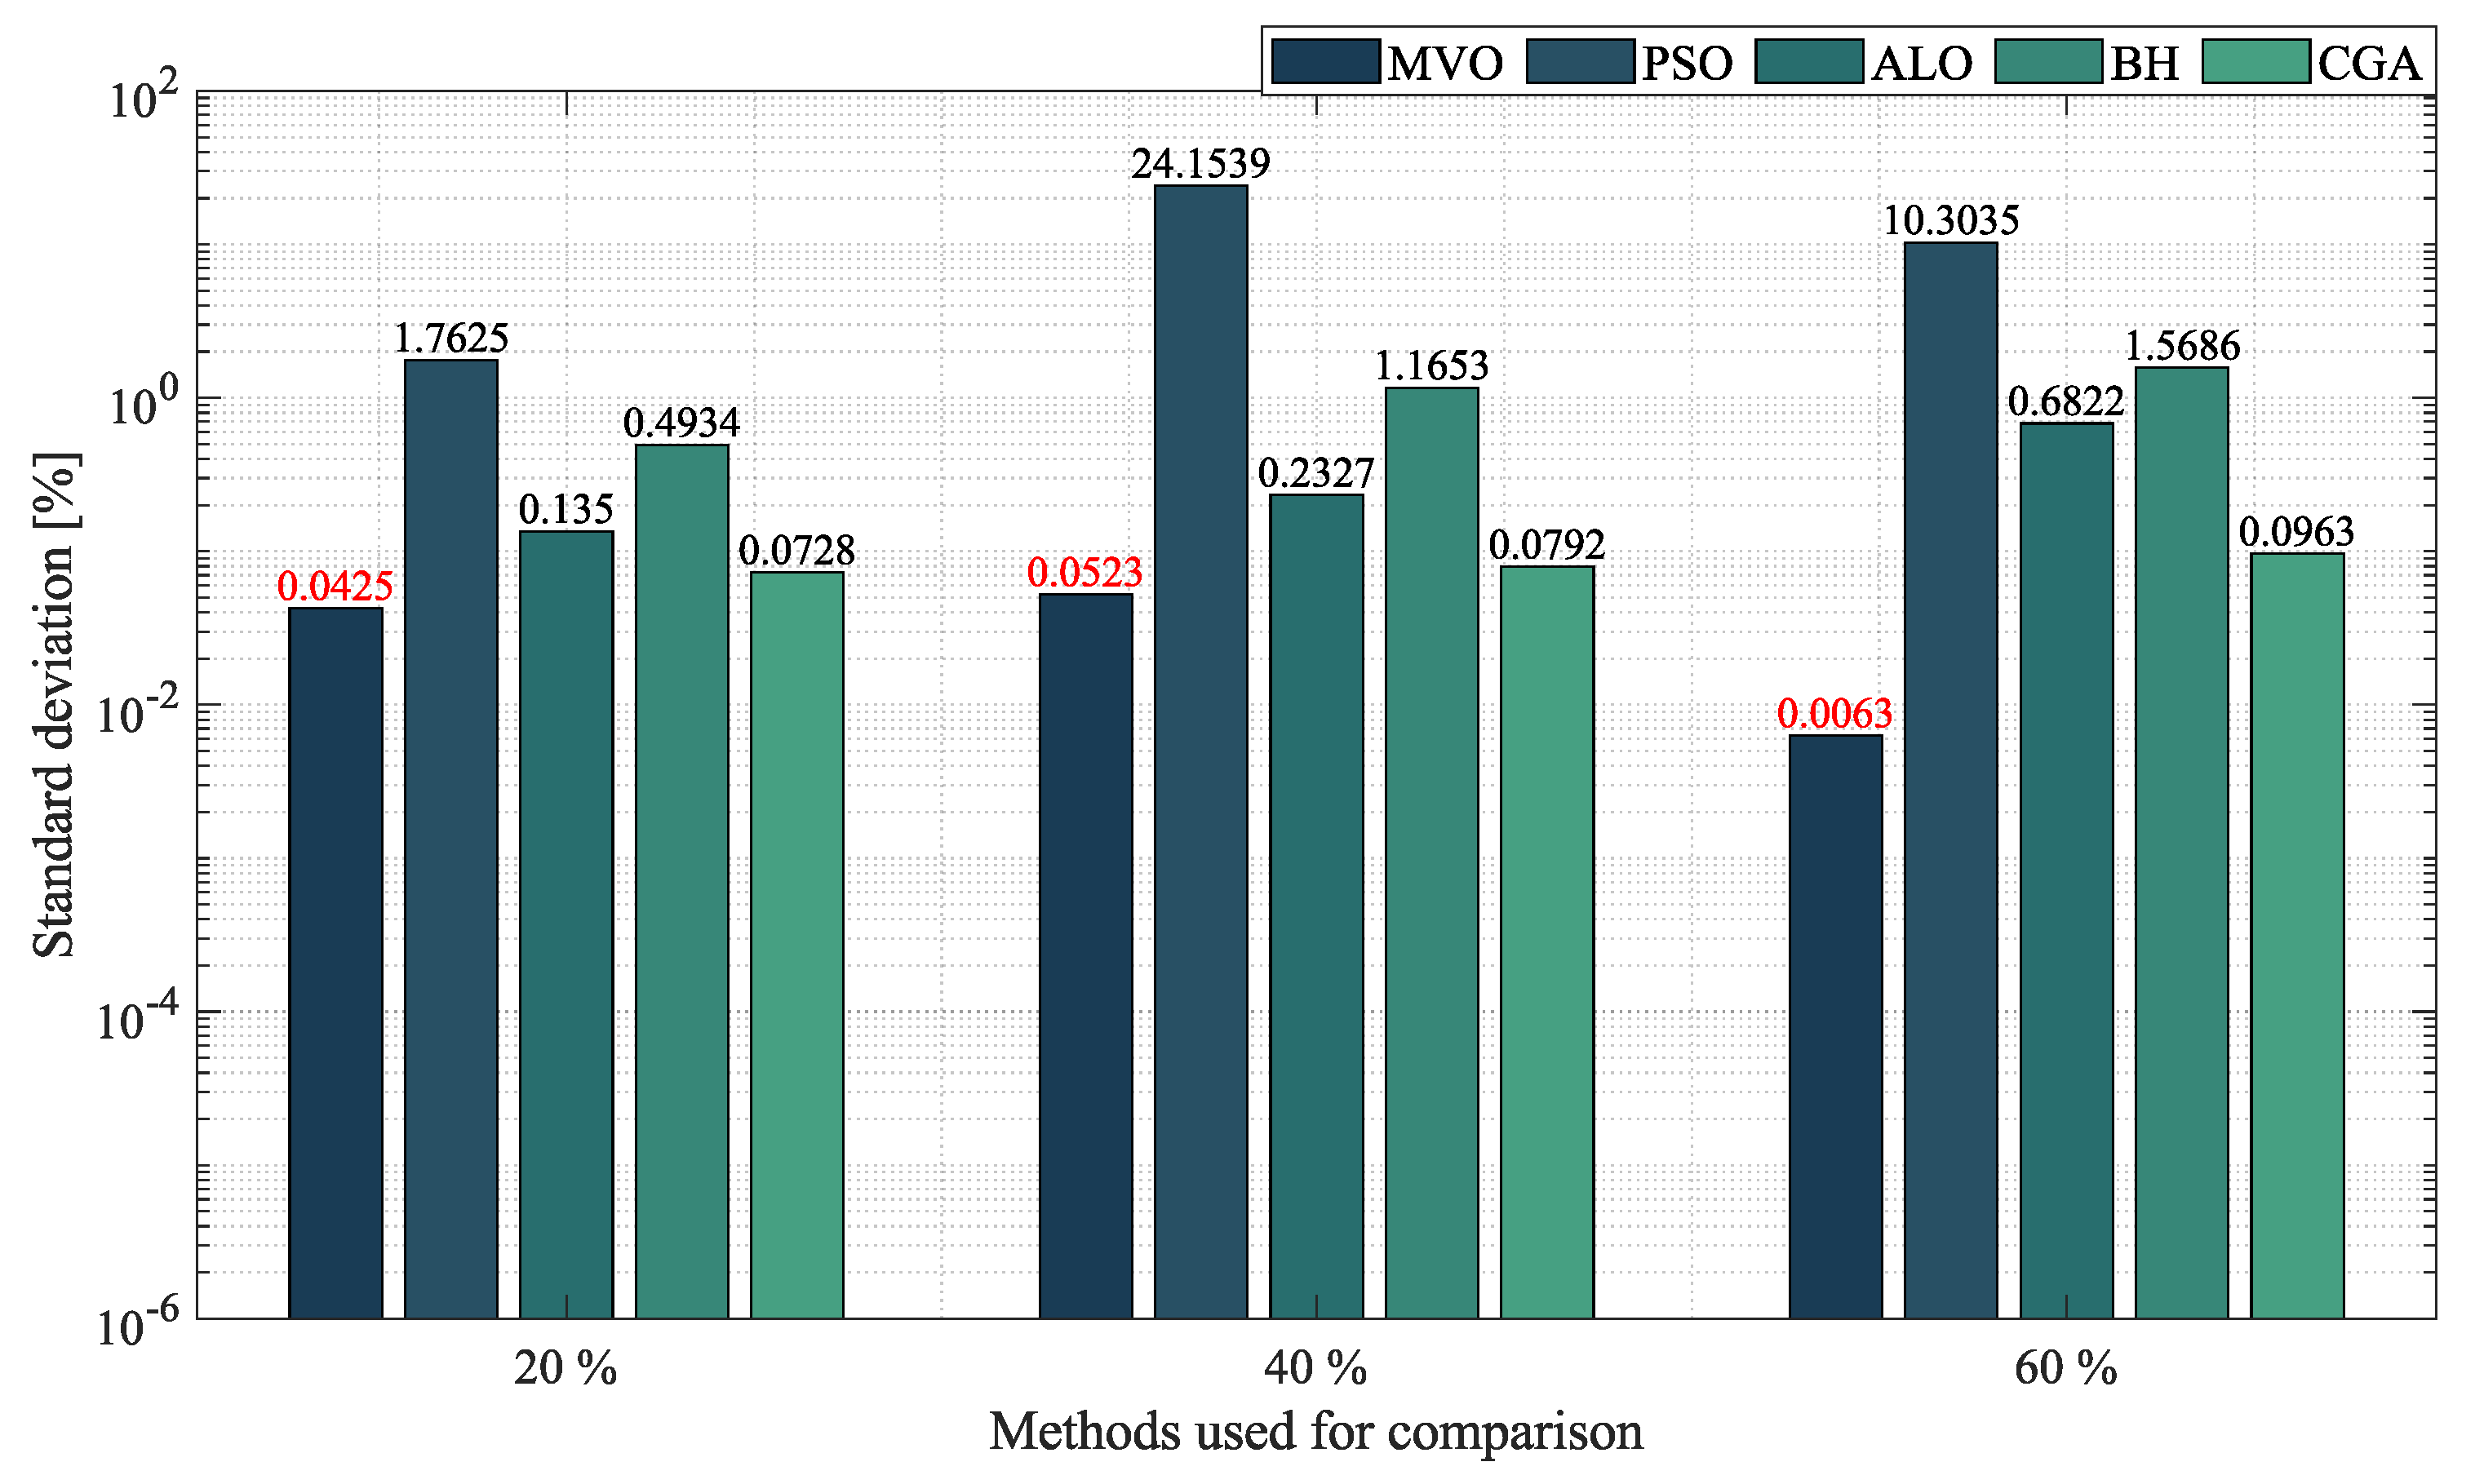
To complete the analysis of the 10-node mesh test system, Figure 17 compares the STD reached by each algorithm with that obtained by the SSA. At 20 % penetration, the SSA presented a STD of 0.0446 % . It was outperformed by the MVO by 0.0425 % , but it outperformed the CGA, the ALO, BH and PSO by 0.0728 % , 0.1350 % , 0.4934 % and 1.7425 % , respectively. At 40 % penetration, the SSA obtained a STD of 0.058 % . It was outperformed by the MVO by 0.0522 % , but it outperformed the other optimization techniques by an average percentage of 6.4658 % . Finally, at 60 % penetration, the SSA ranked second, with a STD of 0.0081 % . It was outperformed by the MVO by 0.0063 % , but it outperformed the other optimization algorithms by an average percentage of 3.1708 % .
After a general analysis of these results, the SSA achieved the best reduction in minimum P l o s s in the 10-node mesh test system in a very short processing time and with a remarkable STD. It was only outperformed by the MVO in terms of STD.
According to the results presented in this section, the SSA showed an outstanding performance in terms of minimum P l o s s , as, in most cases, it provided the best solution and reduction in a short processing time. In terms of STD, it provided the best solution in some scenarios and ranked second in the other scenarios, in which it was only outperformed by the MVO. For these reasons, we may conclude that the SSA is the most suitable algorithm to solve the OPF problem in AC networks with both radial and mesh topologies.

7. Conclusions

The OPF problem in AC distribution networks with high penetration of dispersed generation was addressed in this research through application of a master–slave optimization methodology. The master stage was entrusted with determining the amount of power injection of each DG connected to the AC grid using a continuous codification by applying the SSA. The slave stage dealt with the solution of the power flow problem by using the successive approximation method that evaluates the feasibility of the power injected in all the power sources in terms of voltage regulation, current limits and power generation capacities. The objective of the OPF problem was the reduction of the grid power losses for a particular load condition, which allowed confirmed the effectiveness of the SSA approach when was compared with recent literature reports.
Comparative analysis with different literature algorithms such as PSO, CGA, BH, MVA and ALO, which are efficient optimization techniques to deal with large-scale complex continuous optimization problems in the 10-, 33- and 69-bus grids with radial and meshed configurations demonstrated that the proposed SSA approach has better numerical performance for all the scenarios of power injection considered, i.e., 20 % , 40 % , and 60 % of the power supplied by the main generator in an environment without DGs. Note that to ensure a fair comparison between all the presented algorithms, all of them were evaluated 100 consecutive times and tuned appropriately.
  • In the case of radial networks, the SSA proved to be superior in terms of minimum P l o s s reduction, as it outperformed the other optimization algorithms by an average percentage of 0.0433 % , 0.0107 % , and 0.0327 % in the 10-, 33- and 69-node radial test systems, respectively. It produced such good results in short processing times and with low standard deviations: an average processing time of 3.49 s, 9.94 s, and 43.52 s in the 10-, 33- and 69-node radial test systems, respectively, and an average STD of 0.013 % at the three penetration levels of distributed generation ( 20 % , 40 % and 60 % ). This demonstrates the superiority and convergence capacity of the SSA, which is why we may conclude that it is the most suitable optimization algorithm to solve the OPF problem in radial networks of any size.
  • In the case of mesh networks, the SSA also proved its superiority, as it provided the best solution in terms of minimum P l o s s reduction in every test scenario, with an average reduction of 64.5125 % , outperforming the other algorithms by an average percentage of 0.034 % . It produced such results in processing times of around 0.058 s and with an average STD of 0.0369 % . This demonstrates the superiority of the SSA in providing the best solution in terms of minimum P l o s s reduction in very short processing times. Thus, we may conclude that it is the most suitable optimization algorithm to solve the OPF problem in mesh networks.
Future research could implement the methodology proposed in this paper to solve the OPF problem for a 24 h load flow, considering the integration of energy storage elements in the electrical network. Furthermore, the proposed solution methodology could be employed to solve the OPF problem using other objective functions, such as the reduction in the operating costs of the network, the minimization of C O 2 emissions (using photovoltaic panels as DGs) and the improvement of the operating conditions of AC networks. Finally, we recommend future studies to propose parallel processing tools, which could significantly reduce the processing times required by the optimization algorithms to find the best solution to the OPF problem.

Author Contributions

A.A.R.-M.: conceptualization, methodology, software, validation, formal analysis, investigation, resources, data curation, writing—-original draft, writing—-review and editing, visualization. J.M.: conceptualization, methodology, software, validation, formal analysis, investigation, resources, data curation, writing—original draft, writing—review and editing, visualization, supervision, project administration, acquisition of funds. L.F.G.-N.: conceptualization, methodology, software, validation, formal analysis, investigation, resources, data curation, writing—original draft, writing—review and editing, visualization, supervision, project administration, acquisition of funds. O.D.M.: conceptualization, methodology, software, validation, formal analysis, investigation, resources, data curation, writing-original draft, writing—review and editing, visualization, supervision, project administration, acquisition of funds. F.A.: conceptualization, methodology, writing—review and editing. All authors have read and agreed to the published version of the manuscript.

Funding

This material is based upon work supported by the U.S. Department of Energy’s Office of Energy Efficiency and Renewable Energy (EERE) under the Solar Energy Technologies Office Award Number DE-EE0002243-2144.

Institutional Review Board Statement

Not applicable.

Informed Consent Statement

Not applicable.

Data Availability Statement

No new data were created or analyzed in this study. Data sharing is not applicable to this article.

Acknowledgments

This research was supported by Minciencias through the Fondo Nacional de Financiamiento para la Ciencia, la Tecnología y la Innovación, Fondo Francisco José de Caldas; Instituto Tecnológico Metropolitano; Universidad Nacional de Colombia; and Universidad del Valle under the project entitled “Estrategias de dimensionamiento, planeación y gestión inteligente de energía a partir de la integración y la optimización de las fuentes no convencionales, los sistemas de almacenamiento y cargas eléctricas, que permitan la generación de soluciones energéticas confiables para los territorios urbanos y rurales de Colombia (código: 70634)”, which is part of the research program entitled “Estrategias para el desarrollo de sistemas energéticos sostenibles, confiables, eficientes y accesibles para el futuro de Colombia (Código: 1150-852-70378).

Conflicts of Interest

The authors declare no conflict of interest.

References

  1. Ban, K.M. Sustainable Development Goals. Ecol. Indic. 2016, 60, 565–573. [Google Scholar]
  2. SDG, U. Sustainable development goals. In The Energy Progress Report. Tracking SDG; IEA: Paris, France, 2019; Volume 7. [Google Scholar]
  3. Swain, R.B.; Karimu, A. Renewable electricity and sustainable development goals in the EU. World Dev. 2020, 125, 104693. [Google Scholar] [CrossRef]
  4. Büyüközkan, G.; Karabulut, Y.; Mukul, E. A novel renewable energy selection model for United Nations’ sustainable development goals. Energy 2018, 165, 290–302. [Google Scholar] [CrossRef]
  5. Revesz, R.L.; Unel, B. Managing the future of the electricity grid: Energy storage and greenhouse gas emissions. Harv. Environ. Law Rev. 2018, 42, 139. [Google Scholar]
  6. Ensini, L.; Sandrolini, L.; Thomas, D.; Sumner, M.; Rose, C. Conducted emissions on dc power grids. In Proceedings of the 2018 International Symposium on Electromagnetic Compatibility (EMC EUROPE), Amsterdam, The Netherlands, 27–30 August 2018; pp. 214–219. [Google Scholar]
  7. Hyvärinen, M. Electrical Networks and Economies of Load Density; Teknillinen Korkeakoulu: Espoo, Finland, 2008. [Google Scholar]
  8. Grisales-Noreña, L.F.; Montoya, O.D.; Hincapié-Isaza, R.A.; Granada Echeverri, M.; Perea-Moreno, A.J. Optimal location and sizing of DGs in DC networks using a hybrid methodology based on the PPBIL algorithm and the VSA. Mathematics 2021, 9, 1913. [Google Scholar] [CrossRef]
  9. Koohi-Fayegh, S.; Rosen, M.A. A review of energy storage types, applications and recent developments. J. Energy Storage 2020, 27, 101047. [Google Scholar] [CrossRef]
  10. Kumar, J.; Agarwal, A.; Agarwal, V. A review on overall control of DC microgrids. J. Energy Storage 2019, 21, 113–138. [Google Scholar] [CrossRef]
  11. Martins, A.S.C.; de Araujo, L.R.; Penido, D.R.R. Sensibility Analysis with Genetic Algorithm to Allocate Distributed Generation and Capacitor Banks in Unbalanced Distribution Systems. Electr. Power Syst. Res. 2022, 209, 107962. [Google Scholar] [CrossRef]
  12. Erdinc, O.; Tascikaraoglu, A.; Paterakis, N.G.; Dursun, I.; Sinim, M.C.; Catalão, J.P. Optimal sizing and siting of distributed generation and EV charging stations in distribution systems. In Proceedings of the 2017 IEEE PES Innovative Smart Grid Technologies Conference Europe (ISGT-Europe), Torino, Italy, 26–29 September 2017; pp. 1–6. [Google Scholar]
  13. Erdinç, O.; Taşcıkaraoǧlu, A.; Paterakis, N.G.; Dursun, I.; Sinim, M.C.; Catalao, J.P. Comprehensive optimization model for sizing and siting of DG units, EV charging stations, and energy storage systems. IEEE Trans. Smart Grid 2017, 9, 3871–3882. [Google Scholar] [CrossRef]
  14. Rosales Muñoz, A.A.; Grisales-Noreña, L.F.; Montano, J.; Montoya, O.D.; Perea-Moreno, A.J. Application of the Multiverse Optimization Method to Solve the Optimal Power Flow Problem in Alternating Current Networks. Electronics 2022, 11, 1287. [Google Scholar] [CrossRef]
  15. Montoya, O.D.; Giral-Ramírez, D.A.; Grisales-Noreña, L.F. Black hole optimizer for the optimal power injection in distribution networks using DG. J. Phys. Conf. Ser. 2021, 2135, 012010. [Google Scholar] [CrossRef]
  16. Rosales-Muñoz, A.A.; Grisales-Noreña, L.F.; Montano, J.; Montoya, O.D.; Perea-Moreno, A.J. Application of the Multiverse Optimization Method to Solve the Optimal Power Flow Problem in Direct Current Electrical Networks. Sustainability 2021, 13, 8703. [Google Scholar] [CrossRef]
  17. Grisales-Noreña, L.F.; Gonzalez Montoya, D.; Ramos-Paja, C.A. Optimal sizing and location of distributed generators based on PBIL and PSO techniques. Energies 2018, 11, 1018. [Google Scholar] [CrossRef] [Green Version]
  18. Grisales-Noreña, L.F.; Garzón Rivera, O.D.; Ocampo Toro, J.A.; Ramos-Paja, C.A.; Rodriguez Cabal, M.A. Metaheuristic optimization methods for optimal power flow analysis in DC distribution networks. Trans. Energy Syst. Eng. Appl. 2020, 1, 13–31. [Google Scholar] [CrossRef]
  19. Montoya, O.D.; Grisales-Noreña, L.; González-Montoya, D.; Ramos-Paja, C.; Garces, A. Linear power flow formulation for low-voltage DC power grids. Electr. Power Syst. Res. 2018, 163, 375–381. [Google Scholar] [CrossRef]
  20. Gallego, R.; Escobar, A.; Toro, E.; Romero, R. Técnicas heurísticas y metaheurísticas de optimización; Editorial Universidad Tecnológica de Pereira: Pereira, Colombia, 2015; ISBN 9789587222074. [Google Scholar]
  21. Orosz, T.; Rassõlkin, A.; Kallaste, A.; Arsénio, P.; Pánek, D.; Kaska, J.; Karban, P. Robust design optimization and emerging technologies for electrical machines: Challenges and open problems. Appl. Sci. 2020, 10, 6653. [Google Scholar] [CrossRef]
  22. Montano, J.; Mejia, A.F.T.; Rosales Muñoz, A.A.; Andrade, F.; Garzon Rivera, O.D.; Palomeque, J.M. Salp Swarm Optimization Algorithm for Estimating the Parameters of Photovoltaic Panels Based on the Three-Diode Model. Electronics 2021, 10, 3123. [Google Scholar] [CrossRef]
  23. Rosales Muñoz, A.A.; Grisales-Noreña, L.F.; Montano, J.; Montoya, O.D.; Giral-Ramírez, D.A. Optimal Power Dispatch of Distributed Generators in Direct Current Networks Using a Master–Slave Methodology That Combines the Salp Swarm Algorithm and the Successive Approximation Method. Electronics 2021, 10, 2837. [Google Scholar] [CrossRef]
  24. Grisales-Noreña, L.F.; Ramos-Paja, C.A.; Gonzalez-Montoya, D.; Alcalá, G.; Hernandez-Escobedo, Q. Energy management in PV based microgrids designed for the Universidad Nacional de Colombia. Sustainability 2020, 12, 1219. [Google Scholar] [CrossRef] [Green Version]
  25. Ara, A.L.; Kazemi, A.; Gahramani, S.; Behshad, M. Optimal reactive power flow using multi-objective mathematical programming. Sci. Iran. 2012, 19, 1829–1836. [Google Scholar]
  26. Moreno, E.A.; Hinojosa, V.H. Flujo Optimo de Potencia utilizando algoritmos evolutivos programación en Digsilent. Rev. Técnica” Energía” 2009, 5, 20–30. [Google Scholar] [CrossRef]
  27. Bernal-Romero, D.L.; Montoya, O.D.; Arias-Londoño, A. Solution of the optimal reactive power flow problem using a discrete-continuous CBGA implemented in the DigSILENT programming language. Computers 2021, 10, 151. [Google Scholar] [CrossRef]
  28. Ayan, K.; Kılıç, U. Artificial bee colony algorithm solution for optimal reactive power flow. Appl. Soft Comput. 2012, 12, 1477–1482. [Google Scholar] [CrossRef]
  29. Bhattacharya, A.; Chattopadhyay, P.K. Solution of optimal reactive power flow using biogeography-based optimization. Int. J. Electr. Electron. Eng 2010, 4, 568–576. [Google Scholar]
  30. Gutiérrez, D.; Villa, W.M.; López-Lezama, J.M. Flujo óptimo reactivo mediante optimización por enjambre de partículas. Inf. Tecnol. 2017, 28, 215–224. [Google Scholar] [CrossRef] [Green Version]
  31. Montoya, O.; Gil-González, W.; Grisales-Noreña, L. Optimal Power Dispatch of DGS in DC Power Grids: A Hybrid Gauss-Seidel-Genetic-Algorithm Methodology for Solving the OPF Problem. 2018. Available online: https://www.semanticscholar.org/paper/Optimal-Power-Dispatch-of-DGs-in-DC-Power-Grids%3A-a-Montoya-Gil-Gonz%C3%A1lez/9c6f54dcda06b39af91cb8b7e61a2beb6f13eda3 (accessed on 1 September 2022).
  32. Wang, P.; Wang, W.; Xu, D. Optimal sizing of distributed generations in DC microgrids with comprehensive consideration of system operation modes and operation targets. IEEE Access 2018, 6, 31129–31140. [Google Scholar] [CrossRef]
  33. Abualigah, L.; Diabat, A. A novel hybrid antlion optimization algorithm for multi-objective task scheduling problems in cloud computing environments. Clust. Comput. 2021, 24, 205–223. [Google Scholar] [CrossRef]
  34. Mirjalili, S.; Gandomi, A.H.; Mirjalili, S.Z.; Saremi, S.; Faris, H.; Mirjalili, S.M. Salp Swarm Algorithm: A bio-inspired optimizer for engineering design problems. Adv. Eng. Softw. 2017, 114, 163–191. [Google Scholar] [CrossRef]
  35. El-Fergany, A.A.; Hasanien, H.M. Salp swarm optimizer to solve optimal power flow comprising voltage stability analysis. Neural Comput. Appl. 2020, 32, 5267–5283. [Google Scholar] [CrossRef]
  36. Jumani, T.A.; Mustafa, M.; Anjum, W.; Ayub, S. Salp swarm optimization algorithm-based controller for dynamic response and power quality enhancement of an islanded microgrid. Processes 2019, 7, 840. [Google Scholar] [CrossRef] [Green Version]
  37. Montoya, O.D.; Garrido, V.M.; Gil-González, W.; Grisales-Noreña, L.F. Power flow analysis in DC grids: Two alternative numerical methods. IEEE Trans. Circuits Syst. II Express Briefs 2019, 66, 1865–1869. [Google Scholar] [CrossRef]
  38. Montoya, O.D.; Gil-González, W. On the numerical analysis based on successive approximations for power flow problems in AC distribution systems. Electr. Power Syst. Res. 2020, 187, 106454. [Google Scholar] [CrossRef]
  39. Kaur, S.; Kumbhar, G.; Sharma, J. A MINLP technique for optimal placement of multiple DG units in distribution systems. Int. J. Electr. Power Energy Syst. 2014, 63, 609–617. [Google Scholar] [CrossRef]
  40. Tamilselvan, V.; Jayabarathi, T.; Raghunathan, T.; Yang, X.S. Optimal capacitor placement in radial distribution systems using flower pollination algorithm. Alex. Eng. J. 2018, 57, 2775–2786. [Google Scholar] [CrossRef]
  41. Devi, S.; Geethanjali, M. Optimal location and sizing of Distribution Static Synchronous Series Compensator using Particle Swarm Optimization. Int. J. Electr. Power Energy Syst. 2014, 62, 646–653. [Google Scholar] [CrossRef]
  42. Penaloza, J.; Yumbla, J.; Lopez, J.; Padilha-Feltrin, A. Optimal Distribution Network Reconfiguration with Distributed Generation using a Genetic Algorithm. In Proceedings of the 2019 IEEE PES Innovative Smart Grid Technologies Conference—Latin America (ISGT Latin America), Gramado City, Brazil, 15–18 September 2019. [Google Scholar] [CrossRef]
  43. Abualigah, L.; Shehab, M.; Alshinwan, M.; Alabool, H. Salp swarm algorithm: A comprehensive survey. Neural Comput. Appl. 2020, 32, 11195–11215. [Google Scholar] [CrossRef]
  44. Hatamlou, A. Black hole: A new heuristic optimization approach for data clustering. Inf. Sci. 2013, 222, 175–184. [Google Scholar] [CrossRef]
  45. Mirjalili, S.; Mirjalili, S.M.; Hatamlou, A. Multi-verse optimizer: A nature-inspired algorithm for global optimization. Neural Comput. Appl. 2016, 27, 495–513. [Google Scholar] [CrossRef]
  46. Kennedy, J.; Eberhart, R. Particle swarm optimization. In Proceedings of the ICNN’95—International Conference on Neural Networks, Perth, Australia, 27 November–1 December 1995; Volume 4, pp. 1942–1948. [Google Scholar]
  47. Sahoo, N.; Prasad, K. A fuzzy genetic approach for network reconfiguration to enhance voltage stability in radial distribution systems. Energy Convers. Manag. 2006, 47, 3288–3306. [Google Scholar] [CrossRef]
  48. Ocampo-Toro, J.; Garzon-Rivera, O.; Grisales-Noreña, L.; Montoya-Giraldo, O.; Gil-González, W. Optimal Power Dispatch in Direct Current Networks to Reduce Energy Production Costs and CO2 Emissions Using the Antlion Optimization Algorithm. Arab. J. Sci. Eng. 2021, 46, 9995–10006. [Google Scholar] [CrossRef]
Figure 1. Hybrid SSA-SA optimization algorithm diagram.
Sustainability 14 13408 g001
Figure 2. Electrical configuration of the 10-node radial test system.
Sustainability 14 13408 g002
Figure 3. Electrical configuration of the 33-node radial test system.
Sustainability 14 13408 g003
Figure 4. Electrical configuration of the 69-node radial test system.
Sustainability 14 13408 g004
Figure 5. Electrical configuration of the 10-node mesh test system.
Sustainability 14 13408 g005
Figure 6. Percentage of reduction in minimum power losses obtained by the SSA in the 10-node radial test system compared to that of the other methodologies.
Sustainability 14 13408 g006
Figure 7. Percentage of reduction in average power losses obtained by the SSA in the 10-node radial test system compared to that of other methodologies.
Sustainability 14 13408 g007
Figure 8. Percentage of standard deviation obtained by the SSA in the 10-node radial test system compared to that of the other methodologies.
Sustainability 14 13408 g008
Figure 9. Percentage of reduction in minimum power losses obtained by the SSA in the 33-node radial test system compared to that of the other methodologies.
Sustainability 14 13408 g009
Figure 10. Percentage of reduction in average power losses obtained by the SSA in the 33-node radial test system compared to that of the other methodologies.
Sustainability 14 13408 g010
Figure 11. Percentage of standard deviation obtained by the SSA in the 33-node radial test system compared to that of the other methodologies.
Sustainability 14 13408 g011
Figure 12. Percentage of reduction in minimum power losses obtained by the SSA in the 69-node radial test system compared to that of the other methodologies.
Sustainability 14 13408 g012
Figure 13. Percentage of reduction in average power losses obtained by the SSA in the 69-node radial test system compared to that of the other methodologies.
Sustainability 14 13408 g013
Figure 14. Percentage of standard deviation obtained by the SSA in the 69-node radial test system compared to that of the other methodologies.
Sustainability 14 13408 g014
Figure 15. Percentage of reduction in minimum power losses obtained by the SSA in the 10-node mesh test system compared to that of the other methodologies.
Sustainability 14 13408 g015
Figure 16. Percentage of reduction in average power losses obtained by the SSA in the 10-node mesh test system compared to that of the other methodologies.
Sustainability 14 13408 g016
Figure 17. Percentage of standard deviation obtained by the SSA in the 10-node mesh test system compared to that of the other methodologies.
Sustainability 14 13408 g017
Table 1. Commercial and sequential programming solution methods reported in literature for solving the power dispatch problem in AC grids.
Commercial Software
Method Year Reference
Particle Swarm Optimization-
DigSILENT
2009[26]
GAMS-DICOPT2012[25]
Genetic Algorithm-
DigSILENT
2021[27]
Sequential Programming
MethodYearReference
Bio-geography
Optimization Algorithm
2010[29]
Artificial Bee Swarm
Optimization Algorithm
2012[28]
Turbulent Crazy Particle Swarm Optimization2017[30]
Continuous Genetic Algorithm2018[31]
Particle Swarm Optimization2018[32]
Ant Lion Optimizer2021[33]
Black Hole2021[15]
Multi-Verse Optimizer2022[14]
Table 2. Parameters of the continuous methods employed here in the master stage.
Parameters
Method Number of
Particles
Maximum
Iterations
Non-Improvement
Iterations
SSA78433154
MVO80432300
PSO58723252
ALO62992725
BH83667340
CGA57551551
Table 3. Electrical parameters of the 10-node mesh system.
Node iNode j R i j [ Ω ] X i j [ Ω ]P [kW]Q [kVAr]
120.12330.41271840460
230.24670.6051980340
240.74691.20501790446
450.69840.608415981840
261.98371.72761610600
670.90570.7886780110
782.05521.1640115060
794.79532.7160980130
3105.34343.02641640200
5100.14260.4522--
8100.20180.5214--
Table 4. Results of the simulations in the 10-node radial test system.
10-Node Radial Test System
Method Node/
Power [kW]
Power Losses Vworst [pu]/
Node
Imax [A]
Minimum [kW]/
Reduction [%]
Average [kW]/
Reduction [%]
Time [s] STD [%]
Without DGs-223.4181---0.9–1.1590
20% penetration
SSA5/0.05116.9218/47.6668116.9237/47.66603.490.00250.9723/8433.3321
9/1589.82
10/928.41
MVO5/0.05116.9220/47.6667116.9250/47.66543.750.00490.9723/8433.3324
9/1589.82
10/928.41
PSO5/0116.9218/47.6668117.2119/47.53704.501.32790.9723/8433.3321
9/1589.55
10/928.73
ALO5/0.51116.9473/47.6554117.9188/47.22066.660.72100.9723/8433.3827
9/1586.68
10/929.96
BH5/96.28117.9244/47.2181121.5254/45.60633.351.74630.9729/8433.5938
9/1696.06
10/720.92
CGA5/18.86117.0415/47.6132117.4801/47.41693.290.17330.9725/8433.4102
9/1619.67
10/878.08
40% penetration
SSA5/1620.6380.7608/63.852280.7610/63.85213.470.00030.9751/8322.2693
9/1970.64
10/1445.29
MVO5/1619.6980.7608/63.852280.7619/63.85173.680.00090.9752/8322.2694
9/1971.25
10/1445.62
PSO5/1620.6880.7608/63.852280.9785/63.75474.250.90970.9751/8322.2693
9/1970.20
10/1445.69
ALO5/1570.4380.7922/63.838181.8538/63.36296.611.79710.9752/8322.2936
9/1979.08
10/1486.52
BH5/1606.9380.9765/63.755682.4371/63.10193.291.08400.9751/8323.3491
9/1969.06
10/1435.96
CGA5/1642.0380.7807/63.843381.0075/63.74173.300.17910.9751/8322.3464
9/1959.77
10/1433.01
60% penetration
SSA5/2992.5972.1260/67.717072.1260/67.71703.514.23 × 10 11 0.9771/8235.1409
9/2235.17
10/1804.13
MVO5/2992.6172.1260/67.717072.1260/67.71703.889.38 × 10 7 0.9771/8235.1382
9/2235.19
10/1804.14
PSO5/2992.5972.1260/67.717072.1260/67.71702.391.22 × 10 10 0.9771/8235.1409
9/2235.17
10/1804.13
ALO5/2993.0472.1308/67.714972.7952/67.41756.701.61340.9770/8236.2086
9/2219.08
10/1795.22
BH5/2941.3972.1498/67.706473.1556/67.25623.781.12910.9773/8236.3767
9/2267.73
10/1794.37
CGA5/3020.7972.1345/67.713272.1848/67.69073.460.06100.9772/8234.3459
9/2245.92
10/1783.47
Table 5. Results of the simulations in the 33-node radial test system.
33-Node Radial Test System
Method Node/
Power [kW]
Power Losses Vworst [p.u.]/
Node
Imax [A]
Minimum [kW]/
Reduction [%]
Average [kW]/
Reduction [%]
Time [s] STD [%]
Without DGs-210.9785---0.9–1.1385
20% penetration
SSA12/48.44127.4984/39.5680127.5044/39.565210.170.00770.9377/33241.4931
15/396.14
31/340.61
MVO12/44.88127.4984/39.5680127.4994/39.567611.180.00090.9377/33241.4931
15/398.94
31/341.37
PSO12/45.68127.4984/39.5680127.8911/39.381911.970.52400.9377/33241.4931
15/398.71
31/340.81
ALO12/55.13127.5029/39.5659127.6270/39.507117.440.09100.9376/33241.4970
15/391.34
31/338.68
BH12/88.70127.6257/39.5077128.4504/39.11689.190.40420.9358/18241.5142
15/333.88
31/362.48
CGA12/76.31127.5192/39.5582127.6041/39.51809.270.04390.9376/33241.4996
15/370.19
31/338.64
40% penetration
SSA12/409.5990.3771/57.162990.3779/57.16259.680.00120.9594/33176.5392
15/397.41
31/763.40
MVO12/409.5990.3771/57.162990.3777/57.162610.730.00080.9594/33176.5392
15/397.41
31/763.40
PSO12/410.0290.3771/57.162990.7890/56.967711.471.15880.9594/33176.5392
15/397.60
31/762.78
ALO12/429.2490.3861/57.158690.5850/57.064417.300.21810.9591/33176.5422
15/388.74
31/752.38
BH12/348.1990.5000/57.104791.7172/56.52779.040.77700.9594/33176.7536
15/455.18
31/764.43
CGA12/432.8890.4019/57.151190.4811/57.11369.480.05350.9591/33176.5933
15/384.37
31/752.48
60% penetration
SSA12/596.3185.7789/59.342385.7789/59.34239.978.65 × 10 11 0.9700/33114.2656
15/397.74
31/980.32
MVO12/596.3185.7789/59.342385.7789/59.342310.686.11 × 10 7 0.9700/33144.2656
15/397.76
31/980.31
PSO12/596.3285.7789/59.342385.7789/59.34236.638.00 × 10 6 0.9700/33144.2657
15/397.74
31/980.32
ALO12/604.9985.7813/59.341286.0098/59.232918.030.34710.9699/33144.6453
15/388.35
31/976.24
BH12/598.8685.8045/59.330286.3709/59.06189.800.60680.9694/33146.3655
15/380.11
31/968.85
CGA12/594.5685.7803/59.341785.7999/59.332410.070.01680.9699/33144.7778
15/395.17
31/978.16
Table 6. Results of the simulations in the 69-node radial test system.
69-Node Radial Test System
MethodNode/
Power [kW]
Power LossesVworst [pu]/
Node
Imax [A]
Minimum [kW]/
Reduction [%]
Average [kW]/
Reduction [%]
Time [s]STD [%]
Without DGs-242.1523---0.9–1.1400
20% penetration
SSA26/0133.5626/44.8435133.6548/44.805544.620.10340.9397/64252.6391
61/580.52
66/246.05
MVO26/0.01133.5632/44.8433133.5687/44.841044.840.00330.9385/69252.5817
61/583.13
66/243.43
PSO26/0133.5626/44.8435134.1547/44.599057.161.50200.9385/69252.5817
61/580.16
66/246.41
ALO26/0133.6333/44.8143134.6068/44.412376.890.57860.9390/69252.6323
61/546.38
66/279.62
BH26/9.55133.9468/44.6849137.8053/43.091538.641.49900.9378/69252.6825
61/595.61
66/220.52
CGA26/4.08133.6923/44.7900134.2007/44.580043.180.16520.9381/69252.5921
61/595.66
66/226.83
40% penetration
SSA26/152.9386.4573/64.296386.4593/64.295542.060.00360.9634/69183.5728
61/1254.04
66/246.17
MVO26/152.5186.4574/64.296386.4585/64.295845.110.00170.9638/69183.5712
61/1253.71
66/246.91
PSO26/152.7286.4574/64.296386.6493/64.217056.620.66380.9638/69183.5711
61/1252.84
66/247.57
ALO26/152.7786.4817/64.286287.0658/64.045081.020.62580.9639/69183.6309
61/1243.67
66/255.96
BH26/208.6586.9818/64.079790.4786/62.635745.231.92400.9632/69183.9434
61/1110.03
66/330.27
CGA26/144.7386.4671/64.292386.6006/64.237137.990.09740.9638/69183.5754
61/1274.50
66/233.87
60% penetration
SSA26/382.1676.9578/68.219376.9578/68.219343.895.42 × 10 9 0.9784/69134.0925
61/1641.63
66/246.24
MVO26/382.1676.9578/68.219376.9578/68.219344.491.31 × 10 6 0.9784/69134.0951
61/1641.63
66/246.21
PSO26/382.1776.9578/68.219376.9578/68.219355.591.46 × 10 8 0.9784/69134.0926
61/1641.64
66/246.23
ALO26/386.5976.9593/68.218677.3907/68.040586.720.74090.9785/69133.6689
61/1637.61
66/251.20
BH26/358.0376.9986/68.202479.0719/67.346243.351.82380.9778/69136.5195
61/1653.47
66/227.85
CGA26/382.3176.9593/68.218676.9859/68.207738.060.02370.9784/69134.4437
61/1629.83
66/253.45
Table 7. Results of the simulations in the 10-node mesh test system.
10-Node Mesh Test System
Method Node/
Power [kW]
Power Losses Vworst [pu]/
Node
Imax [A]
Minimum [kW]/
Reduction [%]
Average [kW]/
Reduction [%]
Time [s] STD [%]
Without DGs-190.3237---0.9–1.1590
20% penetration
SSA5/0104.7510/44.9617104.7707/44.95134.160.04460.9793/8433.0907
9/1039.33
10/1472.33
MVO5/0104.75110/44.9616104.7540/44.96014.090.00210.9793/8433.0907
9/1039.96
10/1471.71
PSO5/0.02104.7511/44.9616105.3226/44.66134.721.80710.9793/8433.0907
9/1038.24
10/1473.40
ALO5/32.05104.7986/44.9367105.0366/44.81166.530.17960.9793/8433.1153
9/1012.16
10/1466.94
BH5/1.87104.9699/44.8467105.9958/44.30763.480.53800.9793/8433.4899
9/1037.61
10/1463.23
CGA5/18.12104.8075/44.9320105.0660/44.79623.400.11740.9793/8433.1163
9/1087.18
10/1405.83
40% penetration
SSA5/587.0658.4855/69.270558.5107/69.25733.940.05800.9838/7321.8763
9/1222.72
10/3213.55
MVO5/586.0358.4855/69.270558.4882/69.26913.810.00580.9838/7321.8764
9/1224.24
10/3213.06
PSO5/611.9658.4859/69.270364.6277/66.04334.3824.21190.9838/7321.8764
9/1227.34
10/3184.03
ALO5/526.1358.4985/69.263758.6598/69.17896.370.29070.9838/7321.9142
9/1215.08
10/3281.26
BH5/1253.6758.6297/69.194760.1293/68.40683.451.22340.9838/7321.8891
9/1241.74
10/2527.77
CGA5/813.3358.5195/69.252658.6400/69.18943.440.13720.9838/7321.8762
9/1215.85
10/2994.17
60% penetration
SSA5/2447.2139.3867/79.305439.3886/79.30443.910.00810.9874/6211.8432
9/1395.92
10/3691.86
MVO5/2440.8739.3867/79.305439.3874/79.30503.880.00180.9874/6211.8432
9/1396.49
10/3697.63
PSO5/2448.4039.3867/79.305440.7435/78.59254.3110.31160.9874/6211.8432
9/1396.09
10/3690.50
ALO5/2445.3439.3976/79.299739.6632/79.16016.560.69030.9874/6212.0355
9/1399.98
10/3685.25
BH5/3065.2739.5207/79.235040.6407/78.64653.401.57670.9873/6212.0846
9/1368.25
10/3096.05
CGA5/2378.8739.3908/79.303339.4689/79.26223.560.10440.9874/6211.8915
9/1399.13
10/3755.89
Publisher’s Note: MDPI stays neutral with regard to jurisdictional claims in published maps and institutional affiliations.