Article

Spatiotemporal Change of Urban Ecologic Environment Quality Based on RSEI—Taking Meizhou City, China as an Example

1
School of Geography Science and Tourism, Jiaying University, Meizhou 514000, China
2
School of Tourism and Culture, Guangdong Eco-Engineering Polytechnic, Guangzhou 510520, China
3
School of Economics and Management, Suzhou Polytechnic Institute of Agriculture, Suzhou 215000, China
4
Land Resources Technology Center of Guangdong Province, Guangzhou 510000, China
*
Authors to whom correspondence should be addressed.
Sustainability 2022, 14(20), 13424; https://doi.org/10.3390/su142013424
Submission received: 19 September 2022 / Revised: 9 October 2022 / Accepted: 16 October 2022 / Published: 18 October 2022

Abstract

:
An ecological index that is constructed based on remote sensing images can enable a rapid evaluation of the quality of the urban ecological environment and can provide a scientific basis for the construction of urban ecological civilization. Taking Meizhou City, in Guangdong in China, as a study area, based on the Landsat TM/OLI and MODIS remote sensing data, this paper extracts the total primary productivity (GPP), land surface temperature (LST), humidity component (Wetness), and bare soil index (SI), which represent the remote sensing ecological index (RSEI) evaluation indicators. The greenness, heat, humidity, and dryness in the indicators are used to characterize the quality of the regional ecological environment and its change characteristics. The results show that: (1) the high-quality areas of ecological environment in the study area are increasing, and the proportion of high-grade RSEI areas has increased from 61.7% to 66.2%. (2) About 26.3% of the area in the study area has an optimized ecological environment quality. (3) The correlation between POI and each index is significant, among which GPP and LST have a high correlation with RSEI, while POI and RSEI have a moderately negative correlation. (4) MODIS data are suitable for regional ecological environmental quality assessments. In the future, research on RSEI data sources and processing efficiency and the spatiotemporal changes of ecological quality and environmental factors can be strengthened, and the sustainable development of ecological protection and urban construction planning can be explored.

1. Introduction

With the rapid development of society and the economy, the impact of human activities on the ecological environment has become increasingly significant, and a series of ecological and environmental problems, such as forest degradation and natural environment pollution, have gradually become research hotspots and a matter of widespread concern [1]. In the early days, some scholars used a single factor for evaluation [2], while later, more comprehensive index system methods were adopted by most scholars [3,4]. With the advantages of satellite remote sensing and the construction of remote sensing indices, it is now possible to conduct research on whole ecosystems, such as natural resources [5,6], cities [7], and regions [8]. Through monitoring and evaluation, the ecological environmental status of the study area can be understood macroscopically and quickly, and a timely reference value can be provided for ecological environmental protection. In 2006, the Ministry of Environmental Protection issued the industry standard, “Technical Specifications for the Evaluation of Ecological Environment Conditions” [9] and proposed an ecological index (EI) based on remote sensing technology, which is widely used [10,11], but the use of indicators, calculation methods, and the scope of application are still in question [12]. The “Technical Specification” was updated in 2015, and the ecological quality zoning is worthy of reference. Xu Hanqiu [7] proposed a new remote sensing-based ecological index (RSEI) in 2013; since then, many studies refer to this indicator system and modify some indicators according to the characteristics of the natural environment in the study area [13,14] or study the ecological impacts of potential population and impervious surface increases, based on improved data accuracy [15]. In other studies, it was used for the monitoring and evaluation of dynamic changes in the urban ecological environment [16], watershed [17], and so on. This method has been widely used since it was first proposed [18,19], and its practicality, as well as accuracy, has been verified [20,21].
The above studies were mostly based on Landsat TM/OLI data, using it to calculate RSEI indicators. Due to the high spatial resolution of Landsat TM/OLI remote sensing images, they are widely used in the calculation of remote sensing ecological indexes. However, this has more stringent requirements for image quality, such as needing less cloud cover and similar timeframes for stitched-together images. In addition, not all regions corresponding to the images meet the research requirements. Recently, some scholars have used MODIS, obtained through the GEE platform, as the data source [22,23]. In the case of the MODIS data, although it is of lower resolution, some product datasets can directly represent long-term natural environment conditions, such as MOD17A2, MYD11A2, and other product datasets [24]. Points of interest (POI) represent a new spatial data source in the form of a series of point-like data representing real geographic entities, including spatial information, such as latitude and longitude and addresses, and attribute information, such as names and categories [25]. These data have been widely used in the quantitative identification of urban functional areas [26], the classification of tourist attractions [27], and space coupling between land-use level and ecological security [28]. Different satellite remote sensing data have their own advantages and disadvantages, and the data processing technology of different platforms can be difficult or easy. We assumed that using Landsat and MODIS data to calculate the remote sensing ecological index could obtain the RSEI value faster and more conveniently; once combined with POI data, the impact of human activities on the ecological environment could then be studied.
In this paper, MODIS and Landsat TM/OLI remote sensing images are used as data sources to extract the gross primary productivity (GPP), land surface temperature (LST), wetness, and bare soil index (SI), which uses greenness, heat, humidity, and dryness to construct the RSEI of the Meizhou ecological environment evaluation and analyze the spatiotemporal distribution and change characteristics of ecological environment quality in the study area in 2008, 2013, and 2018. Then, using the GPP and the LST extracted from the MODIS data products, followed by adding the POI data, we were able to quantitatively analyze the correlation between them and the remote sensing ecological index, and discuss the applicability of MODIS data in the evaluation of urban ecological environment quality and the impact of human activities on the ecological environment.

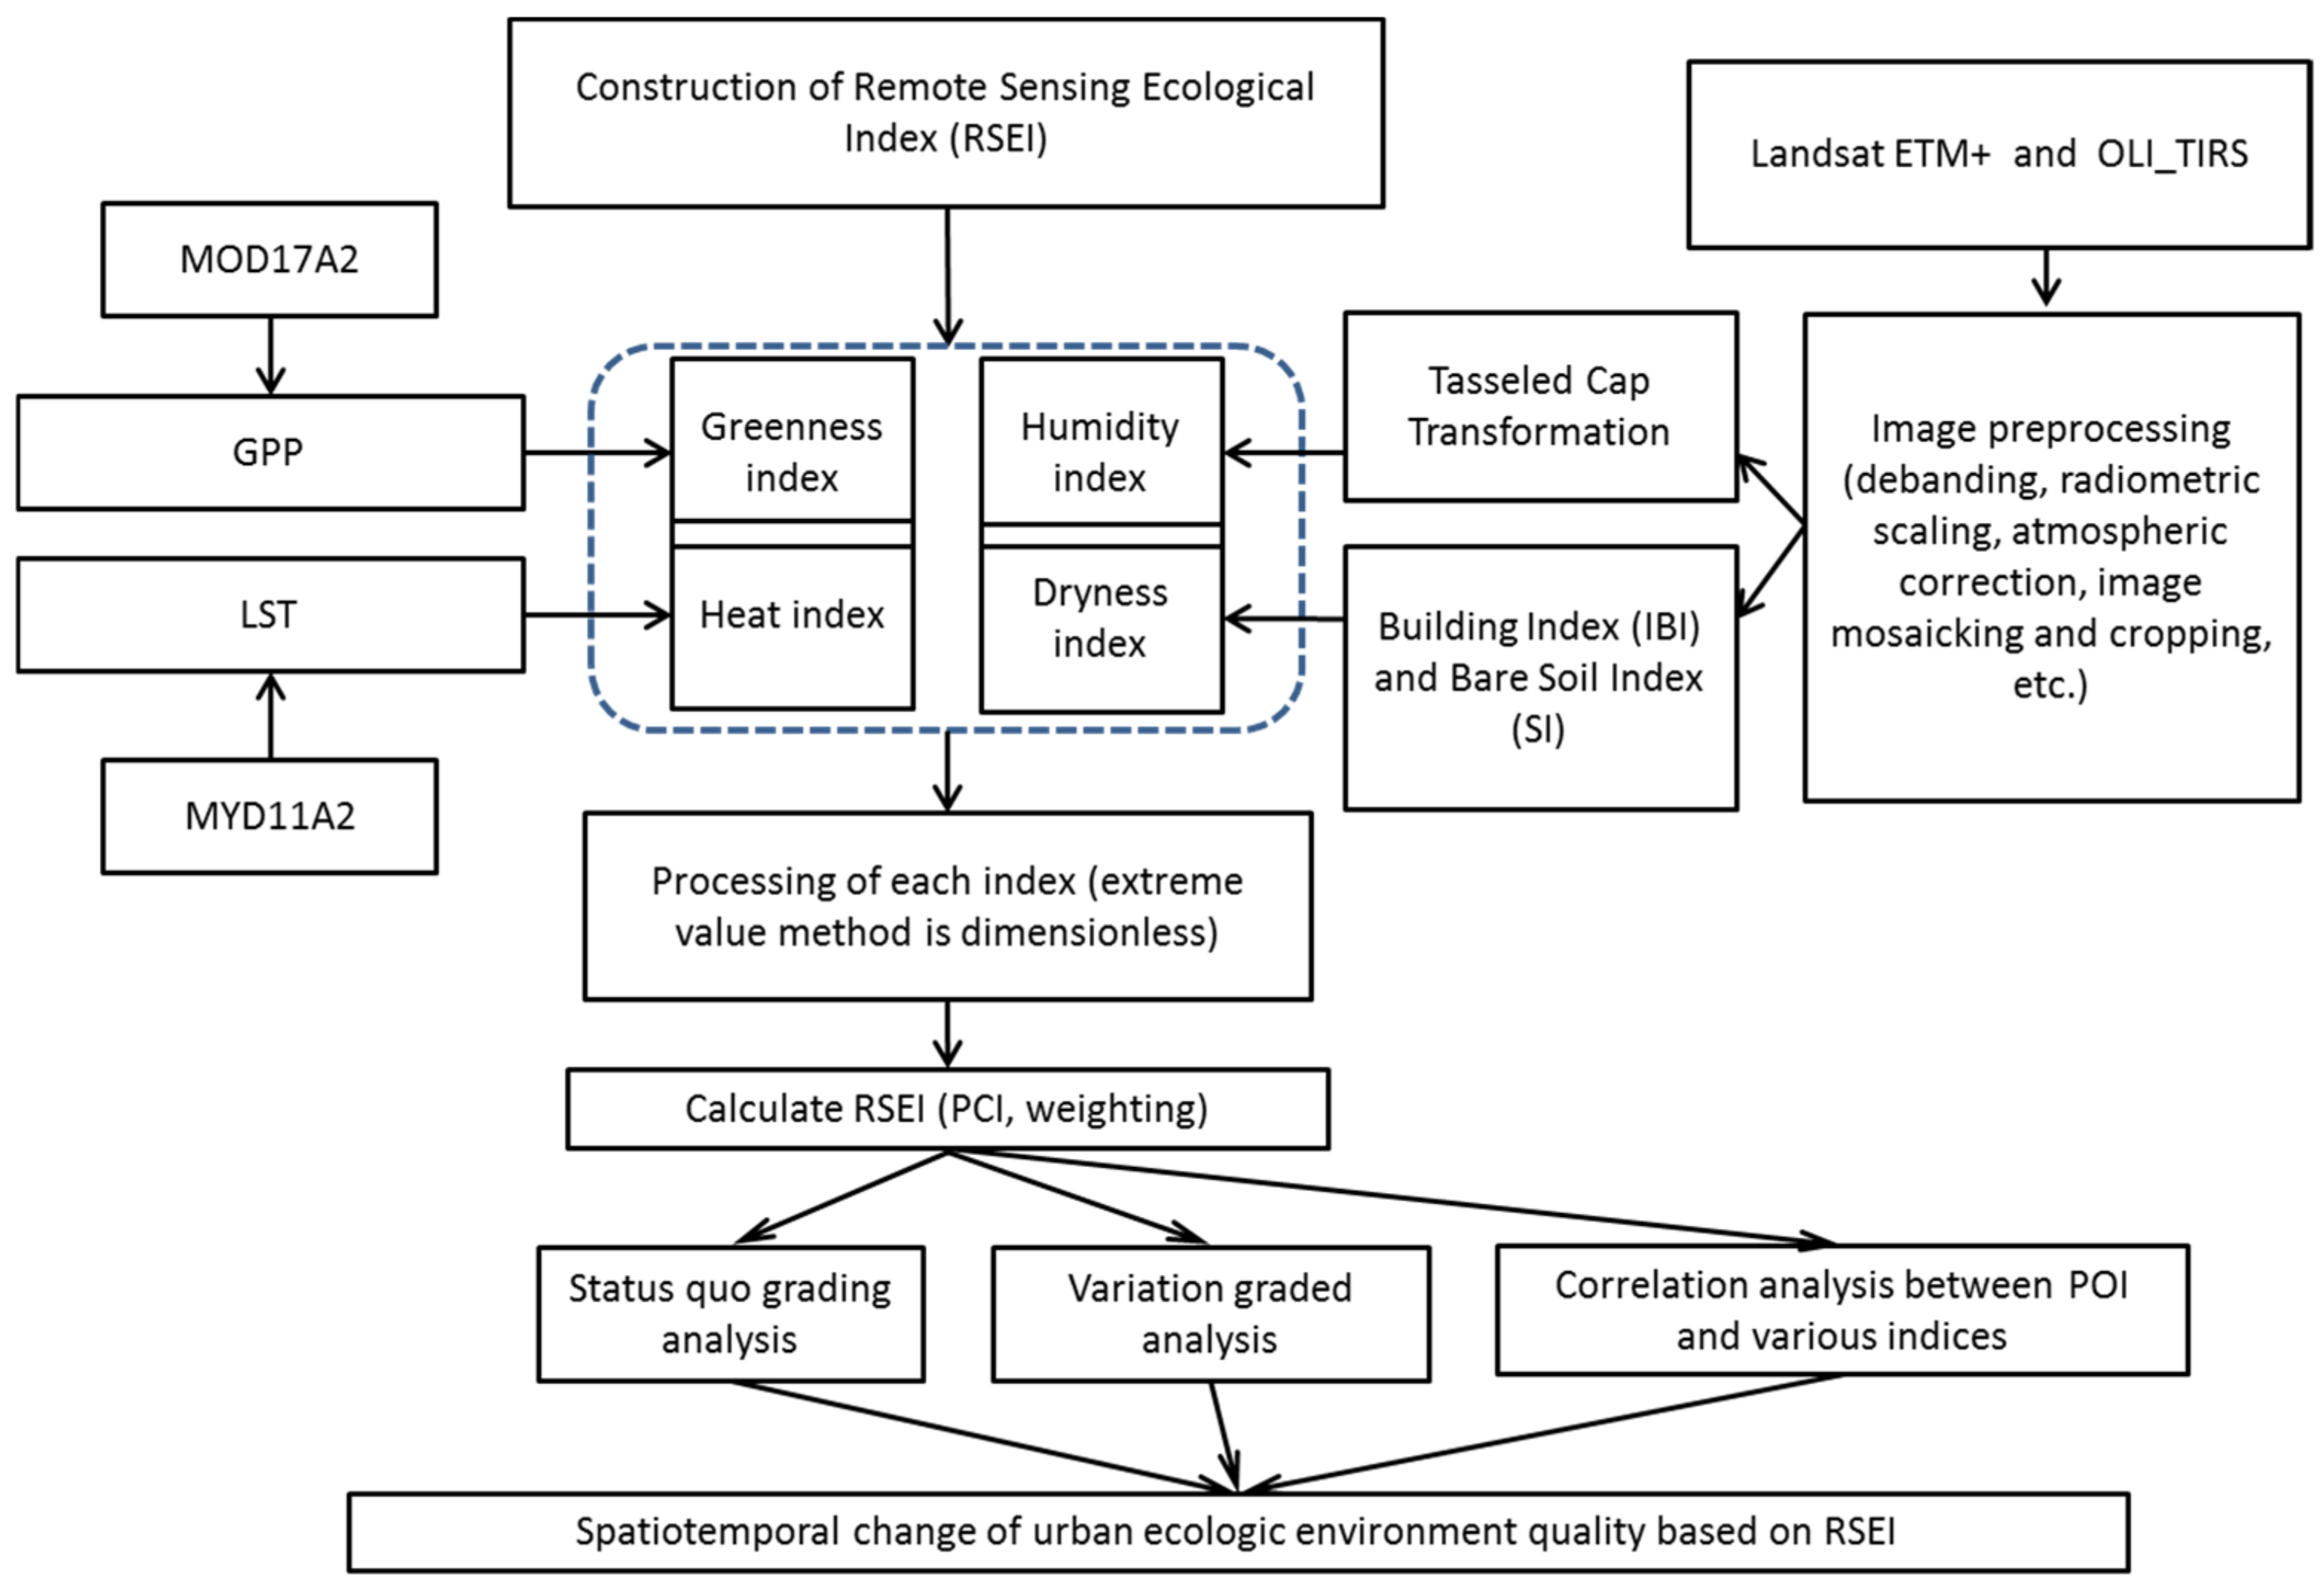
2. Materials and Methods

2.1. Study Area

This paper takes Meizhou City, in Guangdong in China, as the study area. Meizhou City is located in the middle and upper reaches of the Hanjiang River Basin and is at the junction of the three provinces of Fujian, Guangdong, and Jiangxi (115°18′~116°56′ E, 23°23′~24°56′ N) (Figure 1), which is in the border area of Guangdong, Fujian, and Jiangxi. It is a central city with a subtropical monsoon humid climate. The terrain of Meizhou is high in the north and low in the south. The region is dominated by mountains and hilly basins and has numerous landform types, such as terraces, terraces, and plains. It covers an area of about 15,876 km2, under the jurisdiction of Dapu County, Fengshun County, Jiaoling County, Pingyuan County, Wuhua County, Meijiang District, Meixian District, and Xingning City (County). Influenced by the complex geographical environment, Meizhou has no rain and is always sunny in the spring and autumn, and has heavy rainfall in summer [29].
Meizhou is a national experimental area for ecological civilization construction, an important ecological corridor, a species gene bank in South China, and an important ecological barrier in Guangdong Province [30]. It is also the core area of the southern hilly and mountainous region in the national ecological security strategic pattern of “three regions and four belts” (the ecological barrier area of the Qinghai-Tibet Plateau, the key ecological area of the Yellow River (including the ecological barrier of the Loess Plateau), the key ecological area of the Yangtze River (including the ecological barriers of Sichuan and Yunnan), the northeastern forest belt, the northern sand-control belt, the southern hilly and mountainous belt, and the coastal zone). Meizhou City belongs to the source area of the middle and upper reaches of the Hanjiang River, accounting for 81% of the area of the Hanjiang River Basin in Guangdong Province. Although the overall ecological environment of Meizhou City is good, there are still some ecological problems to be resolved, such as serious soil erosion, these problems being left over from the area’s history of abandoned mines, water ecological environment pollution, partial forest land degradation, a lag in biodiversity protection, urban and rural environments that need to be improved, etc. Meizhou is a relatively poor mountain city. While it is seeking rapid economic growth, in order to quickly integrate into the development of the Guangdong–Hong Kong–Macao Greater Bay Area and coordinate the relationship between economic development and ecological environment [31], first, it is necessary to accurately identify the background status of the local ecological environment, so as to provide a scientific basis for the ecological environment protection, development, and utilization of the area.

2.2. Data Source and Preprocessing

The data of this study mainly came from the Landsat7 ETM SLC-off satellite digital products (Day 353 and Day 346 in 2008), downloaded from the Geospatial Data Cloud Platform of the Computer Network Information Center of the Chinese Academy of Sciences (http://www.gscloud.cn, accessed on 1 January 2020), Landsat8 OLI_TIRS (Day 305, 314, 353 in 2017 and Day 13 in 2018) and Meizhou DEM data; the purchased 2013 Landsat8 OLI_TIRS data (L4-level product); 2008, 2013, and 2018 MOD17A2 products and MYD11A2 products, downloaded from NASA’s MODIS data-sharing platform(https://ladsweb.modaps.eosdis.nasa.gov, accessed on 1 January 2020), etc. (Table 1).
In order to reduce the influence of external factors, the images downloaded from the geospatial data cloud platform were first subjected to image mosaicing, stripping repair, radiometric calibration, and atmospheric correction. Then, the images were cropped using the Meizhou administrative boundary vector data, and finally, we obtained an image of the study area. The MODIS data was formatted and synthesized for the whole year [32], and then cropped with the rectangular vector data to a slightly larger area than the administrative boundary of Meizhou City. After calculating and obtaining the raster data related to the remote sensing ecological index, the vector data of the administrative boundary of Meizhou City are used to obtain the ecological environment data within the study area. (Figure 2). Due to the different resolutions of the Landsat ETM and Landsat8 OLI_TIRS and MODIS data products, the resolutions of the two Landsat images were resampled to 1000 m.

2.3. Research Methods

Based on previous research [8,17], this study used the same four indicators of greenness, humidity, dryness, and heat to construct a remote sensing ecological index RSEI, but we planned to use different remote sensing image products that extract similar or identical information to represent the above indicators. Because Landsat ETM and Landsat8 OLI_TIRS are data from a single time point, which means that it is greatly affected by cloud cover and other factors, it is difficult to collect ideal annual data, which causes certain limitations when characterizing the ecological environment. The MOD17A2 product and MYD11A2 product of MODIS are the L3 product synthesized by 1 km GPP for 8 days and the average value of 1 km LST for 8 days, respectively. These products offer continuous monitoring data. After preprocessing, the data of a certain period can be obtained directly through the synthetic data, which are less affected by the weather. Therefore, the GPP of the MOD17A2 product represents the greenness, while the LST value of the MYD11A2 represents the heat. In addition, drawing on the methods of Hanqiu Xu [8] and Hong Zhu et al. [17], the humidity index and dryness index were extracted from Landsat data to represent humidity and dryness, respectively, to jointly construct a remote sensing ecological index.

2.3.1. Greenness Index

GPP refers to the amount of organic carbon fixed by green plants through photosynthesis per unit of time (also known as total primary productivity), which determines the initial material and energy entering the terrestrial ecosystem. GPP directly reflects the strength of vegetation photosynthesis, and its sensitivity to climate change and human activities is often higher than vegetation indices such as NDVI [33]. MODIS GPP data have been validated and widely used in global and regional vegetation biomass estimation and also in the carbon cycle and global change studies [34,35]; therefore, using GPP as a remote sensing ecological indicator can express regional ecological and environmental effects more intuitively.
The GPP data in this paper were compiled from the MODIS MOD17A2 dataset downloaded from NASA’s MODIS data-sharing platform (https://ladsweb.modaps.eosdis.nasa.gov (accessed on 18 September 2022)), including data from 2008, 2013, and 2018, a total of 46 issues. At this point, we loaded the MODIS Conversion Toolkit (MCTK) tool in ENVI to perform coordinate system conversion and numerical sorting. The calculation formula [36] can be expressed as follows:
G P P 2008 = 6 × C ollect 46 + i = 1 45 8 × C ollect i
G P P 2013 / 2018 = 5 × C ollect 46 + i = 1 45 8 × C ollect i .
In the formula, GPP2008/2013/2018 is the total GPP value of the pixel in 2008, 2013, and 2018; Collecti is the GPP value of the first to 45th period on the pixel; Collect46 is the GPP value of the 46th period.

2.3.2. Heat Index

LST is closely related to vegetation conditions, surface water conditions, and human activities, and can be used as a factor to indicate surface environmental conditions. The LST data in this paper are compiled from the MODIS MYD11A2 datasets, downloaded from the MODIS data-sharing platform in 2008, 2013, and 2018. There are 46 phases in total, and the treatment method is basically the same as for the greenness index. The heat index is calculated as follows:
L S T 2008 = 6 × C ollect 46 + i = 1 45 8 × C ollect i
L S T 2013 / 2018 = 5 × C ollect 46 + i = 1 45 8 × C ollect i .
In the formula, LST2008/2013/2018 is the total LST value of the pixel in 2008, 2013, and 2018; Collecti is the LST value of each one of periods 1–45 on the pixel; Collect46 is the image LST value of the 46th period.

2.3.3. Humidity Index

Wetness can indicate the moisture status of surface water, vegetation, and soil [37], which can be obtained through the Tasseled Cap tool that comes with the ENVI software or is extended. The calculation method based on TM images [38] is expressed as in Formula (5), while the calculation method based on OLI images [39] is expressed as in Formula (6):
  W et T M = 0.0315 ρ B lue + 0.2021 ρ G r e e n + 0.3102 ρ R e d + 0.1594 ρ N i r 0.6806 ρ S w i r 1 0.6109 ρ S w i r 2
  W et O L I = 0.1511 ρ B lue + 0.1973 ρ G r e e n + 0.3283 ρ R e d + 0.3407 ρ N i r 0.7117 ρ S w i r 1 0.4559 ρ S w i r 2
In the formula: ρi represents the reflectivity of the corresponding bands of TM and OLI data, where the subscripts of Blue, Green, Red, Nir, Swir1, and Swir2 represent the blue, green, red, near-infrared, short-wave infrared 1, and short-wave infrared 2 bands, respectively.

2.3.4. Dryness Index

The dryness index (NDSI) is a composite of the building index (IBI) and the bare soil index (SI). The calculation formula [8] is as follows:
N D S I = S I + I B I / 2
Among:
S I = ρ S w i r 1 + ρ R e d ρ B lue + ρ N i r / ρ S w i r 1 + ρ R e d + ρ B lue + ρ N i r
I B I = 2 ρ S w i r 1 / ρ S w i r 1 + ρ N i r ρ N i r / ρ N i r + ρ R e d + ρ G r e e n / ρ G r e e n + ρ S w i r 1 2 ρ S w i r 1 / ρ S w i r 1 + ρ N i r + ρ N i r / ρ N i r + ρ R e d + ρ G r e e n / ρ G r e e n + ρ S w i r 1 .

2.3.5. Construction of Remote Sensing Ecological Index

Since the above four indicators have different meanings and inconsistent dimensions, they cannot be directly used for comparison, so they need to be dimensionless in the range of 0~1. The extreme value method is used to process the data:
N I = I I m i n / I m a x I m i n .  
In the formula: N I is the normalized value;   I is the index value; I m i n and I m a x are the minimum and maximum values of the index after 1% confidence interval processing.
At this point, principal component analysis is carried out on the four indicators after being made dimensionless, and weights are assigned according to the contribution of each index to the first principal component (PC1) [17]. Finally, the initial value of the remote sensing ecological index (RSEI0) is calculated using the following formula:
R S E I 0 = 1 P C 1 f G P P , L S T , N D S I , W et .  
Normalizing R S E I 0 can make the differences in ecological environment quality more obvious. The calculation formula [8] is as follows:
R S E I = R S E I 0 R S E I 0 _ m i n / R S E I 0 _ m a x R S E I 0 _ m i n .  
The RSEI that is finally obtained yields the remote sensing ecological index value, and the range is 0~1. The closer the value is to 1, the better the quality of the ecological environment.

2.3.6. RSEI Evaluation Criteria

On the basis of the RSEI value, calculated by the above method, referring to the existing grading standard [8], the equal interval method in ArcGIS software is used for reclassification, including five grades of poor, inferior, medium, good, and excellent. The ecological grade (Table 2) is used to qualitatively characterize the ecological environment quality grade of Meizhou City.
On the basis of dividing the RSEI into five grades, difference statistics were carried out, according to the ecological quality change grading standard of the Technical Specifications for Ecological Environmental Status Assessment (HJ 192-2015) [40]. Other grading methods are referred to and were combined with the actual situation of the study area [17]. The RSEI variability was divided into 3 categories and 9 levels. In this paper, in the context of reference [16], the RSEI value changes in the grading method, as will the value for | delta RSEI | of less than 0.05 for the same, between 0.05 and 0.15 for a slight change, between 0.15 and 0.25 for a medium change, between 0.25 and 0.4 for obvious changes, is greater than or equal to 0.4 for significant changes (Table 3).

2.3.7. Correlation Analysis between the Ecological Environment Quality and POI

In order to analyze the correlation between human activities and ecological environment quality in the study area, the POI points in Meizhou City in 2018 were used as data sources (collected and provided by the Meizhou branch of Guangzhou Jiantong Surveying and Mapping Geographic Information Technology Co., Ltd., Guangzhou, China). This type of data divides the geographical entities into 17 categories, including natural villages, catering, high-speed service areas, gas stations, traffic trips, tourist attractions, commercial service land, etc., totaling about 116,000 POI points. The data processing and analysis work is carried out in three steps.
First, the authors use ArcGIS software to perform point density analysis, generate a POI point density raster map, and use resampling tools to set the resolution to 1000 m. Next, we normalize the POI point density raster map and GPP, LST, WET, NDSI, and RSEI raster data of 2018. Then, using the fishnet tool of ArcGIS software to extract multi-value to points, we generate the relevant attribute point files containing the above 6 raster maps; by exporting the attribute table method in txt format, the data for subsequent correlation analysis is obtained. Finally, using IBM SPSS Statistics 25 software, the correlation (Spearman) analysis was performed on the data obtained in the previous step.

3. Results

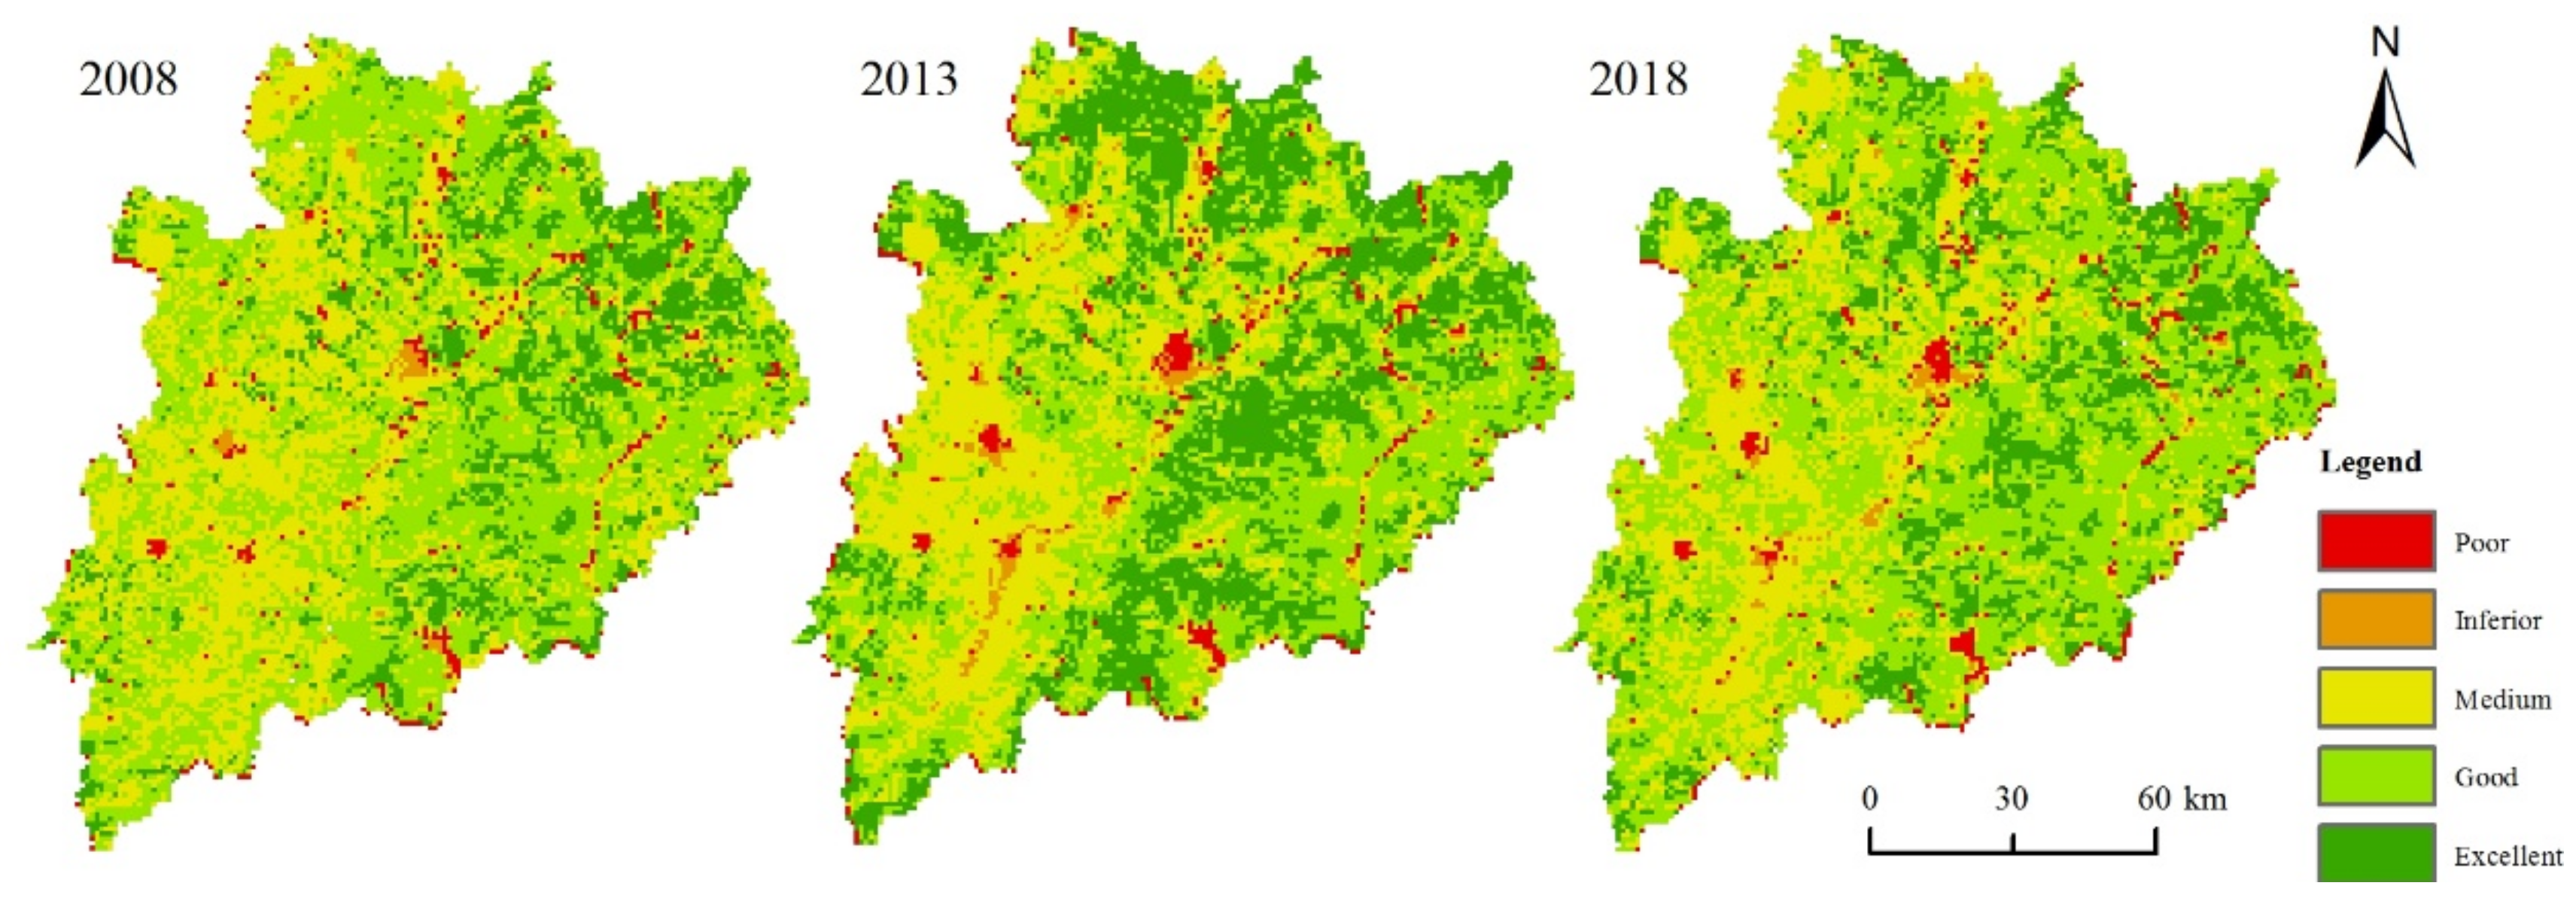
3.1. Evaluation of Ecological Environment Quality in Meizhou City

From the perspective of the spatial distribution pattern (Figure 3), the areas of “excellent” and “good” ecological quality grades in 2008 were mainly distributed in the mountain valleys in the north, east, and south of Meizhou City. The areas with grades of “inferior” and “poor” were largely scattered in relatively flat basins and plains, which mainly comprised urban construction land and transportation land that was distributed across the counties and cities in the center of the built-up area. In 2013, the “excellent” and “good” areas expanded to the surrounding areas. In addition to the original scope, the western area of Meizhou also had obvious distribution, and the “inferior” and “poor” grades were also more concentrated and slightly expanded than in 2008. In 2018, the areas where the grades of “excellent” had changed to “good” were more obvious, being mainly distributed in the north, central, and southern mountain woodland, and the spatial distribution of the rest of the grades did not change greatly, compared with the previous two periods.
As can be seen from Table 2, the statistical results show that the sum of the proportions of “good” and “excellent” grades of ecological environment quality in Meizhou in 2008, 2013, and 2018 were 61.7%, 64.6%, and 66.2%, respectively, showing a gradually increasing trend. The proportions of “inferior” and “poor” grades in 2013 were higher than those in the other two years. From 2008 to 2018, there was a trend of first rising and then falling, but the sum of the proportions was less than 5%.
In 2008, 15.7% of Meizhou’s ecological environment quality grades were “excellent”, more than 80% were “good” and “medium”, and only 3.5% were “inferior “ and “poor”. The overall ecological environment quality was considered better. In 2013, the proportion of “excellent” quality increased by about 12%, the proportion of “good” and “medium” decreased by about 14%, and the proportion of “ inferior “ and “poor” slightly increased by 1.4%. The improvement was obvious, but there was also a slight deterioration in the local area. In 2018, the proportion of “excellent” quality grades dropped significantly, while the proportion of “good” grades increased significantly, and the changes in the two ratios corresponded to each other. The proportions of “medium”, “inferior”, and “poor” decreased slightly. The quality of the ecological environment showed a slight deterioration trend, but the overall quality was still good.
In summary, the quality of the ecological environment in the study area was good. The improvement was obvious in the early stage of the study, and there was a slight deterioration trend in the later stage. It is necessary to continue monitoring and completing the construction of the ecological environment.

3.2. Dynamic Changes of Ecological Environment Quality in Meizhou

From Figure 4 and Table 3, it can be seen that from 2008 to 2013, from the perspective of space, the worse area is mainly distributed in those areas with lower altitudes, namely, the central, western, and southwestern parts of the city, urban construction land, and transportation land increased significantly, which may be the primary reason for the deterioration in ecological environment quality. The better areas are mainly distributed in areas with higher altitudes, namely, the northern, eastern, and southern parts of the city, where the woodlands, grasslands, and rivers are distributed. In terms of time, the deterioration of the ecological environment quality is 3907 km2, and the improvement is 3935 km2. The ecological environment of Meizhou City has improved and deteriorated to the same extent, and the overall change trend of the ecological environment quality is not obvious.
From 2013 to 2018, from the perspective of space, the areas that are worse are mainly distributed in the northern, central, and southern parts of the city, and are scattered in other, less concentrated and degraded areas. The better areas are mainly distributed in the northwest, west, and southwest of the city, including some central urban centers and the Meijiang River Basin in the region. In terms of time, the worsening area of ecological environment quality is 4051 km2, and the area of improvement is 5147 km2. The size of the improved area is about 27.1% larger than that of the worsening area, and the overall ecological environment quality is improving.
From 2008 to 2018, from a spatial perspective, the regional distribution of the variation was scattered. Those areas with a higher degree of variation are mainly distributed in the northern, central, and southwestern parts of the city, and are more scattered in other areas. The distribution characteristics of the improved regions are similar to those of the worsened regions. Those areas with a higher degree of improvement are mainly distributed to the northwest and south of the city and are also scattered in the mountain forest areas at higher altitudes. From the perspective of time, the area with worse ecological environment quality is 3106 km2, and the area with better quality is 4118 km2. This improved area is about 32.6% larger than that of worsened area. The overall quality of the ecological environment is improving.
In conclusion, from 2008 to 2018, the changes in eco-environmental quality in the first five years were obvious and concentrated, with the worsening areas mainly being located in Meixian District, Xingning City, and Wuhua County, while the improved areas were mainly distributed in Pingyuan County, Jiaoling County, and at the junction of Fengshun County and Wuhua County. The changes in ecological environment quality in the last five years were relatively scattered, but the distribution area was basically opposite to that in the first five years and the changes were more extensive. However, from the time scale of 10 years, the spatial distribution of ecological environmental quality change in Meizhou City in China shows the characteristics of both improving and deteriorating. However, according to Table 3, the area of deterioration is about 19.9%, while the area of improvement is about 26.3%. The overall trend of change is positive.

3.3. Correlations between Meizhou POI and Various Indices

Through the ArcGIS software, the collected POIs were first analyzed for point density, then the POI density distribution map was obtained (Figure 5). Then, we normalized the GPP, LST, WET, and NDSI raster data of the study area in 2018 (Figure 6). It can be seen from Figure 5 that human activities were mainly distributed in the low-elevation areas of the city, concentrated in the central and western regions, and scattered in the rest of the region.
Then, through correlation analysis, the correlation coefficient matrix between the POI and each index and the RSEI index was obtained (Table 4). In addition, the average correlation model was used to test the applicability of RSEI. The closer the correlation coefficient was to 1, the stronger the suitability of the model results [7]. The calculation method is shown in Formula (13):
C a ¯ = C b + C c + + C j n 1 .
In the formula, C a ¯ represents the average correlation degree of a certain index, a, for correlation analysis, n represents the number of indicators for correlation analysis, and Cb, Cc, Cj, etc. represent the correlation coefficients between the indicators. The calculation results are shown in Table 4.
After calculation, there was a significant correlation between the indicators at the 99% confidence level, and the null hypothesis was excluded. Among them, the correlation between GPP and RSEI was the highest, which represents a positive correlation; the correlation between LST and RSEI was the second, which is a negative correlation. The data sources of these two indicators were MODIS images, both of which had a high correlation with RSEI, and their average correlations were close to or higher than the latter, indicating strong applicability. Combined with the advantages of the MODIS data mentioned above, this shows that it is more appropriate to use remote sensing data from different sources to evaluate the quality of the ecological environment. POI, NDSI, WET, and RSEI had close correlations, the former two were negatively correlated, and the latter was positively correlated. This shows that climatic factors have an important impact on the ecological environment, but it is still not as high as the impact of human activities on the ecological environment. According to the calculation results, the average correlation degree of RSEI was somewhat high, second only to LST, indicating that an RSEI combining multiple indicators was more suitable for evaluating the quality of the ecological environment than a single indicator.

4. Discussions

4.1. Influencing Factors of Ecological Environment Quality in Meizhou

Studying the factors affecting the quality of the ecological environment and its driving mechanism will help to identify the background of the ecological environment and provide a scientific basis for ecological environmental protection and sustainable development. Some studies have found that both natural factors and land use changes can affect the quality of the ecological environment. In the final analysis, the impact of human activities was higher [41,42,43]. For example, the ecological quality of Hami Oasis is greatly affected by dryness and wetness, and these changes are caused by the expansion of artificial oases [44]. Another example is the Kökyar greening project in Aksu, Xinjiang, China, which is the main reason for the significant improvement in ecological quality in this area. The changes in vegetation parameters and ecological quality are mainly caused by human activities [45]. For a long time, the river basin where Meizhou City is located has had good ecology and a beautiful environment and belongs to the core area of the southern hilly and mountainous area in the “three regions and four belts” of the national ecological security strategic pattern. It is one of the many national key ecological function areas included in the Nanling Mountain Forest and Biodiversity area. With the development of the population and the social economy, bare land and construction land have gradually increased, and the quality of the ecological environment has been affected to varying degrees.
From 2008 to 2013, the area with a significantly reduced RSEI basically coincided with the distribution of the high-value area of POI point density; this was the up-and-coming period of urban construction. The areas with a significant increase in RSEI were mostly distributed in the mountains, woodlands, gardens, and other areas. This is because, as an ecological development area in Guangdong Province and an important ecological barrier and water conservation area in the east, west, north, and north of Guangdong, Meizhou has always attached much importance to ecological construction and increased ecological advantages. In 2002, on the basis of the previous ten-year greening action, Meizhou started the first round of the “Greening Meizhou” campaign. After nearly 10 years of development, the greening and forest coverage have been significantly improved. From 2013 to 2018, the areas in which the RSEI decreased and increased significantly were almost opposite to those in the previous five years. However, the RSEI in the area along the Meijiang River Basin (as well as in the urban center) significantly decreased and significantly increased. This is closely related to Meizhou’s emphasis on the rapid development of urban construction and ecological protection. In 2014, Meizhou launched the second round of the “Greening Meizhou” campaign. The four major projects of large-scale afforestation and land greening, carbon sink afforestation, the forest landscape belt, and rural beautification and greening have greatly increased the forest area of Meizhou and improved the ecological environment. Therefore, looking at the RSEI changes in Meizhou from 2008 to 2018, policies and human activities are the main influencing factors.

4.2. Research Highlights and Shortcomings

In the past, when monitoring the temporal and spatial changes of ecological environment quality, based on the RSEI index, Landsat satellite remote sensing images were mainly used, but the data quality presented certain limitations, while MODIS data products can offer a better supplement. This paper uses these two data sources to study the quality of the ecological environment and its temporal and spatial changes, which process can realize an analysis of the quality of the urban ecological environment more scientifically and quickly. At the same time, in order to analyze the degree and direction of the impact of human activities on the quality of the ecological environment from a quantitative and qualitative perspective, this paper uses POI data to generate a point density distribution map and conduct correlation analysis with RSEI and its constituent indicators. The calculation results met the significance test, which means that they meet the analysis requirements and have strong applicability.
Of course, this study also has some shortcomings. There are many remote sensing data-processing tasks performed in this paper, which necessitate care and patience to complete the data preprocessing and computational analysis. In recent years, some scholars have proposed that the GEE platform can be used to access the database of the platform by writing simple programs to quickly process and analyze the geospatial data in the cloud, overcoming the low efficiency of traditional methods in processing remote sensing images [22,46]. This approach also has certain limitations, such as requiring a certain level of programming knowledge and unimpeded network support. In addition, due to the limited data, this paper only uses the POI data in 2018 for correlation analysis, which cannot represent the situation with long-term series. Identifying a way to scientifically and efficiently monitor the regional ecological environment quality dynamically is the ultimate goal of this study. Exploring the potential factors affecting ecological environment changes [47] and digging into the mechanism of RSEI on ecological environment quality can provide a basis for ecological protection and urban construction planning in the study area. The convenient and rapid depiction of the ecological environment using the remote sensing ecological index has been verified, but the improvement of the relevant index and exploring the interrelationship between the index factors is still a research hotspot [48,49], which can be further studied in the future.

5. Conclusions

Based on Landsat and MODIS satellite remote sensing image data, this paper calculates the RSEI and evaluates and analyzes the spatial and temporal changes in ecological environment quality in Meizhou from 2008 to 2018. The results show that: (1) during the study period, the ecological environment quality of Meizhou became better overall; the quality of the ecological environment was slightly worse, but the overall quality had become better. The proportion of RSEI grades of “good” and “excellent” gradually increased from 61.7% to 66.2%, and the proportion of “inferior” and “poor” grades increased slightly, from 3.5% to 4.1%. (2) The area of Meizhou’s ecological environment with improved quality accounted for 26.3%, and the worsening accounted for 19.9%, showing an overall improvement trend. The development of urbanization has led to the continuous expansion of construction land in basins, plains, and other places, resulting in the deterioration of ecological environment quality. However, the government’s “Greening Meizhou” campaign, afforestation, and rural beautification and greening policies have improved the ecological quality of Meizhou’s mountainous areas. (3) The correlation between POI and RSEI and its related indicators is significant. Among them, GPP, LST, and RSEI were calculated, based on MODIS data; they have a high degree of correlation, which has high applicability to the evaluation of ecological environment quality in Meizhou. POI and RSEI were significantly negatively correlated, but the degree was moderate, indicating that the impact of human activities on the environment in Meizhou was within a reasonable range.

Author Contributions

Conceptualization, Z.C. and R.C.; methodology, Z.C. and Y.H.; software, Z.C. and Y.H.; validation, R.C., Q.G. and Y.H.; formal analysis, Z.C. and R.C.; investigation, Z.C.; resources, Z.C.; data curation, Z.C.; writing—original draft preparation, Z.C.; writing—review and editing, R.C. and Q.G.; visualization, Z.C.; supervision, Z.C. and Q.G. All authors have read and agreed to the published version of the manuscript.

Funding

This research was supported by the National Natural Science Foundation of China (Grant Nos. 42207506 and 42071088), the doctoral promotion program of Suzhou Agricultural Vocational and Technical College (Grant No. BS2109), the “333 High-level Talents Training Project in Jiangsu Province”(No. 2022), and Suzhou Agricultural Vocational and Technical College’s 2021 Science and Technology Innovation and Service Team Special Fund Project, “Agricultural Product Circulation Model Innovation Team” (No.KJFW2104).

Institutional Review Board Statement

Not applicable.

Informed Consent Statement

Not applicable.

Data Availability Statement

Not applicable.

Acknowledgments

We would like to extend our sincere thanks to Manager Qiwen Li of Meizhou Branch of the Guangzhou Jiantong Surveying and Mapping Geographic Information Technology Co., Ltd. The authors thank him for providing POI data and related technical support.

Conflicts of Interest

The authors declare no conflict of interest.

References

  1. Yan, M.; Wang, Y. Advances in the Evaluation of Ecological Environmental Quality. Ecol. Environ. Sci. 2012, 21, 1781–1788. [Google Scholar]
  2. Du, J.; Jiaerheng, A.; Zhao, C.; Fang, G.; Yin, J.; Xiang, B.; Yuan, X.; Fang, S. Dynamic Changes in Vegetation NDVI from 1982 to 2012 and Its Responses to Climate Change and Human Activities in Xinjiang, China. Chin. J. Appl. Ecol. 2015, 26, 3567–3578. [Google Scholar]
  3. Cheng, L.; Yang, D.; Zhang, X.; Zhang, Y. Spatiotemporal Evolution of Intensive Cultivated Land use in the County-level Regions in Xinjiang Based on the PSR Model. Arid. Zone Res. 2018, 35, 493–502. [Google Scholar] [CrossRef]
  4. Shu, J.; Yang, W. Study on the Comprehensive Evaluation of Eco-Environmental Quality in Hangzhou. Ecol. Econ. 2019, 35, 128–134. [Google Scholar]
  5. Ochoa-Gaona, S.; Kampichler, C.; De Jong, B.H.J.; Hernández, S.; Geissen, V.; Huerta, E. A multi-criterion Index for the Evaluation of Local Tropical Forest Conditions in Mexico. For. Ecol. Manag. 2010, 260, 618–627. [Google Scholar] [CrossRef]
  6. Sullivan, C.A.; Skeffington, M.S.; Gormally, M.J.; Finn, J.A. The Ecological Status of Grasslands on Lowland Farmlands in Western Ireland and Implications for Grassland Classification and Nature Value Assessment. Biol. Conserv. 2010, 143, 1529–1539. [Google Scholar] [CrossRef]
  7. Xu, H. A Remote Sensing Urban Ecological Index and Its Application. Acta Ecol. Sin. 2013, 33, 7853–7862. [Google Scholar]
  8. Xu, H. A Remote Sensing Index for Assessment of Regional Ecological Changes. China Environ. Sci. 2013, 33, 889–897. [Google Scholar]
  9. State Environmental Protection Administration. Environmental Protection Industry Standard of the People’s Republic of China (Trial) HJ/T192-2006. Available online: https://max.book118.com/html/2017/0604/111559755.shtm (accessed on 10 August 2019).
  10. Zhi, Y.; Wang, Z.; Ma, Z.; Han, X.; Li, J.; Ren, P.; Li, H.; Gao, T.; Bai, F. Research on Ningxia’s Resource and Environmental Performance and Its Changing Trends. Acta Ecol. Sin. 2009, 29, 6490–6498. [Google Scholar]
  11. Meng, Y.; Zhao, G. Ecological Environment Condition Evaluation of Estuarine Area Based on Quantitative Remote Sensing—A Case Study in Kenli County. China Environ. Sci. 2009, 29, 163–167. [Google Scholar]
  12. Ye, Y.; Liang, Y.; Shen, Y.; Xie, L. Some Issues Related to “Technical Criterion for Eco-environmental Status Evaluation (Trial Implementation)”. Trop. Geogr. 2009, 29, 404–406. [Google Scholar]
  13. Zhou, X.; Luo, H. Ecological Environment Quality Assessment of Beipanjiang Basin based on GIS and Remote Sense. Environ. Sci. Manag. 2018, 43, 178–182. [Google Scholar]
  14. Huang, Y.; Yan, H.; Li, X.; Wu, X.; Wang, Z. Monitoring and Evaluation of Remote Sensing Ecological Distance Index in Urumqi City. Remote Sens. Inf. 2019, 34, 72–77. [Google Scholar]
  15. Xu, H.; Wang, M.; Shi, T.; Guan, H.; Fang, C.; Lin, Z. Prediction of ecological effects of potential population and impervious surface increases using a remote sensing based ecological index (RSEI). Ecol. Indic. 2018, 93, 730–740. [Google Scholar] [CrossRef]
  16. Rukeya, S.; Abuduheni, A.; Li, H.; Nijat, K.; Li, X. Dynamic Monitoring and Analysis of Ecological Environment in Fukang City Based on RSEI Model. Res. Soil Water Conserv. 2020, 27, 283–289+297. [Google Scholar]
  17. Zhu, H.; Wang, J.; Cheng, F.; Deng, H.; Zhang, E.; Li, Y. Monitoring and Evaluation of Eco-environmental Quality of Lake Basin Regions in Central Yunnan Province, China. Chin. J. Appl. Ecol. 2020, 31, 1289–1297. [Google Scholar]
  18. Sun, Y.; Li, J.; Yu, Y.; Zeng, W. Ecological Assessment Based on Remote Sensing Ecological Index: A Case Study of the “Three-Lake” Basin in Yuxi City, Yunnan Province, China. Sustainability 2022, 14, 11554. [Google Scholar] [CrossRef]
  19. Zhang, J.; Zhou, Q.; Cao, M.; Liu, H. Spatiotemporal Change of Eco-Environmental Quality in the Oasis City and Its Correlation with Urbanization Based on RSEI: A Case Study of Urumqi, China. Sustainability 2022, 14, 9227. [Google Scholar] [CrossRef]
  20. Boori, M.; Choudhary, K.; Paringer, R.; Kupriyanov, A. Spatiotemporal ecological vulnerability analysis with statistical correlation based on satellite remote sensing in Samara, Russia. J. Environ. Manag. 2021, 285, 112138. [Google Scholar] [CrossRef]
  21. Saleh, S.; Amoushahi, S.; Gholipour, M. Spatiotemporal ecological quality assessment of metropolitan cities: A case study of central Iran. Environ. Monit. Assess. 2021, 193, 305. [Google Scholar] [CrossRef]
  22. Yang, X.; Meng, F.; Fu, P.; Zhang, Y.; Liu, Y. Spatiotemporal change and driving factors of the Eco-Environment quality in the Yangtze River Basin from 2001 to 2019. Ecol. Indic. 2021, 131, 108214. [Google Scholar] [CrossRef]
  23. Yang, Z.; Tian, J.; Su, W.; Wu, J.; Liu, J.; Liu, W.; Guo, R. Analysis of Ecological Environmental Quality Change in the Yellow River Basin Using the Remote-Sensing-Based Ecological Index. Sustainability 2022, 14, 10726. [Google Scholar] [CrossRef]
  24. An, M.; Xie, P.; He, W.; Wang, B.; Huang, J.; Khanal, R. Spatiotemporal change of ecologic environment quality and human interaction factors in three gorges ecologic economic corridor, based on RSEI. Ecol. Indic. 2022, 141, 109090. [Google Scholar] [CrossRef]
  25. Chen, W.; Liu, L.; Liang, Y. Retail center recognition and spatial aggregating feature analysis of retail formats in Guangzhou based on POI data. Geogr. Res. 2016, 35, 703–716. [Google Scholar]
  26. Chi, J.; Jiao, L.; Dong, T.; Gu, Y.; Ma, Y. Quantitative Identification and Visualization of Urban Functional Area Based on POI Data. J. Geomat. 2016, 41, 68–73. [Google Scholar]
  27. Guo, Y.; Liu, M. Classification and spatial distribution characteristics of tourist attractions in Shanxi Province based on POI data. Sci. Geogr. Sin. 2021, 41, 1246–1255. [Google Scholar]
  28. Han, L.; Zhang, M. Spatial coupling between land use level and land ecological security in the Yellow Triangle based on POI data. J. Shandong Univ. Financ. Econ. 2022, 34, 39–50+61. [Google Scholar]
  29. Luo, Y. Formation, Characteristics and Prevention of the Meteorological Disasters in Meizhou. Trop. Geogr. 2007, 27, 505–510. [Google Scholar]
  30. Wang, L.; Zhao, X. On Ecological Civilization Oriented Government Performance Assessment System in To-be Developed Areas: A Case Study of Meizhou in Guangdong Province. J. Poyang Lake 2015, 64–69. [Google Scholar]
  31. Jiang, Y. Evaluation of Coordinated Development between Ecological Environment and Economy in Mianyang City. Chin. J. Agric. Resour. Reg. Plan. 2017, 38, 131–135. [Google Scholar]
  32. Web of Science—GPP Dataset Preprocessing of MODIS—Taking MOD17A2H as an Example—Hu Yinglong’s Blog Post 2020-4-24. Available online: https://blog.sciencenet.cn/blog-3336537-1230005.html (accessed on 3 May 2020).
  33. Wagle, P.; Xiao, X.; Torn, M.; Cook, D.; Matamala, R.; Fischer, M.; Jin, C.; Dong, J.; Biradar, C. Sensitivity of vegetation indices and gross primary production of tall-grass prairie to severe drought. Remote Sens. Environ. 2014, 152, 1–14. [Google Scholar] [CrossRef]
  34. Guo, Z.; Wang, Z.; Liu, D.; Song, K.; Song, C. Analysis of temporal and spatial features of farmland productivity in the Sanjiang Plain. Trans. CSAE 2009, 25, 249–254, (In Chinese with English Abstract). [Google Scholar]
  35. Caccamo, G.; Chisholm, L.A.; Bradstock, R.; Puotinen, M.L. Assessing the sensitivity of MODIS to monitor drought in high biomass ecosystems. Remote Sens. Environ. 2011, 115, 2626–2639. [Google Scholar] [CrossRef]
  36. Hu, Y. Spatial Zoning and Effect Analysis for Land Use Spatial Conflict in Pearl River Delta Urban Agglomeration. Master’s Thesis, Guangzhou University, Guangzhou, China, 2019. [Google Scholar]
  37. Lu, Y.; Li, X.; Yang, Z. Evaluation on eco-environmental quality change of Wujiang River basin in Guizhou Province from 1990 to 2015. Bull. Soil Water Conserv. 2018, 38, 140–146. [Google Scholar]
  38. Crist, E.P. A TM Tasseled Cap Equivalent Transformation for Reflectance Factor Data. Remote Sens. Environ. 1985, 17, 301–306. [Google Scholar] [CrossRef]
  39. Muhammad, H.A.B.; Zhang, L.; Shuai, T.; Tong, Q. Derivation of a Tasselled Cap Transformation Based on Landsat 8 At-satellite Reflectance. Remote Sens. Lett. 2014, 5, 423–431. [Google Scholar]
  40. Feng, Y.; Luo, G.; Zhou, D. Effects of land use change on landscape pattern of a typical arid watershed in the recent 50 years: A case study on Manas River watershed in Xinjiang. Acta Ecol. Sin. 2010, 30, 4295–4305. [Google Scholar]
  41. Su, Y.-Z.; Zhao, W.-Z.; Su, P.-X.; Zhang, Z.-H.; Wang, T.; Ram, R. Ecological effects of desertification control and desertified land reclamation in an oasis–desert ecotone in an and region: A case study in Hexi Corridor, northwest China. Ecol. Eng. 2007, 29, 117–124. [Google Scholar] [CrossRef]
  42. Huang, S.; Zheng, X.; Ma, L.; Wang, H.; Huang, Q.; Leng, G.; Meng, E.; Guo, E. Quantitative contriution of climate change and human activities to vegetation cover variations based on GA-SVM model. J. Hydrol. 2020, 584, 124687. [Google Scholar] [CrossRef]
  43. Gao, P.; Kasimu, A.; Zhao, Y.; Lin, B.; Chai, J.; Ruzi, T.; Zhao, H. Evaluation of the Temporal and Spatial Changes of Ecological Quality in the Hami Oasis Based on RSEI. Sustainability 2020, 12, 7716. [Google Scholar] [CrossRef]
  44. Wang, Z.; Bai, T.; Xu, D.; Kang, J.; Shi, J.; Fang, H.; Nie, C.; Zhang, Z.; Yan, P.; Wang, D. Temporal and Spatial Changes in Vegetation Ecological Quality and Driving Mechanism in Kökyar Project Area from 2000 to 2021. Sustainability 2022, 14, 7668. [Google Scholar] [CrossRef]
  45. Ministry of Ecology and Environment of the People’s Republic of China. Technical Criterion for Ecosystem Status Evaluation; HJ 192-2015; China Environmental Science Press: Beijing, China, 2015.
  46. Wang, Y.; Zhao, Y.; Wu, J. Dynamic monitoring of long time series of ecological quality in urban agglomerations using Google Earth Engine cloud computing: A case study of the Guangdong-Hong Kong-Macao Greater Bay Area, China. Acta Ecol. Sin. 2020, 40, 8461–8473. [Google Scholar]
  47. Miao, X.; Liang, Q. Analysis of Ecological Environment Changes in Yongjiang River Basin Based on Remote Sensing Ecological Index. Resour. Environ. Yangtze Basin 2020, 30, 427–438. [Google Scholar]
  48. Qiu, L.; He, Y.; Zhang, L.; Wang, W.; Tang, Y. Spatiotemporal variation characteristics and influence factors of MODIS LST in Qilian Mountains. Arid Land Geogr. 2020, 43, 726–737. [Google Scholar]
  49. Wang, F.; Li, W.; Lin, Y.; Nan, X.; Hu, Z. Spatiotemporal Pattern and Driving Forces Analysis of Ecological Environmental Quality in Typical Ecological Areas of the Yellow River Basin from 1990 to 2020 [J/OL]. Environ. Sci. 2022, 8, X821. [Google Scholar] [CrossRef]
Figure 1. Map of study area.
Sustainability 14 13424 g001
Figure 2. Data-processing flowchart.
Sustainability 14 13424 g002
Figure 3. Spatial distribution of RSEI in Meizhou City.
Sustainability 14 13424 g003
Figure 4. The RSEI change of Meizhou City. Note: Figure legends are divided according to Table 3. W1, W2, W3, and W4 represent the degrees of deterioration of ecological environment quality, which are slightly worse, moderately worse, obviously worse, and significantly worse. B1, B2, B3, and B4, respectively, represent the degrees of improvement in ecological environment quality, which are slightly better, moderately better, obviously better, and significantly better. Δ0 means basically unchanged.
Sustainability 14 13424 g004
Figure 5. Distribution map of POI density in Meizhou in 2018.
Sustainability 14 13424 g005
Figure 6. Normalization results of GPP, LST, WET, and NDSI raster data in Meizhou in 2018.
Sustainability 14 13424 g006
Table 1. Remote sensing image information.
YearLandsat7 ETM or Landsat8 OL_TIRSMODIS
2008LE71210432008353EDC00 LE71210442008353EDC00
LE71200432008346EDC00 LE71200442008346EDC00
MOD17A2 (46 issues in 2008)
MYD11A2 (46 issues in 2008)
2013LS8_C_20140203120043L4
LS8_C_20131201120044L4
LS8_C_20130919121043L4
LS8_C_20130919121044L4
MOD17A2 (46 issues in 2013)
MYD11A2 (46 issues in 2013)
2018LC81200432018013LGN00
LC81200442017314LGN00
LC81210432017353LGN00
LC81210442017305LGN00
MOD17A2 (46 issues in 2018)
MYD11A2 (46 issues in 2018)
Table 2. Leveled RSEI statistics of Meizhou City.
RSEI Grade200820132018
Area
/km2
Percentage/%Area
/km2
Percentage/%Area
/km2
Percentage/%
Excellent (0.8–1]245715.7437127.9281418.0
Good (0.6–0.8]720146.0574036.7754548.2
Medium (0.4–0.6]545934.9478830.6465029.7
Inferior (0.2–0.4]1250.82501.61470.9
Poor (0–0.2]4182.75113.35043.2
Table 3. Changes in the ecological environment quality level of Meizhou City.
CategoryGrade2008–20132013–20182008–2018
Area/km2Percentage/%Area/km2Percentage/%Area/km2Percentage/%
WorseSignificantly10.012931.872381.52
Obviously280.188665.541681.07
Moderately4242.71270317.286824.36
Slightly345422.08644241.19201812.90
UnchangedNominally779849.86383824.54841653.81
BetterSlightly348622.298905.69296518.96
Moderately4372.791971.266304.03
Obviously120.082221.423432.19
Significantly00.002931.871801.15
Table 4. Correlation coefficient matrix of POI with each index and RSEI.
IndexPOIGPPLSTNDSIWETRSEI
POI1−0.4550.5240.214−0.227−0.361
GPP−0.4551−0.644−0.3290.2980.611
LST0.524−0.64410.418−0.377−0.474
NDSI0.214−0.3290.4181−0.269−0.309
WET−0.2270.298−0.377−0.26910.331
Average correlation ( C ¯ )--0.42370.47970.33870.31470.4313
Publisher’s Note: MDPI stays neutral with regard to jurisdictional claims in published maps and institutional affiliations.

