Abstract
The high-quality development of China’s green finance is driven by the aims of reaching peak carbon and carbon neutrality, leading to an important impact of emissions trading policies on the profitability and debt burden of China’s listed companies. This paper uses propensity score matching (PSM) and the difference in differences (DID) method to study the impact of carbon emissions trading policies on the profitability and debt burden of listed companies in seven carbon emissions trading pilots from 2010 to 2019. The empirical evidence shows that the implementation of carbon emissions trading policies has increased the profitability and reduced the debt burden of listed companies: (1) Mechanism test shows that this policy can increase the profitability and debt burden of state-owned listed companies by increasing innovation investment. (2) The negative effects of this policy on the profitability and debt burden of state-owned listed companies are more obvious than that of the others. (3) The policy has also significantly reduced the debt burden of competitive companies and the profitability of monopolies. (4) The policy yields a more intense reduction in the debt burden of listed companies in high-carbon emission industries. Finally, this paper suggests that listed companies’ participation in the carbon emissions trading policy be expanded and that monopoly conditions among listed companies are reduced.
1. Introduction
A unified national carbon trading market is an important part of China’s emissions reduction commitment to the international community. As an important decision, it can not only control and reduce greenhouse gas emissions to a certain extent, but also promote the transition of China’s economy to a green and low-carbon economy. With the requirement to gradually establish a carbon emissions trading market in the 12th five-year plan, China established carbon trading pilots in Beijing, Shanghai, Guangdong, Shenzhen, and Tianjin in 2013.
With the implementation of the seven carbon market pilots, the development of related trading businesses has accelerated. Initially, the seven pilot areas of carbon trading covered nearly 3000 key emission companies, involving electric power, cement, steel, and other industries until the end of 2019. The trading volume reached more than 330 million tons, and the trading amount also exceeded 7.1 billion yuan. In December 2020, the Ministry of Ecology and Environment of China officially issued the 2019–2020 National Carbon Emission Trading Quota Setting and Distribution Implementation Plan (Power Generation Industry). According to the implementation plan, there will be a total of 2225 key emission units in the power generation industry that are included in the national carbon market. It is preliminarily estimated that the total carbon dioxide emissions of these thermal power companies will be 4 billion to 4.5 billion tons per year. There are 2837 key emission units, 1082 non-compliance agencies and 11,169 natural persons participating in pilot carbon market transactions (Miao et al., 2019) [1].
The carbon trading policy is mainly to force companies to reduce emissions by means of the marketization of carbon emission rights. Its implementation will speed up the process of carbon peaking and carbon neutralization, which is conducive to the high-quality development of carbon finance. At the same time, higher requirements are also placed on companies, so it is particularly important to explore whether the company’s profitability and debt burden will be affected by carbon trading policies. Therefore, this paper is mainly from the perspective of companies to explore how carbon trading policies will affect the profitability and debt burden of companies, which is of great significance to achieving dual carbon goals and high-quality economic growth.
As China’s carbon trading market moves from regional pilot to national unification, the government aims to peak carbon dioxide emissions before 2030 and strive to achieve carbon neutrality by 2060, which puts higher requirements for the transition of China’s economic structure to a greener structure. Therefore, will the implementation of carbon emissions trading policies have a certain impact on companies? Will it have an adverse impact on the profitability and debt burden of listed companies? Will it follow the Porter Hypothesis (Peng et al., 2017) [2]? At present, whether the carbon emission trading system can produce a win-win effect (Porter & Vander, 1995) [3] and influence the long-term development of listed companies has not been verified.
After trading in the carbon trading market, the equilibrium between the demand and supply of carbon emissions is achieved. The carbon trading policy will have a powerful effect on companies, allowing companies to carry out reforms that are conducive to reducing carbon emissions. After the implementation of the carbon trading policy, the carbon emissions of companies will gradually decrease, and they will further obtain more carbon emission credits to expand production, to achieve the growth of their own profit level and achieve the win-win goal of environmental protection and company’s development.
Based on Coase’s Property Rights Theory (Chen et al., 2018) [4], a carbon trading system can help the government to promote the internalization of a company’s environmental costs, thus facilitating the combination of market-based mechanisms and environmental regulation. At present, there are relatively few studies on the impact of carbon trading policy on the company’s profitability and debt burden, and the conclusions are also inconsistent. Generally, most of the existing research is conducted on specific industries or projects from the perspective of a company’s value, such as the power industry. There are still relatively few studies on listed companies, especially on the profitability and debt burden of listed companies.
Based on the above considerations, this paper analyzes the impact of carbon emissions trading policy on the profitability and debt burden of listed companies through the difference in differences (DID) model. We select A-share listed companies in China from 2010 to 2019 as data samples. Through matching, 56 listed companies in the experimental group and 557 listed companies in the control group are obtained. In addition, this paper also studies the differences in company’s profitability and debt capacity from the perspective of heterogeneity and verifies the differences in the impact of carbon emissions trading policy on the profitability and debt burden of listed companies from the perspectives of state-owned and non-state-owned, monopoly and competition, and carries out carbon emissions trading between relevant and non-relevant groups. Finally, this paper will help to deepen and enrich the carbon emission trading policies on the profitability and debt burden of listed companies in the existing literature.
The main contributions of this paper are the following two points: on the one hand, this paper uses the data of listed companies to quantitatively analyze the impact of the carbon emission trading policy from the micro level, and empirically studies the impact of the carbon emission trading policy on the profitability and debt burden of listed companies. On the other hand, from the perspective of heterogeneity, this paper verifies the difference in the impact of the carbon emissions trading policy on the profitability and debt burden of listed companies and conducts group inspections on the state-owned and non-state-owned, monopolies and competition, and carbon emissions trading related and non-related groups.
The remaining part of the paper is organized as follows: Section 2 reviews the previous literature on the impact of carbon emissions trading on the profitability and debt burden of listed companies. Section 3 illustrates the mechanisms involved and presents the model construction and related variable. Section 4 analyzes the empirical results. Section 5 further discusses and analyzes heterogeneity. The conclusions and suggestions are outlined in Section 6.
2. Literature Review
Carbon trading policies had many impacts on companies. In terms of the impact of carbon trading markets on companies, most of the research is on the impact on the environment and economy after the implementation of carbon trading policies, as well as the effect and effectiveness of implementation. On the one hand, Jia and Lin (2020) [5] find in their research that the implementation of carbon trading policies inhibits the output level of companies in energy-intensive industries; some scholars propose that carbon trading policies do not play a positive role in promoting economic development in the short term, but other policies can be used to alleviate this inhibitory effect (Yang et al., 2016) [6]. On the other hand, regarding the carbon emission reduction effect of carbon trading policies, some scholars believe that carbon trading policies have a significant inhibitory effect on carbon dioxide emissions (Zhang et al., 2020; Zhang et al., 2020) [7,8]. Carbon trading policies can help save about 63.53 yuan per ton of emission reduction costs (Zhang & Zhang, 2020) [9]. Other scholars pay attention to the impact of carbon trading policies on companies’ environmental performance, mainly including the environmental health effects (Zhang et al., 2020) [10], dividends brought by employment (Yang et al., 2020) [11], and improving the efficiency of green innovation efficiency and regional carbon equity (Zhang et al., 2021) [12].
In terms of the impact of carbon trading policies on company value, some scholars conducted research and analysis on this aspect. During the pilot carbon emissions trading, the company’s value and financial performance will be significantly and effectively improved under the implementation of the carbon emissions trading policy (Oestreich et al., 2015) [13]. Chang and Wang (2010) [14] conduct a difference in differences model on Chinese carbon emissions trading and find that carbon emissions trading has an impact on the economic growth and industrial structure of various provinces and cities, and it has a nonlinear relationship in economic growth. It mainly focuses on the impact of carbon emission trading policies and other environmental regulations on company’s value, as well as the impact on economic growth and industrial structure. Zhang and Wang (2021) [15] find significant industrial and regional heterogeneity. The policy reduces the investment expenditure of related companies in the building material and steel industries. Scholars study carbon emissions trading systems and the value of listed companies from the perspectives of the time span and company’s characteristics. Chen et al. (2010) [16] believe that the carbon emission trading system has a significant effect on the company’s value in the short term but has no significant effect on the company’s long-term holding periods and performance. Similarly, Lanoie (2011) [17] believes that company’s value will also be affected by differences in carbon allowances and carbon emissions trading standards in the short term. Qi et al. (2021) [18] find that the pilot carbon trading policy is predicted to have a significantly positive effect on the low-carbon innovation of enterprises within its scope, especially in alleviating financing barriers for low-carbon innovation. In terms of company’s characteristics, Liu et al. (2012) [19] prove that carbon emissions trading is conducive to companies increasing their value. Compared to state-owned listed companies, non-state-owned listed companies have a more obvious effect on the increase of carbon emissions trading. In state-owned companies, the shareholding ratio of long-term institutional investors will be positively affected by the company’s environmental performance, and this effect is not valid for short-term investors (Liu et al., 2013) [20].
In terms of the impact of carbon trading policies on company performance, some scholars have found that carbon emissions trading has a significant positive effect on environmental performance. For example, Wang et al. (2016) [21] find that carbon emissions trading has a significant positive effect on the environmental performance and financial performance of the power industry. Lin and Jia (2020) [22] prove that the company value of power companies will also increase as the carbon emissions trading price increases. Similarly, Oestreich et al. (2015) [13] also reach the same conclusion that the implementation of carbon emissions trading policies will help to improve a company’s value and financial performance. On the other hand, the high-quality production level of companies in carbon emissions trading areas is significantly improved compared to those in non-trading areas (Calel & Dechezlepretre, 2016) [23]. Studies examine if the carbon emission trading system can improve the high-quality production level of companies to increase the profitability and debt burden of companies. Niu and Xie (2020) [24] find that when the brand image advantage and the unit pollution/quantity ratio are both small, more profits and fewer pollutants are obtained.
In terms of the impact of carbon trading policies on the debt burden of listed companies, mainly focus on two aspects. On the one hand, the implementation of carbon emissions trading will reduce the debt burden of listed companies. Listed companies participating in the carbon emissions trading policy may also control carbon emissions by increasing investment in technology development R&D and technological improvements. Lanjouw and Mody (1996) [25] study that the increase in environmental governance costs is related to environmental R&D patents, and it also increases the R&D investment of companies. Thereby, the saved quota can be resold or refinanced, which greatly reduces its debt burden. On the other hand, the implementation of carbon emissions trading policies may greatly improve the disclosure of relevant carbon information in the carbon market, especially when listed companies are subject to supervision, so as to eliminate the information asymmetry between listed companies and investors, thereby affecting the debt burden cost of listed companies. Wu et al. (2019) [26] show that a company’s carbon environmental performance reduces the overall positive impact of carbon emissions on financial debt, and the role of carbon emissions as an indicator of financial activities will weaken the overall positive impact of carbon emissions on the financial debt. Vera and Federico (2020) [27] investigate the relationship between carbon emissions and debt financing costs by studying Euro area companies from 2010 to 2018 and prove the effectiveness of public policies in promoting the allocation of loan institutions and the role of climate-related information disclosure in reducing company’s capital costs.
In terms of the impact of carbon trading policies on the innovation input of listed companies, Jaffe et al. (1997) [28] find that green R&D investment increased by 1% with the increase of pollution control expenditure by 0.15% and propose that environmental regulations can increase the technical input of American manufacturing companies. Richandson and Welker (2001) [29] believe that the information asymmetry between investors and managers is improved after the disclosure of information such as carbon information, and investor preferences increased after risk re-estimation, thereby reducing the capital cost of the enterprise. Plumlee et al. (2015) [30] empirically verify the changes in the company’s capital cost after the company’s environmental information is disclosed. The empirical results show that the cost of equity capital decreases as the level of a company’s environmental disclosure is higher. In China, Rankin et al. (2011) [31] also prove the significant negative correlation between the cost of equity capital and the disclosure of carbon information environment through empirical research.
Based on the above research, we can find the following two shortcomings: First, most research generally focuses on the risk and impact of the carbon trading market. It is mainly about the impact of carbon trading policies and related environmental regulations on companies, involving company value, financial performance, and environmental performance. Few scholars have studied the impact of carbon trading policies on companies from the perspective of a company’s debt burden. Second, there is little literature to study the impact and heterogeneity of carbon trading policies on profitability and debt burden using data from listed companies. Whether the carbon emission trading market will adversely affect the profitability and debt burden of listed companies has also not been fully tested. Therefore, the impact of carbon emissions trading on the profitability and debt burden of listed companies still needs to be further analyzed and tested.
3. Methodology and Data
3.1. Methodology
Following the existing related literature (Oestreich, 2015) [13], this paper establishes an empirical model. As relatively few listed companies participate in carbon emissions trading, propensity score matching (PSM) is used to determine matching control companies to show the robustness of the results. At present, there are three main methods for propensity score matching, namely nearest neighbor matching, radius matching, and kernel matching. Referring to Oestreich et al. (2015) [13] and Li et al. (2012) [32], this paper adopts the nearest neighbor matching method to carry out one-to-one alternative matching for 56 listed companies in the experimental group.
From the perspective of the whole society, carbon trading is a heterogeneous transaction. Due to the different marginal emission reduction costs of different companies in different regions, it has built an “economic-environmental” trading platform through market-oriented means. While achieving the emission reduction target, it can stimulate the initiative of market entities, promote the optimal allocation of low-carbon elements, and improve the energy structure. At the same time, companies are forced to carry out technological transformation and upgrading to resolve high-carbon outdated production capacity by controlling carbon emissions as a constraint. Therefore, considering the impact of the company’s innovation investment mechanism, Hang et al. (2019) [33] use the company’s innovation investment index (the ratio of R&D investment to operating income) as the dependent variable and the DID method to further estimate the impact of the carbon trading mechanism on the company’s innovation investment.
The factors affecting the company’s carbon emissions trading include company size, financial risk, equity concentration, company growth, etc. Therefore, the matching variables are selected in the model, such as company size (size), current ratio (current), asset-liability ratio (lev), total asset turnover (turnover), equity concentration (shrhfd) and operating income growth rate (growth), etc. The propensity score is used to ensure that the control group and the treatment group have the closest propensity score value. Combining the explanatory variables in this paper, this paper has three explanatory variables: whether to be included in carbon emission trading (treated), the implementation time of carbon emissions trading policy (t) and the interaction term (treated*t). Whether it is included in the carbon emission trading (treated) and the implementation time (t) of carbon emission trading policy are all dummy variables. We also use the difference in differences (DID) method to analyze the effect of carbon emissions trading on the profitability and debt burden of listed companies:
Roai,t represents the profitability of the listed company, measured by the return on capital, i stands for company code, and t stands for the period; Decai,t represents the debt burden of the listed company in the current period; ai is the coefficient in the model; t is the year in which carbon emissions trading is implemented in the pilot area (dummy variable, taking value 1 in 2014 and later, 0 before 2014); treated is the variable whether the listed company participates in carbon emissions trading (dummy variable, 1 for pilot companies in pilot cities, 0 for nonpilot companies in pilot cities); treated*t is the interaction items of the year in which the carbon emissions rights are traded and whether the firm participates in carbon trading; Xi,t represents the control variables, including the current ratio (current), company size (size), asset-liability ratio (lev), total asset turnover (turn), equity concentration (shrhfd), and investor protection degree (investor), and εi is the residual.
As shown in Table 1, the return on assets of listed companies is used to represent the profitability of listed companies (roa), which is calculated from the ratio of net profit to total assets. The debt burden of listed companies is expressed by the natural logarithm of the debt cost of listed companies and is denoted by (deca). Referring to Chen et al. (2008) [34] and Franks and Mayer (2001) [35], this paper includes control variables commonly used in the previous literature. The following variables are selected to control for the impact of other factors on its profitability and debt burden, including asset-liability ratio (lev), current ratio (current), equity concentration (Shrhfd), company size (size), total asset turnover (turnover), and operating income growth rate (growth).

Table 1.
Variable definition and calculation method.
3.2. Data Sources
This paper mainly focuses on the changes in the profitability and debt burden of listed companies participating in not participating in carbon emissions trading after the implementation of the carbon emissions trading policy. Chinese A-share listed companies from 2010 to 2019 are selected as the sample. Due to the different establishment times of the seven carbon trading pilots, Beijing, Shanghai, Guangdong, Shenzhen, and Tianjin established carbon trading pilots in 2013, while Hubei and Chongqing established and implemented carbon trading pilots in 2014. Therefore, 2014 is chosen as the start time for carbon trading pilots in 7 provinces and cities (Oestreich et al., 2015) [13]. The list of specific companies is manually collected from the List of Carbon Emissions Trading Companies published by the Development and Reform Commission of seven provinces and cities in the period 2013–2019.
Companies located in these seven regions and listed in A-shares before December 2010 are selected as the experimental group and the control group samples. We take the listed companies in the control ranking list as the experimental group and select the control group from the rest of the observations. In this paper, the data obtained are processed as follows to ensure the reliability of the data: (1) excluding companies listed after 31 December 2010; (2) excluding real estate and financial listed companies; (3) excluding listed companies with missing data; (4) excluding ST, ST* (ST: Listed companies with abnormal financial status or other conditions; ST*: Its company may be delisted) and delisted listed companies. All data are from CSMAR (China Stock Market Accounting Research), Wind (Wind Information is a leading financial information service company in China, committed to providing accurate and timely information and communication platforms for financial professionals), National Bureau of Statistics and China Statistical Yearbook.
4. Empirical Results
4.1. Descriptive Statistics
Table 2 presents descriptive statistics for selected main variables in the model and shows the results of the descriptive statistical analysis of the model. The profitability (net profit/total assets) of listed companies ranges from −7.285% to 7.249%, reflecting the difference in profitability between companies. The debt burden (total debt capital) of listed companies increased during this time. Among the explanatory variables, the equity concentration ratio (the largest shareholder’s shareholding ratio) ranges from 0.286% to 89.093%, reflecting the gap in equity concentration among listed companies, which is not conducive to the experiment. Due to the large differences between the listed companies participating in the carbon emissions trading, it is necessary to conduct PSM processing. Among the explanatory variables shown in Table 2, the profitability of listed companies ranges from −0.420% to 1.238%, while the debt burden (total debt capital) of listed companies ranges from 5,158,571 to 3.15 × 10¹⁵ after PSM processing. It can be seen that the difference in the profitability of listed companies has narrowed significantly. Regarding the changes in the explanatory variables, the mean value of the implementation time of the carbon emissions trading policy remains stable, and the mean value of whether listed companies are included in the carbon emissions trading treatment has risen to 0.513. It can be seen that the result meets the PSM processing requirements.
Table 2.
Descriptive statistics.
4.2. PSM Matching and Parallel Trends Test
As shown in Table 3, a parallel trend test is also conducted to ensure PSM accuracy. It can be seen that the variable deviation after matching has been significantly reduced to a certain extent. After PSM matching, there is no significant difference in all variables between the experimental group and the control group because the P value of the T-test is greater than 10%. Figure 1 shows the balance of variables before and after PSM matching. Given the symmetry of the experimental group and the control group, the matching effect is suitable.
Table 3.
PSM balance test.
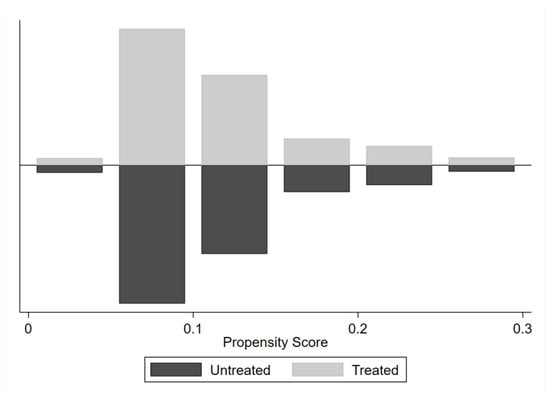
Figure 1.
Balance before and after PSM.
As shown in Figure 2 and Figure 3, this paper conducts a parallel trends test on the profitability and debt burden of listed companies in the experimental group and the control group after PSM matching. Before the implementation of the carbon trading policy in 2014, the profitability and debt burden of listed companies in the experimental group and the control group are basically the same, as the results in the figure show. After implementation, the profitability and debt burden of the two groups of listed companies have undergone different changes. Therefore, the data of the experimental group and control group after PSM meet the prerequisites for the parallel trends hypothesis.
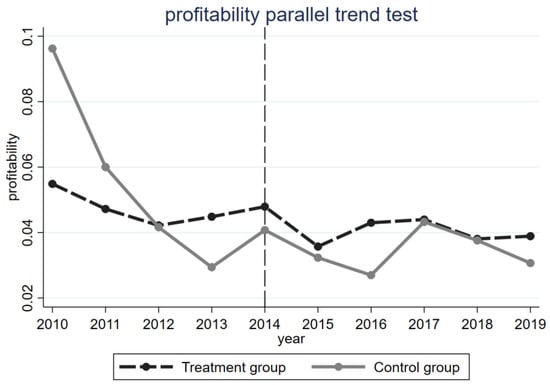
Figure 2.
Profitability parallel trend test.
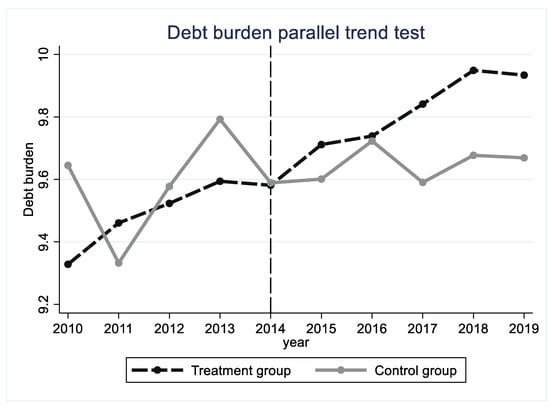
Figure 3.
Debt burden parallel trend test.
In order to further verify that the treatment group and the control group have the same trend before the policy implementation, this paper constructs dummy variables and further examines the change trends of the treatment group and the control group. Among them, pre (i = 2, 3, 4) is the dummy variable in the year before the policy is implemented, now is the dummy variable in the year of the policy implementation, post (=1, 2, 3, 4, 5) is the dummy variable for the year after the policy is implemented. Column (1) and column (2) of Table 4 discuss the roa and deca variables. The test results are shown in Table 4, and the regression results before 2014 are not significant, indicating that there is no significant difference between the treatment group and the control group before the implementation of the carbon trading policy. In the year when the carbon trading policy was implemented, the treatment group increased significantly compared with the control group. Therefore, the sample passes the parallel trends test required for the DID model.
Table 4.
Parallel trend test.
4.3. Carbon Emissions Trading, Firm Profitability, and Debt Burden
Table 5 shows the regression relationship between carbon emissions trading and a company’s profitability. Model 1 is used to verify whether the implementation of carbon emissions trading can improve the profitability of listed companies. Whether the implementation of carbon emissions trading can reduce the debt burden of listed companies is verified by Model 2. The explanatory variables of the model are profitability (roa) and debt burden (deca). The control variables include company size (size), asset-liability ratio (lev), total asset turnover (turnover), current ratio (current), equity concentration (shrhfd), and operating income growth rate (growth).
Table 5.
Sample regression results.
In Table 5, column (1) discusses the impact of carbon trading policies on corporate profitability and column (2) adds PSM. Column (1) shows no significant effect between carbon trading policies and corporate profitability and column (2) verifies the impact of carbon emissions trading on the profitability of listed companies by using post-PSM data. The results of column (2) show that the interaction coefficient is significantly positively correlated at the level of 5%, indicating that carbon emissions trading promotes the profitability of listed companies, and the profitability of the companies included in the carbon emissions trading has been significantly increased. Our results are consistent with the existing research results (Wang et al., 2016; Lin and Jia, 2020) [21,22]. Under the guidance of the carbon trading market, the companies can improve their performance by increasing investment in low-carbon production technology, and the emission allowances from the balance of low-carbon production can help companies make profits and enhance their profitability.
Column (3) of Table 5 discusses the impact of carbon trading policies on corporate debt burden. Based on the model, column (2) adds PSM. Columns (3) and (4) verify the impact of carbon emissions trading on a company’s debt burden. The regression results show that the interaction terms of the overall sample model and the matched sample are significantly negatively correlated at the 1% level. The results are consistent with the existing research results (Plumlee et al., 2015; Rankin, 2011) [30,31]. This means that the debt burden of listed companies involved in carbon emissions trading can be significantly reduced after the implementation of the carbon emissions trading mechanism. Under the control of the carbon trading market, companies with advanced production technology can often complete the emission reduction task before the specified time, and there will be excess carbon emission quotas. In this way, the debt cost of the company’s early improvement of low-carbon production technology will be neutralized, thereby reducing the company’s debt cost.
Considering that regional factors may also affect the empirical results, this paper introduces regional control variable city into the above model (Set eastern regions to 1 and non-eastern regions to 0). Column (1) and column (3) of Table 6 discuss the impact of carbon trading policies on corporate profitability and debt burden with city-level control variables. Column (2) and column (4) adds PSM. The empirical results are shown in Table 6. In columns (1) and (2), carbon trading policies have no significant impact on company profitability. In columns (3) and (4), carbon trading policies had a significant impact on corporate debt burden, and the probability of impact is greater after PSM. This may be because the carbon trading pilot area is relatively developed, and the addition of regional control variables has little effect on profitability.
Table 6.
Sample regression results with city-level control variables.
Through the comparative analysis before and after adding the city control variable, we find that the impact of carbon trading policy on the debt burden of the company is less affected by the city control variable, while the impact on the company’s profitability is greatly affected by the city control variable. The difference in the city may also have an effect on the profitability of the company.
4.4. Mechanism Analysis
Companies in regulated industries can be divided into more advanced and backward ones according to the degree of technological sophistication. Among them, more advanced companies account for a relatively small number. As shown in Figure 4, considering that technologically advanced companies are more low-carbon in production, they can not only actively complete the emission reduction target, but also guarantee the company’s own production on the basis of responding to the emission reduction guidance of the carbon emission rights trading market(Yang et al., 2016) [6]; other companies have low-carbon production technology, resulting in low production efficiency, so such companies not only fail to complete emission reduction tasks, and there may also be emissions costs due to penalties.
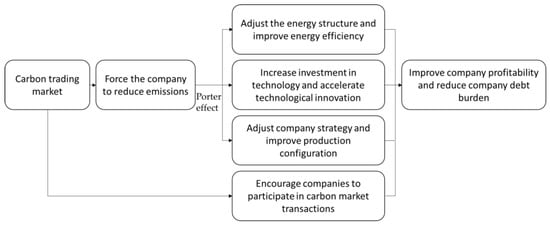
Figure 4.
Influence mechanism diagram.
Different companies will have different production characteristics due to their own production technology efficiency and will have different development methods under the control of the carbon trading market. Those companies with advanced production technology can often complete emission reduction tasks before the specified time, and there will be excess carbon emission quotas, then these companies with advanced production technology will absorb these quotas by selling or continuing to produce (Zhang and Wang, 2021) [15]. No matter which one they choose, the cost of the company’s early improvement of low-carbon production technology will be neutralized, and the company’s economic benefits will be increased, directly increasing increase the company’s profitability and reducing its debt burden.
Table 7 is the result of checking the mechanism referring to Hang et al. (2019) [33]. Column (1) of Table 7 discusses the impact of carbon trading policies on corporate R&D investment. Based on this, column (2) adds PSM. The R&DR variable (the ratio of R&D investment to operating income) is used to test the impact of carbon trading policies on company innovation investment by using the data before and after PSM, respectively. The regression results of these two sets of data show that the carbon trading policy will significantly increase the company’s R&D investment in the proportion of operating income.
Table 7.
Mechanism inspection.
4.5. Robustness Test
To ensure the rigour and reliability of empirical conclusions, this paper tests the robustness of the empirical results by replacing the explained variables and changing the implementation time of carbon trading policies. In addition, the explained variables in the research are adjusted, for example, the total return on assets is replaced by the cost profit rate (total profit/(operating cost + sales expense + management expense + financial expense)), and the debt capital is replaced by the logarithmic of the debt cost. In this paper, the profitability and debt burden of listed companies are then retested under carbon emissions trading, and the observations treated by PSM are selected to conduct regression tests on the model (shown in Table 8). Column (1) and column (2) are the robustness of the empirical results by replacing the explained variables. The empirical results show that the implementation of carbon emissions trading still has a significant positive impact on the profit margin of costs and expenses at the 10% level, and a significant negative impact on the debt burden of listed companies at the 5% level. Overall, the results have not changed substantially.
Table 8.
Robustness test.
This paper selects data on listed companies from 2010 to 2013 as the time interval and sets 2011 as the timing of the carbon emissions trading policy for a placebo test (Hang et al., 2019) [33]. Column (3) and column (4) are the robustness of the empirical results by changing the implementation time of carbon trading policies. If the empirical result is significant, this means that the implementation of the carbon emissions trading policy has nothing to do with the profitability and debt burden of listed companies. However, the empirical results show that the interaction term coefficient, namely return on total assets or debt capital, has no significant effect, indicating that the previous regression results are valid. Given robustness test of the above two methods, it can be seen that the conclusion of this study is relatively robust.
In order to further verify the reliability of the regression results, time transformation is used to supplement the above robustness test, column (1), column (2), column (3), column (4), column (5), and column (6) are the robustness of the empirical results by changing the implementation time of carbon trading policies. Companies in the range of 2014–2019 are selected as the research samples, and 2015, 2016, and 2017 are used as the policy occurrence time points. If the results are not significant, then the above results are valid. As can be seen from Table 9, the three groups of regressions are not significant, which proves that the empirical results of this study are robust.
Table 9.
Robustness test.
5. Heterogeneity Test
5.1. Heterogeneity of State-Owned and Non-State-Owned Listed Companies
Dai et al. (2018) [36] found that the carbon emissions trading policy had no Porter effect on the production efficiency of Chinese manufacturing companies or subsamples based on the nature of a company’s ownership. However, Zhang and Wang (2021) [15] found that carbon emissions trading policies have a Potter effect on Chinese manufacturing companies. To further study whether the ownership nature of listed companies will affect the implementation effect of the carbon emissions trading policy, this paper conducts a group test on the profitability and debt capital of listed companies, these samples are also formed after PSM matching.
Firstly, we analyze the impact of the heterogeneity of state-owned and non-state-owned companies on the implementation effect of carbon trading policy. The empirical results obtained are shown in Table 10. Column (1) and column (2), respectively, test the impact of the carbon emissions trading system on the profitability of state-owned and non-state-owned companies. It is found that the interaction term is positively at the level of 5%, that is, the explanatory variable is positively correlated with the profitability of state-owned enterprises but has no significant impact on the profitability of non-state-owned enterprises. Therefore, the group test shows that participating in carbon emissions trading can increase the profitability of state-owned companies significantly, but it has no impact on non-state-owned companies.
Table 10.
Regression results based on state-owned and non-state-owned groups.
In column (3), the policy implementation and the debt burden cost of state-owned enterprises are significant at the level of 1%, while the coefficient of non-state-owned enterprises is significant at the level of 5% in column (4). It shows that the carbon emissions trading policy has a significant impact on the debt burden of state-owned and non-state-owned companies, and the probability of affecting the debt burden of state-owned companies is greater. Comparing the coefficient and significance, it is found that the impact on the debt burden of state-owned companies is greater and more significant.
Compared with non-state-owned companies, state-owned companies have a better implementation of carbon trading policies. Moreover, the impact of carbon trading policies on state-owned companies is better than that of non-state-owned companies, so the profitability of state-owned companies is more significant. At the same time, in terms of corporate debt burden, state-owned companies are more likely to be affected by carbon trading policies.
5.2. Heterogeneity of Monopolistic and Competitive Listed Companies
In order to test whether the industry nature of the listed companies can affect the implementation of the carbon emissions trading policy, listed companies are divided into competitive companies and monopoly companies according to the industry nature (Qi et al. (2021)) [18]. According to the nature of the industry and the industry classification of listed companies in the fourth quarter of 2017 by the China Securities Regulatory Commission, mining, electricity, heat, natural gas, water production and supply industry, petroleum processing, coking and nuclear fuel processing industry, ferrous metal smelting and rolling processing industry, and non-ferrous metal smelting and rolling processing industry are listed as monopoly industries. The rest are competitive industries. Similarly, this paper uses Propensity Score Matching to sample the industry groups of listed companies in monopoly and competitive industries.
The empirical results obtained are shown in Table 11. Column (1) and column (2) respectively test the impact of carbon emissions trading on the profitability of monopolistic listed companies and competitive listed companies. The results show that the interaction coefficient is negative at the level of 5%, that is, the explanatory variable has a significant negative correlation with the profitability of monopoly listed companies and a positive correlation with competitive listed companies. The carbon emissions trading policy can reduce the profitability of monopoly-listed companies.
Table 11.
Regression results based on monopoly and competitive industries.
The treated*t and the debt burden cost are not significant in the monopolistic industries of column (3), while they are significantly negatively correlated at the 5% level in competitive industries of the column (4). It shows that the debt burden of listed companies in competitive industries can be significantly reduced after the implementation of carbon emissions trading policy. At the same time, compared with the profitability of monopolistic industries, carbon emissions trading policies are also more conducive to listed companies in competitive industries.
Monopolistic industry regulation and lower market competition increase the company’s cost, which is not conducive to the company’s survival and profitability and weakens the positive impact of carbon emissions trading on the company’s profitability. The competitive market environment is conducive to exerting the positive impact of carbon emission trading on the company.
5.3. Heterogeneity of High and Low Carbon Emission Industries
In order to test the heterogeneity of carbon emission industry characteristics, this paper tests whether the correlation characteristics of carbon emission of industries can affect the implementation effect of carbon emissions trading policy. According to different industry attributes, mining, power, heat, natural gas production and supply, thermal power, steel, cement, coal, metallurgy, chemical, petrochemical, pharmaceutical and mining industries are divided into industries related to carbon emissions trading (Testa, 2011) [37], while the remaining industries are classified as unrelated to carbon emissions trading.
The empirical results obtained are shown in Table 12. Column (1) and column (2), respectively, test the impact of carbon emissions trading on the profitability of listed companies in high and low-carbon emission industries. The regression results of the two models show that the effect of policy implementation is positively correlated with the profitability of industries with high and low carbon emissions, but the correlation is not significant. Therefore, there is no statistically clear evidence that carbon emissions trading policy can increase the profitability of the high and low-carbon emission industries.
Table 12.
Regression results based on high and low carbon emission industry.
The effect of policy implementation and the debt burden cost are positively correlated at the 5% level in the relevant industries in the column (3) but are not correlated in the unrelated industry in the column (4). It shows that the debt burden of listed companies in carbon emission related industries can be significantly reduced after the implementation of the carbon emissions trading policy.
Under the control of carbon trading policies, companies in high-carbon emission industries are more motivated to upgrade and improve low-carbon production, adjust their own energy structure ratios, scientifically allocate management and production strategies, and reduce their own debt costs more significantly.
6. Conclusions and Suggestions
The establishment and gradual development of carbon trading pilots in seven provinces and cities in China from 2013 to 2014 has had an important impact on the profitability and debt burden of listed companies. This paper selects 56 listed companies in the experimental group and 557 listed companies in the control group from the seven carbon emissions trading pilots as research objects from 2010 to 2019, using propensity score matching (PSM) and the difference in differences (DID) method to study the impact of carbon emissions trading policies on the profitability and debt burden of listed companies. Empirical research shows that carbon emissions trading significantly enhances the profitability of listed companies and reduces the debt burden of listed companies. The mechanism test shows that this policy can increase the profitability and debt burden of state-owned listed companies by increasing innovation investment. Further analysis shows that: (1) the carbon emissions trading policy has significantly reduced the debt burden of state-owned and non-state-owned listed companies and has greater profitability of affecting the debt burden of state-owned companies; in terms of profitability, it can significantly improve the profitability of state-owned companies. (2) In the group test of monopolistic and competitive industries, the carbon emissions trading policy can significantly reduce the debt burden of competitive listed companies; in terms of profitability, the carbon emissions trading policy can reduce the profitability of monopoly listed companies. (3) In the group test of high-carbon emission and low-carbon emission industries, the carbon emissions trading policy has a clearer negative effect on the debt burden of listed companies in high-carbon emission industries than that of listed companies in low-carbon emission industries; the profitability of both has not improved significantly. Based on the above conclusions, the following policy recommendations are proposed:
First, the scope of companies involved in carbon emissions trading can be appropriately expanded. Currently, the number of companies participating in carbon emissions trading remains limited. According to the conclusions of this paper, companies participating in carbon emissions trading are conducive to the improvement of firm profitability. Therefore, as a carbon trading policy conducive to improving a company’s profitability, it should be extended to more companies.
Second, the government should moderately deregulate to improve the competitiveness of the carbon market. Further research shows that it can significantly reduce the debt burden of listed companies and reduce the profitability of monopoly-listed companies. It may be that industry regulations and lower market competition increase firm costs, which is not conducive to firm survival and profitability, and weaken the positive impact of carbon emissions trading on the profitability and debt burden of companies. As a result, we can further improve the competitive environment and fully leverage the positive impact of carbon emissions trading on a company’s profitability.
Third, we should reduce monopoly conditions and increase competition among listed companies. According to further research, listed companies in competitive industries can bear less of a debt burden than listed companies in monopolistic industries under the implementation of carbon emissions trading policy, indicating that it is beneficial to the development of listed companies in competitive industries. Therefore, increasing competition among listed companies can enhance the positive effect of carbon emissions trading policies on the profitability and debt burden of listed companies.
Author Contributions
Conceptualization, E.W.; Methodology, J.N.; Writing—original draft, H.Z. All authors have read and agreed to the published version of the manuscript.
Funding
This work was supported by the Shanghai Customs College [2315004A2020]; Shanghai Municipal Education Commission [No. 20CG70].
Institutional Review Board Statement
Not applicable.
Informed Consent Statement
Not applicable.
Data Availability Statement
Not applicable.
Conflicts of Interest
The authors declare no conflict of interest.
References
- Miao, Z.; Baleˇzentis, T.; Shao, S.; Chang, D. Energy use, industrial soot and vehicle exhaust pollution—China’s regional air pollution recognition, performance decomposition and governance. Energy Econ. 2019, 83, 501–514. [Google Scholar] [CrossRef]
- Peng, W.; Yuan, J.; Zhao, Y.; Lin, M.; Zhang, Q.; Victor, D.G. Air quality and climate benefits of long-distance electricity transmission in China. Environ. Res. Lett. 2017, 12. [Google Scholar] [CrossRef]
- Porter, M.E.; Van, C. Toward a New Conception of the Environment-Competitiveness Relationship. J. Econ. Perspect. 1995, 9, 97–118. [Google Scholar] [CrossRef]
- Chen, S.; Li, Y.; Yao, Q. The health costs of the industrial leap forward in China: Evidence from the sulfur dioxide emissions of coal-fired power stations. China Econ. Rev. 2018, 49, 68–83. [Google Scholar] [CrossRef]
- Jia, Z.; Lin, B. Rethinking the Choice of Carbon Tax and Carbon Trading in China. Technol. Forecast. Soc. Change 2020, 159, 120187. [Google Scholar] [CrossRef]
- Yang, L.; Yao, Y.; Zhang, J.; Zhang, X.; McAlinden, K.J. A CGE Analysis of Carbon Market Impact on CO2 Emission Reduction in China: A Technology-Led Approach. Nat. Hazards 2016, 81, 1107–1128. [Google Scholar] [CrossRef]
- Zhang, Y.; Liang, T.; Jin, Y.; Shen, B. The Impact of Carbon Trading on Economic Output and Carbon Emissions Reduction in China’s Industrial Sectors. Appl. Energy 2020, 260, 114290. [Google Scholar] [CrossRef]
- Zhang, W.; Li, J.; Li, G.; Guo, S. Emission Reduction Effect and Carbon Market Efficiency of Carbon Emissions Trading Policy in China. Energy 2020, 196, 117117. [Google Scholar] [CrossRef]
- Zhang, H.; Zhang, B. The Unintended Impact of Carbon Trading of China’s Power Sector. Energy Policy 2020, 147, 111876. [Google Scholar] [CrossRef]
- Zhang, Y.; Li, S.; Luo, T.; Gao, J. The Effect of Emission Trading Policy on Carbon Emission Reduction: Evidence from an Integrated Study of Pilot Regions in China. J. Clean. Prod. 2020, 265, 121843. [Google Scholar] [CrossRef]
- Yang, X.; Jiang, P.; Pan, Y. Does China’s Carbon Emission Trading Policy Have an Employment Double Dividend and a Porter Effect? Energy Policy 2020, 142, 111492. [Google Scholar] [CrossRef]
- Zhang, S.; Wang, Y.; Hao, Y.; Liu, Z. Shooting Two Hawks with One Arrow: Could China’s Emission Trading Scheme Promote Green Development Efficiency and Regional Carbon Equality? Energy Econ. 2021, 101, 105412. [Google Scholar] [CrossRef]
- Oestreich, A.M.; Tsiakas, I. Carbon Emissions and Stock Returns: Evidence from the EU Emissions Trading Scheme. J. Bank. Financ. 2015, 58, 294–308. [Google Scholar] [CrossRef]
- Chang, Y.; Wang, N. Environmental regulations and emissions trading in China. Energy Policy 2010, 38, 3356–3364. [Google Scholar] [CrossRef]
- Zhang, Y.J.; Wang, W. How does China’s carbon emissions trading (CET) policy affect the investment of CET-covered enterprises? Energy Econ. 2021, 98, 105224. [Google Scholar] [CrossRef]
- Chen, W.; Xu, R. Clean coal technology development in China. Energy Pol. 2010, 38, 2123–2130. [Google Scholar] [CrossRef]
- Lanoie, P. Environmental policy, innovation and performance: New insights on Porter hypothesis. J. Econ. Manag. Strategy 2011, 20, 803–842. [Google Scholar] [CrossRef]
- Qi, S.Z.; Zhou, C.B.; Li, K.; Tang, S.Y. Influence of a pilot carbon trading policy on enterprises’ low-carbon innovation in China. Clim. Policy 2021, 21, 318–336. [Google Scholar] [CrossRef]
- Liu, G.; Chen, Y.; He, H. China’s environmental challenges going rural and west. Environ. Plan. 2012, 44, 1657–1660. [Google Scholar] [CrossRef]
- Liu, G.; Müller, D.B. Mapping the global journey of anthropogenic aluminum: A trade-linked multilevel material flow analysis. Environ. Sci. Technol. 2013, 47, 11873–11881. [Google Scholar] [CrossRef]
- Wang, K.; Zhang, X.; Yu, X.; Wei, Y.M.; Wang, B. Emissions trading and abatement cost savings: An estimation of China’s thermal power industry. Renew. Sustain. Energy Rev. 2016, 65, 1005–1017. [Google Scholar] [CrossRef]
- Lin, B.; Jia, Z. Why do we suggest small sectoral coverage in China’s carbon trading market? J. Clean. Prod. 2020, 257, 120557. [Google Scholar] [CrossRef]
- Calel, R.; Dechezlepretre, A. Environmental Policy and Directed Technological Change: Evidence from the European Carbon Market. Rev. Econ. Stat. 2016, 98, 173–191. [Google Scholar] [CrossRef]
- Niu, B.; Xie, F.; Mu, Z.; Ji, P. Multinational firms’ local sourcing strategies considering unreliable supply and environmental sustainability. Resour. Conserv. Recycl. 2020, 155, 104648. [Google Scholar] [CrossRef]
- Lanjouw, J.O.; Mody, A. Innovation and the international diffusion of environmentally responsive technology. Res. Policy 1996, 25, 549–571. [Google Scholar] [CrossRef]
- Wu, G.; Baleˇzentis, T.; Sun, C.; Xu, S. Source control or end-of-pipe control: Mitigating air pollution at the regional level from the perspective of the Total Factor Productivity change decomposition. Energy Pol. 2019, 129, 1227–1239. [Google Scholar] [CrossRef]
- Vera, P.; Federico, D. Carbon emissions and the cost of debt in the eurozone: The role of public policies, climate-related disclosure and corporate governance. Bus. Strategy Environ. 2020, 29, 2953–2972. [Google Scholar] [CrossRef]
- Jaffe, R.B. Is the academic physician-scientist an oxymoron in contemporary obstetrics and gynecology? Am. J. Obstet. Gynecol. 1997, 177, 892–893. [Google Scholar] [CrossRef]
- Richandson, A.J.; Welker, M. Social Disclosure, Financial Disclosure and the Cost of Equity Capital. J. Account. Organ. Soc. 2001, 26, 597–616. [Google Scholar] [CrossRef]
- Plumlee, M.; Brown, D.; Hayes, R.M.; Marshall, R.S. Voluntary environmental disclosure quality and firm value: Further evidence. J. Account. Public Policy 2015, 34, 336–361. [Google Scholar] [CrossRef]
- Rankin, M.; Windsor, C.; Wahyuni, D. An Investigation of Voluntary Corporate Greenhouse Gas Emissions Reporting in a Market Governance System: Australian Evidence. Account. Audit. Account. J. 2011, 24, 1037–1070. [Google Scholar] [CrossRef]
- Li, Y.; Su, Z.; Qiao, Q.; Hu, X.; Wan, S.; Zhao, R. Integrated assessment of process pollution prevention and end-of-pipe control in secondary lead smelting. Resour. Conserv. Recycl. 2017, 117, 1–11. [Google Scholar] [CrossRef]
- Hang, Y.; Wang, Q.; Wang, Y.; Su, B.; Zhou, D. Industrial SO2 emissions treatment in China: A temporal-spatial whole process decomposition analysis. J. Environ. Manag. 2019, 243, 419–434. [Google Scholar] [CrossRef] [PubMed]
- Chen, G.; Firth, M.; Xin, Y.; Xu, L. Control Transfers, Privatization, and Corporate Performance: Efficiency Gains in China’s Listed Companies. J. Financ. Quant. Anal. 2008, 43, 161–190. [Google Scholar] [CrossRef]
- Franks, J.; Mayer, C. Ownership and Control of German Corporations. Rev. Financ. Stud. 2001, 14, 943–977. [Google Scholar] [CrossRef]
- Dai, Y.; Li, N.; Gu, R.; Zhu, X. Can China’s Carbon Emissions Trading Rights Mechanism Transform its Manufacturing Industry? Based on the Perspective of Enterprise Behavior. Sustainability 2018, 10, 2421. [Google Scholar] [CrossRef]
- Testa, F.; Iraldo, F.; Frey, M. The effect of environmental regulation on firms’ competitive performance: The case of the building & construction sector in some EU regions. J. Environ. Manag. 2011, 92, 2136–2144. [Google Scholar] [CrossRef]
Publisher’s Note: MDPI stays neutral with regard to jurisdictional claims in published maps and institutional affiliations. |
© 2022 by the authors. Licensee MDPI, Basel, Switzerland. This article is an open access article distributed under the terms and conditions of the Creative Commons Attribution (CC BY) license (https://creativecommons.org/licenses/by/4.0/).