Article

Exploration and Prediction of the Elderly Travel Behavior Based on a Novel GR-GA-BP Hybrid Model

1
Department of Transportation, Beijing University of Civil Engineering and Architecture, Beijing 100044, China
2
School of Traffic and Transportation Engineering, Central South University, Changsha 410075, China
3
China Academy of Urban Planning Design, Beijing 100044, China
*
Author to whom correspondence should be addressed.
Sustainability 2022, 14(20), 13448; https://doi.org/10.3390/su142013448
Submission received: 24 September 2022 / Revised: 7 October 2022 / Accepted: 10 October 2022 / Published: 18 October 2022
(This article belongs to the Special Issue Strategies of Sustainable Transportation in Urban Planning)

Abstract

:
With the aging trend in megacities, the travel behaviors of the elderly have attracted much attention. Accurate prediction of the travel behaviors of the elderly is a key link to meet the traffic demand and public facilities’ optimization. The aim of this paper was to explore the link between the travel characteristics and variables of the daily activities of the elderly. Based on a stratified sampling survey, the internal relationship between the characteristics of the elderly and their travel behavior was studied and discussed in this work. A novel grey correlation degree–genetic algorithm–back propagation (GR-GA-BP) hybrid model was proposed to predict the travel behavior of the elderly. Then, a grey correlation degree module was established and used to analyze the correlation between the individual elderly characteristics and their travel behavior. The results showed the following: (1) Both the times of weekly trips (y1) and average round-trip travel time (y2) were highly sensitive to the external environment, especially buses, subway stations, and recreational facilities. The size of the family was less sensitive to the travel behavior. (2) Referring to prediction of the times of weekly trips, the MRE of the proposed model was 23.12%, which was 15.22% less than the baseline models. (3) In terms of the prediction of round-trip travel time, the MRE of the proposed model was 7.13%, which was 14.00–69.41% lower than the baseline models. (4) The times of trips per week were 3.5. In summary, this paper provides technical support for formulating traffic demand policies and facilitates the configuration of cities for an aging society.

1. Introduction

Population aging has become a common, notable, and widely concerned hot spots in many countries. Research has shown that the number of elderly people will be 2.0 billion by 2050. About 80% of them live in developing countries [1]. Since 2020, China’s over-65 population has been up to 191 million, accounting for 13.5% of the total population. There is one Chinese elderly person for every four elderly persons in the world. It is estimated that China’s over-65 population will reach a peak of 425 million in 2057, accounting for 32.9–37.6% of the total population. Since China turned into an aging society in 2001, it has taken 21 years for China to reach a high level of aging. This time span is much shorter than that of major European countries. For example, the time span is 126 years for France, 46 years for Britain, and 40 years in Germany. The problems of an aging society and the empty nesting caused by the rapid aging of the population have become prominent. In 2020, China’s 80-and-over population was 36.6 million, which is expected to be 159 million by 2050. With the improvement in people’s living standards, the significant improvement in the health level of retired elderly people, and the development of the social economy, elderly people continue to pursue the improvement in their own living standards and the demand for travel and participation in recreational activities has increased, resulting in elderly people’s participation in social activities becoming more frequent; thus, the demand for transportation will also become greater. At the same time, an aging society presents higher requirements for the urban transportation system.
Therefore, the research on the travel characteristics of the elderly has now received extensive attention. The travel characteristics mainly include the travel mode, travel purpose, travel frequency, travel distance, and so on [2,3,4]. Previous studies on travel characteristics mostly focused on the influence of internal factors such as personal and family attributes on the elderly, but ignored the influence of external environmental factors. Moreover, other studies have been carried out based on the questionnaire survey method, AFC data, and mobile signal data. It has been demonstrated that these models are highly important and more accurate [5,6]. However, considering the difficulty of obtaining samples and the multidimensional characteristics, mining different dimensions of the factors with strong data is a very challenging work, which will directly affect the prediction of the travel behavior.
In this paper, the data of the elderly in different areas of Beijing were collected using a stratified sampling survey. The impact of the external environment on the travel behavior of the elderly was considered in the study. Some typical travel characteristics of the elderly were collected through a questionnaire survey, such as the travel frequency, walking time, personal characteristics, family composition, and external environmental factors. The correlation among all various factors affecting the travel behavior of the elderly was explored by the GR model. Finally, the grey correlation degree–genetic algorithm–back propagation (GR-GA-BP) model was proposed to predict the travel behavior of the elderly based on these significant features.
The rest of this paper is divided into several sections. The travel characteristics of the elderly in recent years are introduced in Section 2. A novel GR-GA-BP model is proposed in Section 3, which was used to predict the travel behavior of elderly people. The result and discussion of the experiments are given in Section 4. The last section is the summary of the research work.
The main contributions of this work are summarized as follows:
(1) A stratified sampling survey was carried out among the elderly population in the Beijing urban area to collect the travel data of the elderly population.
(2) A grey correlation degree (GR) model was established to analyze the correlation between elderly individual characteristics and travel behavior in the context of unidentified problems with poor data.
(3) A novel GR-GA-BP model is proposed to predict the travel behavior of the elderly, including the prediction of the times of weekly trips and the round-trip travel time.

2. Literature Review

Many research works have made considerable efforts in the study of the travel behavior of the elderly. The related research on the elderly mainly focused on the spatial–temporal analysis of the travel behavior and characteristics [1,7,8], the travel mode choice and factors affecting it [2,3,9], the travel data collection methods [10], the prediction of the travel generation [11], and public transport usage [12].
The travel behavior and characteristics of the elderly now are receiving more attention. More in-depth spatial–temporal analysis of the elderly’s activity and travel behaviors has been conducted based on mobile phone data and OD survey data in order to draw conclusions about sustainable transportation for the elderly. Locational-trajectory-based mobile phone data differ from household travel survey data, which can capture movements comprehensively [7]. The residents’ attributes were obtained at the same time as the residents’ travel characteristics’ survey [10]. The purpose of these surveys is to understand the impact of various factors on travel characteristics, and thus to predict the future traffic demand of residents. Shi et al. discussed the temporal dynamic mobility characteristics of the elderly by bus smart card data [13]. Szeto et al. visualized and uncovered the spatiotemporal travel characteristics of the elderly, and gave policy insights on the promotion of age-friendly public transport systems [1]. Zhang et al. analyzed the characteristics of the elderly’s daily travel behavior using a space–time cube. The results indicated that the elderly mainly had six types of daily travel behaviors [14]. Choo and Kim investigated the travel characteristics of the elderly in urban and rural areas and found that the main regulators were the bus operation area, the number of bus operation lines, the household registration and the average monthly income of the family [15].
The analysis of influencing factors is the basis of the travel prediction. Different attributes of influencing factors play an important role in the mode choice of the elderly travel. The number of schools, hospitals, supermarkets, squares, parks, and scenic spots near metro stations were reported to significantly increase the proportion of the elderly metro usage [10,16] Smith and Sylvestre proposed multiple regression models for the rapid suburbanization of the elderly in the North American metropolitan area. The results showed that the interpretation level of travel frequency provided by personal attributes and family attributes changed according to the land attributes of the destination [11]. Schmöcker et al. estimated the travel characteristics of the disabled and the elderly in London, and proposed an impact model of factors such as family structure, income, car ownership, driving license and walking difficulties on travel purpose, travel frequency, and travel length [17]. Jeong and Kim proposed a logit model to solve the basic modeling problem. The decision interaction among many selection dimensions of the huge activity plan selection set was regarded as a series of travel and family activity events [18]. Titheridge used GIS tools to simulate the microenvironment that affected the mobility of the elderly [19]. Dargay and Clark analyzed the influencing factors of long-distance travel in the UK based on the travel survey data between 1995 and 2006. The estimated model indicated that the distance of long-distance travel was a function of income, gender, age, employment status, family characteristics, residential area, municipal scale, residential type, and length of time living in the area [20]. Dong proposed a structural equation model to analyze the sensitivity of travel characteristic parameters. The results showed that the difference between personal and family attributes was not significantly sensitive to the travel behavior of the elderly. Moreover, travel for entertainment had a strong correlation with buses, travel distance, and longer activity time, while travel for shopping had a close correlation with short travel distance and travel time. In addition, the departure time of going to the hospital and picking up the children was not sensitive to travel purposes, and the activity duration was highly sensitive to the travel distance, travel time, and travel mode [21].
The choice of travel mode has a great impact on the travel distance and travel preference of the elderly. Du et.al. investigated the travel characteristics and influential factors of travel mode choice for healthcare activity by the elderly in urban areas and suburbs [22]. Chen studied the travel characteristics of the elderly in Taiwan through a questionnaire. The results showed that walking was the main travel mode of the elderly, and thus it was suggested to set up public transport stations near hospitals and clinics [23]. The changes in the total length of walkways and the provision of mobility aid facilities would be efficient in promoting and the mode shift of travel behaviors. More comfortable walkways would stimulate users’ willingness to shift departure time from peak hours [9]. The public transport mode preference of elderly was discussed in some research. These works identified the dependency of trip duration, travel times, geographical areas, and public transport over transport mode preference of the elderly. Different travel purposes lead to different preferences for transportation mode selection. Managers of relevant departments can modify the plan of public transport according to these research works, in order to help the elderly population easily gain access to these public facilities.
The grey correlation degree (GR) module used grey correlation modeling for the correlation analysis of travel modes and their influence factors based on a survey on relevant properties of travel modes, in combination with the calculation of indicators that have influence on travel modes [24]. A genetic algorithm (GA) module was applied in previous study for the optimization of travel paths [25]. The back propagation (BP) neural network module is easily applicable with their higher capability to identify nonlinear relationships between inputs and designated outputs to predict choice behaviors [26].
The existing models mainly analyze the relationship between the travel characteristics and their influencing factors, so as to predict the travel demand of the elderly. However, insufficient in-depth data mining and the innovation of prediction methods will inevitably lead to model errors and the lack of generalization ability of the model. The next part of this paper mainly elaborates the methods of data processing, analysis and model utilization.

3. Study Sites and Data Collection

To study the relationship between the influencing factors and travel characteristics of the elderly in Beijing, 16 influencing factors were divided into personal, family and external environment attributes as shown in Table 1. The effect of influencing factors on the times of weekly trips and the average round-trip travel time was estimated. Stratified sampling and a questionnaire survey were carried out in the urban area of Beijing.
Considering the differences between residential and commercial areas, four places were selected to be the questionnaire points of Beijing central area. The average distance among those survey sites was 9 km, of which the maximum distance was 12 km and the minimum 6 km. The questionnaire was issued during the peak travel time of the elderly, between 8:00 and 10:00 in the morning and 15:00 and 17:00 in the afternoon [8]. A total of 3250 valid data samples were collected and analyzed.
For the personal attributes regarding the travel characteristics of the elderly, six variables (spouse, gender, age, older singletons, driver licenses or monthly pass) were included. People over 60 were defined as the elderly. The age structure of the elderly from the 3250 samples is shown in Figure 1. The age of the main constituent population in the samples ranged between 65–69 years, accounting for 32% of all. People aged between 60–64 and 70–74 took up 26.5% and 19.7%, respectively. The proportion of people aged between 75–79 and 80–84 was almost the same (ca. 10%). The people over 85 years old only accounted for 2.5%.
The demographic structure and vehicle ownership were treated as the family attributes since they might have an impact on the travel of the elderly. At the level of family demographics, the elderly would pick up and drop off the grandchildren to and from school for their education. When there were many family members, the elderly might visit the vegetable market frequently. As with vehicle ownership, owning bicycle or tricycle would greatly reduce the travel time of the elderly. Finally, five variables were selected, which were have children, size of family, have cars, have bikes, have electric bike and tricycle.
The impact of the surrounding infrastructure on the travel characteristics for the elderly was considered as the external environmental attributes. Usually, the serving range of bus and subway stations was 800 m. When travel distance was long, most elderly people would choose public transportation. The range of external environmental attributes was considered within 800 m. Five variables were selected, which were bus station, subway station, mall, old town and recreational facilities.
As shown in Figure 2 and Figure 3, the round-trip travel time of the elderly followed a normal distribution, with an average time of 51.76 min. As seen from the Figure 2 and Figure 3, the whole sample fluctuated near the trend line of normal distribution except for some samples of 20 min and some of more than 80 min. Similarly, the number of trips per week followed lognormal distribution or normal distribution as shown in Figure 4 and Figure 5. The average time of the samples was 3.65, indicating the surveyed elderly traveled 3.65 times a week on average.
The travel attribution factors of the elderly are shown in Table 1. These factors were divided into three categories with 16 independent variables. The grey correlation degree model was implemented. The correlations of each factor with the travel characteristics are shown in Table 2.
Based on Table 1 and Table 2, the following conclusions were drawn.
(1) Most of the dependent variables were more closely correlated with y1 than y2, which indicated that times of weekly trips were more sensitive to the attributes including individuals, families, and external environment compared with average round trip travel time.
(2) Both y1 and y2 were most correlated with the influencing factor x12, the correlation coefficients of which were 0.960 and 0.885, respectively. This indicated that public transport by bus was the main travel mode for the elderly in mega cities.
(3) The influencing factor x8 had the minimum correlation coefficients with y1 (0.618) and y2 (0.632), indicating that the size of family had little effect on both y1 and y2.
(4) The x6 among the individual attributes (x1–x6) was the main factor affecting y1, followed by gender and age. In contrast, the variable x1 had a much lower effect. The variables x7 and x10 of family attributes both played an important role in regulating y1. The correlation coefficient between y1 and all external environment attributes (x12–x15) was greater than 0.95, indicating that y1 was significantly affected by the external environment.
(5) The variables x5, x2 and x3 had a greater influence on y2 than other variables among individual attributes, while the variables x7 and x10 of family attributes both had a great impact on y2. The average correlation coefficient between external environment attributes (x12–x15) was 0.88, indicating that the average travel time of the elderly was significantly affected by the external environment, such as accessibility of the subway, bus, and mall.
The data collected and analyzed were used as the input data for the prediction model described in the next section. According to the analysis above, the factors with correlation coefficients greater than 0.90 were selected as the influencing factors of times of weekly trips, and the factors with the correlation coefficients lying between 0.90 and 0.85 were selected as the influencing factors of the round-trip travel time. Finally, the major influencing factors of each travel characteristics were determined as listed in Table 3.

4. Model Framework

4.1. GR-GA-BP Hybrid Model

In general, model fusion more or less improves the final predictive power and is generally no worse than the optimal submodule. The basic theoretical assumption is that different submodules behave differently on different data and that we can combine their strengths to obtain a model that is “accurate” in all respects. Although it is unrealistic to assume that the errors of the submodules are independent of each other, an appropriate combination of methods could still be used to improve the results by exploiting the strengths of each submodule. In this paper, the GR-GA-BP hybrid model was adopted to predict the travel behavior of the elderly. The model consists of three parts, including the grey correlation degree (GR) module for data analysis, the genetic algorithm (GA) module for the optimal selection of the initial and threshold values, and the back propagation (BP) neural network module for travel behavior prediction. Detailed descriptions for each part of the model could be found in the subsequent sections. The overall framework of the model is shown in Figure 6.

4.2. Grey Correlation Degree (GR) Module

The GR is a grey-system-theory-based model aiming to address unascertained problems with poor data. Considering the uncertainty and randomness of the factors affecting the travel decision of the elderly, it would be inaccurate to analyze the travel characteristics of the elderly based on a small sample size. The correlation degree of indexes between different systems could be calculated by selecting the grey correlation model. The advantage of GR is that there is no specific requirement for sample size and data distribution. Therefore, GR was chosen to analyze the main stress factors that affected the travel characteristics of the elderly based on the available data with a small sample size [27].
The whole process included four stages.
(1)
Determining the analysis sequence
It was required to find the original sequence of the dependent variable reference sequence and the independent variable comparative sequence. The data sequence reflecting the characteristics of the system behavior was called the dependent variable reference sequence. The data sequence affecting the system behavior was called the independent variable comparison sequence. The specific formula is as shown in Equation (1), where X t is the vector after the initial value, and x i 1 is the first element of the vector.
(2)
Dimensionless and standardization of reference and comparison sequence
Different types of data need dimensionless processing and fusion to make the indicators comparable. The dimensionless methods mainly include the equalization method and initialization method. In this paper, the initialization method was selected for the dimensionless processing. The reference sequence difference was calculated as the absolute difference of the comparative sequence and reference sequence after standardization, as shown in Equation (2), where x 0 k is the reference sequence, x i k is the comparison sequence, and X t denotes the value of t at factor k .
(3)
Calculating relative coefficient
The specific formula of the relative coefficient is shown in Equation (3), where m =   m i n t m i n k Δ t k is the minimum difference of two levels, M = m a x i m a x k Δ i k is the maximum difference of two levels, ξ is the resolution coefficient value [0,1], and the general value is 0.5.
(4)
Calculating correlation coefficient
Since there were multiple levels of influence factors which existed, the correlation coefficient reflected the degree of correlation between the reference sequence and the comparative sequence. Each layer of the reference sequence was calculated together with other comparative sequences to form an association matrix as shown in Equation (4), where γ 0 i k is the correlation coefficient. The relevant features obtained in the GR model were used as the input weights of the BP neural network.
X t = X t / x i 1 = x i 1 x i 2 . x i n
Δ i k = x 0 k x i k , Δ t Δ , 1 , Δ , n
γ 0 i k = m + ξ M Λ k + E M
γ 0 i = 1 n k = 1 n γ 0 i k

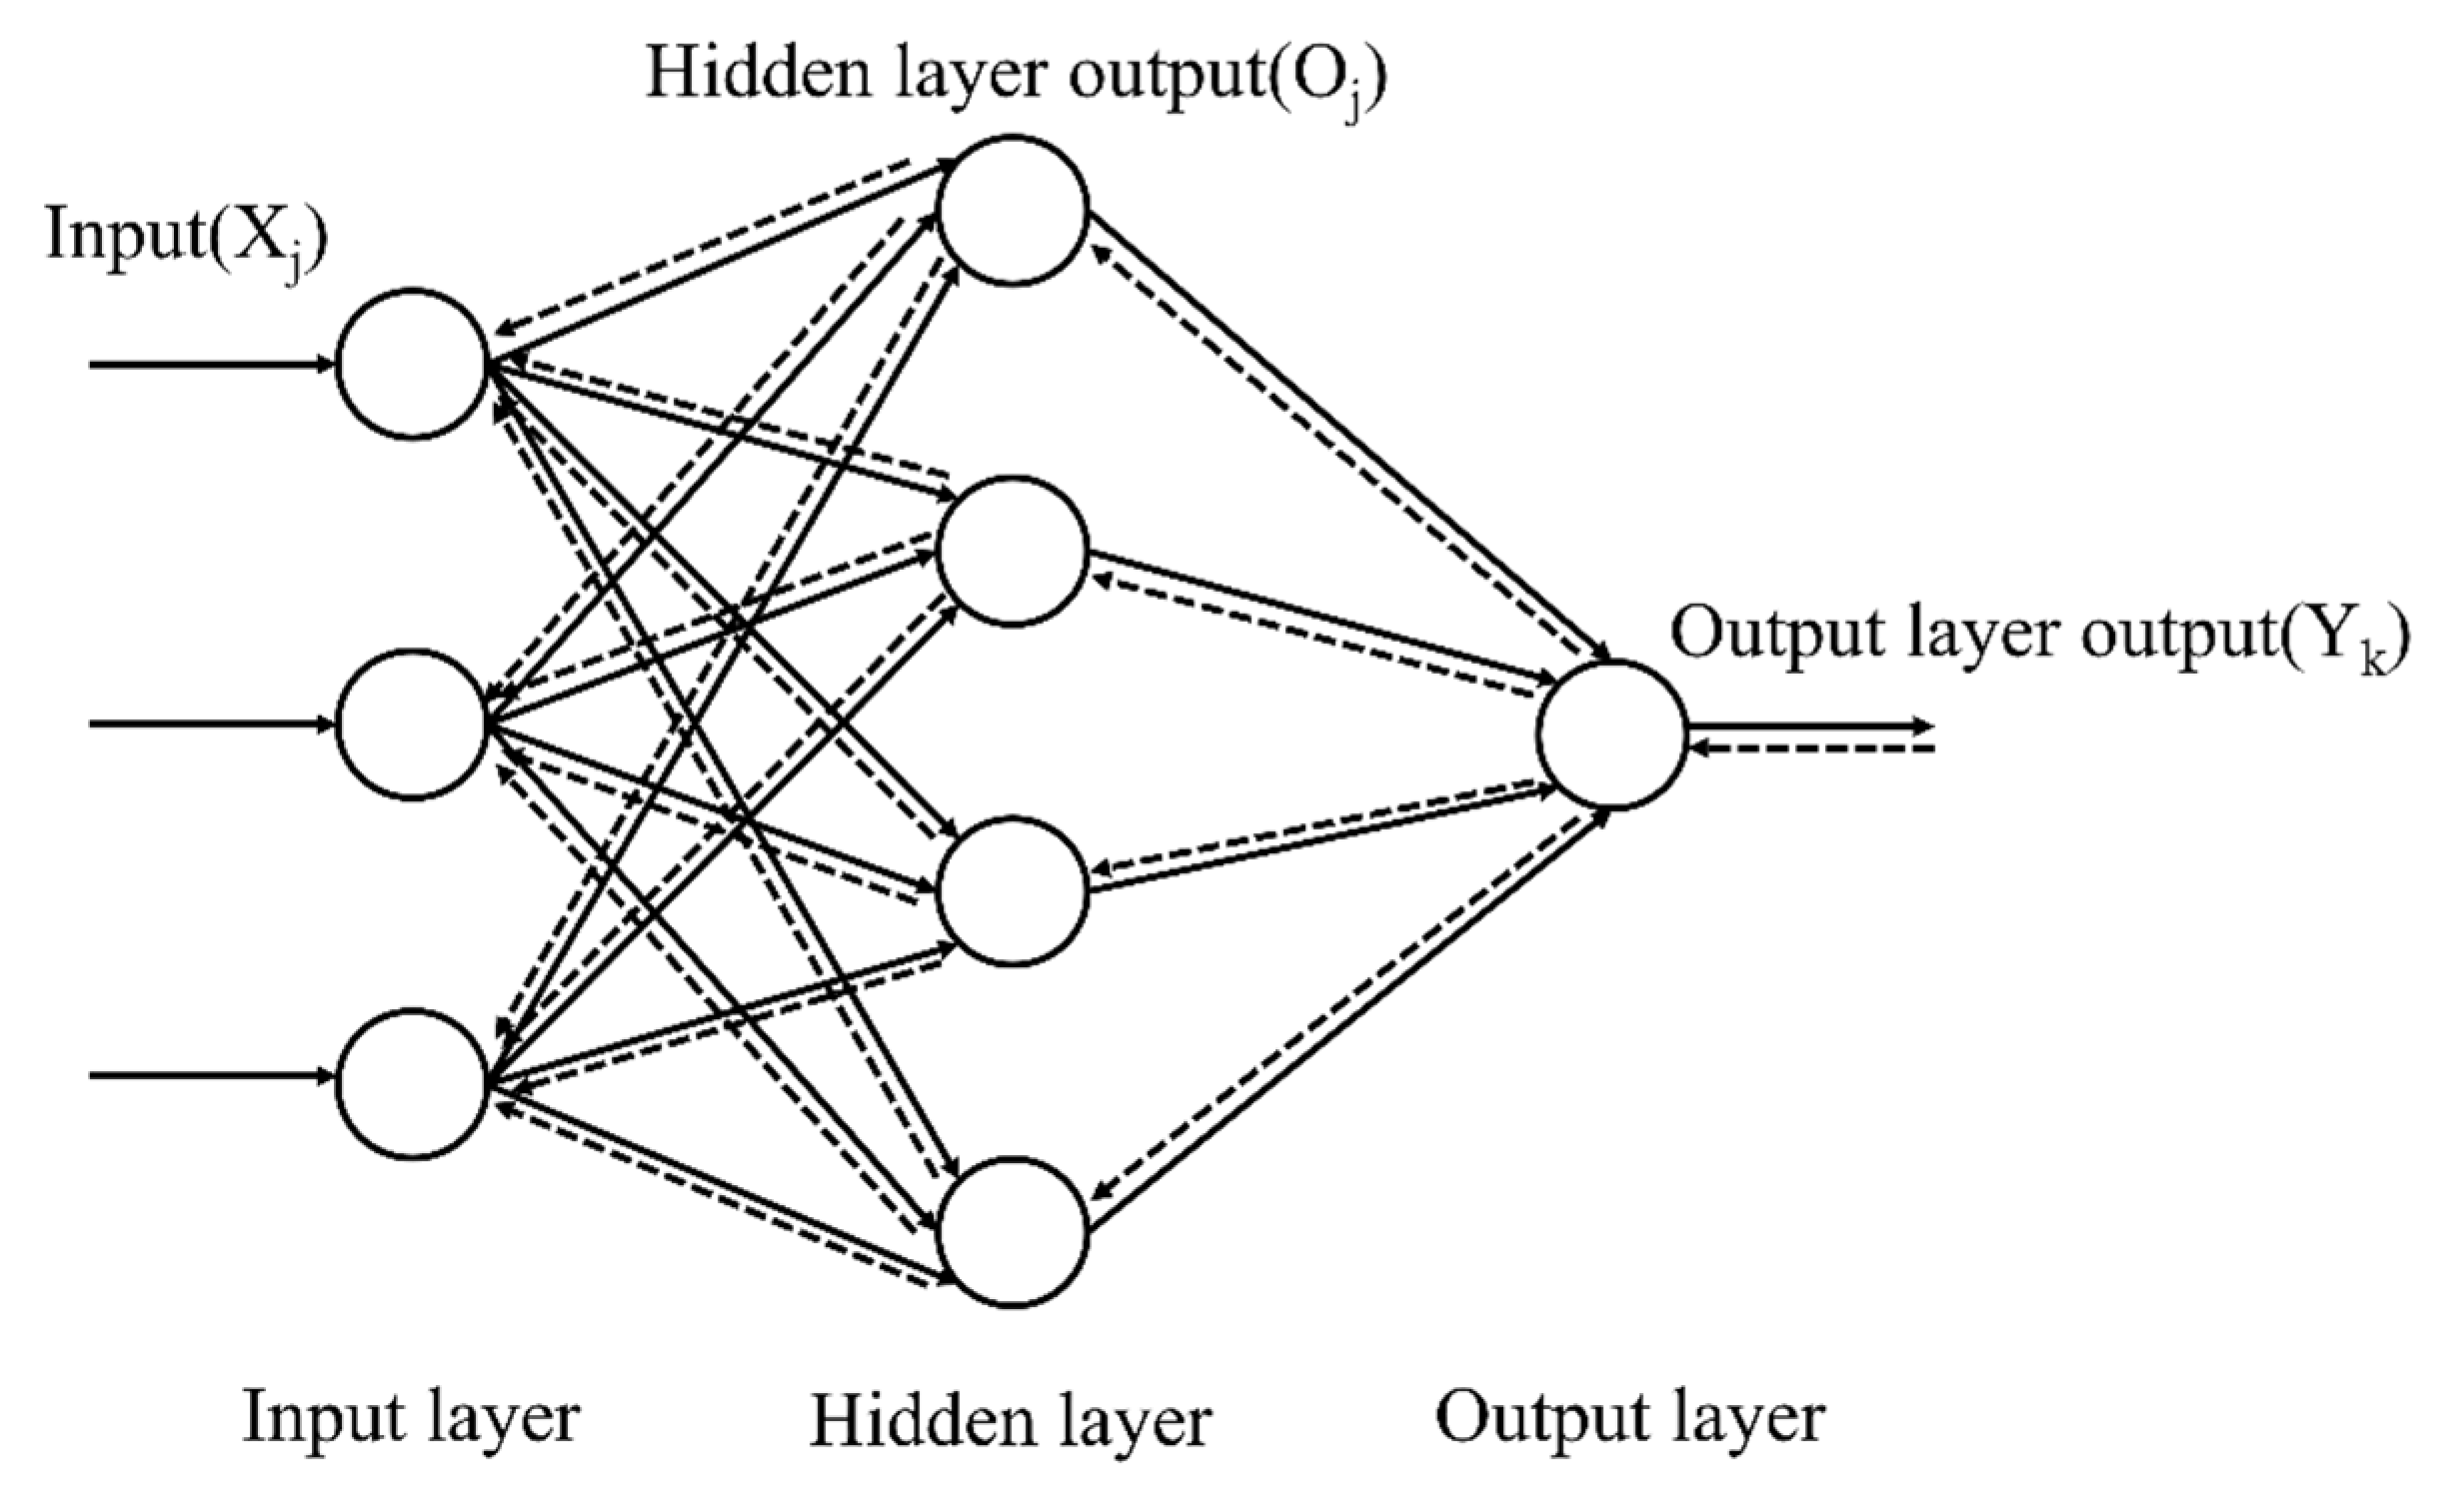
4.3. Back Propagation (BP) Neural Network Module

The BP neural network is currently one of the most widely used artificial neural network structures. It has the advantages of high classification accuracy, fast self-learning speed, and outstanding parallelism. The BP model consists of two core parts, which are the forward transmission of information and the backpropagation of error. The topological structure of the network is shown in Figure 7. Taking a three-layer neural network for example, it corresponds to a (3,4,1) neural network.
(1)
Forward information transfer algorithm.
The weight of each layer was relative to the output of the upper layer by a linear function and was passed to the next layer by the transfer function (Equations (5)–(8)).
Z 2 = i = 1 n ω i j x i
a 2 = f x = 1 1 + e Z 2
Z 3 = j = 1 m ω j k a j
a 3 = f x = 1 1 + e Z 3
where x i is the input value of the i-th neuron in the input layer, ω i j represents the connection weight of the i-th neuron in the input layer and the j-th neuron in the hidden layer, n is the number of neurons in the input layer, and Z 2 is the input of the hidden layer. The f x is the transfer function, and a 2 is the output of the hidden layer. The a j is the output of the j-th neuron in the hidden layer, ω j k is the connection weight of the j-th neuron in the hidden layer and the k-th neuron in the output layer, and m is the number of neurons in the hidden layer. The a 3 is the output of the output layer, which was the predicted value.
(2)
Error backpropagation algorithm
Mean square error (MSE) was used as a cost function in error backpropagation. Through the error signal, the error was transferred from the output layer to the input layer, and the weight was updated by the steepest gradient descent method (Equations (9)–(11)).
E = 1 2 k = 1 M a 3 O k 2
ω j k : = ω j k + μ O k a 3 a 3 1 a 3 a 2
ω i j : = ω i j + μ O k a 3 a 3 1 a 3 a 2 ω j k 1 a 2
where O k is the expected output of the corresponding input, M is the number of samples, E represents the cost function, μ is the learning rate, and X denotes the input vector of the input layer.

4.4. Genetic Algorithm (GA) Module

In the traditional BP neural network, the initial weights and thresholds were randomly generated. The initial value had a great influence on the calculation result. Thus, the result often fell into a local minimum rather than a global minimum, which would lead to the distortion of the prediction result. In addition, the convergence speed of the BP neural network is usually slow. The GA method was used to find an optimal initial weight and a threshold value for the model, so that the model could converge in the direction of minimum value [28].
The GA is an evolutionary and heuristic search algorithm for solving optimization in computational mathematics with an iterative process of survival and detection. It consists of four operators, including a fitness function, selection operation, crossover operation, and mutation operation. The coding tandem population formed by optimization parameters was introduced in this study. According to the selected fitness function and through selection, crossover, and variation in genetics, the individuals with good fitness values were retained and the individuals with poor fitness were eliminated. The new population not only inherited the information of the previous generation but also exceeded the previous generation. The whole process was repeated until conditions were met. The calculation formulas of the model are shown in the equations below (Equations (12)–(17)).
F = k i = 1 n a b s y i O i 2
f i = k / F i
p i = f 1 j = 1 N f j
a k j = a k j 1 b + a l j b
a l j = a l j 1 b + a k j b
a i j = { a i j + a i j a m a x f g r > 0.5 a i j + a m i n a i j f g r 0.5
f g = r 2 1 g / G m a x 2
where n denotes the number of network output nodes, and y i is the expected output of the i-th node. O i is the corresponding predicted output; K is the coefficient. F i represents the fitness of the individual; N is the number of individuals in the population. b denotes a random number between [0,1], a m a x is the upper bound of the gene, and a m i n is the lower bound of the gene. r 2 is a random number, g is the current iteration number, G m a x is the maximum evolution number, and r denotes a random number between [0,1].

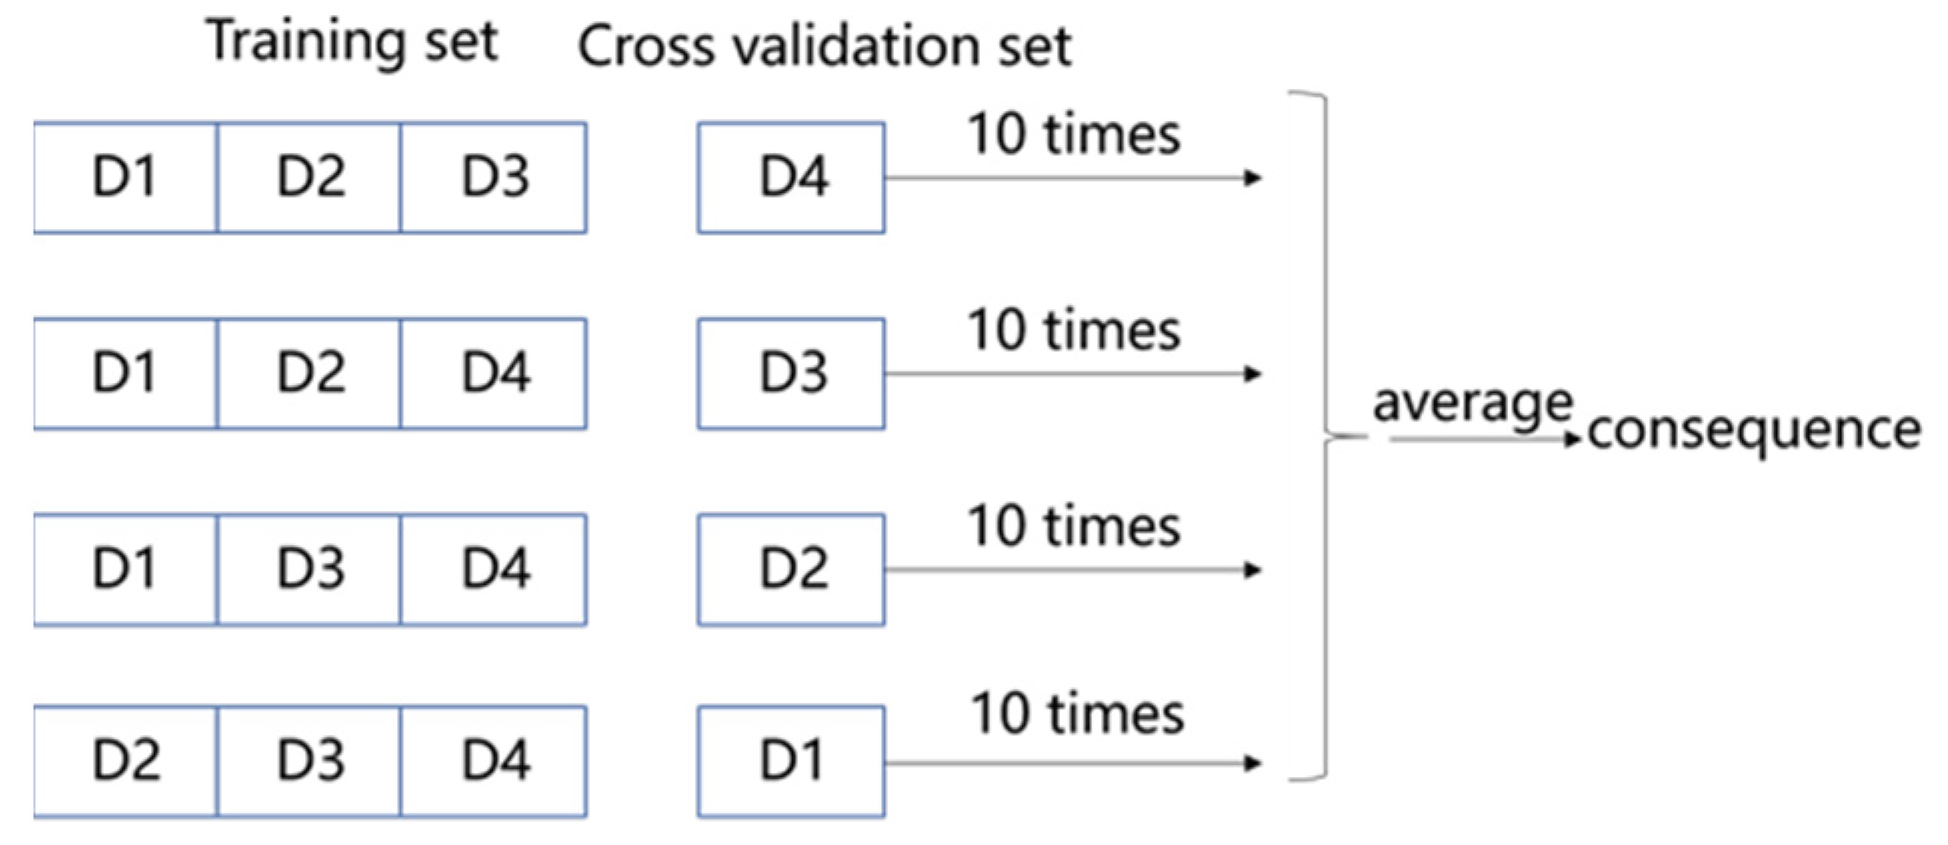
4.5. Cross-Validation

The selection of parameters was involved during the construction of the prediction model. If the simulation was not carried out in a fixed scene when the model was running, it would inevitably lead to the randomness of the results. However, it would be difficult to prove the generalization ability of the prediction model if the simulation was carried out in a fixed scene. Therefore, from the perspective of the accuracy and generalization ability of the prediction model, the cross-validation method was considered in this study. On one hand, the appropriate parameters of the prediction model were determined through multiple groups of experiments to improve the accuracy of the model. On the other hand, the generalization ability of the model was tested by taking the average value of the results from multiple groups of experiments [29].
The samples with m data sets were divided into a training set, a cross-validation set, and a test set (shown in Figure 8). First, the set of training and cross-validation was discussed and divided into n groups according to the number of equal data bars. One group of data was taken out from each group of experiments as the cross-validation set for experiments, and the remaining n 1 group was the training set. A total of n groups of experiments were carried out. Each group of experiments took the average value of K times, which was called K times and n-fold cross-validation.

5. Experimental Results and Discussions

5.1. Prediction Experiment of Travel Characteristics

The main influencing factors of travel characteristics were determined by data mining based on the grey correlation degree. In this section, 3250 data samples were divided into a training set, a cross-validation set, and a test set with a ratio of 3:1:1. Cross-validation was carried out by a cross-validation set and training set. The prediction errors of the proposed model were obtained and compared with four other different models including a linear regression model, GR-BP model, GA-BP model and BP model. The indexes of MSE and MRE were used to evaluate the models as shown in Equations (1) and (2). Moreover, the complexity of the training time evaluation model was introduced.
m s e = 1 n i = 1 n α i β i 2
m r e = 1 n i = 1 n α i β i β i
where n is the amount of data in the cross-validation set, α i is the predicted output value, and β i is the expected output value.

5.1.1. Prediction Analysis of Times of Weekly Trips

The input vector was the influencing factor of the times of weekly trips, and the output value was the corresponding times of weekly trips. Through cross-validation and grid search, the optimal parameters for the GR-GA-BP model were determined as shown in Table 4. By comparing with the corresponding training error results of all five types of models, the generalization ability of the proposed model is shown in Table 5. The predicted and observed values in the test set are shown in Figure 9. The variation in squared error and evolution times in the training set is shown in Figure 10.
According to Table 3, the goodness of fit of the GR-GA-BP model was 0.98897. The MRE of the proposed model was 23.12%, which was slightly higher than that of the GA-BP model (27.27%), and much higher than those of other models. The genetic algorithm was applied to select the initial weights and thresholds to improve the calculation efficiency. In contrast, the calculation time of the proposed model was significantly longer than the other four models. However, training time is less important than accuracy regarding the data with a small sample size. The predicted times of weekly trips of the elderly are shown in Figure 9. The R2 value of the proposed model was 0.999, and its prediction accuracy was relatively high. The predicted times of weekly trips was 3.5 on average. As illustrated by Figure 10, the model started to fully converge around the 50th generation of iteration.

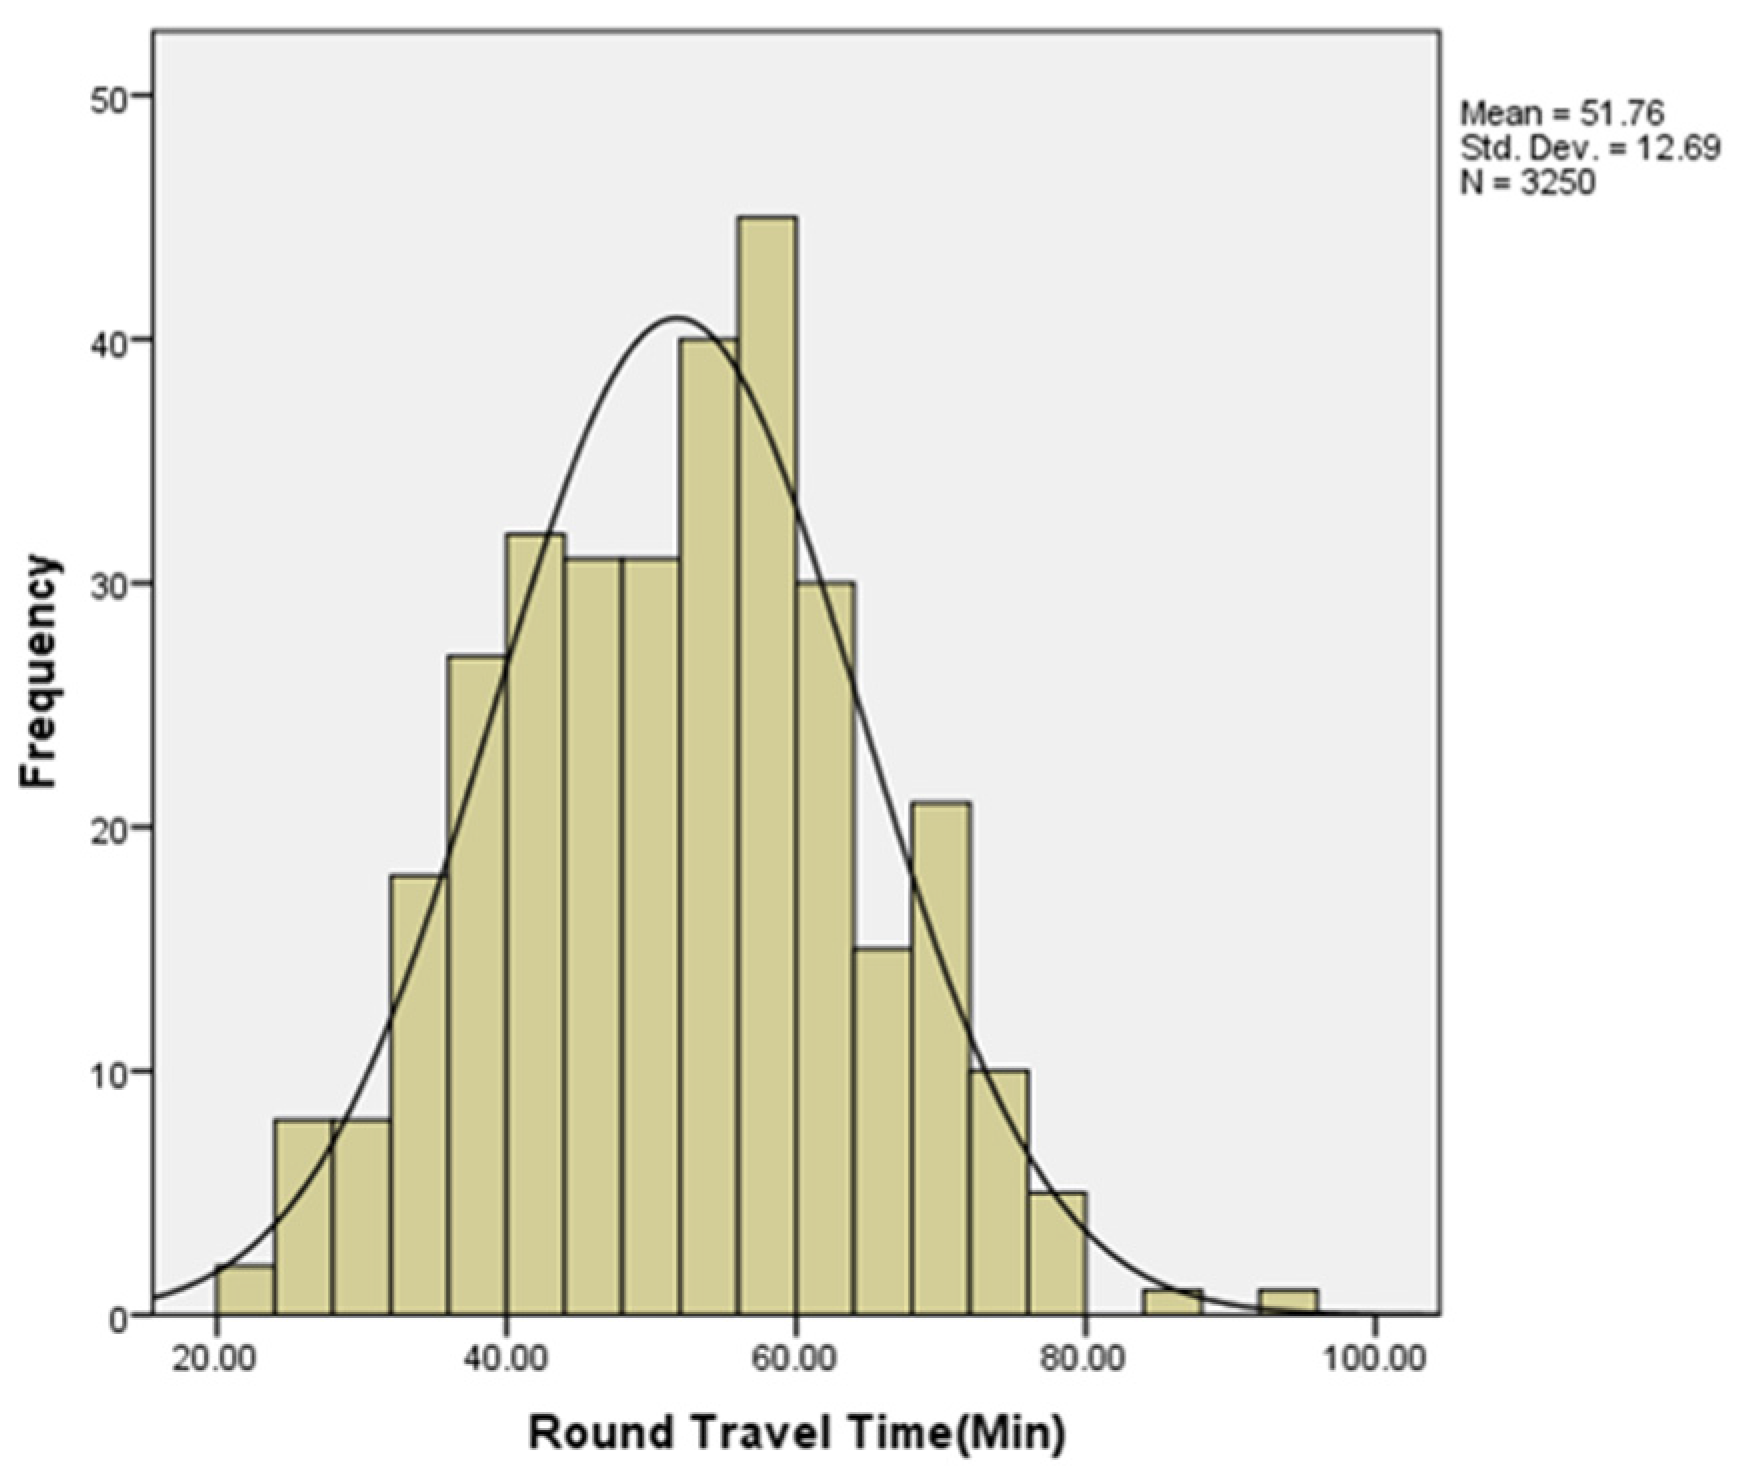
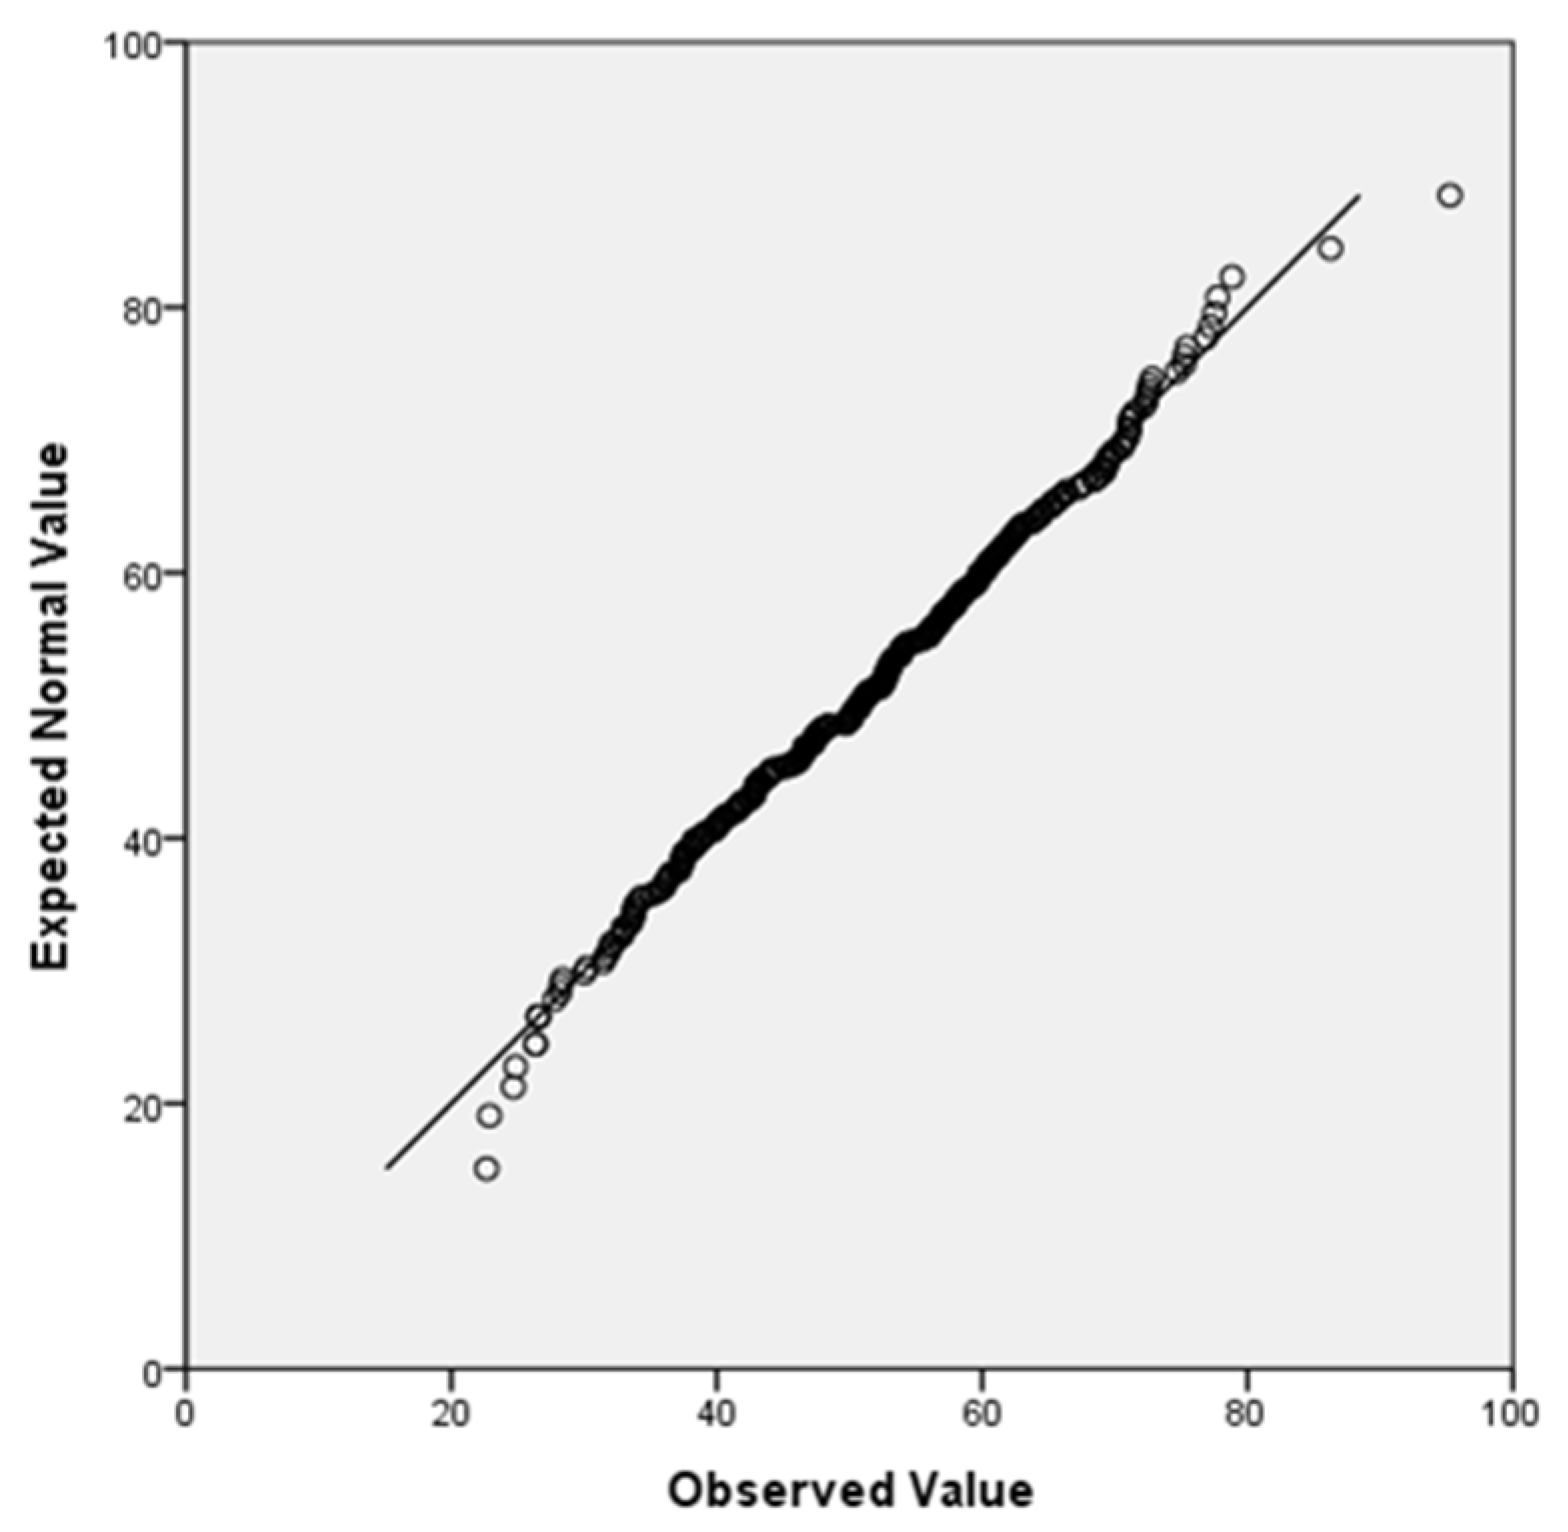
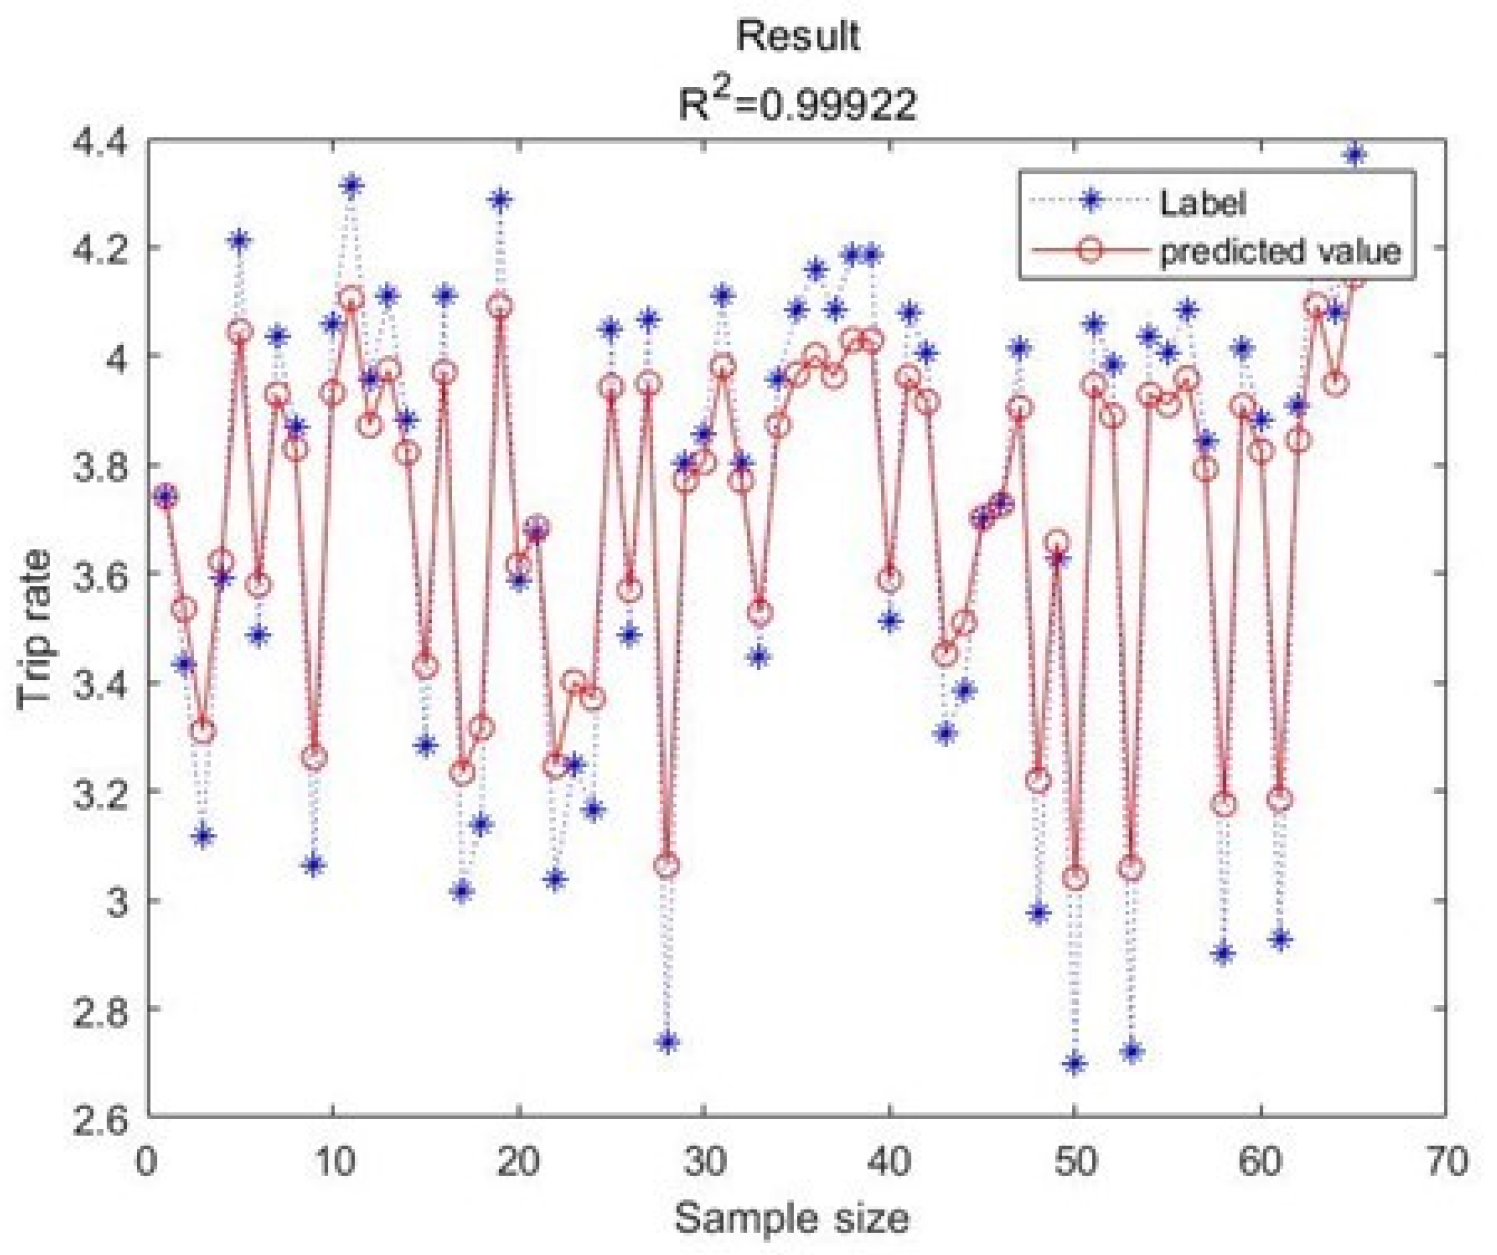
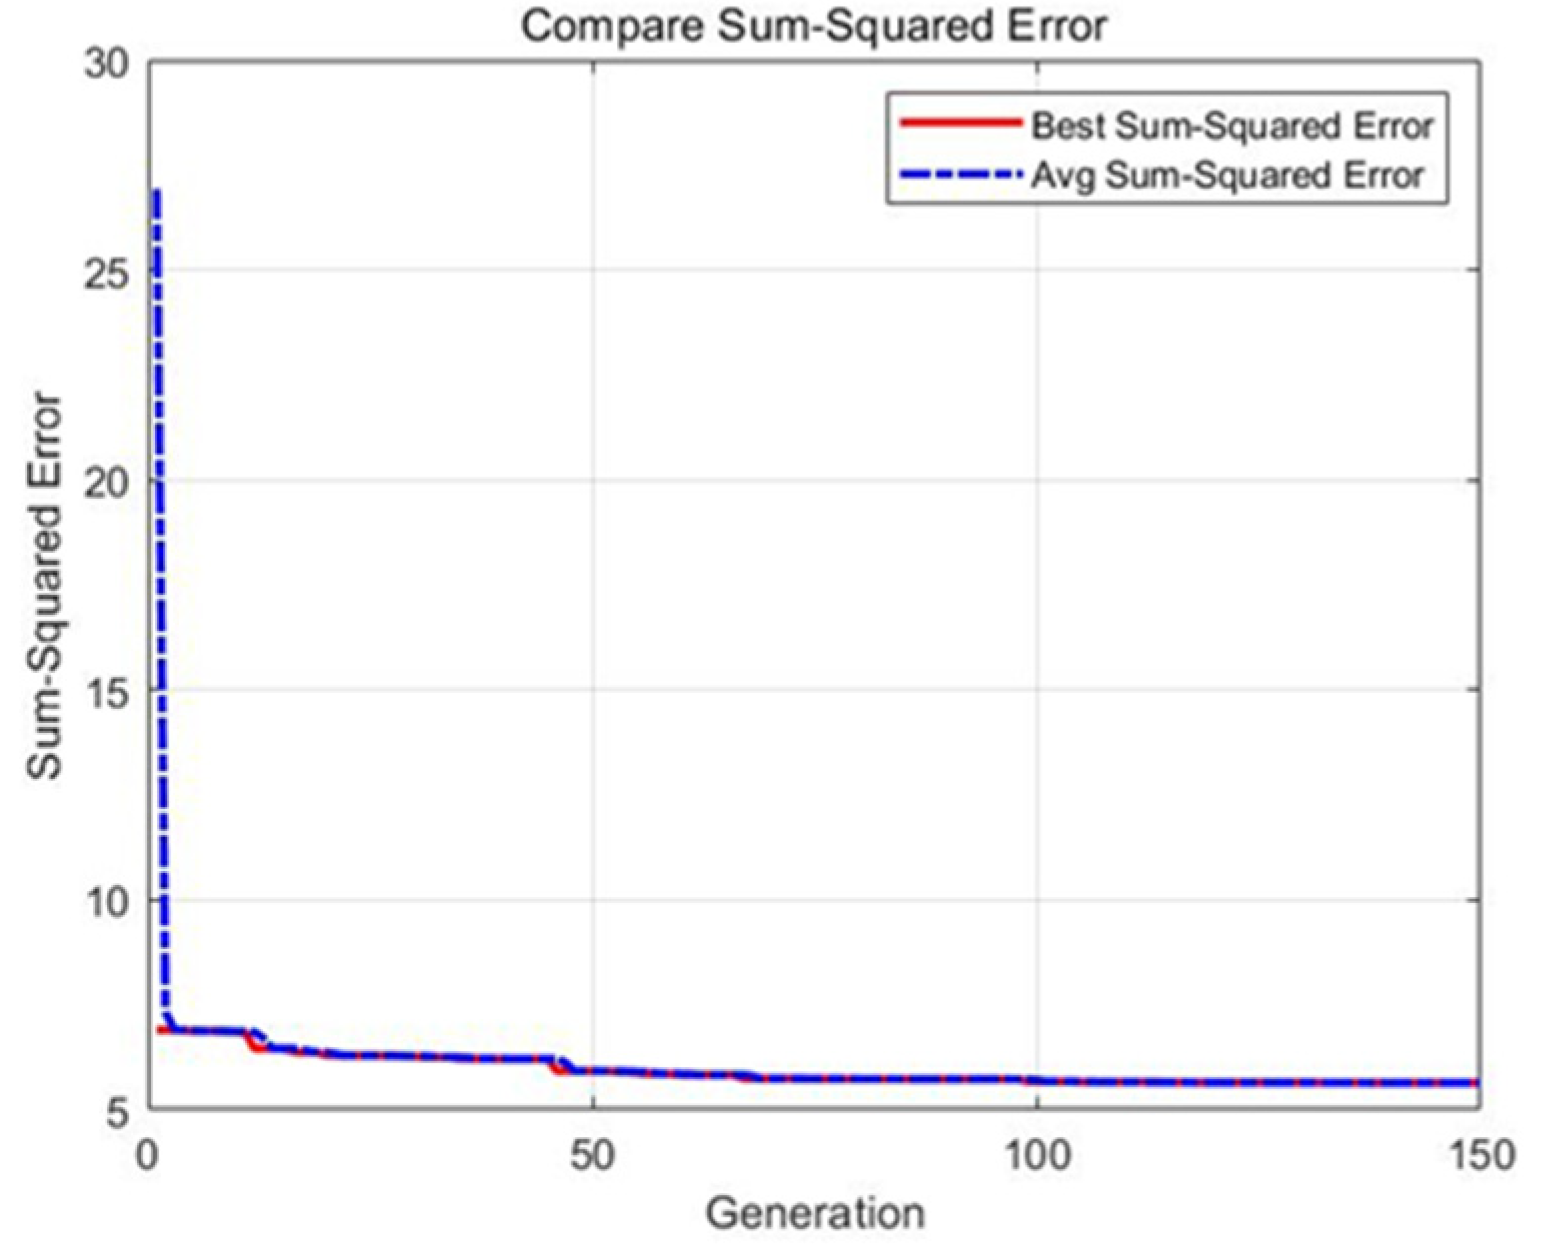
5.1.2. Predicted Round-Trip Travel Time

To predict the round-trip travel time of the elderly, the input vector was chosen as the influencing factor of the round-trip travel time, and the output value was the corresponding round-trip travel time. The optimal parameters of the GR-GA-BP model were determined through cross-validation and grid search as shown in Table 6. The training errors of the five types of models are shown in Table 7. The generalization ability of the proposed model was determined. The goodness of fit between the predicted and the observed values in the test set is shown in Figure 11. The variation in squared error and evolution times on the training set is shown in Figure 12.
The error of the linear regression model was significantly larger. The performance of the improved BP neural network was better than the traditional BP neural network according to the error indexes. The proposed model performed significantly better than the traditional one, which had a fit degree of 0.9976 for the test set, and t was stabilized after the 40th generation of iteration. The MRE and MSE of the model were 7.13% and 17.5299, respectively, both of which were lower than those of other models.
The predicted maximum round-trip travel time of the elderly was highly accurate. It could help city managers to make decisions for urban layout and locate public transportation facilities within an appropriate distance from the elderly’s residential areas.

6. Conclusions

This paper focused on the travel characteristics of the elderly in Beijing. The main contents and innovations have been summarized as follows.
(1) Based on the travel data of the elderly obtained from the field survey, a grey relational degree (GR) model was used to explore the internal relationship between the individual characteristics and travel behavior of the elderly based on poor information. The results showed that bus and subway stations had the greatest influence on the times of weekly trips of the elderly, while the family size had little impact on the times of weekly trips and the maximum walking distance.
(2) The GR-GA-BP model was proposed to predict the times of weekly trips and round-trip travel time. The dimension of the input vector was determined by the correlation between the feature sequence and the influencing factors, and the optimal parameters were determined using the cross-validation method.
(3) Compared with the other four types of models, the proposed model had a smaller training error and achieved better performance in the test set.
This paper only included the main factors such as times of weekly trips and walking time in the travel characteristics of the elderly. According to the previous research, the proportion of the elderly that travel by motor vehicle in Europe and America is very high, while most of the elderly in China travel by walking or bus. With the development of the economy, ‘the new generation’ of the elderly will more and more travel by motor vehicle, which will bring changes to the traffic structure. Correspondingly, the traffic demand and urban traffic planning should have new development directions and concepts. Therefore, we plan to cross-analyze the travel purpose, travel mode, and other characteristics, and this study will work as an example for a better understanding and prediction based on larger data sets in the future. It is of great significance to study the travel characteristics of the elderly and analyze the relationship between the travel characteristics of the elderly and the travel-influencing factors, which would provide the policymakers an atheoretical decision-making basis.

Author Contributions

Study conception and design: Z.L., Y.W. and L.Z.; data collection: Z.L. and L.Z.; analysis and interpretation of results: Z.L. and Z.W.; draft manuscript preparation: Z.L. All authors have read and agreed to the published version of the manuscript.

Funding

This research was funded by [Major Program of National Fund of Philosophy and Social Science of China (CN)] grant number [21FGLB014] and the APC was funded by [21FGLB014].

Institutional Review Board Statement

Not applicable.

Informed Consent Statement

Not applicable.

Data Availability Statement

The data used to support the findings of this study are available from the corresponding author upon request.

Conflicts of Interest

The authors declare no conflict of interest.

References

  1. Böcker, L.; van Amen, P.; Helbich, M. Elderly travel frequencies and transport mode choices in Greater Rotterdam, the Netherlands. Transportation 2017, 44, 831–852. [Google Scholar] [CrossRef] [Green Version]
  2. Chan, H.Y.; Xu, Y.; Chen, A.; Liu, X. Impacts of the walking environment on mode and departure time shifts in response to travel time change: Case study in the multi-layered Hong Kong metropolis. Travel Behav. Soc. 2022, 28, 288–299. [Google Scholar] [CrossRef]
  3. Chen, W.H. Exploring Travel Characteristics and Factors Affecting the Degree of Willingness of Seniors in Taiwan to Use an Alternative Service Bus. Transp. Res. Rec. 2010, 2182, 71–78. [Google Scholar] [CrossRef]
  4. Dargay, J.M.; Clark, S. The determinants of long distance travel in Great Britain. Transp. Res. Part A Policy Pract. 2012, 46, 576–587. [Google Scholar] [CrossRef]
  5. Dong, R.; Tianyi, S.; Han, G.; Han, W. The Research on Sensitivity of Chinese Urban Elderly Travel Characteristic Parameters. Procedia Eng. 2016, 137, 442–451. [Google Scholar] [CrossRef] [Green Version]
  6. Du, M.; Cheng, L.; Li, X.; Yang, J. Factors affecting the travel mode choice of the urban elderly in healthcare activity: Comparison between core area and suburban area. Sustain. Cities Soc. 2020, 52, 101868. [Google Scholar] [CrossRef]
  7. Fang, S.; Yao, X.; Zhang, J.; Han, M. Grey Correlation Analysis on Travel Modes and their Influence Factors. Procedia Eng. 2017, 174, 347–352. [Google Scholar] [CrossRef]
  8. Schwarzlose, A.A.; Mjelde, J.W.; Dudensing, R.M.; Jin, Y.; Cherrington, L.K.; Chen, J. Willingness to pay for public transportation options for improving the quality of life of the rural elderly. Transp. Res. Part A Policy Pract. 2014, 61, 1–14. [Google Scholar] [CrossRef]
  9. Lachapelle, U.; Cloutier, M.S. On the complexity of finishing a crossing on time: Elderly pedestrians, timing and cycling infrastructure. Transp. Res. Part A Policy Pract. 2017, 96, 54–63. [Google Scholar] [CrossRef]
  10. LeCun, Y.; Bottou, L.; Bengio, Y.; Haffner, P. Gradient-based learning applied to document recognition. Proc. IEEE 1988, 86, 2278–2324. [Google Scholar] [CrossRef]
  11. Lee, D.; Derrible, S.; Pereira, F.C. Comparison of Four Types of Artificial Neural Network and a Multinomial Logit Model for Travel Mode Choice Modeling. Transp. Res. Rec. 2018, 2672, 101–112. [Google Scholar] [CrossRef] [Green Version]
  12. Lee, H.; Choo, S.; Kim, J. Analyzing the Characteristics of Trip Chaining Activities of the Elderly in Seoul Metropolitan Area. J. Korea Inst. Intell. Transp. Syst. 2014, 13, 68–79. [Google Scholar] [CrossRef] [Green Version]
  13. Lee, K.S.; Eom, J.K.; Lee, J.; Ko, S. Analysis of the Activity and Travel Patterns of the Elderly Using Mobile Phone-Based Hourly Locational Trajectory Data: Case Study of Gangnam, Korea. Sustainability 2021, 13, 3025. [Google Scholar] [CrossRef]
  14. Lee, M.-G.; Yu, K.-M. Dynamic Path Planning Based on an Improved Ant Colony Optimization with Genetic Algorithm. In Proceedings of the 2018 IEEE Asia-Pacific Conference on Antennas and Propagation (APCAP), Auckland, New Zealand, 5–8 August 2018; pp. 1–2. [Google Scholar] [CrossRef]
  15. Liu, C.; Bardaka, E.; Palakurthy, R.; Tung, L.W. Analysis of travel characteristics and access mode choice of elderly urban rail riders in Denver, Colorado. Travel Behav. Soc. 2020, 19, 194–206. [Google Scholar] [CrossRef]
  16. Liu, S.; Yamamoto, T.; Yao, E.; Nakamura, T. Examining public transport usage by older adults with smart card data: A longitudinal study in Japan. J. Transp. Geogr. 2021, 93, 103046. [Google Scholar] [CrossRef]
  17. Liu, W.; Lu, H.; Sun, Z.; Liu, J. Elderly’s Travel Patterns and Trends: The Empirical Analysis of Beijing. Sustainability 2017, 9, 981. [Google Scholar] [CrossRef] [Green Version]
  18. Ning, J.; Lyu, T.; Wang, Y. Exploring the Built Environment Factors in the Metro That Influence the Ridership and the Market Share of the Elderly and Students. J. Adv. Transp. 2021, 2021, 9966794. [Google Scholar] [CrossRef]
  19. Sallehuddin, R.; Shamsuddin, S.M.; Hashim, S.Z. Application of Grey Relational Analysis for Multivariate Time Series. In Proceedings of the 2008 Eighth International Conference on Intelligent Systems Design and Applications, Kaohsuing, Taiwan, 26–28 November 2008. [Google Scholar] [CrossRef]
  20. Schmöcker, J.D.; Quddus, M.A.; Noland, R.B.; Bell, M.G. Estimating Trip Generation of Elderly and Disabled People: Analysis of London Data. Transp. Res. Rec. 2005, 1924, 9–18. [Google Scholar] [CrossRef]
  21. Sen, Z.; Ke, Z.; Xiaoyang, L.; Jian, Z.; Yan, L.; Lian, Z. Characterisation of elderly daily travel behaviour in Tianjin using a space–time cube. Environ. Plan. B Urban Anal. City Sci. 2021, 49, 603–618. [Google Scholar] [CrossRef]
  22. Seo, S.E.; Jeong, J.H.; Kim, S.G. Analysis of the Elderly Travel Characteristics and Travel Behavior with Daily Activity Schedules (the Case of Seoul, Korea). J. Korean Soc. Transp. 2006, 24, 89–108. [Google Scholar]
  23. Shi, Z.; Pun-Cheng, L.S.; Liu, X.; Lai, J.; Tong, C.; Zhang, A.; Zhang, M.; Shi, W. Analysis of the Temporal Characteristics of the Elderly Traveling by Bus Using Smart Card Data. ISPRS Int. J. Geo Inf. 2020, 9, 751. [Google Scholar] [CrossRef]
  24. Smith, G.C.; Sylvestre, G.M. Determinants of the Travel Behavior of the Suburban Elderly. Growth Chang. 2001, 32, 395–412. [Google Scholar] [CrossRef]
  25. Stern, S. A disaggregate discrete choice model of transportation demand by elderly and disabled people in rural Virginia. Transp. Res. Part A Policy Pract. 1993, 27, 315–327. [Google Scholar] [CrossRef]
  26. Szeto, W.Y.; Yang, L.; Wong, R.C.; Li, Y.C.; Wong, S.C. Spatio-temporal travel characteristics of the elderly in an ageing society. Travel Behav. Soc. 2017, 9, 10–20. [Google Scholar] [CrossRef] [Green Version]
  27. Titheridge, H.; Achuthan, K.; Mackett, R.; Solomon, J. Assessing the extent of transport social exclusion among the elderly. J. Transp. Land Use 2009, 2, 31–48. [Google Scholar] [CrossRef] [Green Version]
  28. Wang, S.; Li, L.; Ma, W.; Chen, X. Trajectory analysis for on-demand services: A survey focusing on spatial-temporal demand and supply patterns. Transp. Res. Part C Emerg. Technol. 2019, 108, 74–99. [Google Scholar] [CrossRef]
  29. Yadav, S.; Shukla, S. Analysis of k-Fold Cross-Validation over Hold-Out Validation on Colossal Datasets for Quality Classification. In Proceedings of the 2016 IEEE 6th International Conference on Advanced Computing (IACC), Bhimavaram, India, 27–28 February 2016. [Google Scholar] [CrossRef]
Figure 1. Age structure of the elderly in the questionnaire.
Sustainability 14 13448 g001
Figure 2. Histogram plot of the round-trip travel time of the elderly.
Sustainability 14 13448 g002
Figure 3. Q-Q plot of the round-trip travel time of the elderly.
Sustainability 14 13448 g003
Figure 4. Histogram plot of the times of weekly trips of the elderly.
Sustainability 14 13448 g004
Figure 5. Q-Q plot of the times of weekly trips of the elderly.
Sustainability 14 13448 g005
Figure 6. Model framework.
Sustainability 14 13448 g006
Figure 7. Network topology.
Sustainability 14 13448 g007
Figure 8. Cross-validation diagram.
Sustainability 14 13448 g008
Figure 9. Predicted and observed times of weekly trips of the elderly.
Sustainability 14 13448 g009
Figure 10. Sum-squared error of the times of weekly trips of the elderly.
Sustainability 14 13448 g010
Figure 11. Predicted round-trip travel time of the elderly (the vertical axis represents the round-trip travel time of the elderly, in minutes.).
Sustainability 14 13448 g011
Figure 12. Sum-squared error of the round-trip travel time of the elderly.
Sustainability 14 13448 g012
Table 1. Travel attribute factors of the elderly.
AttributesVariableValue
IndividualSpouse (x1)Yes 2, No 1
Gender (x2)Male, 2; Female,1
Age (x3)Take the Discrete Value
Older Singletons (x4)Yes 2, No 1
Driver License (x5)Yes 2, No 1
Monthly Pass (x6)Yes 2, No 1
FamilyHave Children (x7)Yes 2, No 1
Size of Family (x8)1 to 6
Have Car (x9)Yes 2, No 1
Have Bike (x10)Yes 2, No 1
Have Electric Bike or Tricycle (x11)Yes 2, No 1
External EnvironmentBus Station (x12)Yes 2, No 1
Subway Station (x13)Yes 2, No 1
Mall (x14)Yes 2, No 1
Old Town (x15)Yes 2, No 1
Recreational Facilities (x16)Yes 2, No 1
Travel CharacteristicsTimes of Weekly Trips (y1)Times/day
Average Round-Trip Travel Time (y2)Minute
Table 2. Relevance of each influencing factor and eigenvalue ( ξ = 0.5).
VariableTimes of Weekly Trips
(y1)
Average Round-Trip Travel Time
(y2)
Spouse (x1)0.8020.829
Gender (x2)0.9420.879
Age (x3)0.9430.874
Older Singletons (x4)0.9200.855
Driver License (x5)0.9300.884
Monthly Ticket (x6)0.9490.874
Have Children (x7)0.9460.882
Size of Family (x8)0.6180.623
Have Car (x9)0.8620.844
Have Bike (x10)0.9480.881
Have Electric Bike or Tricycle (x11)0.8960.868
Bus (x12)0.9600.885
Subway Station (x13)0.9540.881
Mall (x14)0.950.876
Old Town (x15)0.9550.882
Recreational Facilities (x16)0.9540.884
Table 3. Factors affecting the travel characteristics of the elderly.
AbirritateTimes of Weekly TripsAverage Round-Trip Travel Time
Constant
Individualx2x2
x3x3
x4x4
x5x5
x6x6
Familyx7x7
x10x10
x11
External Environmentx12x12
x13x13
x14x14
x15x15
x16x16
Table 4. Times of weekly trips error.
Iteration TimesPopulation SizeCrossover ProbabilityMutation ProbabilityLearning Rate
1002000.850.010.001
Table 5. Parameters of the prediction model of the times of weekly trips.
Times of Weekly TripsLRBPGA-BPGR-BPGR-GA-BP
MRE47.81%32.5%27.27%38.02%23.12%
MSE1.18420.779230.58440.90550.5637
time1 × 10−74 × 10−73 × 10−64 × 10−77 × 10−6
Table 6. Maximum time step parameters of the prediction model.
Iteration TimesPopulation SizeCrossover ProbabilityMutation ProbabilityLearning Rate
1505000.30.010.01
Table 7. Prediction errors round-trip travel time of the elderly.
Round-Trip Travel
Time Prediction
LRBPGA-BPGR-BPGR-GA-BP
MRE23.31%15.3%13.27%8.29%7.13%
MSE36.5323.4520.4418.0317.53
time2 × 10−72 × 10−73 × 10−62 × 10−73 × 10−6
Publisher’s Note: MDPI stays neutral with regard to jurisdictional claims in published maps and institutional affiliations.

