Abstract
Environmentalists face several challenges when communicating water quality hazards, especially those that are unseen to the naked eye. Grounded in the Extended Parallel Process Model, we analyzed how perceptions of conservation responsibility and the visualization of pollution affected perceived water quality threats, efficacy, and pro-environmental behavior outcomes. We conducted a 2 × 2 between-subjects controlled message-testing experiment with 502 adults from the Chesapeake Bay watershed. Individuals viewed personal or government attribution messages with fear or non-fear visuals to see how messages affected intentions to take part in a river clean-up day, enact environmentally friendly behaviors, and comment on public policy. Messages that promoted government responsibility and those that featured images of polluted water increased response efficacy, threat appraisals, fear, and intentions. Promoting personal responsibility yielded more limited effects. Furthermore, messages were less effective when they featured visuals of clean water. Implications include recommendations for using responsibility attribution messages in practice and engaging the public with information about unseen hazards.
1. Introduction
Media messages that ascribe personal responsibility for environmental conservation are frequently used in practice yet understudied theoretically. The U.S. Forest Service’s Smokey Bear (e.g., “Only you can prevent forest fires”), the European Union’s “You Control Climate Change” campaign and Keep America Beautiful (e.g., “People start pollution, people can stop it”) are example advocacy campaigns that use a combination of responsibility ascriptions and emotional appeals to inspire people to act [1,2]. Indeed, it is critical to empower people to care about the environment and act sustainably [3,4]. However, there is growing evidence that attributing personal responsibility to environmental protection can have competing beneficial and detrimental effects [5,6]. Emphasis on small, individual action can undermine support for larger environmental policy reform [7]. Research is needed to understand for whom and under what circumstances responsibility messages may be most effective. In this study, we evaluate how ascribing personal or government responsibility to protecting water quality, in tandem with emotional fear appeals, helps or hinders message reception.
Public concern for water quality is increasing and data from Gallup’s annual environmental survey show that 57% of Americans are worried about pollution in rivers, lakes, and reservoirs in their communities [8]. Stormwater runoff is a leading threat to water quality [9]. When it rains, nutrients from pollutants such as litter, fertilizers, pesticides, and pet waste flow into the water [10]. There are many pro-environmental behaviors that individuals can participate in to mitigate pollution. A pro-environmental behavior is defined as, “behavior that consciously seeks to minimize the negative impact of one’s actions on the natural and built world” [11]. These behaviors in relation to water quality include securing trash can lids, cleaning up after pets, reducing the use of herbicides, pesticides, and fertilizers, taking part in community monitoring and clean-up efforts, and supporting public policies that prioritize water quality [12,13]. An individual’s lack of awareness of their role in protecting water quality may lead to a value action-gap [14], in which individuals desire clean and safe water, but are not engaging in personal or political conservation actions to actuate their values.
The value-action gap has long been of interest to researchers, community planners, and environmentalists [14,15,16,17]. In the current study, we use the Extended Parallel Process Model (EPPM) [14,18] as a framework to test how messages may affect this value-gap. Based on this model, we posit that effective messages must enhance a person’s threat perceptions (e.g., awareness of threat severity and susceptibility) [19], efficacy appraisals (e.g., confidence that one’s actions matter) [20], and responsibility perceptions (e.g., belief in the extent to which the government and people need to be a part of the solution) [21]. The EPPM is often used to test the effectiveness of emotional fear appeals [18], but to our knowledge the model has not been tested with the inclusion of environmental responsibility attributions. Hence, the objective of this research is to explore the effectiveness of different responsibility attributions (government and personal) and emotional fear appeals (presence or absence) on promoting threat, efficacy, responsibility, and pro-environmental behavioral outcomes. Results from this research will provide environmentalists with a greater understanding of the utilities of responsibility and emotional framing in inspiring behavior change. The following literature review discusses an overview of the theories that guide this study and how they have been analyzed in previous environmental contexts.
1.1. Fear Appeals
Fear is an emotional state that can help an individual recognize potential threats in their environment [22]. A large body of research explores how advocacy campaigns can utilize fear in their persuasive message strategies, with varying levels of effectiveness [23,24,25,26,27,28]. The EPPM provides a theoretical rationale for how fear can affect intentions and behaviors [18]. This model proposes that a fear appeal may motivate an individual if the message sufficiently enhances threat and efficacy appraisals. If an individual perceives a threat, with no corresponding efficacy, they may experience fear control and reject the persuasive message and deem the outcome behavior as unattainable. However, if an individual’s efficacy is high enough to make them feel capable of dealing with a perceived threat, then they may be more motivated to take action to avert the threat through danger control [18].
While there are many ways that messages can elicit fear, we are interested in the use of visuals. There is evidence that viewing visual representations of water pollution, including discolored water, algae blooms, and the presence of litter, is a strong predictor of an individual’s threat appraisals [29,30,31]. The idea of water contamination is fear inducing, yet individuals find it difficult to protect themselves against threats that they cannot see [32]. Thus, including visual representations of environmental degradation in messaging can lead to feelings of severity and susceptibility and in turn increase fear [33]. Overall, research suggests that visuals affect message recollection, retention, and likelihood of adhering to a recommendation, with some studies showing a greater likelihood of adherence when fear visuals are used [34,35]. Considering this literature, we propose the following main effect and mediation effect:
Hypothesis 1 (H1).
Exposure to messages that include a fear visual will increase an individual’s intentions.
Hypothesis 2 (H2).
Exposure to messages that include a fear visual will have a positive direct effect on perceived threat and fear, which in turn will increase behavior intentions.
Fear visuals may be able to induce threat appraisals regarding local water quality, but according to the EPPM, messages also need to include components that motivate action and induce efficacy appraisals. While an abundance of research cites the importance of self-efficacy and response efficacy in promoting pro-environmental behaviors [36,37,38], there is little evidence of message characteristics that actually increase these perceptions. A meta-analysis from Tannenbaum and colleagues [39] showed strong support for the need for including both self-efficacy and response efficacy statements with fear appeals to avoid backfire effects. Chen [23] suggests efficacy statements should convey how easy it is to take actionable steps to address a threat and provide examples of ways these actions positively mitigate the threat. The inclusion of efficacy statements may help individuals avert fear control and message reactance, but further research is needed to test the message characteristics that go beyond reducing backfire effects to achieve the goal of increasing efficacy [40]. Attribution theory provides insight into how responsibility frames could impact efficacy.
1.2. Attribution Theory
Attribution theory posits that individuals attribute responsibility for a problem to a specific cause through cognitive and emotional reasoning [41]. How individuals perceive responsibility is shaped by media framing [42]. A number of scholars have analyzed attribution theory through a media effects perspective, in which messages frame responsibility attribution to elicit a specific audience response [43]. In general, attributing responsibility to individuals for social issues can weaken accountability of public officials and industries [44]. The case study of BP’s ‘Personal Carbon Footprint’ campaign provides a point of reference for understanding potential damaging effects of promoting personal responsibility [45]. In this case, study, Doyle argues that BP has, “appropriated a collective social concern for the environment in the construction of its brand image, in order to mitigate its own contribution, as a global oil company, to climate change” [45] (p. 200). This message strategy in part focuses attention away from policy reform and alternative conservation views [46]. These messages also emphasize personal agency and promote individualism over collectivism [47].
Placing an onus on individuals to protect water quality may be considered a greenwashing tactic, which is problematic because it allows government and industries to enact symbolic instead of substantive environmental protective behaviors [48]. Considering the anecdotal evidence that responsibility frames may be ineffective, or even harmful in an environmental context, it is important to investigate perceptions of these messages in an experimental setting. We are interested in instances when attribution is emphasized as the responsibility of community members or government, and whether or not these messages are accompanied by a fear visual. Hallman and Wandersman [49] suggest that regardless of blame, individuals primarily view the government as responsible for dealing with environmental degradation. Considering the lack of research on attribution messages within the EPPM, we propose the following research questions discussing main effects and conditional effects:
RQ1: Is there a main effect of exposure to responsibility messages on behavior intentions?
RQ2: Does exposure to personal or government responsibility messages affect intentions through increased efficacy and responsibility appraisals?
1.3. Current Study Context
The Chesapeake Bay watershed spans Virginia, Maryland, New York, Pennsylvania, and the District of Columbia. The health index of the Chesapeake Bay watershed has an overall D+ rating for water quality, including failing scores for nitrogen, phosphorus, and water clarity. This score decreased since the last rating in 2016, with degradation attributed to record amounts of rainfall across the watershed washing pollutants into the Bay [50]. Community and personal action makes a significant difference in this watershed, with the Chesapeake Bay Program (2015) estimating that stormwater runoff accounts for 17% of pollution in the bay, unkempt septic systems account for 4% of pollution, and motor vehicle related emissions accounts for 19% of pollution. The Environmental Protect Agency imposed state sanctions to curtail pollution in the Chesapeake Bay by 2025. Data for the present study were collected from the state of Virginia, which is the state with the longest bay shoreline and extensive river sources flowing into the Chesapeake Bay. All bay states, including Virginia, created ‘pollution diets’ to address excessive nutrient and sediment pollution [51] and the states are in need of message strategies for promoting these plans to the public. In 2019, Virginia opened a public comment period for citizens to discuss their concerns regarding water quality and the pollution diet. To include information seeking as an outcome variable, the current study messages discussed the pollution diet and emphasized individual or state government’s role in this policy. An additional research question is proposed based on this research context:
RQ3: What effects do responsibility perceptions and message exposure have on policy information seeking?
2. Materials and Methods
2.1. Experimental Design
We conducted a between-subjects online message testing experiment. Participants were exposed to one of four stimulus conditions or a control condition. In the four experimental conditions, individuals read a simulated news article that included a photo of dirty or clean water from the James River in Virginia. The articles contained the same content with four sections changed to either emphasize government or personal attribution of responsibility messages for protecting water quality (see Table 1). Responsibility messages were adapted from Bolsen, Druckman, and Cook [52]. All messages included the same self-efficacy statement that discussed how Virginians can take simple steps at home to help reduce pollution. Additionally, all stimuli included the same response efficacy statement that included metrics for how pro-environmental behaviors make a difference. Efficacy was not directly manipulated in this study and EPPM research lends strong support for the need for efficacy statements in messages that feature fear appeals in order to avoid backfire effects [23,39]. A James River roundtable helped to develop the news articles.

Table 1.
The Attribution of Responsibility Statements Embedded in the News Articles.
2.1.1. Manipulation Check
The stimuli were pre-tested using a sample of 62 survey participants from Amazon’s Mechanical Turk. Participants were randomly assigned to one of the stimulus conditions. As expected, the sample who viewed messages with dirty water (M = 1.50, SD = 2.09) had a lower mean score on a scale of 0 (extremely dirty) to six (extremely clean) than the sample who viewed the messages with clean water (M = 5.03, SD = 0.89) t(38.74) = −8.52, p < 0.001). In testing responsibility messages, a chi-square test showed a difference between observations χ2(1) = 16.29, p < 0.001, with 78.3% of participants in the personal responsibility conditions and 80% in the government responsibility conditions correctly identifying the messages in which they viewed.
2.1.2. Participants and Protocol
Participants (N = 502) came from an online Qualtrics panel. Qualtrics uses a variety of incentives to promote survey participation, such as gift cards, cash, or airline miles [53]. To take part in this study, individuals had to be eighteen years of age or older and a Virginia resident. Participants were between ages 18 and 85 (M = 42.73, SD = 16.03). Respondents reported their sex as follows: 52.6% male, 47.4% female. A total of 68.8% of respondents identified as white; 18.5% Black or African American; 7.8% Hispanic or Latino/a; 4.8% Asian; 1.6% American Indian or Alaska Native; 0.2% Native Hawaiian or Pacific Islander; and 1.8% other (see Table 2).
Table 2.
Sample Characteristics.
Participants began the survey by answering demographic questions. Then, they read one of the simulated news articles or no article (control group). Next, they answered questions related to attribution of responsibility [52], perceptions of water pollution severity and susceptibility [54], fear [55], self-efficacy, response efficacy, and intentions for PEBs and collective action [56], and information seeking. Survey questions are explained in more detail below with corresponding summary statistics. The survey took participants an average of 15 min to complete. An Institutional Review Board determined our research protocol exempt from review.
2.1.3. Measures
Susceptibility. Two items adapted from previous research were used to measure susceptibility [54]: (a) “My chances of being affected by water pollution in my lifetime are high.” and (b) “The pollution in Virginia’s rivers is a threat to me.” Responses were measured on a seven-point Likert-type scale from 0 = “strongly disagree” to 6 = “strongly agree” (M = 4.11, SD = 1.27, r = 0.71, p < 0.001).
Severity. One question adapted from previous research was used to measure severity [54]: “Pollution of Virginia’s rivers is a serious problem.” Responses were measured from 0 = “strongly disagree” to 6 = “strongly agree” (M = 4.57, SD = 1.33).
Fear. Two questions adapted from previous research measured fear [55]: “To what extent do you feel scared about water quality problems related to Virginia’s rivers?”, “To what extent do you currently worry about pollution in Virginia’s rivers?” Responses were measured on a five-point Likert-type scale from 0 = “not at all” to 4 = “a great deal” (M = 2.07, SD = 1.08, r = 0.77, p < 0.001).
Responsibility. Participants were given this prompt to measure perceived treatment responsibility [52]: “Please rate how responsible you think each of the following sources are for dealing with pollution in Virginia’s rivers?” (a) “Virginia’s state government” and (b) “You and your neighbors.” Response options ranged from 0 = “not responsible at all” to 4 = “extremely responsible” (personal responsibility: M = 2.60, SD = 1.03; government responsibility: M = 2.74, SD = 0.97). Other response options not included in this manuscript were the federal government, conservation districts, non-profit NGOS, private corporations, and farmers and the agriculture industry. Responsibility was manipulated, hence we excluded these other options, as responses may have been skewed by stimuli exposure.
Self-efficacy. Two questions adapted from previous research measured pro-environmental behavior self-efficacy [56]: “I am capable of participating in environmentally friendly behaviors like recycling and composting”, “I am able to help make my community river friendly by not littering, picking up after a pet, and eliminating the use of fertilizers and pesticides.” Responses were measured on a seven-point Likert-type scale from 0 = “strongly disagree” to 6 = “strongly agree” (M = 5.08, SD = 1.04, r = 0.60, p < 0.001). One question asked about self-efficacy for participating in a river cleanup day: “I am able to volunteer for a river cleanup day” (M = 4.14, SD = 1.65).
Response efficacy. Two items measured pro-environmental behavior response efficacy [56]: “If I were to not litter, pick up after my pet, or eliminate the use of fertilizers and pesticides, I would help to improve water quality of local rivers”, and “My participation in environmentally friendly behaviors like recycling and composting would have a positive effect on the water quality of local rivers”. Responses were measured from 0 = “strongly disagree” to 6 = “strongly agree” (M = 4.72, SD = 1.16, r = 0.59, p < 0.001). One item measured river cleanup response efficacy: “If I were to volunteer for a river cleanup day, this action would have a positive effect on the water quality of local rivers” (M = 4.54, SD = 1.31).
Behavior intentions. Two questions adapted from previous literature measured pro-environmental behavior intentions [56]: “I plan to take steps to help make my community river friendly by refraining from littering, picking up after a pet, or eliminating the use of fertilizers and pesticides”, “I plan to participate in environmentally friendly behaviors like recycling and composting in the near future”. Responses were measured from 0 = “strongly disagree” to 6 = “strongly agree” (M = 4.87, SD = 1.16, r = 0.57, p < 0.001). One question measured river cleanup intentions: “I plan to volunteer to take part in a river clean up activity in the near future” (M = 3.66, SD = 1.67).
Information seeking intentions. Three questions were used to measure information seeking. Participants were asked, “How likely are you to seek out additional information about the state’s ‘pollution diet’ plan for the Chesapeake Bay and connected Virginia rivers?” and “How likely are you to comment on the state’s ‘pollution diet’ plan for the Chesapeake Bay and connected Virginia rivers?”, and “How interested are you in learning more about the state’s ‘pollution diet’ plan for the Chesapeake Bay and connected Virginia rivers?” Responses options were measured from 0 = “extremely unlikely” to 4 = “extremely likely” (M = 2.63, SD = 0.96, α = 0.90).
2.1.4. Analytical Strategy
We used IBM SPSS Statistics to run all statistical tests. After assessing normality and analyzing data assumptions, we ran a one-way analysis of variance (ANOVA) test to analyze main effects. Then, PROCESS model 21 [57] was used to estimate two parallel-serial mediation models to test message direct and indirect effects (see Figure 1). The independent variable for each of the models was message exposure, entered as a multi-categorical predictor with indicator coding to compare each experimental condition to the control group. The dependent variable was pro-environmental behavior intentions for the first model and river cleanup behavior intentions for the second model. Model inferences were made using the bootstrapping method, taking 10,000 re-samples from the original data to construct 95% bias-corrected confidence intervals.
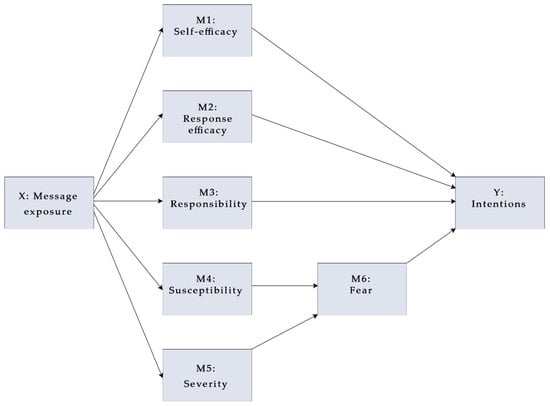
Figure 1.
Proposed Parallel and Serial Multiple Mediator Model.
To answer the final research question, a hierarchical regression model analyzed the predictors of information seeking. The first regression block included covariates, the second block included perceptions of government and personal responsibility, and the third block included message exposure dummy coded against the control group. Covariates in the mediation models and the regression model included sex, age, race/ethnicity, income, education, political ideology, and river use. For this model we created a river use scale with 17.1% of respondents reporting low river use, 37.3% moderate river use, and 45.6% high river use.
3. Results
In testing the first hypothesis, main effects were not observed for exposure to fear visuals on PEB intentions F(4, 497) = 0.68, p = 0.60 or collective action intentions F(4, 497) = 0.65, p = 0.62. Thus, the results do not support H1.
The second hypothesis predicted indirect effects of message exposure on intentions through high threat appraisals and fear in serial. For the outcome of PEB intentions, exposure to personal responsibility messages with a fear visual increased severity (B = 0.41, SE = 0.18, 95% CI [0.05, 0.77]) and increased intentions through high severity and fear in parallel (B = 0.01, SE = 0.00, 95% CI [0.00, 0.03]) (see Table 3). However, these messages did not affect intentions through high susceptibility. Exposure to government responsibility messages with a fear visual increased severity (B = 0.41, SE = 0.18, 95% CI [0.05, 0.77]) and increased intentions through high severity and fear in parallel (B = 0.01, SE = 0.00, 95% CI [0.00, 0.03]). Furthermore, exposure to this condition increased susceptibility (B = 0.36, SE = 0.17, 95% CI [0.01, 0.70]) and increased intentions through high susceptibility and fear in parallel (B = 0.01, SE = 0.01, 95% CI [0.00, 0.03]).
Table 3.
Path Coefficients for Predicting Pro-environmental Behavior Intentions (Standard Errors in Parentheses).
Results for collective action intentions were consistent with PEB intentions. As such, exposure to personal responsibility messages with a fear visual increased severity (B = 0.37, SE = 0.18, 95% CI [0.01, 0.73]) and increased intentions through high severity and fear in parallel (B = 0.03, SE = 0.15, 95% CI [0.00, 0.06]) (see Table 4). These messages did not affect intentions through high susceptibility. Exposure to government responsibility messages with a fear visual increased severity (B = 0.46, SE = 0.18, 95% CI [0.10, 0.86]) and increased intentions through high severity and fear in parallel (B = 0.02, SE = 0.14, 95% CI [0.00, 0.05]). Furthermore, exposure to this condition increased susceptibility (B = 0.33, SE = 0.17, 95% CI [0.00, 0.67]) and increased intentions through high susceptibility and fear in parallel (B = 0.02, SE = 0.01, 95% CI [0.00, 0.06]). Thus, these findings partially support the second hypothesis, with fear visuals and government responsibility messages garnering a greater impact on intentions by inducing both severity and susceptibility, compared to fear visuals and personal responsibility messages.
Table 4.
Path Coefficients for Predicting River Cleanup Intentions (Standard Errors in Parentheses).
Answering the first research question, main effects were not observed for exposure to responsibility messages on PEB intentions (F (2, 499) = 1.73, p = 0.27) or collective action intentions (F (2, 497) = 1.43, p = 0.59). The second research question asked if message exposure affects intentions through increasing efficacy appraisals and responsibility appraisals. Message exposure had no effect on intentions through increasing self-efficacy. For the outcome PEB intentions, exposure to government responsibility messages with an image of dirty water positively affected response efficacy (B = 0.46, SE = 0.16, 95% CI [0.14, 0.77]) and increased intentions indirectly through high response efficacy (B = 0.10, SE = 0.05, 95% CI [0.02, 0.21]) (see Table 3). This relationship was not present for predicting collective action intentions. Message exposure did not affect intentions through increasing personal responsibility perceptions.
Direct effects accounted for 60.00% of the variance in predicting PEB intentions F (17, 472) = 41.56, p < 0.001). Significant covariates included sex, income, political ideology, and river use. Identifying as female, having a higher income, leaning liberal, and reporting frequent river use predicted PEB intentions. Similarly, study direct effects accounted for 59.3% of the variance in predicting collective action intentions (F (17, 472) = 40.49, p < 0.001). Significant covariates included sex, race, income, political ideology, and river use. Identifying as female, non-white, having a higher income, leaning liberal, and reporting frequent river use predicted collective action intentions.
The final research question asked about the effects of perceived responsibility and message exposure on policy information seeking. The first block in the hierarchical regression model analyzed age, sex, race, income, education, political ideology, and river use on policy information seeking. Results suggest that being female, non-white, of higher income status, and reporting frequent river use predicted policy information seeking. The second model analyzed perceptions of responsibility. In this model, sex was no longer a significant predictor. However, identifying as non-white, having a higher income, and frequent river use remained significant. Additionally, perceiving the state government and oneself and one’s neighbors as responsible for protecting water resources predicted policy information seeking intentions. The final model included exposure to the four experimental messages, dummy coded against the control group.
Message exposure was not a significant predictor of policy information seeking intentions. The full model accounted for 23.5% of the variance in predicting policy information seeking intentions (see Table 5).
Table 5.
Ordinary Least Square Regression Predicting Information Seeking.
4. Discussion
The results of this study provide nuanced insights into how media messages affect perceptions of environmental threats, efficacy, responsibility, and intentions. The first main takeaway from this research is that campaigns that ascribe personal responsibility to environmental protection may not be as effective in practice as other message strategies. Specifically, we found that reading about the actions the government is taking to protect water quality may make individuals feel like their contribution is a part of a collective effort and hence more impactful. The second main takeaway is that environmentalists should continue to use fear visuals if promoting pro-environmental behaviors that address water quality concerns. Declining water quality is a critical worldwide concern that threatens public health and ecosystem viability [58]. Water pollution threats often cannot be seen by the naked eye [59] and there may be instances when mass media aim to communicate a threat that is invisible. Thus, more research is needed to consider ways to communicate impaired water without reliance on fear visuals.
Regarding our theoretical findings, the results suggest that exposure to responsibility attribution messages does not strengthen perceptions of efficacy. The EPPM posits that messages that induce threat perceptions must also sufficiently increase self-efficacy perceptions to predict adaptive behavioral responses as opposed to maladaptive ones [18]. Responsibility and visual frames alone may not increase an individual’s perceptions that they can perform environmental behaviors. Thus, while responsibility perceptions are important, they may not be sufficient in addressing the systematic changes needed for improving and protecting local water quality [6]. Additionally, considering that none of the messages raised individuals’ perceptions of personal responsibility, it is possible that individuals already had a predetermined sense of their role in protecting water quality that was invariable to message framing. Future studies should consider asking questions of perceived responsibility before message exposure and treat this variable as a study moderator in these analyses.
Exposure to government attribution messages with a fear visual did enhance participants’ response efficacy, or their perception that their actions would have a positive impact. This effect was only present for promoting pro-environmental behaviors and did not transfer to promoting collective action. One explanation for this finding is that individuals may not view a one-time behavior (e.g., a river cleanup) as effective as habitual pro-environmental behaviors (e.g., recycling). There is evidence that health behavior models operate differently based on context-specific factors, including whether the behavior under investigation is a one-time behavior, maintained behavior, or the refusal, cessation, or adoption of a behavior [60]. Results from the current study suggest that this may be the case for environmental behaviors as well, lending support for recent calls to integrate strategies from health and environmental communication perspectives [61].
Regarding other EPPM mediators, the results suggest that viewing fear visuals would enhance intentions through increased perceptions of severity, susceptibility, and fear [29,30,31]. These findings are consistent with the EPPM and support research that highlights the importance of visuals in communicating risk [34,35,62]. Viewing fear visuals and personal responsibility messages increased intentions through severity; however, these messages did not increase susceptibility or efficacy perceptions. These findings are like those reflected in climate change communication. If individuals feel responsible, they may experience perceptions of shame or powerlessness that can affect response efficacy [63]. Taking a cue from climate change research, future studies may be interested in analyzing other emotions such as humor or hope in relation to water pollution prevention.
A strength of the current study was the recruitment of individuals within a specific geographic area and watershed region and hence the ability to test messages across two different outcome variables. Viewing messages about standard pro-environmental behaviors such as recycling may be processed similarly across geographic areas in the United States. Yet, the messages that promoted taking part in a river cleanup day included information about a statewide day of action. Hence, this study was able to see how the proposed models operated in the context of habitual pro-environmental behaviors and geographically specific community action. The total effects models provide results that could be used to tailor messages to individuals to better promote pro-environmental behaviors, especially in the Chesapeake Bay watershed. Women were more likely to state that they would take part in pro-environmental behaviors, and they were more likely to show interest in seeking out policy information. These findings align with previous studies on sex and environmental behavior participation [64]. Individuals who identified as non-white were more likely to state that they would participate in a river cleanup day, compared to white participants. This finding provides further support for research that states diverse segments of the U.S. population are interested in the environment and these groups’ contributions to conservation efforts are underestimated [65]. Furthermore, individuals who identified as more liberal expressed higher intentions to take part in the three study behaviors. Virginia’s pollution diet plan is regulated by the EPA and news of efforts to reduce federal environmental protections may have played a role in threat perceptions, fear, and intentions [66]. Future attribution research may consider testing political messages across ideological spectrums for these environmental outcomes.
Regarding information seeking, the results suggested the dual importance of perceiving oneself and the government as responsible for protecting water quality. Overall, this study did not reveal strong effects for personal responsibility messages, which lends further evidence for a need to reevaluate the use of these appeals [7]. However, some degree of perceiving oneself as responsible is still important for engaging in environmental action as shown by the information seeking results. Taken together, these findings suggest the need to continue researching attribution, especially in circumstances highlighting roles of the government, industry, and all of stakeholders in protecting local watersheds.
4.1. Research Translation
A roundtable of watershed stakeholders guided the design of this study and so we had the opportunity to translate our findings into practice. It is important to publish information about research translation to provide example applications of results and bridge the research-practice gap [67]. First, we designed theory-driven messages for social media and trade publications to promote pro-environmental behaviors based on our results. Next, our roundtable held workshops in partnership with local Soil and Water Conservation Districts to inform citizens about government efforts to address water pollution, and to offer strategies for reducing fertilizer and pesticide use, including a government-funded cost-share landscaping program. Finally, we held public forums with Virginia’s Deputy Secretary of Natural Resources for the Chesapeake Bay to discuss the state’s role and responsibility in reducing pollution and to encourage public comment.
4.2. Study Limitations and Future Directions
Limitations of this research are worth noting. First, the three outcome measures analyzed in this study dealt with intentions for pro-environmental behaviors, river cleanup, and information seeking. A body of research (see [68] for review) suggests that environmental constraints and skills can hinder an individual from moving an intention to an action. Longitudinal designs could be used in future research to measure how attribution messages and visuals affect actual behaviors over a period. Measuring other forms of information seeking behaviors may be of interest in the future when studying policy engagement. This study was also limited by the fact that participants only viewed one simulated news article that corresponded with their randomly assigned condition. Throughout each news article, attribution messages were placed in four areas, however, this would still be considered a single-message design experiment. O’Keefe [69] suggests that scholars should aim past single message designs and find more robust ways to enhance message exposure. However, the small effects that were present in our findings were promising and may translate to larger effects with additional message exposure over time.
5. Conclusions
Overall, the findings reiterate the importance of fear visuals in communicating environmental threats and suggest a need for future research to analyze how to best communicate water quality threats that are invisible. Furthermore, the findings provide some support for moving past personal responsibility messages when framing behavior change. Environmental advocates should instead focus messages on the ways that governments and other stakeholders are working to protect the environment with shared responsibility highlighted.
Author Contributions
Conceptualization, N.H.O. and J.P.D.G.; methodology, N.H.O. and J.P.D.G.; formal analysis, N.H.O.; writing—original draft preparation, N.H.O.; funding acquisition, N.H.O. All authors have read and agreed to the published version of the manuscript.
Funding
This project has been funded wholly by the United States Environmental Protection Agency under assistance agreement 96383501-1 to the Virginia Department of Environmental Quality. The contents of this document do not necessarily reflect the views and policies of the Environmental Protection Agency, nor does the EPA endorse trade names or recommend the use of commercial products mentioned in this document.
Institutional Review Board Statement
The study was conducted in accordance with the Declaration of Helsinki, and approved by the Institutional Review Board (or Ethics Committee) of Virginia Commonwealth University # HM20015570.
Informed Consent Statement
Informed consent was obtained from all subjects involved in the study.
Data Availability Statement
The data presented in this study are available on request from the corresponding author.
Conflicts of Interest
The authors declare no conflict of interest. The funders had no role in the design of the study; in the collection, analyses, or interpretation of data; in the writing of the manuscript; or in the decision to publish the results.
References
- Howarth, C.; Waterson, B.; McDonald, M. Are European Climate Change Awareness Campaigns Targeting Correctly to Encourage Sustainable Travel? 2010. Available online: https://eprints.soton.ac.uk/207791/ (accessed on 1 July 2022).
- Cialdini, R.B.; Kallgren, C.A.; Reno, R.R. A Focus Theory of Normative Conduct: A Theoretical Refinement and Reevaluation of the Role of Norms in Human Behavior. In Advances in Experimental Social Psychology; Zanna, M.P., Ed.; Academic Press: Cambridge, MA, USA, 1991; pp. 201–234. [Google Scholar] [CrossRef]
- Walnum, H.J.; Simonsen, M. Does driving behavior matter? An analysis of fuel consumption data from heavy-duty trucks. Transp. Res. Part D Transp. Environ. 2015, 36, 107–120. [Google Scholar] [CrossRef]
- Molinario, E.; Kruglanski, A.W.; Bonaiuto, F.; Bonnes, M.; Cicero, L.; Fornara, F.; Scopelliti, M.; Admiraal, J.; Beringer, A.; Dedeurwaerdere, T.; et al. Motivations to Act for the Protection of Nature Biodiversity and the Environment: A Matter of “Significance”. Environ. Behav. 2020, 52, 1133–1163. [Google Scholar] [CrossRef]
- Obradovich, N.; Guenther, S.M. Collective responsibility amplifies mitigation behaviors. Clim. Chang. 2016, 137, 307–319. [Google Scholar] [CrossRef]
- Whitmarsh, L.; O’Neill, S.; Lorenzoni, I. Climate Change or Social Change? Debate within, amongst, and beyond Disciplines. Environ. Plan. A 2011, 43, 258–261. [Google Scholar] [CrossRef]
- Hagmann, D.; Ho, E.H.; Loewenstein, G. Nudging out support for a carbon tax. Nat. Clim. Chang. 2019, 9, 484–489. [Google Scholar] [CrossRef]
- Tobin, M. New Gallup Water Data Shows Rising Concern. Available online: https://waterpolls.org/gallup-water-data-pollution/ (accessed on 9 September 2022).
- Gaffield, S.J.; Goo, R.L.; Richards, L.A.; Jackson, R.J. Public health effects of inadequately managed stormwater runoff. Am. J. Public Health 2003, 93, 1527–1533. [Google Scholar] [CrossRef]
- Fissore, C.; Baker, L.A.; Hobbie, S.E.; King, J.Y.; McFadden, J.P.; Nelson, K.C.; Jakobsdottir, I. Carbon, nitrogen, and phosphorus fluxes in household ecosystems in the Minneapolis-Saint Paul, Minnesota, urban region. Ecol. Appl. 2011, 21, 619–639. [Google Scholar] [CrossRef]
- Kollmuss, A.; Agyeman, J. Mind the Gap: Why do people act environmentally and what are the barriers to pro-environmental behavior? Environ. Educ. Res. 2002, 8, 239–260. [Google Scholar] [CrossRef]
- Bryner, G. Cooperative instruments and policy making: Assessing public participation in US environmental regulation. Eur. Environ. 2001, 11, 49–60. [Google Scholar] [CrossRef]
- Hobbie, S.E.; Finlay, J.C.; Janke, B.D.; Nidzgorski, D.A.; Millet, D.B.; Baker, L.A. Contrasting nitrogen and phosphorus budgets in urban watersheds and implications for managing urban water pollution. Proc. Natl. Acad. Sci. USA 2017, 114, 4177–4182. [Google Scholar] [CrossRef]
- Barr, S. Are we all environmentalists now? Rhetoric and reality in environmental action. Geoforum 2004, 35, 231–249. [Google Scholar] [CrossRef]
- Blake, J. Overcoming the “value-action gap” in environmental policy: Tensions between national policy and local experience. Local Environ. 1999, 4, 257–278. [Google Scholar] [CrossRef]
- Bushell, S.; Buisson, G.S.; Workman, M.; Colley, T. Strategic narratives in climate change: Towards a unifying narrative to address the action gap on climate change. Energy Res. Soc. Sci. 2017, 28, 39–49. [Google Scholar] [CrossRef]
- Garðarsdóttir, R.B.; Andradóttir, H.Ó.; Thorsteinsson, T. Protect Me from What I Want: Understanding Excessive Polluting Behavior and the Willingness to Act. Sustainability 2020, 12, 5867. [Google Scholar] [CrossRef]
- Witte, K. Putting the fear back into fear appeals: The extended parallel process model. Commun. Monogr. 1992, 59, 329–349. [Google Scholar] [CrossRef]
- Baldassare, M.; Katz, C. The Personal Threat of Environmental Problems as Predictor of Environmental Practices. Environ. Behav. 1992, 24, 602–616. [Google Scholar] [CrossRef]
- Arbuthnot, J. The Roles of Attitudinal and Personality Variables in the Prediction of Environmental Behavior and Knowledge. Environ. Behav. 1977, 9, 217–232. [Google Scholar] [CrossRef]
- Selman, P.H.; Selman, P. Local Sustainability: Managing and Planning Ecologically Sound Places; SAGE: Singapore, 1996; Available online: https://play.google.com/store/books/details?id=mtnHKARLhDQC (accessed on 1 July 2022).
- Myrick, J.G.; Nabi, R.L. Fear arousal and health and risk messaging. Oxford Research Encyclopedia of Communication. 2017. Available online: https://oxfordre.com/communication/view/10.1093/acrefore/9780190228613.001.0001/acrefore-9780190228613-e-266 (accessed on 1 July 2022).
- Chen, M.-F. Impact of fear appeals on pro-environmental behavior and crucial determinants. Int. J. Advert. 2016, 35, 74–92. [Google Scholar] [CrossRef]
- Hart, P.S.; Feldman, L. Threat Without Efficacy? Climate Change on U.S. Network News. Sci. Commun. 2014, 36, 325–351. [Google Scholar] [CrossRef]
- Yzer, M.C.; Southwell, B.G.; Stephenson, M.T. Inducing Fear As a Public Communication Campaign Strategy. Available online: https://books.google.com/books?hl=en&lr=&id=B7J1AwAAQBAJ&oi=fnd&pg=PA163&dq=Yzer+Southwell+Stephenson+2012&ots=CxF7bNY8QF&sig=2NchywG_MIBW3YfwiIMjYnlfta4 (accessed on 1 July 2022).
- Perrault, E.K.; Clark, S.K. Sustainability attitudes and behavioral motivations of college students: Testing the extended parallel process model. Int. J. Sustain. High. Educ. 2018, 19, 32–47. [Google Scholar] [CrossRef]
- Armbruster, S.T.; Manchanda, R.V.; Vo, N. When Are Loss Frames More Effective in Climate Change Communication? An Application of Fear Appeal Theory. Sustainability 2022, 14, 7411. [Google Scholar] [CrossRef]
- Park, S. How celebrities’ green messages on Twitter influence public attitudes and behavioral intentions to mitigate climate change. Sustainability 2020, 12, 7948. [Google Scholar] [CrossRef]
- Beehler, G.P.; McGuinness, B.M.; Vena, J.E. Characterizing Latino anglers’ environmental risk perceptions, sport fish consumption, and advisory awareness. Med Anthr. Q. 2003, 17, 99–116. [Google Scholar] [CrossRef] [PubMed]
- Withanachchi, S.S.; Ghambashidze, G.; Kunchulia, I.; Urushadze, T.; Ploeger, A. Water Quality in Surface Water: A Preliminary Assessment of Heavy Metal Contamination of the Mashavera River, Georgia. Int. J. Env. Res. Public Health 2018, 15, 621. [Google Scholar] [CrossRef] [PubMed]
- Yamashita, S. Perception and Evaluation of Water in Landscape: Use of Photo-Projective Method to Compare Child and Adult Residents’ Perceptions of a Japanese River Environment. Available online: https://www.sciencedirect.com/science/article/pii/S0169204602000932 (accessed on 1 July 2022).
- Vyner, H.M. Invisible Trauma: The Psychosocial Effects of Invisible Environmental Contaminants. 1988. Available online: https://psycnet.apa.org/fulltext/1988-97092-000.pdf (accessed on 1 July 2022).
- Nicholson-Cole, S.A. Representing climate change futures: A critique on the use of images for visual communication. Comput. Env. Urban Syst. 2005, 29, 255–273. [Google Scholar] [CrossRef]
- Houts, P.S.; Doak, C.C.; Doak, L.G.; Loscalzo, M.J. The role of pictures in improving health communication: A review of research on attention, comprehension, recall, and adherence. Patient Educ. Couns. 2006, 61, 173–190. [Google Scholar] [CrossRef]
- Lipkus, I.M. Numeric, verbal, and visual formats of conveying health risks: Suggested best practices and future recommendations. Med. Decis. Mak. 2007, 27, 696–713. [Google Scholar] [CrossRef]
- Feldman, L.; Hart, P.S. Using Political Efficacy Messages to Increase Climate Activism: The Mediating Role of Emotions. Sci. Commun. 2016, 38, 99–127. [Google Scholar] [CrossRef]
- Hamann, K.R.S.; Reese, G. My influence on the world (of others): Goal efficacy beliefs and efficacy affect predict private, public, and activist pro-environmental behavior. J. Soc. Issues 2020, 76, 35–53. [Google Scholar] [CrossRef]
- Huang, H. Media use, environmental beliefs, self-efficacy, and pro-environmental behavior. J. Bus. Res. 2016, 69, 2206–2212. [Google Scholar] [CrossRef]
- Tannenbaum, M.B.; Hepler, J.; Zimmerman, R.S.; Saul, L.; Jacobs, S.; Wilson, K.; Albarracín, D. Appealing to fear: A meta-analysis of fear appeal effectiveness and theories. Psychol. Bull. 2015, 141, 1178–1204. [Google Scholar] [CrossRef] [PubMed]
- Popova, L. The extended parallel process model: Illuminating the gaps in research. Health Educ. Behav. 2012, 39, 455–473. [Google Scholar] [CrossRef] [PubMed]
- Heider, F. The Psychology of Interpersonal Relations; Wiley: New York, NY, USA, 1958. [Google Scholar] [CrossRef]
- Iyengar, S. How Citizens Think about National Issues: A Matter of Responsibility. Am. J. Pol. Sci. 1989, 33, 878–900. [Google Scholar] [CrossRef]
- Yang, Z.J.; Seo, M.; Rickard, L.N.; Harrison, T.M. Information sufficiency and attribution of responsibility: Predicting support for climate change policy and pro-environmental behavior. J. Risk Res. 2015, 18, 727–746. [Google Scholar] [CrossRef]
- Iyengar, S. Framing Responsibility for Political Issues. Ann. Am. Acad. Pol. Soc. Sci. 1996, 546, 59–70. [Google Scholar] [CrossRef]
- Doyle, J. Where has All the Oil Gone? BP Branding and the Discursive Elimination of Climate Change Risk. In Culture, Environment and Ecopolitics; Cambridge Scholars Publishing: Newcastle upon Tyne, UK; Available online: https://research.brighton.ac.uk/en/publications/where-has-all-the-oil-gone-bp-branding-and-the-discursive-elimina (accessed on 12 October 2022).
- Minor, J.; Boyce, G.A. Smokey Bear and the pyropolitics of United States forest governance. Political Geogr. 2018, 62, 79–93. [Google Scholar] [CrossRef]
- Bickerstaff, K.; Walker, G. Risk, responsibility, and blame: An analysis of vocabularies of motive in air-pollution(ing) discourses. Environ. Plan. A 2002, 34, 2175–2192. [Google Scholar] [CrossRef]
- Roulet, T.J.; Touboul, S. The Intentions with Which the Road is Paved: Attitudes to Liberalism as Determinants of Greenwashing. J. Bus. Ethics. 2015, 128, 305–320. [Google Scholar] [CrossRef]
- Hallman, W.K.; Wandersman, A. Attribution of Responsibility and Individual and Collective Coping with Environmental Threats. J. Soc. Issues 1992, 48, 101–118. [Google Scholar] [CrossRef]
- Kim, H.W.; Li, M.-H. Managing stormwater for urban sustainability: An evaluation of local comprehensive plans in the Chesapeake Bay watershed region. J Env. Plan. Manag. 2017, 60, 1702–1725. [Google Scholar] [CrossRef]
- Tabor, C.W.; Virts, M.; LeRose, G.; Jones, M. Chesapeake Bay TMDL Phase II Watershed Improvement Plan BMP Strategy Analysis for the City of Richmond, Virginia. Proc. Water Environ. Fed. 2013, 2013, 6005–6016. [Google Scholar] [CrossRef]
- Bolsen, T.; Druckman, J.N.; Cook, F.L. Communication and Collective Actions: A Survey Experiment on Motivating Energy Conservation in the U.S. J. Exp. Political Sci. 2014, 1, 24–38. [Google Scholar] [CrossRef]
- Survey Basic Overview. Available online: https://www.qualtrics.com/support/survey-platform/survey-module/survey-module-overview/ (accessed on 12 October 2022).
- Kim, S.; Jeong, S.-H.; Hwang, Y. Predictors of Pro-Environmental Behaviors of American and Korean Students: The Application of the Theory of Reasoned Action and Protection Motivation Theory. Sci. Commun. 2013, 35, 168–188. [Google Scholar] [CrossRef]
- Lin, T.T.C.; Bautista, J.R. Predicting Intention to Take Protective Measures During Haze: The Roles of Efficacy, Threat, Media Trust, and Affective Attitude. J. Health Commun. 2016, 21, 790–799. [Google Scholar] [CrossRef] [PubMed]
- Ajzen, I. Attitudes, Personality and Behaviour; McGraw-Hill Education (UK): Maidenhead, UK, 2005; Available online: https://play.google.com/store/books/details?id=ZbDlAAAAQBAJ (accessed on 1 July 2022).
- Hayes, A.F. Introduction to Mediation, Moderation, and Conditional Process Analysis, Second Edition: A Regression-Based Approach; Guilford Publications: New York, NY, USA, 2017; Available online: https://play.google.com/store/books/details?id=6uk7DwAAQBAJ (accessed on 1 July 2022).
- Damania, R.; Desbureaux, S.; Rodella, A.-S.; Russ, J.; Zaveri, E. Quality Unknown: The Invisible Water Crisis; World Bank Publications: Washington, DC, USA, 2019; Available online: https://play.google.com/store/books/details?id=gYSzDwAAQBAJ (accessed on 1 July 2022).
- Strauch, K.A. Invisible pollution: The impact of pharmaceuticals in the water supply. AAOHN J. 2011, 59, 525–532. [Google Scholar] [CrossRef] [PubMed]
- Noar, S.M.; Zimmerman, R.S. Health Behavior Theory and cumulative knowledge regarding health behaviors: Are we moving in the right direction? Health Educ. Res. 2005, 20, 275–290. [Google Scholar] [CrossRef]
- Willoughby, J.F.; Smith, H. Communication Strategies and New Media Platforms: Exploring the Synergistic Potential of Health and Environmental Communication. Sci. Commun. 2016, 38, 535–545. [Google Scholar] [CrossRef]
- Avery, E.J.; Park, S. HPV vaccination campaign fear visuals: An eye-tracking study exploring effects of visual attention and type on message informative value, recall, and behavioral intentions. Public Relat. Rev. 2018, 44, 321–330. [Google Scholar] [CrossRef]
- Wang, S.; Leviston, Z.; Hurlstone, M.; Lawrence, C.; Walker, I. Emotions predict policy support: Why it matters how people feel about climate change. Glob. Environ. Chang. 2018, 50, 25–40. [Google Scholar] [CrossRef]
- Brough, A.R.; Wilkie, J.E.B.; Ma, J.; Isaac, M.S.; Gal, D. Is Eco-Friendly Unmanly? The Green-Feminine Stereotype and Its Effect on Sustainable Consumption. J. Consum. Res. 2016, 43, 567–582. [Google Scholar] [CrossRef]
- Pearson, A.R.; Schuldt, J.P.; Romero-Canyas, R.; Ballew, M.T.; Larson-Konar, D. Diverse segments of the US public underestimate the environmental concerns of minority and low-income Americans. Proc. Natl. Acad. Sci. USA 2018, 115, 12429–12434. [Google Scholar] [CrossRef] [PubMed]
- Mihelcic, J.R.; Rains, M. Where’s the Science? Recent Changes to Clean Water Act Threaten Wetlands and Thousands of Miles of Our Nation’s Rivers and Streams. Environ. Eng. Sci. 2020, 37, 173–177. [Google Scholar] [CrossRef]
- Hirschkorn, M.; Geelan, D. Bridging the Research-Practice Gap: Research Translation and/or Research Transformation. Alta. J. Educ. Res. 2008, 54. [Google Scholar] [CrossRef]
- Sheeran, P.; Webb, T.L. The intention-behavior gap. Soc. Pers. Psychol. Compass 2016, 10, 503–518. [Google Scholar] [CrossRef]
- O’Keefe, D.J. Persuasion: Theory and Research; SAGE Publications: Thousand Oaks, CA, USA, 2015; Available online: https://play.google.com/store/books/details?id=HXq3BgAAQBAJ (accessed on 1 July 2022).

Publisher’s Note: MDPI stays neutral with regard to jurisdictional claims in published maps and institutional affiliations. |
© 2022 by the authors. Licensee MDPI, Basel, Switzerland. This article is an open access article distributed under the terms and conditions of the Creative Commons Attribution (CC BY) license (https://creativecommons.org/licenses/by/4.0/).