Article

Green Investment Decision and Coordination in a Retailer-Dominated Supply Chain Considering Risk Aversion

School of Management, Harbin University of Commerce, Harbin 150028, China
*
Author to whom correspondence should be addressed.
Sustainability 2022, 14(20), 13606; https://doi.org/10.3390/su142013606
Submission received: 23 September 2022 / Revised: 13 October 2022 / Accepted: 17 October 2022 / Published: 20 October 2022

Abstract

:
With the sustainable development of the global economy, environmental problems and the green economy are increasingly becoming points of concern for the community. However, the large amount of capital invested in green technology and the high price of green products have become the key problems hindering the development of a risk-averse green supply chain. In order to promote the supply chain to increase green investment level, improve the green degree of products, and reduce the impact of risk aversion on green investment, this paper studies a two-echelon green supply chain composed of a risk-averse manufacturer and a risk-neutral retailer, in which the retailer is the leader and the manufacturer is the follower. We construct the wholesale price contract model, cost-sharing contract model, and two-part contract model, respectively, and use the Optimization Theory and Methods to discuss the impact of the three contracts on the green degree, expected utility of supply chain, retail price, consumer surplus, and social welfare. The results show that in the cost-sharing contract, compared with the wholesale price contract, the green degree of the product has been significantly improved, but the expected utility of the supply chain enterprises cannot achieve Pareto improvement, and the higher consumer environmental awareness will cause the manufacturer’s expected utility to decline. In the two-part tariff contract, compared with the wholesale price contract, the expected utility of supply chain enterprises achieves Pareto improvement, and the green degree of products is the highest in the three contracts; more importantly, in the two-part contract, the product green degree, the retail price, and the expected utility of the supply chain are not related to the manufacturer’s risk aversion; meanwhile, the retail price in the two-part tariff is the lowest among the three contracts, and the consumer surplus and social welfare are the highest. Our main contribution is that the two-part contract eliminates the influence of the manufacturer’s risk aversion on the above decision variable and realizes the unification of manufacturers, retailers, consumers, and social benefits. Finally, this paper uses numerical examples to verify the above conclusions and then analyzes the sensitivity of the supply chain system.

1. Introduction

As environmental problems become increasingly prominent, green operations have received substantial attention in recent years. Governments around the world have introduced different environmental regulations, such as emission permits, carbon emission limits, carbon taxes, and carbon trading, as well as energy-saving and low-carbon certification measures for products. For example, the No. 1 official document of China proposed that the government would take promoting green agricultural development as an important part of accelerating agricultural modernization and put forward relatively comprehensive policies and measures in 2021 [1]. In addition, with the aggravation of the environmental problems, more and more firms are not only concerned about their profits but are also considering their environmental performance. That is, many firms have an increasing awareness of environmental responsibility, and they are also expanding the production scale of green products. For example, BYD Co., Ltd., Shenzhen, China. stopped producing fuel vehicles to reduce environmental hazards. Producing clean and green products is also the main means for enterprises to enhance their market competitiveness. To maintain sustainable competitive advantages in the context of the green economy, many enterprises try to provide green products that are more energy efficient and environmentally friendly than ordinary products by introducing clean energy and investing in green technology. A global study by Accenture concluded that more than 80% of respondents are concerned about product green degrees when they make purchasing decisions (Hong et al. [2]). Improving the product green level is not only a crucial way for businesses to expand market demand and enhance competitiveness but also a principal element to be considered in improving supply chain competitiveness. For example, Toshiba has made a vision plan: environment outlook 2050, to better realize the rich and colorful life of humans and the earth (Yang et al. [3]); From 2016 to 2020, Shanghai General Motors plans to invest 26.5 billion yuan in efficient powertrain and new energy technology, and some retail commercial enterprises also attach great importance to green products (Yang et al. [4]). As a leader of responsible companies, Patagonia has invested a lot in improving global environmental issues like global warming. Adidas, a well-known sportswear manufacturer, optimizes its packaging and manufacturing materials to make its products more environmentally friendly. These retail giants that occupy a dominant position in the retail market because of their high market share dominate the sales of green products in the supply chain, such as Walmart and the online platform JD.com. In order to cater to consumers’ green preferences, these companies also encourage manufacturers to produce green products.
However, in practice, green products are produced by manufacturers and green investments are made by manufacturers, whereas the production cost of green products is higher and the price is more expensive than traditional products. In general, the development of green technology requires a great deal of money consisting of research and development costs, equipment renewal costs, etc. On the one hand, green investment requires additional investment costs, which increases the cost burden of manufacturers. On the other hand, especially in the highly competitive market, it is more difficult for manufacturers to obtain market demand information due to the increasingly diversified consumer demands and the differentiation of green preferences, and the increasing uncertainty of such demands leading to the enhancement of manufacturers’ risk awareness. Faced with the fierce competition environment and the potential risks brought by the uncertain demand, manufacturers tend to be more cautious and even take risk-averse behavior when making decisions. Under the risk-averse attitude of the manufacturer, the goal of the manufacturer is not only to maximize the expected profit or minimize the expected cost in the case of risk neutrality but to realize the operation goal of the enterprise under the premise of minimizing the loss. In other words, the different risk attitude held by the manufacturer has an increasingly prominent impact on the manufacturer’s decision-making. Chen et al. [5] found that enterprises with a risk-averse attitude pay more attention to how to maintain the stability of profits in production and operation, and they are more willing to sacrifice part of expected profits to avoid the lower fluctuation of profits in practice. In this case, manufacturers will not try to reduce the level of green investment, which results in a decline in the production of green products and harms the environment. Therefore, how to mitigate or eliminate the impact of manufacturers’ risk aversion on green investment has become a problem worth studying. As an attitude toward risk, risk aversion has been deeply studied in operation management. CvaR, VaR, standard deviation of profit, variance of profit, etc., have been proposed to help explore risks in operations, and as a performance measure, the mean-variance (MV) theory can capture the profit risk of the associated operations (Choi et al. [6]). Therefore, in this paper, we use the MV theory for conducting risk analysis. In addition, we also use the optimization theory to analyze the model.
A survey conducted by Accenture shows that 80 percent of consumers will consider green features before paying for a product, from which we know that environmentally conscious consumers like green products very much (Xiao et al. [7]). However, the production of green products requires additional green investment costs, and the price of green products is higher than that of ordinary products, which also reduces the purchasing power of many consumers and makes it difficult to promote green products. For instance, according to the research report “China Green Consumption Market Development Analysis in 2013” released by Zhiyan Data Research Center, about 66 percent of consumers in China believe that the price of green products is too high, which has become one of the important reasons that prevent green products from becoming mainstream consumer goods (zhou et al. [8]). Although the green degree of green products is greatly improved compared with that of ordinary products, the rise of the price that consumers are willing to pay for green products is lower compared with that of green products, which also leads to lower market demand for green products and difficult popularization of green products. Therefore, how to reduce the retail price of green products and promote the rise of market demand while improving the green degree of green products is also a problem worth studying.
Based on the contents described above, our study addresses the following questions:
(a)
In a retailer-dominated supply chain, which contract can achieve Pareto improvement of manufacturer and retailers’ profit, improve green degree, and reduce product prices to increase product market demand in the case of manufacturers’ risk aversion, two-part tariff contract, or cost-sharing contract?
(b)
How to reduce or eliminate the impact of manufacturers’ risk aversion on the green supply chain system?
(c)
What is the impact of a manufacturer’s risk aversion on consumer surplus and social welfare in a retailer-dominated green supply chain system? How is it possible to use the manufacturer’s risk aversion reasonably to maximize consumer surplus and social welfare?
The main purpose of this study is to find the answers to these questions. To achieve this, we assume that the manufacturer is risk aversion and the retailer is risk neutral, and we construct a two-echelon green supply chain composed of a risk-averse manufacturer and a risk-neutral retailer, in which the retailer as the leader and the manufacturer as the follower. The manufacturer is responsible for green investment in green products, and the retailer sells green products to consumers. They play a Stackelberg game with the maximization of their interests as the center. We discuss four modes, including the centralized supply chain, wholesale price contract, cost-sharing contract, and two-part tariff contract. Our analytical results show that the two-part tariff contract has more flexibility when coordinating the risk-averse green supply chain.
This study examined how to coordinate the green investment decision and pricing of the green supply chain composed of a risk-averse manufacturer and a risk-neutral retailer.
This paper has theoretical significance for improving the green degree of products and reducing retail prices by using manufacturers’ risk aversion. At the same time, it also provides references for the decision-making of consumers and the government and has certain practical value.
To summarize, our contributions are as follows:
(1)
We applied the mean-variance theory to the two-part tariff contract, which increases the application scope of the mean-variance theory. At the same time, we found that in the two-part tariff contract, the manufacturer‘s risk aversion has no effect on green degree, retail price, supply chain profit, and so on, which provides a theoretical basis for how to reduce and eliminate the impact of manufacturers’ risk aversion.
(2)
We proposed the two-part tariff contract to effectively relieve or eliminate the impact of the manufacturer’s risk aversion on the expected utility of the supply chain and green degree of the product, which realizes the Pareto improvement of supply chain enterprises, promotes the green investment level of the supply chain system, improves the market demand, and reduces the green product retail price effectively.
(3)
We found that the manufacturer’s risk aversion has a positive effect on social welfare in wholesale and cost-sharing contracts, which provides a theoretical basis for how to use the manufacturer’s risk aversion to improve social welfare when the two-part contract cannot be reached.
The rest of this paper is organized as follows. Section 2 presents the literature review related to this study. In Section 3, we describe the research questions and define the problem and assumptions. The equilibrium solution is obtained, and the optimal decision for each variable is solved in Section 4. Section 5 is mainly involved in model comparison and analysis. Section 6 is a numerical analysis that demonstrates the effectiveness of the proposed model. Finally, we summarize the results and provide recommendations for future research in Section 7.

2. Literature Review

In this section, we mainly review the literature relevant to this paper and highlight the motivation. Three streams of literature are closely related to this paper: green investment in a supply chain, risk aversion in a supply chain, and coordination of a green supply chain.

2.1. Green Investment in a Supply Chain

The first stream focuses on green investment in a supply chain. Some scholars have studied green investment and coordination of supply chains from different perspectives. From the existing literature, the literature on green investment in the supply chain mainly involves the following aspects. First, the literature involves research on green investment in the industry. For instance, Liu et al. [9] studied the green investment strategy of the shipping supply chain and analyzed the influence of green investment on the supply chain from the perspective of the green environment. Liu et al. [10] studied the green investment decision and coordination of the green agri-food supply chain. Zhang et al. [11] investigated that the green improvement degree is influenced by green technology investment, government intervention, and additional demand from customer green preferences in the petroleum industry. Second, the literature involves research on the supply chain members who make the green investment. Zhang et al. [12] analyzed manufacturers’ green investments in a competitive market with a common retailer. Third, some scholars studied the green investment of both manufacturers and retailers; for instance, Wang et al. [13] discussed who should invest in green technology in a decentralized supply chain under demand uncertainty. Wang et al. [14] found that the retailer, who was closer to the customer, was the more effective undertaker for green technology investment. Wang et al. [15] focused on the interaction between the e-tailer’s green investment strategy and the supplier’s choice of online channel format and found that the e-tailer would go green only when the upstream investment efficiency was high, regardless of the online channel format. Some scholars also focused on green investment in competitive and duopoly markets. Yang et al. [16] investigated the green investment of two competing manufacturers in a supply chain based on price and quality competition and analyzed the effect of green investment on the quality level of the product. Zhang et al. [17] developed a game-theoretical model to study green investment choice decisions of two horizontally differentiated firms in the presence of quality competition in a duopoly market. Shi et al. [18] investigated clean technology investment in a competitive environment for a supply chain consisting of one manufacturer and two retailers. Some scholars have studied green investment decisions in dual-channel supply chains. Wu et al. [19] studied green technology investment decisions in the closed-loop supply chain under government subsidy. Wang et al. [20] investigated the pricing policies for a dual-channel supply chain with green investment and sales efforts under uncertain demand. Bian et al. [21] analyzed the effect of environmental subsidies on the incentives of investing in green technologies in manufacturing amid the environmental concerns of consumers. Finally, the literature involves research on other aspects of green investment. Dong et al. [22] developed a stylized two-period model in which either the retailer or the manufacturer could decide to invest in green product development in the second period. Cheng et al. [23] developed a differential game model to study the effects of regulatory pressure and consumer environmental awareness on the channel members’ profits and manufacturers’ emissions in a supply chain. Sharma et al. [24] studied the Thomson Reuters/S-Network global indexes (as a proxy for sustainability-based indexes) and their corresponding alternatives to revisit the sustainable versus conventional investment dilemma in COVID-19 times. Li et al. [25] explicitly analyzed the impacts of consumer green awareness and product substitutability on profitability, social welfare, and environmental performance of the supply chain and its firms. Heydari et al. [26] analyzed the green channel coordination problem in a two-echelon supply chain where demand is a function of the retailer price and the product’s green quality in a green supply chain under consumer environmental awareness. Moon et al. [27] studied the investment problem in a fresh agricultural product supply chain based on fairness concerns considering three investment scenarios and finally coordinated the supply chain through a combined strategy of cost-sharing and revenue-sharing contract. The above research on green investment in the supply chain is rich. However, these researches studied the risk-neutral supply chain and rarely involved the risk-averse supply chain.

2.2. Risk Aversion in a Supply Chain

Our study is also related to the risk aversion of supply chain enterprises. Research on the risk aversion of supply chain enterprises has generally been conducted through mean-variance theory or Conditional Value at Risk (CVaR) criteria. Liu et al. [28] found that the double channel optimization of the supply chain channel is closely related to the attitude toward risk aversion and analyzed the influence of the risk on the channel. Huang et al. [29] studied the coordination and risk-sharing in a supply chain composed of a leading retailer and a risk-averse manufacturer and studied the manufacturer’s risk-aversion behavior using the CVaR criterion, proving that the contract could coordinate the supply chain. Ma et al. [30] constructed centralized and decentralized game models when the online channel’s demand is uncertain and analyzed the impacts of a set of factors, including consumer environmental awareness, product green level, and risk attitude on decision-making in the supply chain. Gupta et al. [31] investigated the impact of risk aversion on the profitability and pricing policy of the supply chain in the sharing economy. Liu et al. [32] focused on the supply chain composed of a risk-neutral supplier and a risk-averse retailer and analyzed the optimal decision of supply chain member enterprises considering the supply chain dominated by suppliers and by retailers, respectively. Deng et al. [33] analyzed the impact of decision-makers’ risk aversion on the operation of a low-carbon supply chain and found that decision-makers’ risk aversion was harmful to the economic development and environmental development of the supply chain and used the contract to coordinate the supply chain. Zhu et al. [34] proposed a decision-making model in which the Conditional Value-at-Risk (CVaR) criterion was used as the measure of risk assessment; they analyzed the optimal decision in centralized and decentralized situations, respectively, and verified that the joint contracts of revenue-sharing contracts and buyback contracts can coordinate the retailer’s risk-averse behavior. Chen et al. [35] set up a modified newsvendor model incorporating random default probability, and the manufacturer’s optimal production quantity was derived with the criterion of conditional value at risk and compared with the retailer’s optimal order quantity. Liu et al. [36] analyzed the impacts of market fluctuations and risk aversion on supply chain profits. Yan et al. [37] conducted a comparative analysis of the decisions before and after demand disruption to study dual-channel risk-averse supply chains using centralized and decentralized decision-making models. Batrancea et al. [38] examined the degree to which fiscal pressure influenced the financial performance of 88 publicly listed companies from the energy industry during a time frame of 16 years (2005Q1–2020Q3). Batrancea et al. [39] examined the determinants of economic growth in seven countries through the years 1990–2019, and they found that economic growth proxied by gross domestic product growth rate was mainly driven by bank capital to assets ratio across the three decades. Fan et al. [40] considered option contract application in a buyer-led supply chain, where both the buyer and supplier are risk-averse. The effects of the option price and option exercise price were investigated via conditional value-at-risk (CVaR) minimization.

2.3. Coordination of Green Supply Chain

There are many related studies on green supply chain coordination, and we will only review some related to this paper. Zhao et al. [41] used buy-back contracts and revenue-sharing contracts to coordinate the supply chain of retailers with risk aversion. Yang et al. [42] studied the decisions and coordination of the green supply chain under the retailer’s reciprocal preference, and the cost-sharing joint commission contract was proposed to realize Pareto improvement. However, in this paper, we found that cost-sharing contracts do not enable Pareto improvement. Ma et al. [43] studied green supply chain coordination issues arising out of a green supply chain consisting of a manufacturer and a retailer in a cost-sharing contract with uncertain information. Zhang et al. [11] analyzed green supply chain coordination through which high supply chain performance can be achieved and green improvements and customer green preferences are considered in the petroleum industry; however, the paper did not consider manufacturers’ risk aversion and analyzed green supply chain coordination in the petroleum industry to achieve high supply chain performance, considering green improvement and customer green preferences. Heydari et al. [26] initiated the channel coordination and, to establish a win-win outcome for both parties, a hybrid of “greening cost sharing” and “revenue sharing” contract (HGRS) was developed. Cao et al. [44] designed a cost-sharing contract and a buyback contract to coordinate the greening effort decisions and further investigated the impact of the green standards at different stages of the green supply chain. He et al. [45] designed the green innovation effort level parameters, and the constraint factor of the green preference of consumers at the market end was applied to discuss the incentive strategy of cost sharing led by manufacturers. Bai et al. [46] studied the green agricultural products supply chain, which is dominated by the farmers, and found that the two sides of a cost-sharing contract based on bargaining achieved supply chain coordination, which is significantly different from this paper. This study analyzes the green supply chain system, and the main finding is that the cost-sharing contract cannot realize the Pareto improvement of supply chain members, while the two-part contract can achieve Pareto improvement. Zhou et al. [8] studied how to improve the demand for green products in a risk-neutral green supply chain, and we focus on the impact of risk aversion on supply chain decisions and how to improve the green degree of products and promote the green investment level of supply chain members. Gao et al. [47] proposed a two-part tariff contract allowing supply chain members to make suitable decisions to obtain more profits while greening the supply chain. Xu et al. [48] discussed the supply chain coordination with marketplace mode and reselling mode after considering the green technology investment in the blockchain era. Zhu et al. [49] explored the coordination mechanism of cost sharing for green food production and marketing between a food producer and a supplier who both contribute to the sales of green food. We summarize the important literature on the coordination of green supply chains in Table 1.
According to the above discussion and analysis, there has been much research on green supply chain coordination in the past several years. However, there are some gaps in the existing research as follows.
First, the existing research did not comprehensively consider the influence of manufacturers’ risk aversion on green investment, consumer surplus, and social welfare; for instance, Liu et al. [10] and Wang et al. [13]. This paper studied green investment considering the manufacturer’s risk aversion, and most existing research studied the retailer’s aversion.
Second, the existing research did not use a two-part tariff contract and cost-sharing contract to coordinate the risk-averse green supply chain; for instance, Liu et al. [9], Cao et al. [44], and Bai et al. [46], and so on. This paper compared the two-part tariff contract and cost-sharing contract considering the manufacturer’s risk aversion. The closest references to this paper are [29] and [47], but [29] proposed a combined contract composed of option and cost-sharing instead of the two-part tariff contract and cost-sharing contract to coordinate the supply chain, and [8] did not consider the impact of manufacturers’ risk aversion on the supply chain, the consumer surplus, and social welfare.
Third, the existing research rarely considered retailer-dominated supply chain coordination considering manufacturers’ risk aversion in a green supply chain; for instance, Ma et al. [30], Bai et al. [46], and so on.
In addition, the existing research rarely compared the coordination effects of cost-sharing contracts and two-part tariff contracts in a green supply chain.
We also point out how our study differs from these streams of research in Table 2. Based on the existing research results, we construct a two-echelon green supply chain composed of a risk-averse manufacturer and a risk-neutral retailer and analyze four modes, including the centralized supply chain, wholesale price contract, cost-sharing contract, and two-part tariff contract. We aim to coordinate the green supply chain by considering the manufacturer’s risk aversion and exploring the impact of the manufacturer’s risk aversion on the retailer-dominated green supply chain system.

3. Problem Description and Model Formulation

3.1. Problem Description

In this paper, we consider a green supply chain composed of a risk-averse manufacturer and a risk-neutral retailer, in which the retailer is the leader and the manufacturer is the follower. The manufacturer produces only one kind of agricultural product. The retailer places orders with the manufacturer for produce and sells it to consumers. To meet the requirements of national environmental protection and consumers’ green preferences, the manufacturer must make necessary green investments to produce this kind of green product. The manufacturer mainly introduces advanced equipment, improves technical means, and employs workers to make green investments to reduce the harm of the product to the environment in the production process and increase the green degree of the products. The manufacturer’s green investment will be passed on to consumers through information, which will increase sales. As the dominant party of green investment, the manufacturer must invest a lot of capital in the process of green production. Due to market uncertainty and the characteristics of risk aversion, the manufacturer will reduce or not carry out green investment, which will reduce the output and green investment level. If the retailer (he) wants to obtain the maximum profit, on the one hand, he should meet the market demand and expand market sales; on the other hand, he should improve the green level of agricultural products. The manufacturer (she) will try her best to reduce the cost of green investment and increase profits to pursue profit maximization, while the retailer will pay more attention to green investment and expect the farmer to increase the green investment levels. Therefore, how to coordinate the supply chain to achieve optimal green investment and maximize the interests of both sides becomes a key issue. Based on the above analysis, we construct a Stackelberg game model of a two-echelon supply chain composed of a manufacturer and a retailer to analyze the optimal decision of both parties and coordinate the supply chain.
Without loss of generality, we have made several principal assumptions, which are summarized as follows:
Assumption 1.
Both upstream and downstream parties in the supply chain are rational and make decisions on maximizing their interests. The retailer is the leader of the supply chain and the manufacturer is the follower of the supply chain.
Assumption 2.
Similar to Ghosh et al. [53], we assume that consumers are sensitive not only to the price but also to the green degree of the product. The higher the green degree is, the more consumers prefer it, and the more the market sells.
Assumption 3.
The manufacturer produces only one kind of product and must make necessary green investments to meet the requirements of government regulation and consumer environmental awareness. The manufacturer’s production capacity fully meets the market demand.
Assumption 4.
The manufacturer is cautious about the market uncertainty caused by green investment and is not willing to make green investments. The manufacturer is risk-averse and the retailer is risk-neutral. Similar to Bai et al. [50], we only consider the market demand uncertainty caused by green investment, which follows a normal distribution and satisfies the mean-variance theory.
Assumption 5.
To ensure that the green investment cost is a convex function, we assume that the range of investment cost coefficient meets k > β 2 .
In this work, we use the notations presented in Table 3.

3.2. Model Formulation

Based on the above assumptions and referring to Gumani et al. [54], the market sales of green products meet the linear demand function, and the market demand of green products is expressed as the following equation: q ( p , g ) = α b p + β g . Where α ( α > 0 ) is basic market size, b ( b > 0 ) is the price elasticity coefficient. Referring to Wang et al. [55], to simplify the study, we let b = 1 . p is retail price, and β is consumer environmental awareness coefficient. The higher the retail price is, the lower the market sales. The bigger β is, the greater the market sales. ω is wholesale price. Let p > ω > 0 , α b p > 0 . A similar linear demand function has been widely used in green supply chains, such as Moon et al. [27]. In line with Bai et al. [50], ε is used to represent the market uncertainty caused by green investment, ε N 0 , σ 2 . The market demand function can be revised as follows: q ( p , g ) = α p + β g + ε . η is the risk aversion degree of supply chain members. The higher η is, the higher the risk aversion degree. We assume that the manufacturer is risk-averse and the retailer is risk-neutral; namely, η > 0 . Referring to Ghosh et al. [56], the manufacturer needs to pay extra costs for green investments, which has a quadratic relationship with the green degree: C g = 1 2 k g 2 , where k is the investment cost coefficient and k > 0 . Similar to Liu et al. [9], k actually represents investment efficiency; when k is larger, the lower the investment efficiency is, and the same green level needs to spend more costs.
The subscripts m , r and s c present manufacturer, retailer, and supply chain, respectively. The superscript c , w p , c s , T P T present the centralized supply chain, wholesale price contract, cost-sharing contract, and two-part tariff contract, respectively. Based on the above assumption, the profit function of the manufacturer and the retailer are as follows:
π m = ω α p + β g + ε 1 2 k g 2
π r = p ω α p + β g + ε
According to the mean-variance theory and the research of Xiao et al. [57], the expected utility functions of both parties are as follows:
U π m = E π m η V a r π m = ω α p + β g 1 2 k g 2 η ω 2 σ 2
U π r = E π r = p ω α p + β g

4. Game Model of Upstream and Downstream Joint Green Investment

4.1. Centralized Supply Chain Decision Model

In the centralized supply chain, the manufacturer and the retailer make integrated decisions as a whole to maximize the overall expected utility of the supply chain by determining the optimal green investment level and the optimal retail price. The decision model of the expected utility of the supply chain is:
max p , g U ( π s c ) = p α p + β g 1 2 k g 2 η ω 2 σ 2
Theorem 1.
In the centralized supply chain, the optimal product green degree of the integrated enterprise is g c * = α β 2 k β 2 , p c * = α k 2 k β 2 . The expected utility of the green supply chain system is U ( π s c ) c * = α 2 k 2 2 k β 2 .
Proofs of some Theorems and Lemmas can be seen in the Appendix A.
We can see that in the centralized supply chain, the optimal decision variable is not related to the risk aversion of the manufacturer, which is in line with Liang et al. [58].

4.2. Wholesale Price Contract Model

Due to the double marginalization of the supply chain, wholesale price contract is often unable to realize supply chain coordination. However, as the most common form of decentralized decision-making, a wholesale price contract is often used as a reference to discuss supply chain coordination. In a wholesale price contract, for each unit of product, the retailer pays the wholesale price ω to the manufacturer, so the total amount of transfer payments the manufacturer receives from the retailer at this time is ω q . In the retailer-led green supply chain, a Stackelberg game is played between the manufacturer and the retailer. First, the retailer announces the marginal profit of the unit product. The manufacturer then decides both the wholesale price and green degree level of each unit of product. We let p = ω + m and substitute it into Equations (3) and (4). The manufacturer’s decision model is:
max ω , g U ( π m ) = ω α ω + m + β g 1 2 k g 2 η ω 2 σ 2
The retailer’s decision model is:
max m U π r = max m E π r = m α m + ω + β g
We solve it by backward induction, and we have Theorem 2
Theorem 2.
In the wholesale price contract, the retailer’s optimal marginal profit is m w p * = α 2 , and the manufacturer’s optimal wholesale price is ω w p * = α k 2 2 k + 2 η k σ 2 β 2 , the optimal green degree level is g w p * = α β 2 2 k + 2 η k σ 2 β 2 , the optimal market demand q w p * = α k + 2 η k σ 2 2 2 k + η k σ 2 β 2 , the maximum expected utility of the manufacturer and the retailer are U ( π m ) w p * = α 2 k 8 2 k + η k σ 2 β 2 , U ( π r ) w p * = α 2 k + 2 η k σ 2 4 2 k + η k σ 2 β 2 , the total expected utility of the green supply chain system is U ( π s c ) w p * = α 2 k 3 + 4 η σ 2 8 2 k + η k σ 2 β 2 .
We compare the optimal value in the wholesale price contract with the optimal value in the centralized supply chain and obtain the following lemma.
Lemma 1.
Considering the environmental awareness of consumers and the risk aversion of manufacturers, the wholesale price contract cannot realize the coordination of the green supply chain led by the retailer, and the green degree of the green product also shows a downward trend; namely, U ( π s c ) w p * < U ( π s c ) c * , g w p * < g c * .
According to Lemma 1, compared with the centralized supply chain, the green degree and expected utility of the green supply chain in the wholesale price contract show a downward trend, which reflects the double marginalization effect of the supply chain. Therefore, to stimulate the green input behavior of supply chain manufacturers, improve the level of green degree, eliminate the double marginalization effect of the supply chain, and achieve Pareto improvement, other measures must be adopted for supply chain coordination. We further discuss cost-sharing contracts and two-part tariff contracts below.

4.3. Cost-Sharing Contract Model

The cost-sharing contract is a commonly used supply chain coordination contract. In the retailer-led green supply chain system, the retailer proposes to share a proportion of γ the green investment cost, and the manufacturer shares a proportion of ( 1 γ ) the green investment cost to motivate the manufacturer to make green investments and coordinate the supply chain. The decision-making sequence of both parties is as follows: the retailer decides the cost-sharing ratio and marginal profit based on the principle of maximizing its interests, and then the manufacturer decides the green degree and wholesale price of green products simultaneously. The expected utility functions of both parties are as follows:
U ( π m ) = ω α m + ω + β g 1 γ k g 2 / 2 ω 2 η σ 2
U ( π r ) = m α m + ω + β g γ k g 2 / 2
We solve it by backward induction, and we have Theorem 3.
Theorem 3.
In the cost-sharing contract, the optimal green degree is g γ = α β 1 γ 1 + 2 η σ 2 4 1 γ 2 k 1 + η σ 2 1 + 2 η σ 2 + β 2 3 γ 2 + 4 1 + γ η σ 2 , the optimal expected utility of the manufacturer and the retailer are as follows, respectively: U ( π m ) c s ( γ ) = 1 + γ 3 k α + 2 α η σ 2 2 β 2 + 2 1 + γ k 1 + η σ 2 2 4 1 + γ 2 k 1 + 3 η σ 2 + 2 η 2 σ 4 + β 2 2 4 η σ 2 + γ 3 + 4 η σ 2 2 , U ( π r ) cs γ = α 2 k 1 + γ 2 1 + 2 η σ 2 2 8 k 1 + γ 2 1 + 3 η σ 2 + 2 η 2 σ 4 + 2 β 2 2 4 η σ 2 + γ 3 + 4 η σ 2 .
Lemma 2.
In the retailer-led green supply chain system, the cost-sharing contract proposed by the retailer cannot coordinate the supply chain and achieve Pareto improvement of the green supply chain system.
Proof. 
To make the cost-sharing contract an effective coordination mechanism and enhance the green degree of products, the following conditions must be met:
U ( π r ) cs ( γ ) U ( π r ) w p U ( π m ) ( γ ) cs U ( π m ) w p g c s ( γ ) g w p
The above formula is equivalent to the following formula:
U ( π m ) cs U ( π m ) w p = 1 + γ 3 k α + 2 α η σ 2 2 β 2 + 2 1 + γ k 1 + η σ 2 2 4 1 + γ 2 k 1 + 3 η σ 2 + 2 η 2 σ 4 + β 2 2 4 η σ 2 + γ 3 + 4 η σ 2 2 α 2 k 8 2 k + η k σ 2 β 2 0
U ( π r ) cs U ( π r ) w p = α 2 β 2 γ k 1 + 2 η σ 2 1 + 2 γ + 4 1 + γ η σ 2 4 4 1 + γ 2 k 1 + η σ 2 1 + 2 η σ 2 + β 2 2 + 3 γ + 4 1 + γ η σ 2 β 2 2 k + η k σ 2 0
g c s ( γ ) - g w p 0
Under the constraints, we solve the above inequalities for k and γ as follows:
k > β 2 2 + 2 η σ 2 ,   γ h a s   n o   r e a l   r o o t s k > β 2 + 2 β 2 η σ 2 1 + η σ 2 ,   0 < γ < 1 + 4 η σ 2 2 + 4 η σ 2 k > β 2
From the above results, we can see that in the cost-sharing contract, the expected utility of the manufacturer cannot be higher than the expected utility in the wholesale price contract. Therefore, the green supply chain system cannot achieve supply chain coordination in the cost-sharing contract.
To further prove this conclusion, we analyze the cost-sharing contract. In the cost-sharing contract proposed by the retailer, the retailer has the dominant power over the supply chain. As a rational person, the retailer will pursue the maximization of its interests. When 2 U ( π r ) cs γ 2 < 0 , by first-order conditions, namely U ( π r ) cs γ = β 2 k 1 + γ α + 2 α η σ 2 2 1 4 η σ 2 + γ 3 + 4 η σ 2 2 4 k 1 + γ 2 1 + 3 η σ 2 + 2 η 2 σ 4 + β 2 2 4 η σ 2 + γ 3 + 4 η σ 2 2 = 0 , we have γ = 1 + 4 η σ 2 3 + 4 η σ 2 . Substituting it into each decision variable, we can obtain the value of each decision variable, including U ( π m ) cs = 4 k α + 2 α η σ 2 2 β 2 3 + 4 η σ 2 + 4 k + η k σ 2 β 2 3 + 4 η σ 2 2 16 k 1 + 3 η σ 2 + 2 η 2 σ 4 2 , we have U ( π m ) cs U ( π m ) w p = α 2 β 2 k 1 + 4 η σ 2 32 k 1 + η σ 2 1 + 2 η σ 2 + β 2 3 + 4 η σ 2 5 + 16 η 2 σ 4 8 16 k 1 + η σ 2 1 + 2 η σ 2 + β 2 3 + 4 η σ 2 2 2 β 2 2 k + η k σ 2 .
We analyze the above equation, and due to β 2 2 k + η k σ 2 < 0 , we can obtain a negative denominator; the positive and negative of the above formula are determined by the molecule. Due to k > β 2 , we have 32 k 1 + η σ 2 1 + 2 η σ 2 + β 2 3 + 4 η σ 2 5 + 16 η 2 σ 4 = 32 1 + η σ 2 1 + 2 η σ 2 k 3 + 4 η σ 2 5 16 η 2 σ 4 β 2 .
Due to 32 1 + η σ 2 1 + 2 η σ 2 3 + 4 η σ 2 5 16 η 2 σ 4 = 17 + 4 η σ 2 19 + 4 η σ 2 7 + 4 η σ 2 > 1 , we have 32 1 + η σ 2 1 + 2 η σ 2 k > 3 + 4 η σ 2 5 16 η 2 σ 4 β 2 , namely, 32 1 + η σ 2 1 + 2 η σ 2 k 3 + 4 η σ 2 5 16 η 2 σ 4 β 2 > 0 . Finality, we have U ( π m ) cs U ( π m ) w p < 0 .
The above formula is less than zero, which further proves that the cost-sharing contract cannot achieve Pareto improvement. Lemma 2 is proved. □
The equilibrium results are shown in Table 4 below.
We obtain Lemma 3 by analyzing the optimal sharing ratio.
Lemma 3.
γ η > 0 .
We can see from Lemma 3 that the optimal cost-sharing ratio is positively correlated with the manufacturer’s risk aversion in the cost-sharing contract in the retailer-dominated supply chain. As the manufacturer’s risk aversion increases, the optimal sharing ratio of the retailer will also increase, which indicates that for manufacturers with higher risk aversion, the retailer who pursues a higher green degree product will be willing to share a higher proportion of green investment costs.

4.4. Two-Part Tariff Contract Model

In a two-part tariff contract, the retailer provides the manufacturer with a wholesale price w and pays the manufacturer a transfer price F, and the manufacturer chooses to reject or accept the contract. First, the retailer provides a two-part contract ( ω , F ) to the manufacturer; second, the manufacturer decides the product’s green degree level g; finally, the retailer decides the marginal profit m of the unit product and the retailer price p = ω + m . The retailer orders from the manufacturer according to the market demand, and the manufacturer makes the optimal decision to produce and deliver the product to the retailer according to the order quantity. The expected utility functions for the manufacturer and retailer are as follows, respectively,
U ( π m ) = ω α ω + m + β g 1 2 k g 2 η f ω 2 σ 2 + F
U π r = m α m + ω + β g F
Theorem 4.
In a two-part contract supply chain system, the optimal expected utility of both parties is as follows, respectively, U ( π m ) T P T = α 2 k 8 2 k + η k σ 2 β 2 , U π r T P T = α 2 k 6 k + 8 η k σ 2 3 β 2 8 2 k β 2 2 k + 2 η k σ 2 β 2 .
Proof. 
To improve the green degree of green products in the supply chain, the retailer provides a ( ω , F ) contract to the manufacturer. In the centralized decision, the green degree is g c * = α β 2 k β 2 , Similar to Wang et al. [51] and Li et al. [52], by substituting the green degree of the centralized supply chain into Equation (15), we obtain
U π r = F + m m + α α β 2 β 2 2 k ω
We take the first derivative of Equation (16) with respect to marginal revenue and set it equal to zero; namely, U π r m = 2 m + α α β 2 β 2 2 k ω = 0 , we then obtain
m = 2 α k β 2 ω + 2 k ω 2 β 2 2 k
Therefore, we obtain p = m + ω = 2 α k β 2 ω + 2 k ω 2 β 2 2 k + ω , and we can further obtain the manufacturer’s expected utility function as follows:
U π m = α 2 β 2 k 2 β 2 2 k 2 α k ω β 2 2 k 1 2 1 + 2 η σ 2 ω 2 + F , due to 2 U π r m 2 = 2 < 0 , Equation (16) is a strictly concave function with respect to m and has a unique maximum. Therefore, (17) is its optimal value. The retailer’s optimization problem can be expressed as:
max ω , F U π r = 2 α k + β 2 2 k ω 2 4 β 2 2 k 2 F
s . t . U π m = α 2 β 2 k 2 β 2 2 k 2 α k ω β 2 2 k 1 2 1 + 2 η σ 2 ω 2 + F U π m w p
We solve (19) and obtain:
F = α 2 β 2 k 2 β 2 2 k 2 α 2 k 8 β 2 2 k + η k σ 2 + α k ω β 2 2 k + 1 2 1 + 2 η σ 2 ω 2
We put (20) into (18), and we obtain U 2 π r ω 2 = 1 2 2 η σ 2 < 0 ; (18) is a strictly concave function about ω , by the first-order condition, and we can obtain ω = c = 0 . The reason why the wholesale price is zero is that this paper does not consider the unit cost, which is similar to the conclusion of Li et al. [52]. We obtain F = 1 8 α 2 k 4 β 2 β 2 2 k 2 + 1 2 k + 2 η k σ 2 β 2 . The retail price can be further obtained, and the market demand is, respectively, p T P T = α k 2 k β 2 , q = α k 2 k β 2 . We can further obtain the expected utility of both parties and the supply chain. Theorem 4 is proved. □
We summarize the equilibrium results in the three contracts in Table 4 and Table 5.
where E 1 = 16 k 1 + 3 η σ 2 + 2 η 2 σ 4 β 2 3 + 4 η σ 2 2 , E 2 = 8 k + η k σ 2 β 2 5 + 4 η σ 2 . E 3 = 4 k + η k σ 2 β 2 3 + 4 η σ 2 .
Lemma 4.
The two-part tariff contract can achieve Pareto improvement of the expected utility of the manufacturer and retailer and can achieve the optimal green degree of green products.
Proof. 
To achieve Pareto improvement, the following conditions must be met:
U π r T P T U π r w p U ( π m ) T P T U ( π m ) w p g T P T g w p
From Table 4, we obtain U ( π m ) TPT U ( π m ) w p . Therefore, to achieve Pareto improvement, only the last two inequalities need to be solved. We obtain as follows:
U π r T P T U π r w p = α 2 k 2 k β 2 + 4 η σ 2 8 2 k β 2 2 k + η k σ 2 β 2 > 0
g T P T g w p = α β 2 k + 4 η k σ 2 β 2 2 2 k β 2 2 k + 2 η k σ 2 β 2 > 0
Therefore, the two-part tariff contract can achieve Pareto improvement of the expected utility of the supply chain and improve the green degree of the products. Lemma 4 is proved. □

5. Model Comparison and Analysis

By analyzing the relationship between risk aversion and the green degree in different contracts, we obtain the following lemma.

5.1. Green Degree Analysis of Green Products

Lemma 5.
In the three contracts, the green degree of green products has the following relationship g T P T * > g c s * > g w p * .
From the above lemma, we can see that the green degree of the product in the cost-sharing contract is higher than that in the wholesale price contract, and the green degree of the product in the two-part contract is higher than that in the cost-sharing contract, which is the highest among the three contracts. In the cost-sharing contract mode, the retailer shares the green investment cost of the manufacturer, and the manufacturer’s enthusiasm for green investment increases so that the green degree level of the product is higher. In the two-part contract, the manufacturer obtains fixed transfer payments from the retailer, and the enthusiasm for green investment is higher. Therefore, the green degree level is higher than the supply chain in the cost-sharing contract and the supply chain in the wholesale price contract.

5.2. Market Utility Analysis

Lemma 6.
In the three contracts, the manufacturer’s optimal wholesale price has the following relationship ω c s > ω w p > ω T P T .
From Lemma 6, we can see that in the cost-sharing contract, the wholesale price of the product is the highest, while the wholesale price in the two-part contract is the lowest. The reason is that in the cost-sharing contract, the manufacturer has increased the investment in green technology, and the green degree of the product has been greatly improved, which has led to an increase in product costs and an increase in wholesale prices. In the two-part contract, the retailer’s additional payment makes the two parties share the cost. Compared with the retailer’s non-sharing cost, the product cost is lower and the wholesale price is further reduced.
Lemma 7.
In the three contracts, the retailer’s optimal marginal profit and optimal pricing have the following relationship m T F T > m c s > m w p ; If k > 1 4 β 2 3 + 2 η σ 2 + 1 + 4 η σ 2 3 + η σ 2 , p c s > p w p > p T P T .
From Lemma 7, we can see that in the two-part tariff contract, the retailer’s marginal revenue is the highest. In the cost-sharing contract, the retailer’s marginal revenue is higher than that of the wholesale price contract. The retailer’s marginal revenue is the lowest. This is because in the two-part contract, the wholesale price of the goods given by the manufacturer to the retailer is the lowest, and the lower wholesale price greatly improves the marginal revenue of the retailer. In the cost-sharing contract, the manufacturer and the retailer share the investment cost. The manufacturer’s green investment is higher, the green degree is greatly improved, and the marginal income is improved so that the retailer’s marginal income is higher than the retailer’s marginal income in the wholesale price contract. We also know that in the cost-sharing contract, the market retail price of green products is the highest, and when the above conditions are met, the market retail price of green products in the two-part tariff contract is the lowest. Combined with the previous proposition, we can know that in the two-part tariff contract, the expected revenue of both sides of the supply chain achieves Pareto improvement, and the green degree of green products is the highest. In Lemma 7, we know that the retailer achieves the lowest retail price in the two-part tariff contract. Therefore, the two-part tariff contract can not only satisfy the upstream and downstream sides of the supply chain but also enable consumers to obtain green products with the lowest price and the highest green degree.
Lemma 8.
In the three contracts, the market demand for green products has the following relationship q T P T > q c s > q w p .
From Lemma 8, we can obtain that in the two-part tariff contract, the market demand for green products is the highest. In the cost-sharing contract, the market demand for green products is higher than that for green products in the wholesale price contract. The market demand for green products in the wholesale price contract is the lowest among the three contracts. The reason is that in the two-part tariff contract, the green degree of green products is the highest, and consumers with higher environmental awareness have greater demand for green products. In addition, in the two-part tariff contract, the retail price of green products is the lowest, which makes the market demand the largest. Similarly, in the cost-sharing contract, the green degree of green products is higher than that of green products in the wholesale price contract, and consumers’ preference for the green degree will make their sales volume higher than the market demand under the wholesale price contract.

5.3. Analysis of the Impact of Risk Aversion on Decision Variables
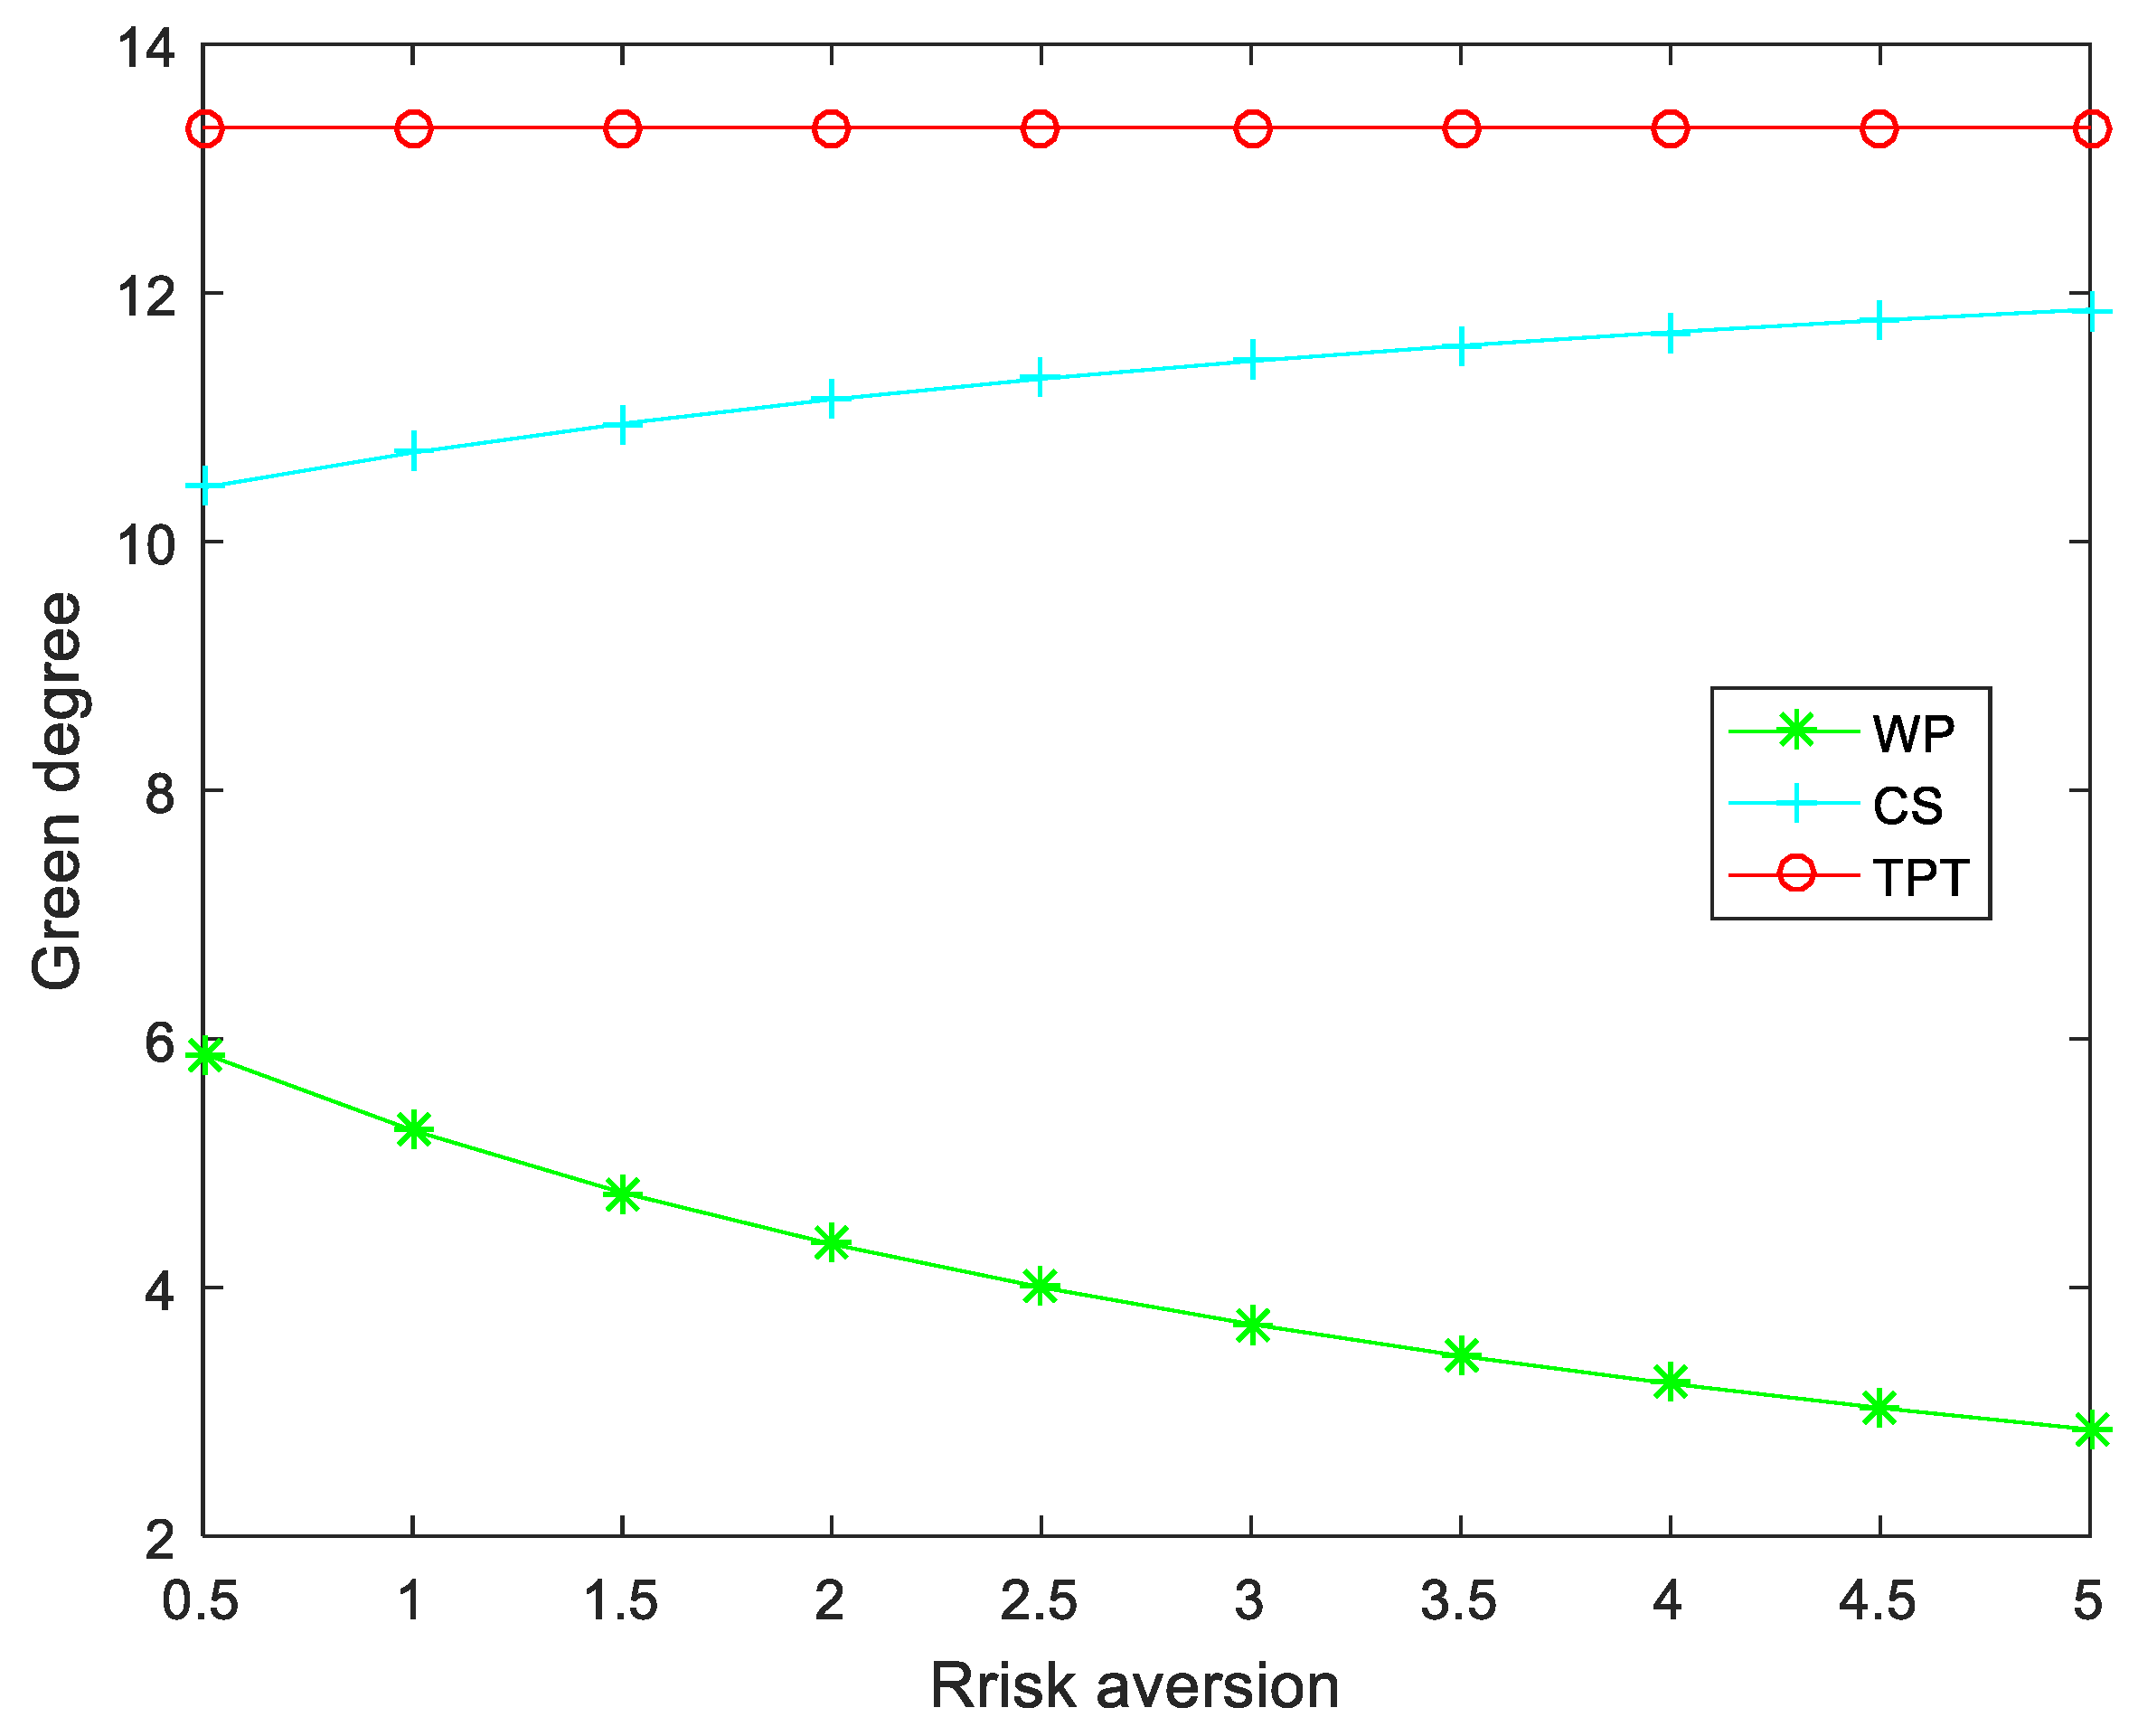
Lemma 9.
g w p η < 0 ; let η * = 2 1 4 σ 2 , if η > η * , we have g c s η > 0 ; If η < η * and k < β 2 3 + 4 η σ 2 2 8 1 + 2 η σ 2 2 , we have g c s η < 0 ; g T P T η = 0 .
From Lemma 9, we can obtain that in the wholesale price contract, the greater the risk aversion of the manufacturer, the smaller the green degree of the green product. In the cost-sharing contract, under certain conditions, the two are positively correlated, and when another condition is met, the two are negatively correlated. The green degree of the green product in the two-part contract has nothing to do with the risk aversion of the manufacturer. This is because, in the wholesale price contract, a risk-averse manufacturer will avoid risks in pursuit of profits. The greater the degree of risk aversion, the less willing they are to make green investments, resulting in a smaller green degree of green products. In the cost-sharing contract, when the risk aversion reaches the threshold, because the seller shares the green investment cost, the greater the risk aversion of the manufacturer, the higher the absolute value of the green investment cost shared by the retailer, which will increase the green investment of the manufacturer. Therefore, the green degree of green products is higher. In the two-part contract, due to the additional transfer payment of the retailer, the manufacturer gets additional income, so the green degree of the green product has nothing to do with risk aversion.
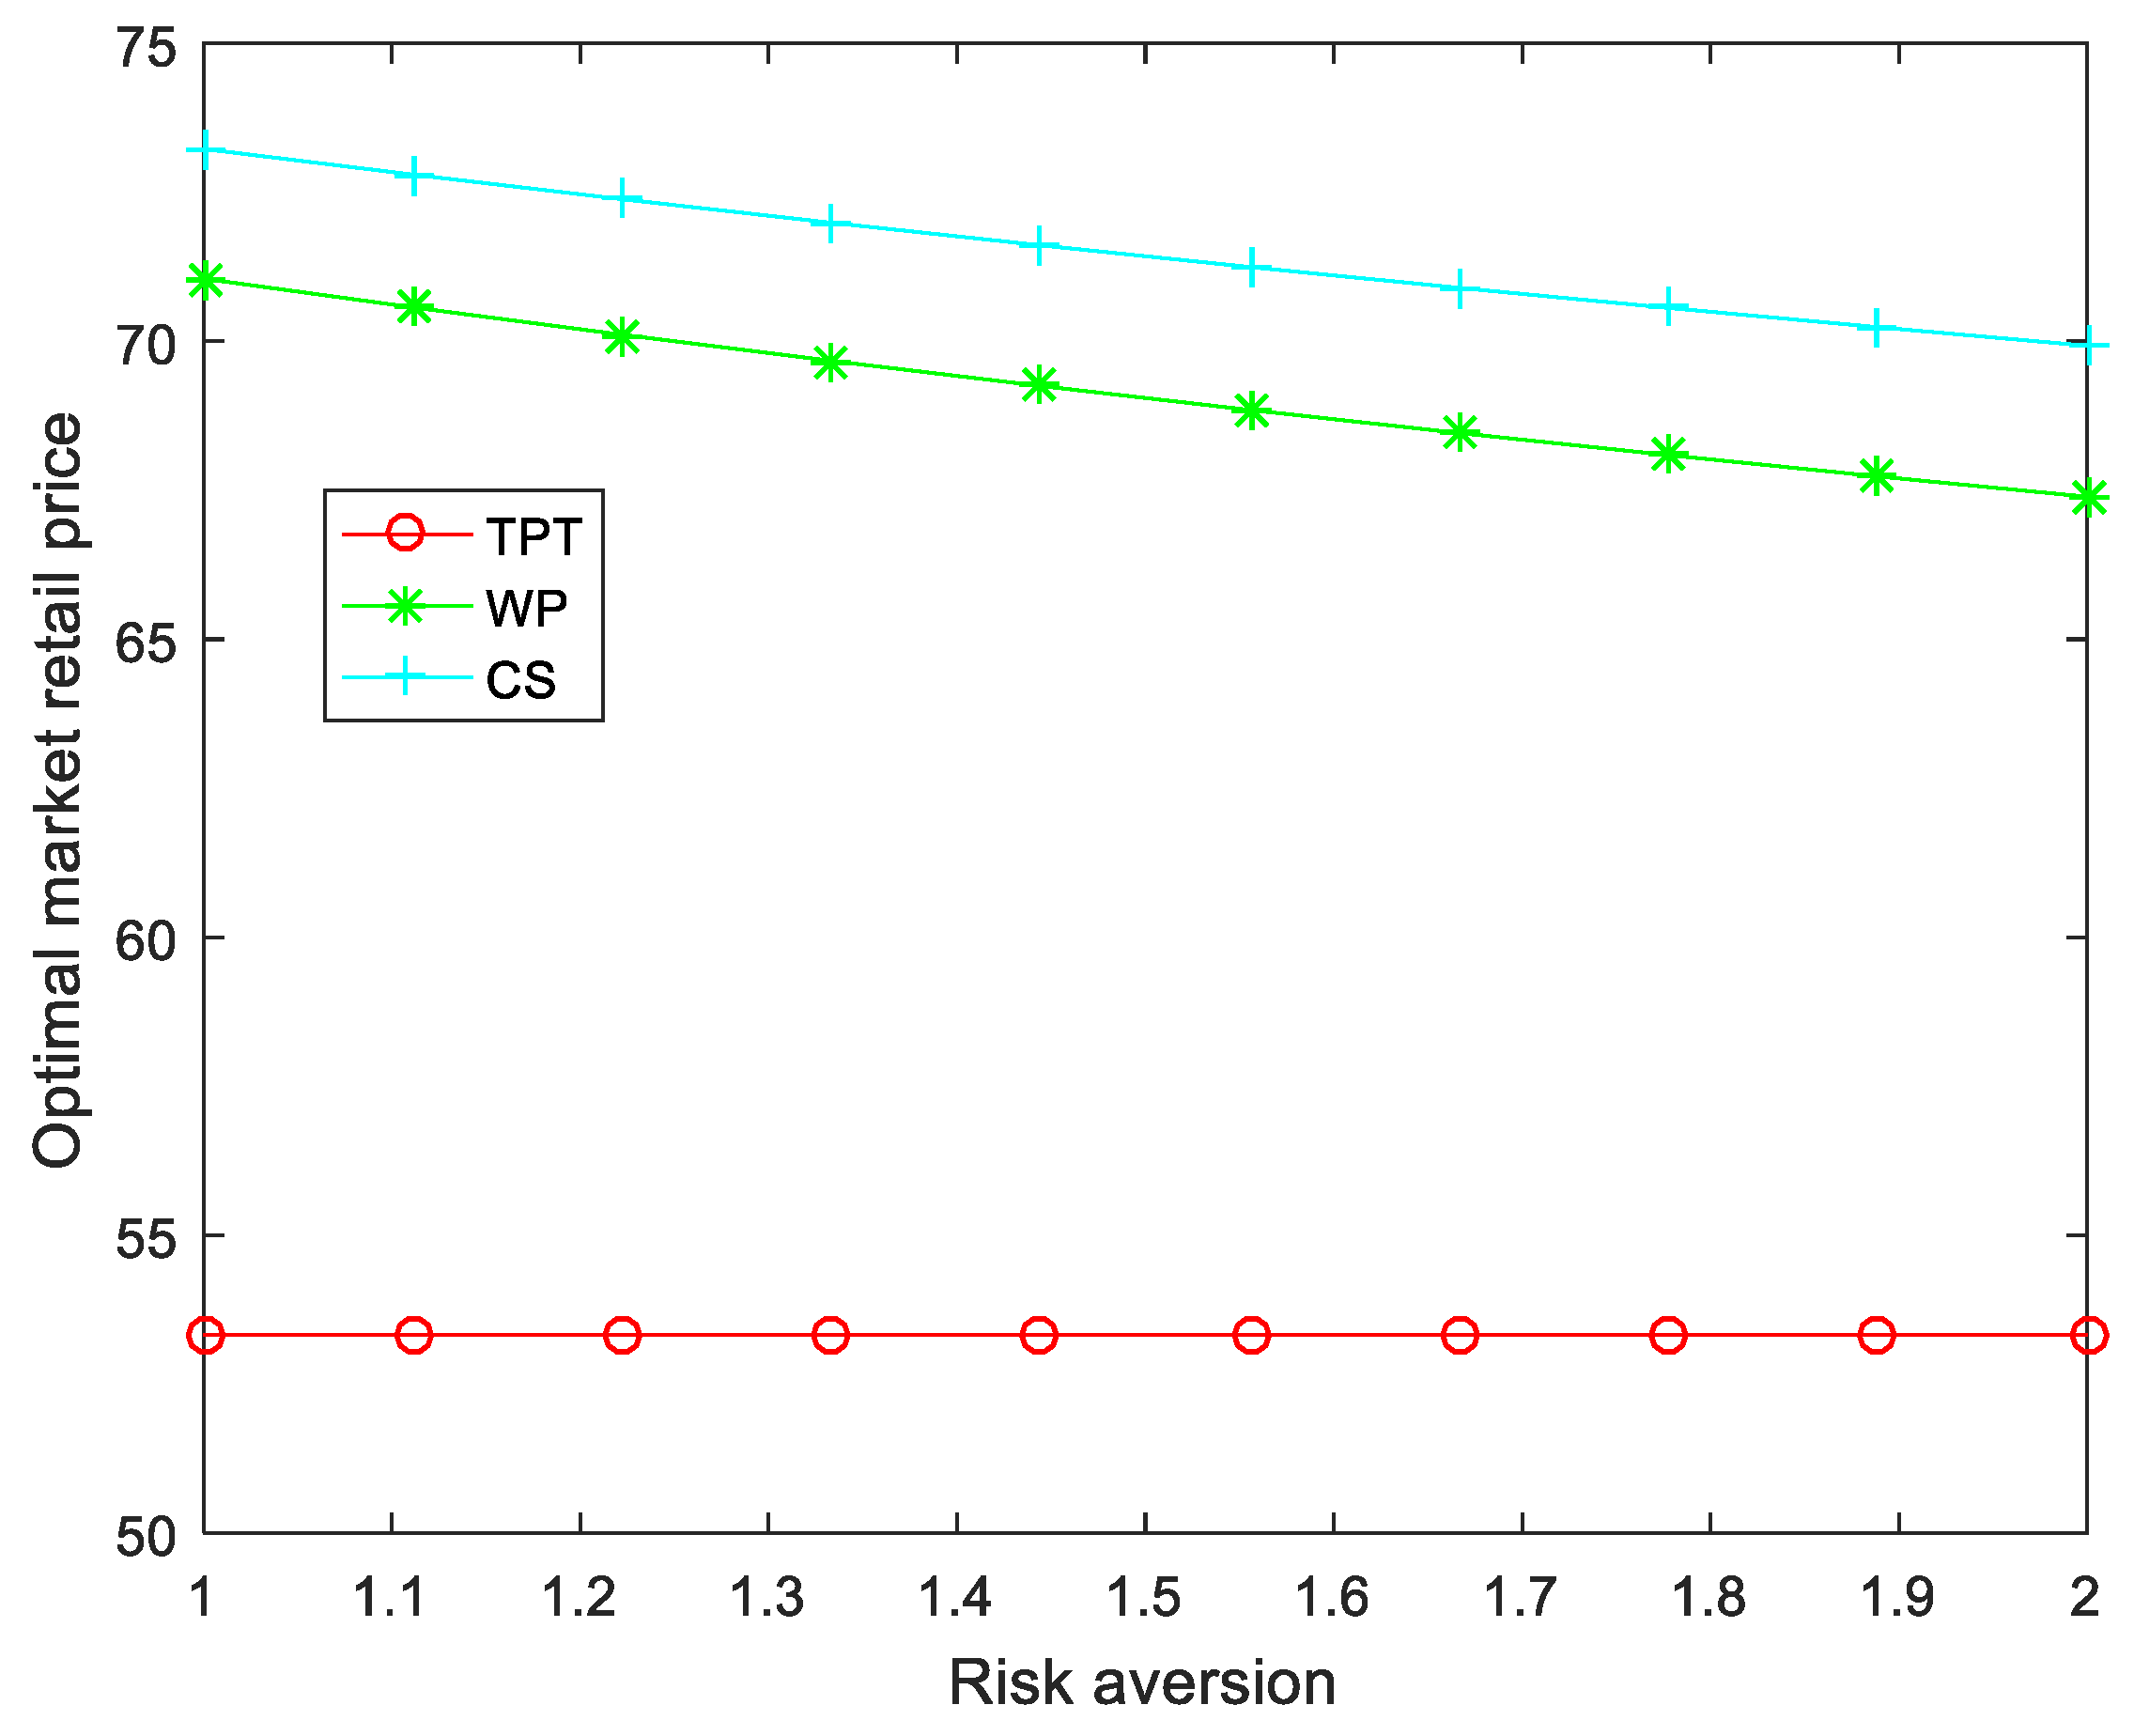
Lemma 10.
p w p η < 0 , p c s η < 0 , p T P T η = 0 .
From Lemma 10, we know that in the wholesale price contract and the cost-sharing contract, the retailer’s optimal retail price is negatively correlated with the manufacturer’s risk aversion, while in the two-part contract, the retailer’s optimal retail price is independent of the manufacturer’s risk aversion. The reason is that in the wholesale price contract and cost-sharing contract, with the increase of the manufacturer’s risk aversion, the green investment level of the manufacturer decreases, the green degree of the green product also decreases, and the demand for green products by environmentally conscious consumers also decreases, eventually leading to a lower retail price. In the two-part tariff contract, the retailer’s additional transfer payment to the manufacturer eliminates the manufacturer’s concern about the uncertainty of market demand caused by green investment so that the market demand for green products is independent of the manufacturer’s risk aversion and, ultimately, the price is also independent of the manufacturer’s risk aversion.
Lemma 11.
U π m w p η < 0 , U π r w p η > 0 ; U π m C S η < 0 , U π r C S η > 0 ; U π m T P T η < 0 , U π r T P T η > 0 .
From Lemma 11, we can see that in the three contracts, the manufacturer’s risk aversion is negatively correlated with its own expected utility and positively correlated with the retailer’s expected utility; that is, the greater the manufacturer’s risk aversion, the smaller the expected utility of the manufacturer and the greater the retailer’s expected utility. The reason is that compared with risk-neutral manufacturers, risk-averse manufacturers worry about the uncertainty of market demand due to green investment. Therefore, they will reduce the level of green investment, thus reducing the demand for products, which will lead to a decrease in expected utility. For risk-neutral retailers, retailers do not need to avoid the risk of uncertain market demand for green products, and the profits of supply chain channels will be more inclined to flow to retailers, resulting in higher risk aversion of the manufacturer and higher expected utility of the retailer.

5.4. Analysis of Consumer Surplus and Social Welfare

To further discuss the impact of green investment on consumers under three contracts, we introduce consumer surplus and social welfare to compare and analyze the impact on downstream markets.
For the consumer surplus of a single product, referring to Liu et al. [9], consumer surplus can be expressed as C S = p * p max q ( p ) d p . Where p * is the optimal retail price, p max is the maximum retail price, and we obtain the consumer surplus in three contracts as follows:
C S w p = α 2 k + 2 η k σ 2 2 8 β 2 2 k + η k σ 2 2 ,   C S c s = 8 α 2 k 2 1 + 2 η σ 2 4 16 k 1 + η σ 2 1 + 2 η σ 2 β 2 3 + 4 η σ 2 2 2 , C S T P T = α 2 k 2 2 β 2 2 k 2
Comparing the consumer surplus in the three contracts, we can obtain the following lemma:
Lemma 12.
C S T P T > C S C S > C S W P .
From Lemma 12, we can see that in the two-part tariff contract, the consumer surplus is the highest, while in the wholesale price contract, the consumer surplus is the lowest, and the consumer surplus in this sharing contract is higher than that in the wholesale price contract. The reason is that in the two-part contract, manufacturers have the highest level of green investment so that the green products have the highest green degree, the lowest market retail price, and the largest market demand. In the cost-sharing contract, manufacturers enhance the level of green investment, enhance the green degree of green products, cater to the green environmental awareness of consumers, and enhance consumer surplus. In the wholesale price contract, both manufacturers and retailers make decentralized decisions to maximize their respective interests. The green degree of green products is the lowest, and the consumer surplus is the lowest. Therefore, rational consumers should choose green products produced in the two-part contract.
Lemma 13.
C S w p η > 0 , C S c s η > 0 , C S T P T η = 0 ; C S w p k < 0 , C S C S k < 0 , C S T P T k < 0 ; C S w p β > 0 , C S C S β > 0 , C S T P T β > 0 .
From Lemma 13, we can see that consumer surplus is positively correlated with manufacturer risk aversion and consumer environmental awareness and negatively correlated with the green investment cost coefficient. This shows that the greater the manufacturer’s risk aversion, the higher the consumer’s awareness of environmental protection, the higher the consumer surplus, the greater the investment cost coefficient, and the smaller the consumer surplus. The reason is that in the case of greater manufacturer risk aversion, the manufacturer will reduce the level of green investment, and the green degree of green products will decline, resulting in price falls, so that consumers obtain more benefits, and in the case of higher consumer awareness of environmental protection, the green degree of the product is high, the manufacturer will cater to the needs of consumers, improve the green investment level of green products, and increase the welfare of consumers. When the investment cost coefficient increases, the effective green investment decreases, so the green degree of green products decreases, resulting in a decline in consumer surplus.
To further analyze the impact of green investment on social welfare under each contract, we refer to Niu et al. [59]; social welfare can be expressed as S W = U ( π m ) + U ( π r ) + C S + g ; therefore, we calculate the expected social welfare in the three contracts as follows:
S W w p = α 4 β 3 α β 2 k 3 + 4 η σ 2 + 8 β k + η k σ 2 + α k 2 7 + 6 η σ 2 3 + 2 η σ 2 8 β 2 2 k + η k σ 2 2
S W C S = 2 α G 2 G 3 G 4 + G 5 E 1 2 ,   S W T P T = α β 4 α β k + 3 α k 2 2 β 3 2 2 k β 2 2 .  
where, G 2 = 16 β k 1 + η σ 2 1 + 2 η σ 2 2 3 + 4 η σ 2 , G 3 = β 3 1 + 2 η σ 2 3 + 4 η σ 2 3 , G 4 = α k 3 + 4 η σ 2 5 + 4 η σ 2 β + 2 β η σ 2 2 , G 5 = 4 α k + 2 η k σ 2 2 7 + 6 η σ 2 3 + 2 η σ 2 .
Analyzing the social welfare in the three contracts, we can obtain the following lemma.
Lemma 14.
S W TPT > S W CS > S W w p .
From Lemma 14, we can see that the social welfare in the two-part tariff contract is significantly higher than that in the cost-sharing contract and the wholesale price contract, and the social welfare in the cost-sharing contract is higher than that in the wholesale price contract. The reason is that in the two-part tariff contract, the expected utility, green degree, and consumer surplus of the supply chain are the highest, so social welfare is also the highest. In the wholesale price contract, the supply chain expected utility, green degree, and consumer surplus are the lowest, so social welfare is the lowest. In the cost-sharing contract, the green degree and consumer surplus are higher than those in the wholesale price contract, so the social welfare is higher than that in the wholesale price contract.
Due to the complexity of the social welfare formula, the influence of related parameters on social welfare will be analyzed in the numerical analysis.

6. Numerical Analysis

In this section, we mainly verify the correctness and validity of the above conclusions through numerical examples. Firstly, we analyze the impact of consumer environmental awareness, green investment cost coefficient, and risk aversion on the green degree and channel profit of green products in different contracts through numerical simulation. Secondly, the influence of the change of important parameter values on the conclusion is analyzed. Finally, the sensitivity analysis of the green supply chain system is carried out. The assignment of important parameters satisfies the constraints in this paper. We assume α = 100 , β = 0.5 , σ = 0 . 5 , k = 1.5 , and η = 1.5 , which satisfy the constraints condition in this paper, especially k > 1 4 β 2 3 + 2 η σ 2 + 1 + 4 η σ 2 3 + η σ 2 .

6.1. Impact of Risk Aversion on the Green Degree and Channel Expected Utility

From Figure 1, we can see that in the wholesale price contract, with the increase in risk aversion, the green degree of green products is decreasing. In the cost-sharing contract, with the increase in risk aversion, the green degree is increasing. In the wholesale price contract, the green degree of the product has nothing to do with the risk aversion of the manufacturer. The reason is that in the wholesale price contract, manufacturers and retailers, as independent subjects, make decisions centered on maximizing their respective profits, and manufacturers will actively avoid risks and reduce possible losses. In the cost-sharing contract, when the manufacturer’s risk aversion is higher, the retailer will actively share the investment cost, the level of green investment will be improved, and the green degree of the product will be higher. In the two-part contract, the transfer payment of the retailer eliminates the risk of the manufacturer, which increases the green investment, so that the green degree of the product is independent of the risk aversion. We also know that among the three contracts, the green degree of products in the two-part tariff contract is the highest. Therefore, for the supply chain system pursuing the green degree, the two-part tariff contract is the best choice.
As we can see from Figure 2, in the three contracts, in the case of a certain degree of risk aversion, the retail price in the cost-sharing contract is the highest, and the retail price in the wholesale price contract is higher than that in the two-part tariff contract, and the retail price in the two-part tariff contract is the lowest. We also know that under a certain degree of risk aversion of the manufacturer, the retail price in the cost-sharing contract and the market retail price in the wholesale price contract decrease with the decrease of risk aversion, while the retail price in the two-part contract is not affected by risk aversion. The reason is that in the wholesale price contract, both sides of the supply chain make decisions to maximize their interests, while in the cost-sharing contract, both sides have to share costs and form a unity. The increase in the green degree of green products will result in higher prices. In the two-part tariff contract, the retailer’s transfer payment eliminates the impact of risk aversion.
It can be seen from Figure 3 that in the three contracts, when the risk aversion is certain, the optimal expected utility of the supply chain in the two-part tariff is significantly higher than that in the wholesale price contract and the cost-sharing contract, and the corresponding value in the wholesale price contract is the lowest. The reason is that when k meets certain conditions, the investment cost coefficient is large, the green supply chain system has no significant green technology investment advantage, and the green technology investment cannot significantly improve the expected utility of the supply chain system. The two-part tariff contract can effectively improve the adverse impact of the larger investment cost coefficient on the channel profit. We also know that with the increase in risk aversion, the curve of the expected utility of the supply chain in the two-part tariff contract remains unchanged, which also shows that the expected utility of the supply chain under the two-part tariff contract is independent of the manufacturer’s risk aversion, which indicates that the two-part tariff contract eliminates the influence of the manufacturer’s risk aversion on the expected utility of the supply chain.
From Figure 4, we can see that in the three contracts, the two-part tariff contract has the highest social welfare, while the wholesale price contract has the lowest social welfare, which is also consistent with the previous research conclusions. We also know that the social welfare of the two-part contract is not affected by the manufacturer’s risk aversion, while the social welfare of the cost-sharing contract and the wholesale price contract increases with the manufacturer’s risk aversion. The most likely reason for this result is that, affected by the manufacturer’s risk aversion, supply chain members are more cautious, and the green degree of products, consumer surplus, and social welfare have increased, but they are far lower than the corresponding values in the two-part tariff contract, and in practice, due to the inability to accurately measure risk aversion, the two-part tariff contract is the most effective for social welfare.

6.2. Impact of Consumer Environmental Awareness on Green Degree and Supply Chain Expected Utility

From Figure 5, we can see that with the improvement in consumers’ environmental awareness, the green degree of green products in the three contracts is on the rise. We also know that in the three contracts, in the case of certain consumer awareness of environmental protection, the green degree of products in the supply chain of the two-part tariff contract is the highest, and the green degree of products in the wholesale price contract is the lowest. The reason is that, with the improvement of consumers’ environmental awareness, the requirements for green products are getting higher and higher. In the green supply chain system dominated by retailers, retailers directly face consumers. When consumers’ awareness of environmental protection is improved, rational retailers will actively provide manufacturers with cost-sharing contracts, which will improve the green degree of supply chain products. It can also be seen that with the improvement of consumers’ environmental awareness, the green degree of green products in the two-part tariff contract increases significantly higher than the corresponding values in the cost-sharing contract and the wholesale price contract, while the green degree in the wholesale price contract increases slowly.
From Figure 6, we can see that the expected utility of the supply chain in the two-part tariff contract is the highest, the expected utility of the supply chain in the cost-sharing contract is higher than the corresponding value in the wholesale price contract, and the expected utility of the supply chain in the wholesale price contract is the lowest. We also know that when consumers’ environmental awareness is low, the difference in expected utility between the supply chain utility in the cost-sharing contract and the supply chain in the wholesale price contract is very small, and as consumers’ environmental awareness increases, the gap between the two sides gradually increases. At the same time, the expected utility of the supply chain in the cost-sharing contract will be higher than the expected utility of the wholesale price contract, but because the expected utility of the manufacturer in the cost-sharing contract is lower than the supply chain utility in the wholesale price contract, that is, as shown in Figure 7, with the improvement of consumers’ environmental awareness, the expected utility of the manufacturer shows a trend of increasing first and then decreasing. The reason is that, as consumers’ environmental awareness increases, when environmental awareness is too high, manufacturers may fail to meet consumer satisfaction, resulting in lower sales and lower profits. In this case, in the wholesale price contract and the two-part contract, the expected utility of the manufacturer has been increasing with the increase of consumers’ environmental awareness, which is also the most preferred situation of the manufacturer. Combined with the above diagram, although the expected utility of the entire supply chain system increases, the expected utility of the manufacturer may show a downward trend. In this case, when consumers’ environmental awareness is too high, the rational manufacturers will not accept cost-sharing contracts, which is also an important reason why cost-sharing contracts cannot achieve Pareto improvement. The figure further shows that the two-part tariff contract can achieve Pareto improvement of supply chain members. Compared with the wholesale price contract, although the cost-sharing contract can improve the green degree of green products, it cannot improve the expected utility of the manufacturer, so it cannot achieve Pareto improvement. Therefore, the decision-makers of the rational supply chain system will not adopt the cost-sharing contract.

6.3. Impact of Investment Cost Coefficient on the Green Degree and Expected Utility of Supply Chain

From Figure 8, we can see that in the case of a certain investment cost coefficient, the green degree of supply chain products in the two-part tariff contract is the highest, while the green degree under the wholesale price contract is the highest, and the green degree in the cost-sharing contract is higher than that in the wholesale price contract. The green degree also shows that in the case of a certain total investment, the two-part tariff contract significantly improves the green effective investment level in the total investment cost, and the investment efficiency increases significantly. We also know that with the increase in investment cost coefficient, the green degree of products in the three contracts decreases slowly. Therefore, the two-part tariff contract significantly improves the investment efficiency of the green supply chain and the green degree of supply chain products.
From Figure 9, we can see that when the investment cost coefficient is certain, the expected utility of the supply chain in the two-part tariff contract is the highest, and the expected utility of the supply chain in the wholesale price contract is lower than the expected utility of the supply chain under the cost-sharing contract. We also know that with the increase in investment cost coefficient, the expected utility of the supply chain in the cost-sharing contract and wholesale price contract decreases rapidly, while the expected utility of the supply chain in the two-part contract decreases slowly and is less affected by the investment cost coefficient. Therefore, when the investment cost coefficient is large, that is, there is no significant technical advantage in green supply, the choice of the two-part tariff contract can significantly improve the profit level of the green supply chain system. We can also see that the two-part tariff contract is the optimal contract for the supply chain system, which pursues profit and Pareto improvement.

6.4. Sensitivity Analysis of the Supply Chain System

In order to analyze the influence of some important parameters on the optimal solution in different contracts, this section mainly analyzes the sensitivity of the supply chain system. On the basis of η = 1.5 , β = 0.5 , k = 1.5 , we change the above parameters within the range of ± 30 % . The optimal price and the optimal green degree are summarized in Table 6, the optimal expected utility is summarized in Table 7, and the consumer surplus and social welfare are summarized in Table 8.
From Table 6, we can see as follows: (1) When parameters increase, the wholesale price and retail price in the wholesale price contract and the cost-sharing contract show a downward trend, and the marginal revenue in the cost-sharing contract increases with the increase of the parameters, while the wholesale price and marginal revenue and retail price in the two-part tariff contract are not affected by the parameters. At the same time, with the increase in participation, the green degree in the wholesale price contract gradually decreases, while the green degree in the cost-sharing contract is just the opposite and gradually increases, while the green degree in the two-part tariff contract is not affected by the change of parameters. The most likely reason is that under the two-part tariff contract, the fixed transfer payment from the seller to the manufacturer reduces the manufacturer’s risk aversion and eliminates the manufacturer’s concern about the uncertainty of market demand, which further illustrates that in the two-part tariff contract, consumers can obtain products with the lowest price and the highest green degree. When consumers’ awareness of environmental protection increases, wholesale prices, marginal revenue, market retail prices, and product green degree gradually increase. This shows that when consumers’ awareness of environmental protection is high, supply chain members will take consumer demand as the guide to improve the green degree of products, which will increase the price of products. When consumers’ environmental awareness declines, the optimal price and the green degree of products also decrease. When the investment cost coefficient increases, this means that the green investment efficiency decreases. When the product green degree is constant, the total investment cost increases, which will cause the wholesale price, marginal income, and market retail price to rise. (2) More importantly, the horizontal comparison of the retail prices in Table 3 shows that, in the two-part tariff contract, the manufacturer’s risk aversion has no effect on the retail price, and the retail price in the two-part tariff contract is always lower than the market retail price in the wholesale price contract and the cost-sharing contract, while the green degree of product in the two-part tariff contract is the highest. The reason is that, in the retailer-led green supply chain, the retailer has a leading advantage due to its dominance of the channel. When the retailer first provides a two-part tariff contract to the manufacturer, the manufacturer can obtain a fixed transfer payment and is willing to accept a lower wholesale price. Correspondingly, the retailer will reduce the marginal revenue, thereby reducing the optimal market retail price. We can see from the horizontal comparison of the green degree in Table 3 that when it increases, the green degree in the three contracts shows a downward trend, but the green degree in the two-part tariff is always the highest, which indicates that in the two-part tariff, the investment efficiency of the two-part contract is the highest at a certain level of green investment.
Based on the results in Table 7, we can obtain the following results. (1) When the parameters increase, the expected utility of the manufacturer rises, while the retailer’s expected utility is indeed declining, but the expected utility of the supply chain is different. The expected utility of the supply chain in the wholesale price contract and the cost-sharing contract is on the rise, while the expected utility of the supply chain in the two-part contract is not affected by the degree of risk aversion. This shows that in the wholesale price contract and the cost-sharing contract, the retailer’s increased profit is higher than the manufacturer’s decreased profit, while in the two-part tariff contract, the manufacturer’s decreased profit is just equal to the retailer’s increasing profit, so that the total profit of the supply chain remains unchanged, and the supply chain profit in the two-part tariff contract is not affected by the degree of risk aversion, which further shows that the two-part tariff contract eliminates the influence of risk aversion. We also know that when consumers’ awareness of environmental protection increases, the optimal price, marginal revenue, and expected utility of the supply chain all show an increasing trend. This shows that when consumers’ awareness of environmental protection increases, the supply chain system will enhance the green degree of the product, thus increasing the price of the product and ultimately leading to an increase in the overall profit of the supply chain. When the parameter k increases, the situation is just the opposite. The expected utility of both parties and the expected utility of the supply chain show a downward trend. The reason is that when k increases, the manufacturer’s green investment efficiency is low, and the product’s green degree decreases, resulting in a decrease in market retail prices, which ultimately leads to a decrease in expected utility. (2) From the horizontal comparison of the above table, we can also find that the expected utility of the supply chain in the two-part tariff contract is always the highest, and in the two-part tariff contract, the expected utility of the supply chain is not affected by the manufacturer’s risk aversion. We can also find that the expected utility of the manufacturer in the cost-sharing contract is always lower than the expected utility of the manufacturer in the wholesale price contract and the two-part contract, which is also an important reason why the cost-sharing contract cannot achieve the Pareto improvement of the supply chain. Combined with the above conclusions, we also know that the maximum expected utility of the green supply chain system in the two-part contract is the same as that of the centralized supply chain, but it is much higher than its maximum profit in the wholesale price contract. Compared with the wholesale price contract, the two-part contract can achieve the Pareto improvement of the profits of manufacturers and retailers, reduce the wholesale price of green products, and increase the market demand for green products. In summary, the two-part tariff contract is the optimal contract.
Based on the results in Table 8, we can obtain the following results. (1) With the increase of the manufacturer’s risk aversion, consumer surplus and social welfare are increasing in the wholesale price contract and the cost-sharing contract, while in the two-part contract, consumer surplus and social welfare are not affected by the manufacturer’s risk aversion, which is consistent with the previous conclusions. This shows that the two-part tariff contract successfully eliminates the impact of the manufacturer’s risk aversion. We can also see that with the increase of consumer environmental awareness, consumer surplus and social welfare are growing, and with the increase of investment cost coefficient, no matter in which contract, consumer surplus and social welfare are declining. (2) From the horizontal comparison in Table 6, we can also conclude that, in the three contracts, the consumer surplus and social welfare in the two-part tariff contract are always higher than those in the other two cases under the same circumstances, which further indicates that the two-part tariff contract not only achieves the Pareto improvement of supply chain enterprises but also promotes the improvement of consumer surplus and social welfare.
In addition, we can find that compared with the changes in parameters β and k , the retail price, the marginal revenue, the wholesale price, the expected utility of both sides of the supply chain, consumer surplus and social welfare in the three contracts are highly sensitive combined with Table 6, Table 7, Table 8, which indicates that no matter which contract cooperation mode is adopted between the manufacturer and the retailer, consumer environmental awareness and investment cost coefficient plays an important role. The enterprises should consider this influence when making optimal decisions, understand the factors affecting the change in consumers’ environmental awareness and the factors affecting the investment cost coefficient, and formulate different policies according to different factors. We can also find that the expected utility of the manufacturer, the expected utility of the retailer, and the expected utility of the supply chain in the wholesale price contract and the cost-sharing contract are highly sensitive compared with the change of parameters. In the two-part contract, the utility of the supply chain, consumer surplus, and social welfare are not affected by the change of the parameter and are not sensitive. Therefore, for the green supply chain system to fully measure the impact of the manufacturer’s risk aversion on the revenue of both sides, the decision-makers who pursue the effectiveness of the supply chain to eliminate the impact of risk aversion should give priority to the choice of two-part contract.

7. Conclusions

Under the background of the green economy, this paper takes the bilateral monopoly green supply chain dominated by the retailer as the research object and explores the coordination of joint green investment contracts to improve the green degree of green products and market demand. This paper constructs a green supply chain composed of a risk-averse manufacturer and a risk-neutral retailer and studies the optimal green decision-making and supply chain coordination of a green supply chain with a risk-averse manufacturer. The centralized decision-making, wholesale price contract, cost-sharing contract, and two-part tariff contract are constructed to explore how to improve the green investment level of the supply chain system, reduce the price of green products, and achieve a win-win situation for supply chain members.
Compared with the existing literature, we highlight several interesting findings.
(1) In a retailer-dominated green supply chain system with the manufacturer’s risk aversion, the cost-sharing contract increases the green degree of green products and the expected utility of the retailer but decreases the utility of the manufacturer. Therefore, the Pareto improvement of the manufacturer’s and retailer’s profits cannot be realized, and the contract cannot be used as an effective coordination mechanism, which is in line with [8]. In the cost-sharing contract, when the manufacturer’s risk aversion meets certain conditions, the green degree of green products is positively correlated with the manufacturer’s risk aversion, which provides a theoretical basis for using the manufacturer’s risk aversion to enhance the green degree of products. (2) When the constraints are satisfied, in the two-part tariff contract, the market retail price of the green supply chain system is the lowest, and the green degree of the green product is the highest, which can achieve the maximum market demand of the green product, and realize the Pareto improvement of the expected utility of the retailer and the manufacturer so that the green supply chain system can be perfectly coordinated. The same findings were found in [52]. (3) In the two-part tariff contract, the manufacturer’s risk aversion has no effect on the green degree of the product, the market retail price, and the expected utility of the supply chain. Therefore, the two-part tariff contract eliminates the impact of risk aversion on the supply chain system. (4) Consumers’ environmental awareness can promote supply chain enterprises to improve the green degree of products and enhance the expected utility of the supply chain. Therefore, guiding and promoting consumers to improve their environmental awareness is conducive to more enterprises practicing green supply chain management. (5) When the investment cost coefficient is greater than a certain threshold, the market retail price of green products in the two-part tariff contract is the lowest among the three contracts, which indicates that the retail price in the two-part tariff contract is closely related to the investment cost coefficient. Supply chain decision-makers should make full use of the relationship between the investment cost coefficient and retail price. (6) In the two-part tariff contract, consumer surplus and social welfare are significantly better than those in the cost-sharing contract and the wholesale price contract. The two-part tariff contract effectively improves consumer surplus and social welfare. On the other hand, in the two-part tariff contract, the consumer surplus and social welfare are not affected by the manufacturer’s risk aversion, while in the wholesale price contract and the cost-sharing contract, the consumer surplus and social welfare increase with the manufacturer’s risk aversion. Therefore, the decision-makers of the supply chain should make full use of the manufacturer’s risk aversion to maximize the consumer surplus and social welfare even if the two-part tariff contract cannot be reached.
This research has some academic significance. (1) We apply the mean-variance theory to the study of two-part tariff contracts, consumer surplus, and social welfare. We construct a two-part tariff, consumer surplus, and social welfare model based on the mean-variance theory, which is an extension of the mean-variance theory. (2) Our model eliminates the impact of manufacturer risk aversion on market sales and product green degree and reduces the retail price of green products, which is a new development of green investment decision issues about the green supply chain. (3) We put forward a cost-sharing and two-part tariff contract to encourage and coordinate supply chain members considering the manufacturer’s risk aversion. This expands the application environment of cost-sharing and two-part tariff contracts.
Some valuable managerial insights are obtained as follows. First, in a retailer-led supply chain, the retailer should take the initiative to sign a two-part tariff contract with the risk-averse manufacturer because the contract can achieve the highest green degree of green products and maximize profits, and can eliminate the impact of the manufacturer’s risk aversion on the supply chain. Second, the government should formulate policies to encourage retailers to sign a two-part tariff contract with risk-averse manufacturers, which can promote the maximization of social welfare. At the same time, the government should also control the green investment level of the supply chain by increasing rewards and punishments and strengthening supervision. Last, consumers should have a preference for the products produced in the two-part tariff contract because the green degree level of the product is the highest, and consumers can also obtain the largest consumer surplus.
There are still some limitations in this study, which can be the direction of further attention in the future. First of all, in order to simplify the problem, this paper uses the mean-variance theory to measure the degree of risk aversion. In the future, more complex CvAR criteria can be used to measure the degree of risk aversion; secondly, this paper assumes that the demand function is a linear form of the green degree of products. In the future, we can further relax the assumptions and consider more general demand function forms.

Author Contributions

The study is the result of a full collaboration, and therefore, the authors accept full responsibility. Section 1, Section 2, and Section 7 are attributable to S.B.; and Section 3, Section 4, Section 5 and Section 6 are attributable to Y.W. All authors have read and agreed to the published version of the manuscript.

Funding

This research was funded by the National Natural Science Foundation of China, grant number 71671054, the project in reform and development of high-level talents in local colleges and universities supported by the central government, grant number 2020GSP13 and the Natural Science Foundation Project of Heilongjiang Province, grant number LH2021G014.

Institutional Review Board Statement

Not applicable.

Informed Consent Statement

Not applicable.

Data Availability Statement

The data that support the findings of this study are available from the cooresponding author upon reasonable request.

Conflicts of Interest

The authors declare no conflict of interest.

Appendix A

Proof of Theorem 1.
 
In a centralized supply chain, the expected utility function of the supply chain is U ( π s c ) = ω + m α b ω + m + β g 1 2 k g 2 η ω 2 σ 2 , and we can obtain the Hessian matrix, H 1 ω , g = 2 U π s c g 2 2 U π s c g ω 2 U π s c g m 2 U π s c ω g 2 U π s c ω 2 2 U π s c ω m 2 U π s c m g 2 U π s c m ω 2 U π s c m 2 = k β β β 2 1 + σ 2 η f 2 β 2 2 , due to H 1 = k < 0 , H 2 = 2 k 1 + σ 2 η f β 2 > 0 , and H = 2 2 k β 2 1 + σ 2 η 2 2 k β 2 < 0 . We know that the matrix is a negative definite matrix; the utility function is a combined strict concave function about wholesale price, green investment, and retail price. According to the first-order condition, let U ( π s c ) m = 0 , U ( π s c ) g = 0 , U ( π s c ) ω = 0 , and we have g c * = α β 2 b k β 2 , p c * = α k 2 b k β 2 , on this basis, and the optimal expected utility of the supply chain can be obtained.Theorem is proved. □
Proof of Theorem 2.
 
According to the first order of ω and g , and set them equal to zero, namely U ( π m ) ω = m + α + g β 2 ω 2 η σ 2 ω = 0 U ( π r ) g = g k + β ω = 0 .
We have g ( m ) = α m β 2 k + η k σ 2 β 2 , ω ( m ) = α m k 2 k + η k σ 2 β 2 2 . The Hessian of U ( π m ) is H 2 ( ω , g ) = 2 U π m g 2 2 U π r g ω 2 U π m ω g 2 U π r ω 2 = k β β 2 2 η σ 2 . Due to D 1 = - k < 0 , D 2 = 2 k ( 1 + η σ 2 ) β 2 > 0 .
We know that the matrix is a negative definite matrix. The utility function is a combined strict concave function about wholesale price and green investment.
We substitute g ( m ) = α m β 2 k + η k σ 2 β 2 , ω ( m ) = α m k 2 k + η k σ 2 β 2 2 into U π r , and we obtain U π r = m m α k + 2 η k σ 2 β 2 2 k + η k σ 2 . For 2 U π r m 2 = 2 k 1 + 2 η σ 2 2 k + η k σ 2 β 2 < 0 , U π r is a combined strict concave function about m , let U ( π r ) m = 0 , and we have m w p * = α 2 . We substitute it into the relevant decision variable and obtain the expected utility. Theorem 2 is proved. □
Proof of Lemma 1.
 
U ( π s c ) w p * U ( π s c ) c * = α 2 k 2 k β 2 + 4 η σ 2 β 2 8 2 k β 2 2 k + η k σ 2 β 2 < 0 , namely, U ( π s c ) w p * < U ( π s c ) c * ;
g w p * g c * = α β 2 k + 4 η k σ 2 β 2 2 2 k β 2 2 k + 2 η k σ 2 β 2 < 0 , namely, g w p * < g c * . Lemma 1 is proved. □
Proof of Theorem 3.
 
We solve it by backward induction, according to the first order of ω and g , and we have
U ( π m ) ω = m + α + g β 2 ω 2 η σ 2 ω = 0 U ( π m ) g = g 1 γ k + β ω = 0
We obtain ω m , γ = α m 1 γ k 2 k 1 γ 1 + η σ 2 β 2 , g m , γ = m α β β 2 2 k + 2 γ k 2 η k σ 2 + 2 γ η k σ 2 .
The Hessian of U ( π m ) is H 3 ω , g = 2 U π m g 2 2 U π r g ω 2 U π m ω g 2 U π r ω 2 = 1 γ k β β 2 2 η σ 2 .
Due to H 1 = 1 γ k < 0 , H 2 = 2 k ( 1 + η σ 2 ) 1 γ β 2 > 0 , U π m is a combined strict concave function about ω and g . We substitute ω m , γ and g m , γ into U ( π r ) , we have U ( π r ) m , γ = m α k m α β 2 γ 2 m 1 + γ 1 + 2 η σ 2 β 2 + 2 k 1 + γ 1 + η σ 2 2 β 2 + 2 k 1 + γ 1 + η σ 2 2 .
We can obtain 2 U π r m , γ m 2 = k β 2 γ 2 1 + γ 1 + 2 η σ 2 β 2 + 2 1 + γ k 1 + η σ 2 β 2 + 2 1 + γ k 1 + η σ 2 2
When k > β 2 2 1 γ 1 + η σ 2 , 2 U π r m , γ m 2 < 0 , U ( π r ) m , γ is a combined strict concave function about m , and it has a unique maximum. According to the first-order condition, let U ( π r ) ( m ) m = 2 m + α + m + α β 2 γ k β 2 + 2 k 1 + γ 1 + η σ 2 2 + 2 m α β 2 + 1 + γ k β 2 + 2 k 1 + γ 1 + η σ 2 = 0 , and we obtain
m γ = α 2 1 + γ 2 k 1 + η σ 2 1 + 2 η σ 2 + β 2 1 + 2 γ + 2 1 + γ η σ 2 4 1 + γ 2 k 1 + η σ 2 1 + 2 η σ 2 + β 2 2 + 3 γ + 4 1 + γ η σ 2
We substitute m γ into ω m , γ and obtain
ω γ = α 1 + γ 2 k 1 + 2 η σ 2 4 k 1 + γ 2 1 + η σ 2 1 + 2 η σ 2 + β 2 2 + 3 γ + 4 1 + γ η σ 2
p γ = α β 2 1 + 2 γ + 2 1 + γ η σ 2 + κ 1 + γ 2 3 + 4 η σ 2 2 + η σ 2 4 k 1 + γ 2 1 + η σ 2 1 + 2 η σ 2 + β 2 2 + 3 γ + 4 1 + γ η σ 2
We can further obtain the optimal green degree and the expected utility. Theorem 3 is proved. □
Proof of Lemma 3.
 
γ η = 8 σ 2 3 + 4 η σ 2 2 > 0 . Lemma 3 is proved. □
Proof of Lemma 5.
 
g c s * g w p * = α β 1 + 4 η σ 2 8 κ 1 + η σ 2 1 + 2 η σ 2 β 2 3 + 4 η σ 2 2 16 k 1 + η σ 2 1 + 2 η σ 2 β 2 3 + 4 η σ 2 2 2 k + η k σ 2 β 2 > 0 , that is g c s * > g w p * ,
g T P T * g C S * = α β 4 k 3 β 2 + 4 η σ 2 2 k β 2 β 2 2 k 16 k 1 + η σ 2 1 + 2 η σ 2 + β 2 3 + 4 η σ 2 2 > 0 , that is g T P T * > g C S * , to sum up g T P T * > g c s * > g w p * . Lemma 5 is proved. □
Proof of Lemma 6.
 
ω c s ω w p = α k β + 4 β η σ 2 2 2 16 k 1 + η σ 2 1 + 2 η σ 2 β 2 3 + 4 η σ 2 2 2 k + η κ σ 2 β 2 > 0 , namely, ω c s > ω w p ;
ω T F T ω w p = α k 2 2 k + 2 η k σ 2 β 2 < 0 , namely, ω T F T < ω w p , to sum up ω C S > ω w p > ω T F T . Lemma 6 is proved. □
Proof of Lemma 7.
 
m c s m w p = α β 2 1 + 4 η σ 2 3 + 4 η σ 2 32 k 1 + η σ 2 1 + 2 η σ 2 2 β 2 3 + 4 η σ 2 2 > 0 , namely, m c s > m w p ;
m T P T m w p = α β 2 2 2 k β 2 > 0 , namely, m T F T > m w p ,
m T P T m c s = α β 2 k 5 + 8 η σ 2 β 2 3 + 4 η σ 2 2 k β 2 16 k 1 + η σ 2 1 + 2 η σ 2 β 2 3 + 4 η σ 2 2 > 0 , namely, m T P T > m c s , to sum up, m T F T > m c s > m w p ;
p c s p w p = α β 2 1 + 4 η σ 2 k 1 + 2 η σ 2 7 + 4 η σ 2 β 2 3 + 4 η σ 2 2 16 k 1 + η σ 2 1 + 2 η σ 2 β 2 3 + 4 η σ 2 2 2 k + η k σ 2 β 2 > 0 , namely, p c s > p w p
p T P T p C S = α 2 β 4 + ( k β 2 ) ( 8 k β 2 ) + 4 η β 2 2 k 2 σ 2 β 2 2 k 16 k 1 + η σ 2 1 + 2 η σ 2 + β 2 3 + 4 η σ 2 2 < 0 , namely, p T P T < p C S
When k > 1 4 β 2 3 + 2 η σ 2 + β 2 1 + 4 η σ 2 3 + η σ 2 , p T P T p W P = α β 4 3 β 2 k + 2 k 2 2 β 2 η k σ 2 2 β 2 2 k β 2 2 k 2 η k σ 2 < 0 , namely, p T P T < p w p , to sum up p c s > p w p > p T P T . Lemma 7 is proved. □
Proof of Lemma 8.
 
q c s q w p = α k 1 + 2 η σ 2 β + 4 β η σ 2 2 2 16 κ 1 + η σ 2 1 + 2 η σ 2 β 2 3 + 4 η σ 2 2 2 k + η k σ 2 β 2 > 0 , we have q c s > q w p
q T P T q c s = α k 8 k 5 β 2 + 8 η σ 2 2 k β 2 β 2 2 k 16 k 1 + η σ 2 1 + 2 η σ 2 + β 2 3 + 4 η σ 2 2 > 0 , we have q T P T > q c s
To sum up q T P T > q c s > q w p . Lemma 8 is proved. □
Proof of Lemma 9.
 
g w p η = α β k σ 2 β 2 2 k 2 η k σ 2 2 < 0 ,   g T P T η = 0
g c s η = 4 α β σ 2 β 2 3 + 4 η σ 2 2 8 k 1 + 2 η σ 2 2 β 2 3 + 4 η σ 2 2 16 k 1 + 3 η σ 2 + 2 η 2 σ 4 2 , when η > 2 1 4 σ 2 , g c s η > 0 ; when 0 < η < 2 1 4 σ 2 and k < β 2 3 + 4 η σ 2 2 8 1 + 2 η σ 2 2   g c s η < 0 . Lemma 9 is proved. □
Proof of Lemma 10.
 
p w p η = α k 2 σ 2 β 2 2 k + η k σ 2 2 < 0 ,   p c s η = 4 α σ 2 β 4 3 + 4 η σ 2 2 + 4 β 2 k 1 + 2 η σ 2 5 + 8 η σ 2 16 k + 2 η k σ 2 2 16 k 1 + η σ 2 1 + 2 η σ 2 + β 2 3 + 4 η σ 2 2 2 < 0
p T P T η = 0 . Lemma 10 is proved. □
Proof of Lemma 11.
 
U π m w p η = α 2 k 2 σ 2 4 2 k + η k σ 2 β 2 2 < 0 ,   U π r w p η = α 2 k σ 2 k β 2 2 2 k + η k σ 2 β 2 2 > 0 ,
U π m C S η = 16 α 2 k σ 2 1 + 2 η σ 2 G 1 16 k 1 + 3 η σ 2 + 2 η 2 σ 4 β 2 3 + 4 η σ 2 2 3 < 0 ,  
U π r C S η = 8 α 2 k σ 2 1 + 2 η σ 2 4 k + 4 η 2 k β 2 σ 2 3 β 2 16 k 1 + η σ 2 1 + 2 η σ 2 β 2 3 + 4 η σ 2 2 2 > 0 ,  
U π m T P T η = α 2 k 2 σ 2 4 2 k + η k σ 2 β 2 2 < 0 ,   U π r T P T η = α 2 k 2 σ 2 4 β 2 2 k + η k σ 2 2 > 0
where
G 1 = 2 β 4 η σ 2 3 + 4 η σ 2 2 + 16 1 + η σ 2 k + 2 η k σ 2 2 β 2 k 11 + 82 η σ 2 + 160 η 2 σ 4 + 96 η 3 σ 6
Lemma 11 is proved. □
Proof of Lemma 12.
 
C S W P C S C S = α 2 k + 2 η k σ 2 2 8 β 2 2 k + η k σ 2 2 8 α 2 k 2 1 + 2 η σ 2 4 16 k 1 + η σ 2 1 + 2 η σ 2 β 2 3 + 4 η σ 2 2 2 = α 2 β 2 k 2 1 + 6 η σ 2 + 8 η 2 σ 4 2 32 k 1 + η σ 2 1 + 2 η σ 2 β 2 17 + 8 η σ 2 5 + 2 η σ 2 8 β 2 2 k + η k σ 2 2 E 1 2 < 0
namely, C S W P < C S C S ;
C S T P T C S C S = α 2 k 2 2 β 2 2 k 2 8 α 2 k 2 1 + 2 η σ 2 4 16 k 1 + η σ 2 1 + 2 η σ 2 β 2 3 + 4 η σ 2 2 2 = α 2 k 2 5 β 2 8 k + 8 η β 2 2 k σ 2 8 k 1 + 2 η σ 2 3 + 4 η σ 2 + β 2 13 + 8 η σ 2 5 + 4 η σ 2 2 β 2 2 k 2 16 k 1 + η σ 2 1 + 2 η σ 2 β 2 3 + 4 η σ 2 2 2 > 0
namely, C S T P T > C S C S , to sum up, C S T P T > C S C S > C S W P . Lemma 12 is proved. □
Proof of Lemma 13.
 
C S w p η = α 2 β 2 k k 2 σ 2 1 + 2 η σ 2 2 β 2 2 k + η k σ 2 3 > 0 ,   C S c s η = 64 α 2 k 2 σ 2 1 + 2 η σ 2 3 3 β 2 + 4 k 4 η β 2 2 k σ 2 16 k 1 + η σ 2 1 + 2 η σ 2 β 2 3 + 4 η σ 2 2 3 > 0 , C S T P T η = 0 ; C S w p k = α 2 k β + 2 β η σ 2 2 4 β 2 2 k + η k σ 2 3 < 0 ,   C S C S k = 16 α 2 β 2 k 1 + 2 η σ 2 4 3 + 4 η σ 2 2 16 k 1 + η σ 2 1 + 2 η σ 2 β 2 3 + 4 η σ 2 2 3 < 0 , C S TPT k = α 2 β 2 k β 2 2 k 3 < 0 ;   C S w p β = α 2 β k + 2 η k σ 2 2 2 2 k + η k σ 2 β 2 3 > 0 , C S CS β = 32 α 2 β k 2 1 + 2 η σ 2 4 3 + 4 η σ 2 2 16 k 1 + η σ 2 1 + 2 η σ 2 β 2 3 + 4 η σ 2 2 3 > 0 ,   C S T P T β = 2 α 2 β k 2 2 k β 2 3 > 0 .  
Lemma 13 is proved. □
Proof of Lemma 14.
 
S W C S S W w p = 2 α G 2 G 3 G 4 + G 5 E 1 2 α 4 β 3 α β 2 k 3 + 4 η σ 2 + 8 β k + η κ σ 2 + α k 2 7 + 6 η σ 2 3 + 2 η σ 2 8 β 2 2 k + η k σ 2 2 > 0
namely, S W C S > S W w p ; using the same method we obtain S W TPT > S W CS , to sum up, S W TPT > S W CS > S W w p . Lemma 14 is proved. □

References

  1. Available online: http://www.china-cer.com.cn/guwen/2021012811132.html (accessed on 10 January 2022).
  2. Hong, Z.; Guo, X. Green product supply chain contracts considering environmental responsibilities. Omega 2019, 83, 155–166. [Google Scholar] [CrossRef]
  3. Yang, D.; Xiao, T.; Huang, J. Dual-channel structure choice of an environmental responsibility supply chain with green investment. J. Clean. Prod. 2019, 210, 134–145. [Google Scholar] [CrossRef]
  4. Yang, F.; Kong, J.; Liu, T.; Ang, S. Cooperation and coordination in green supply chain with R&D uncertainty. J. Oper. Res. Soc. 2020, 73, 481–496. [Google Scholar]
  5. Chen, Y.; Xu, M.; Zhang, Z.G. Technical Note—A Risk-Averse Newsvendor Model Under the CVaR Criterion. Oper. Res. 2009, 57, 1040–1044. [Google Scholar] [CrossRef]
  6. Choi, T.-M.; Wen, X.; Sun, X.; Chung, S.-H. The mean-variance approach for global supply chain risk analysis with air logistics in the blockchain technology era. Transp. Res. Part E Logist. Transp. Rev. 2019, 127, 178–191. [Google Scholar] [CrossRef]
  7. Xiao, Q.; Chen, L.; Xie, M.; Wang, C. Optimal contract design in sustainable supply chain: Interactive impacts of fairness concern and overconfidence. J. Oper. Res. Soc. 2020, 72, 1505–1524. [Google Scholar] [CrossRef]
  8. Zhou, Y.J.; Hu, F.Y.; Zhou, Z.L. Retailer-led joint R&D contract coordination to promote green product demand. J. Manag. Eng. 2020, 43, 194–204. [Google Scholar]
  9. Liu, J.G.; Zhao, H.D.; Li, J. Research on the investment strategy of port and shipping supply chain based on green investment efficiency. Chin. J. Manag. Sci. 2021, 29, 33–44. [Google Scholar] [CrossRef]
  10. Liu, P.; Long, Y.; Song, H.-C.; He, Y.-D. Investment decision and coordination of green agri-food supply chain considering information service based on blockchain and big data. J. Clean. Prod. 2020, 277, 123646. [Google Scholar] [CrossRef]
  11. Zhang, X.; Yousaf, H.M.A.U. Green supply chain coordination considering government intervention, green investment, and customer green preferences in the petroleum industry. J. Clean. Prod. 2019, 246, 118984. [Google Scholar] [CrossRef]
  12. Zhang, X.; Jin, Y.; Shen, C. Manufacturers’ green investment in a competitive market with a common retailer. J. Clean. Prod. 2020, 276, 123164. [Google Scholar] [CrossRef]
  13. Wang, C.; Zou, Z.; Geng, S. Green Technology Investment in a Decentralized Supply Chain under Demand Uncertainty. Sustainability 2021, 13, 3752. [Google Scholar] [CrossRef]
  14. Wang, S.; Cheng, Y.; Zhang, X.; Zhu, C. The Implications of Vertical Strategic Interaction on Green Technology Investment in a Supply Chain. Sustainability 2020, 12, 7441. [Google Scholar] [CrossRef]
  15. Wang, J.; Yan, Y.; Du, H.; Zhao, R. The optimal sales format for green products considering downstream investment. Int. J. Prod. Res. 2019, 58, 1107–1126. [Google Scholar] [CrossRef]
  16. Yang, S.; Ding, P.; Wang, G.; Wu, X. Green investment in a supply chain based on price and quality competition. Soft. Comput. 2019, 24, 2589–2608. [Google Scholar] [CrossRef]
  17. Zhang, X.; Chen, T.; Shen, C. Green investment choice in a duopoly market with quality competition. J. Clean. Prod. 2020, 276, 124032. [Google Scholar] [CrossRef]
  18. Shi, X.; Dong, C.; Zhang, C.; Zhang, X. Who should invest in clean technologies in a supply chain with competition? J. Clean. Prod. 2019, 215, 689–700. [Google Scholar] [CrossRef]
  19. Wu, H.; Xu, B.; Zhang, D. Closed-Loop Supply Chain Network Equilibrium Model with Subsidy on Green Supply Chain Technology Investment. Sustainability 2019, 11, 4403. [Google Scholar] [CrossRef] [Green Version]
  20. Wang, L.; Song, Q. Pricing policies for dual-channel supply chain with green investment and sales effort under uncertain demand. Math. Comput. Simul. 2020, 171, 79–93. [Google Scholar] [CrossRef]
  21. Bian, J.; Zhang, G.; Zhou, G. Manufacturer vs Consumer Subsidy with Green Technology Investment and Environmental Concern. Eur. J. Oper. Res. 2020, 287, 832–843. [Google Scholar] [CrossRef]
  22. Dong, C.; Liu, Q.; Shen, B. To be or not to be green? Strategic investment for green product development in a supply chain. Transp. Res. Part E Logist. Transp. Rev. 2019, 131, 193–227. [Google Scholar] [CrossRef]
  23. Cheng, S.; Zhang, F. Regulatory pressure and consumer environmental awareness in a green supply chain with retailer responsibility: A dynamic analysis. Manag. Decis. Econ. 2021, 43, 1133–1151. [Google Scholar] [CrossRef]
  24. Sharma, G.D.; Tiwari, A.K.; Talan, G.; Jain, M. Revisiting the sustainable versus conventional investment dilemma in COVID-19 times. Energy Policy 2021, 156, 112467. [Google Scholar] [CrossRef]
  25. Li, J.; Liang, J.; Shi, V.; Zhu, J. The benefit of manufacturer encroachment considering consumer’s environmental awareness and product competition. Ann. Oper. Res. 2021, 1–21. [Google Scholar] [CrossRef]
  26. Heydari, J.; Govindan, K.; Basiri, Z. Balancing price and green quality in presence of consumer environmental awareness: A green supply chain coordination approach. Int. J. Prod. Res. 2020, 59, 1957–1975. [Google Scholar] [CrossRef]
  27. Moon, I.; Jeong, Y.J.; Saha, S. Investment and coordination decisions in a supply chain of fresh agricultural products. Oper. Res. 2018, 20, 2307–2331. [Google Scholar] [CrossRef]
  28. Liu, Z.; Xu, Q.; Yang, K. Optimal Independent Pricing Strategies of Dual-Channel Supply Chain Based on Risk-Aversion Attitudes. Asia-Pac. J. Oper. Res. 2018, 35, 1840004. [Google Scholar] [CrossRef]
  29. Huang, F.; He, J.; Lei, Q. Coordination in a retailer-dominated supply chain with a risk-averse manufacturer under marketing dependency. Int. Trans. Oper. Res. 2018, 27, 3056–3078. [Google Scholar] [CrossRef]
  30. Ma, J.; Yu, W.; Li, S.; Zhang, L.; Zang, S. The Green Product’s Pricing Strategy in a Dual Channel considering Manufacturer’s Risk Attitude. Complexity 2021, 2021, 6663288. [Google Scholar] [CrossRef]
  31. Gupta, V.; Ivanov, D. Dual sourcing under supply disruption with risk-averse suppliers in the sharing economy. Int. J. Prod. Res. 2019, 58, 291–307. [Google Scholar] [CrossRef]
  32. Liu, Z.; Hua, S.; Zhai, X. Supply chain coordination with risk-averse retailer and option contract: Supplier-led vs. Retailer-led. Int. J. Prod. Econ. 2020, 223, 107518. [Google Scholar] [CrossRef]
  33. Deng, W.; Liu, L. Comparison of Carbon Emission Reduction Modes: Impacts of Capital Constraint and Risk Aversion. Sustainability 2019, 11, 1661. [Google Scholar] [CrossRef]
  34. Zhu, B.; Wen, B.; Ji, S.; Qiu, R. Coordinating a dual-channel supply chain with conditional value-at-risk under uncertainties of yield and demand. Comput. Ind. Eng. 2020, 139, 106181. [Google Scholar] [CrossRef]
  35. Chen, Z.; Yuan, K.; Zhou, S. Supply chain coordination with trade credit under the CVaR criterion. Int. J. Prod. Res. 2018, 57, 3538–3553. [Google Scholar] [CrossRef]
  36. Liu, G.; Yang, T.; Wei, Y.; Zhang, X. Decisions on Dual-Channel Supply Chains under Market Fluctuations and Dual-Risk Aversion. Discret. Dyn. Nat. Soc. 2020, 2020, 2612357. [Google Scholar] [CrossRef] [Green Version]
  37. Yan, B.; Jin, Z.; Liu, Y.; Yang, J. Decision on risk-averse dual-channel supply chain under demand disruption. Commun. Nonlinear Sci. Numer. Simul. 2018, 55, 206–224. [Google Scholar] [CrossRef] [Green Version]
  38. Batrancea, L.; Rus, M.I.; Masca, E.S.; Morar, I.D. Fiscal Pressure as a Trigger of Financial Performance for the Energy Industry: An Empirical Investigation across a 16-Year Period. Energies 2021, 14, 3769. [Google Scholar]
  39. Batrancea, L.; Rathnaswamy, M.K.; Batrancea, I. A Panel Data Analysis on Determinants of Economic Growth in Seven Non-BCBS Countries. J. Knowl. Econ. 2021, 13, 1651–1665. [Google Scholar] [CrossRef]
  40. Fan, Y.; Feng, Y.; Shou, Y. A risk-averse and buyer-led supply chain under option contract: CVaR minimization and channel coordination. Int. J. Prod. Econ. 2020, 219, 66–81. [Google Scholar] [CrossRef]
  41. Zhao, H.; Song, S.; Zhang, Y.; Gupta, J.N.D.; Devlin, A.G.; Chiong, R. Supply Chain Coordination with a Risk-Averse Retailer and a Combined Buy-Back and Revenue Sharing Contract. Asia-Pac. J. Oper. Res. 2019, 36, 1950028. [Google Scholar] [CrossRef]
  42. Yang, M.; Gong, X.-M. Optimal decisions and Pareto improvement for green supply chain considering reciprocity and cost-sharing contract. Environ. Sci. Pollut. Res. 2021, 28, 29859–29874. [Google Scholar] [CrossRef] [PubMed]
  43. Ma, N.; Gao, R.; Wang, X.; Li, P. Green supply chain analysis under cost sharing contract with uncertain information based on confidence level. Soft. Comput. 2019, 24, 2617–2635. [Google Scholar] [CrossRef]
  44. Cao, Y.; Tao, L.; Wu, K.; Wan, G. Coordinating joint greening efforts in an agri-food supply chain with environmentally sensitive demand. J. Clean. Prod. 2020, 277, 123883. [Google Scholar] [CrossRef]
  45. He, J.; Lei, Y.; Fu, X.; Lin, C.-H.; Chang, C.-H. How Can Manufacturers Promote Green Innovation in Food Supply Chain? Cost Sharing Strategy for Supplier Motivation. Front. Psychol. 2020, 11, 574832. [Google Scholar] [CrossRef] [PubMed]
  46. Bai, S.Z.; Wang, Y.G.; Zheng, S.H.; Huang, S.J. Green investment mechanism of agricultural product supply chain considering risk aversion and negotiation power. Control. Decis. 2022, 37, 1862–1872. [Google Scholar]
  47. Gao, J.; Xiao, Z.; Wei, H. Competition and coordination in a dual-channel green supply chain with an eco-label policy. Comput. Ind. Eng. 2021, 153, 107057. [Google Scholar] [CrossRef]
  48. Xu, X.; Zhang, M.; Dou, G.; Yu, Y. Coordination of a supply chain with an online platform considering green technology in the blockchain era. Int. J. Prod. Res. 2021, 1–18. [Google Scholar] [CrossRef]
  49. Zhu, Q.; Li, X.; Zhao, S. Cost-sharing models for green product production and marketing in a food supply chain. Ind. Manag. Data Syst. 2018, 118, 654–682. [Google Scholar] [CrossRef]
  50. Bai, Q.; Xu, J.; Chauhan, S.S. Effects of sustainability investment and risk aversion on a two-stage supply chain coordination under a carbon tax policy. Comput. Ind. Eng. 2020, 142, 106324. [Google Scholar] [CrossRef]
  51. Wang, L.; Ye, M.; Ma, S.; Sha, Y. Pricing and Coordination Strategy in a Green Supply Chain with a Risk-Averse Retailer. Math. Probl. Eng. 2019, 2019, 7482080. [Google Scholar] [CrossRef]
  52. Li, Y.; Xia, L.J.; Wang, F.Z.; Zhi, H.W. Comparative study of low-carbon supply chain emission reduction strategies considering channel power structure. Manag. Rev. 2019, 31, 240–255. [Google Scholar]
  53. Ghosh, D.; Shah, J. Supply chain analysis under green sensitive consumer demand and cost sharing contract. Int. J. Prod. Econ. 2015, 164, 319–329. [Google Scholar] [CrossRef]
  54. Gurnani, H.; Erkoc, M. Supply contracts in manufacturer-retailer interactions with manufacturer-quality and retailer effort-induced demand. Nav. Res. Logist. 2008, 55, 200–217. [Google Scholar] [CrossRef]
  55. Wang, Z.; Brownlee, A.E.I.; Wu, Q. Production and joint emission reduction decisions based on two-way cost-sharing contract under cap-and-trade regulation. Comput. Ind. Eng. 2020, 146, 106549. [Google Scholar] [CrossRef]
  56. Ghosh, D.; Shah, J. A comparative analysis of greening policies across supply chain structures. Int. J. Prod. Econ. 2012, 135, 568–583. [Google Scholar] [CrossRef]
  57. Xiao, T.; Yang, D. Price and service competition of supply chains with risk-averse retailers under demand uncertainty. Int. J. Prod. Econ. 2008, 114, 187–200. [Google Scholar] [CrossRef]
  58. Liang, J.; Meng, Y. Green supply chain decision model considering government subsidies and risk aversion. Forecasting 2020, 39, 66–74. [Google Scholar]
  59. Niu, B.; Mu, Z.; Li, B. O2O results in traffic congestion reduction and sustainability improvement: Analysis of “Online-to-Store” channel and uniform pricing strategy. Transp. Res. Part E Logist. Transp. Rev. 2019, 122, 481–505. [Google Scholar] [CrossRef]
Figure 1. Impact of risk aversion on the green degree.
Sustainability 14 13606 g001
Figure 2. Impact of risk aversion on optimal retail price.
Sustainability 14 13606 g002
Figure 3. Impact of risk aversion on the expected utility of supply chain.
Sustainability 14 13606 g003
Figure 4. Impact of risk aversion on social welfare.
Sustainability 14 13606 g004
Figure 5. Impact of consumer environmental awareness on the green degree.
Sustainability 14 13606 g005
Figure 6. Impact of consumer environmental awareness on the expected utility of supply chain.
Sustainability 14 13606 g006
Figure 7. Impact of consumer environmental awareness on the expected utility of manufacturer.
Sustainability 14 13606 g007
Figure 8. Impact of investment cost coefficient on the green degree.
Sustainability 14 13606 g008
Figure 9. Impact of investment cost coefficient on the expected utility of supply chain.
Sustainability 14 13606 g009
Table 1. Summary of the important literature on coordination of green supply chain.
PapersTopicsKey Insights and Findings
Liu et al. [10]Investment decision and coordination of green agri-food supply chainA cost-sharing and revenue-sharing contract was put forward to coordinate the supply chain
Huang et al. [29]Coordination in a retailer-dominated supply chainA combined contract composed of option and cost-sharing is proposed, and CVaR is used to model risk aversion
Liu et al. [32]Supply chain coordination with a risk-averse retailerBoth the supplier-led and the retailer-led supply chains can be coordinated under the same conditions in the cost-sharing contract.
Yang et al. [42]Decisions and coordination of the green supply chain under the retailer’s reciprocal preferenceA cost-sharing joint commission contract is proposed to realize Pareto improvement, and the cost-sharing contract exerts a positive effect in improving the environmental and economic performance in the green supply chain
Cao et al. [44]Coordinating joint greening effortsA cost-sharing contract and a buyback contract are used to coordinate the greening effort decisions, and they can fully coordinate the decentralized supply chain.
Bai et al. [46]Cost-sharing contractA cost-sharing contract based on bargaining is proposed
Zhou et al. [8]Joint R&D contractA two-part tariff contract can promote green product demand.
Zhu et al. [49]Cost sharing for green food supply chainA mutual cost-sharing contract will bring more profits for both the supplier and producer.
Table 2. Summary of the related literature and new contributions.
ContributionGreen InvestmentRetailer-DominatedManufacturer’s Risk AversionCost-Sharing ContractTwo-Part Tariff Contract CSSW
Liu et al. [9]
Liu et al. [10]
Wang et al. [11]
Yang et al. [12]
Zhang et al. [17]
Bian et al. [21]
Moon et al. [27]
Huang et al. [29]
Ma et al. [30]
GUPTA et al. [31]
Liu et al. [32]
Liu et al. [36]
Fan et al. [40]
Ma et al. [43]
Cao et al. [44]
Bai et al. [46]
Zhou et al. [8]
Gao et al. [47]
Bai et al. [50]
Wang et al. [51]
Li et al. [52]
This study
Table 3. Notations.
Table 3. Notations.
ParametersDescriptions
α The basic market demands
β The consumer environmental awareness
g The green degree
p The retailer price
ω The wholesale price
m The marginal profit
b The price sensitivity
ε The demand uncertainty
η The risk aversion
π i i = m , r , s c The profit
E π i i = m , r , s c The expected profit
U ( π i ) i = m , r , s c The expected utility
C S i ( i = W P , C S , T P T ) The consumer surplus
S W i ( i = W P , C S , T P T ) The social welfare
Table 4. Optimal strategy in equilibrium in three contract models.
VariableWPCSTPT
q α k + 2 η k σ 2 2 k + η k σ 2 β 2 4 α k 1 + 2 η σ 2 2 E 1 α k 2 k β 2
g α β 2 β 2 2 k 2 η k σ 2 2 α β 1 + 2 η σ 2 3 + 4 η σ 2 E 1 α β 2 k β 2
m α 2 α 8 k 1 + η σ 2 1 + 2 η σ 2 β 2 3 + 4 η σ 2 E 1 α k 2 k β 2
ω α k 2 β 2 + 2 k + 2 η k σ 2 4 α k 1 + 2 η σ 2 E 1 c
p α 3 k + 2 η k σ 2 β 2 2 2 k + 2 η k σ 2 β 2 4 k α 3 + 4 η σ 2 2 + η σ 2 β 2 α 3 + 4 η σ 2 E 1 α k 2 k β 2
Table 5. The expected utility of green products in three contract models.
UtilityWPCSTPT
U π r α 2 k + 2 η k σ 2 4 2 k + η k σ 2 β 2 2 k α + 2 α η σ 2 2 E 1 α 2 k 6 k + 8 η k σ 2 3 β 2 8 2 k β 2 2 k + 2 η k σ 2 β 2
U ( π m ) α 2 k 8 2 k + η k σ 2 β 2 4 k α + 2 α η σ 2 2 E 3 E 1 2 α 2 k 8 2 k + η k σ 2 β 2
U ( π s c ) α 2 k 3 + 4 η σ 2 8 2 k + η k σ 2 β 2 2 k 3 + 4 η σ 2 α + 2 α η σ 2 2 E 2 E 1 2 α 2 k 4 k 2 β 2
Table 6. Optimal price and green degree in three contracts when parameters change.
ParameterValue ω w p ω c s m C S m T P T p W P p C S p T P T g w p g C S g T P T
η 2.0017.6418.2552.8554.5567.6571.1054.555.8815.2118.18
1.8018.2918.8952.7854.5568.2971.6754.556.0915.1118.18
1.6518.8119.3952.7254.5568.8172.1254.556.2615.0318.18
1.3519.9320.4952.6054.5569.9373.1054.556.6414.8518.18
1.2020.5521.0952.5354.5570.5573.6354.556.8514.7718.18
1.0521.4321.9552.4454.5571.4374.3954.557.1414.6318.18
β 0.8021.5223.4458.0463.5671.5281.4863.5611.4828.1333.90
0.7020.6321.9455.7659.7670.6377.7159.769.6223.0527.89
0.6019.9220.8154.0156.8269.9274.8256.817.9618.7222.73
0.4018.9219.2651.6552.8168.9170.9152.815.0411.5514.08
0.3018.5818.7750.9051.5568.5869.6751.553.728.4410.31
0.2018.3518.4450.4050.6868.3668.8450.682.455.536.76
k 1.9519.0719.5052.0153.4269.0771.5153.424.8911.2513.70
1.8019.1419.6152.1853.7369.1471.8053.735.3112.2514.93
1.6519.2419.7552.4054.0969.2472.1654.095.8313.4716.39
1.3519.4920.1452.9955.1069.4973.1455.107.2216.7820.40
1.2019.6720.4253.4155.8169.6773.8455.818.2019.1423.26
1.0519.9020.7853.9856.7669.9174.7656.769.4822.2727.02
Table 7. Optimal expected utility in three contracts when parameters change.
ParameterValue U π m w p U π m c s U π m T P T U π r w p U π r c s U π r T P T U π s c w p U π s c c s U π s c T P T
η 1.95445.10434.05445.101758.161817.572282.172203.262251.632727.27
1.80457.32445.88457.321737.801794.232269.952195.122240.122727.27
1.65470.22458.39470.221716.301769.672257.052186.522228.062727.27
1.35498.33485.67498.331669.441716.442228.932167.772202.112727.27
1.20513.69500.59513.691643.841687.542213.582157.532188.132727.27
1.05530.04516.48530.041616.611656.942197.232146.652173.422727.27
β 0.80538.02491.86538.021883.072051.242639.952421.092543.103177.97
0.70515.82485.59515.821805.361920.972472.232321.182406.552988.05
0.60498.01478.46498.011743.031820.752342.902241.042299.212840.91
0.40472.89465.66472.891655.111685.752167.962127.992151.132640.85
0.30464.68460.86464.681626.391642.752112.642091.882103.612577.32
0.20458.99457.37458.991606.491613.542074.792065.482070.912533.78
k 1.95476.77467.83476.771668.701705.952194.462145.482173.782671.23
1.80478.72468.89478.721675.531716.292207.842154.262185.192686.57
1.65481.05470.15481.051683.671728.672223.872164.722198.822704.92
1.35487.37473.41487.371705.781762.592267.742193.142236.002755.10
1.20491.80475.58491.801721.311786.692298.892213.112262.272790.70
1.05497.63478.29497.631741.711818.662340.212239.342296.962837.84
Table 8. Consumer surplus and social welfare in three contracts when parameters change.
ParameterValue C S w p C S c s C S T P T S W w p S W c s S W T P T
η 1.95618.22660.721487.62827.422927.534233.06
1.80603.99643.861487.62805.212899.084233.06
1.65589.14626.341487.62781.932869.434233.06
1.35557.40589.231487.62731.822806.204233.06
1.20540.44569.561487.62704.822772.464233.06
1.05522.69549.091487.62676.392737.194233.06
β 0.80709.19841.562019.893141.763412.745231.76
0.70651.87738.821785.692982.683167.634801.62
0.60607.63663.051614.152856.632980.964477.79
0.40547.88568.121394.812680.902730.854049.74
0.30529.03539.721328.522623.832651.793916.14
0.20516.16520.701284.012584.092597.143824.55
k 1.95556.92582.051427.102707.282767.084112.03
1.80561.48589.131443.532721.062786.084145.02
1.65566.95597.661463.322737.512809.954184.63
1.35581.93621.351518.122782.302874.134293.63
1.20592.58638.451557.602813.892919.874371.55
1.05606.71661.511610.662855.522980.734475.53
Publisher’s Note: MDPI stays neutral with regard to jurisdictional claims in published maps and institutional affiliations.

