Abstract
Water is an important resource for crop production; identifying the spatial pattern of the crop water footprint (WF) is of great significance for the optimization of water resource consumption and management in agricultural production. This study quantified the green, blue and grey water footprints (GWF, BWF and GRWF) and water consumption (GWC, BWC and GRWC) of rice, maize and soybean at the 1 km grid level and city level in Northeast China in 2019 based on the CROPWAT 8.0 model. The results showed that the average total water footprints of rice (TWFr), maize (TWFm) and soybean (TWFs) were 624.31 m3·ton−1, 527.26 m3·ton−1 and 1298.21 m3·ton−1, respectively. The spatial differences in the WF of each crop were obvious in Northeast China, with the highest values of TWFr mainly occurring in Baicheng, Dalian and Qitaihe; the highest TWFm values were mainly found in Baicheng, Yingkou and Hulundao, and the highest TWFs were mainly found in Baicheng, Chifeng and Tongliao. The total water consumption of all three crops (TWCc) in Northeast China was 94 billion m3·yr−1 (42% green, 26% blue and 32% grey), in which the total water consumption of maize production (TWCm) accounted for 60%. The production of rice, maize and soybean in Northeast China mainly depends on green water, grey water and blue water, respectively. Combining the results of the spatial patterns of crop TWF and TWC, the study revealed that the planting pattern of crops in Northeast China was relatively reasonable for sustainable water use. Meanwhile, cities that have the potential to enhance crop production and cities that should improve their water use efficiency and reduce fertilizer application were also identified.
1. Introduction
Rapid socioeconomic development has accelerated water withdrawal and consumption and led to water scarcity issues around the world [1,2,3]. With irrigation water accounting for 90% of all freshwater used by humans worldwide, agriculture is the sector that consumes the most water and is anticipated to continue to increase its water consumption in the future. [4]. Along with global climate change, water competition and the contradiction between the water supply and demand has been intensified, which will significantly affect agricultural production and food security [5]. At the same time, the overuse of agricultural chemical fertilizers, herbicides and pesticides has generated high levels of pollution in the environment, which further exacerbates the freshwater crisis [6,7,8]. Thus, clarifying agricultural water use and its implications for the sustainable use of water and for related food security issues is of great importance.
Many efforts have been made to clarify agricultural water use for sustainable agricultural production and water management, among which the concept of the water footprint (WF) has been widely acknowledged as a mature approach for assessing water resource utilization and contamination in agricultural production [9]. The concept of WF was introduced by Hoekstra (2003), where the WF of a product is defined as the water volume consumed per unit of product [10]. The WF for crop production is the amount of freshwater consumed for crop growth and used to assimilate pollutants per unit of crop yield throughout crop production, including green, blue and grey WF (GWF, BWF and GRWF) [5]. The GWF and BWF are both irrigation water terms, where GWF is water from rainfall that is stored in the root zone of the soil and evapotranspirated or incorporated by crops, and BWF refers to the volume of water withdrawn from surface or groundwater resources. The GRWF is the amount of freshwater used to assimilate a load of pollutants in order to meet specific water quality standards [4]. There are increasing numbers of studies on quantifying WF for agriculture and different types of crop production [11,12,13]. For macroscopic-scale studies, Duan et al. (2016) investigated the spatial patterns of GWF, BWF, GRWF and total WF (TWF) for maize production in Northeast China from 1998 to 2012 and compared the values of the different provinces [5]. Zhao et al. (2017) assessed the BWF and GWF of key crop products in Suzhou City, including wheat, cotton, rapeseed and rice, and investigated the factors that influenced the WF between 2001 and 2010 [11]. Zhao et al. (2021) quantified the spatial–temporal dynamics of the BWF and GWF in China between 2002 and 2012, and examined the primary driving forces at the provincial level [3]. Under future land use and climate change, Huang et al. (2019) projected the global agricultural and crop-specific GWC and BWC at a global 0.5° × 0.5° grid size [4]. Most of these studies focused on quantifying WF at coarse scales (global, national or regional scales), with some attempts to assess global WF in agriculture at a relatively high spatial resolution (e.g., 5′ × 5′ or 30′ × 30′ grid) [14,15]. For microscopic-scale research, Singh et al. conducted an accurate analysis of WF based on field experiments at two distinct agroclimatic zones in Indian Punjab [16]. However, the quantification of the GWF, BWF and GRWF of different crops with a higher spatial resolution at a macroscopic scale has been less studied in major grain-producing areas in China, which are important for water use management and the optimization of crop planting layouts.
Northeast China covers one of the world’s four major chernozem regions. It provides approximately one quarter of the food production in China, and plays a decisive role in safeguarding national food security. Rice, maize and soybean are the three major crops in Northeast China. In 2019, the black soil region in Northeast China produced 38.88 million tons, 10.90 million tons and 10.10 million tons of rice, maize and soybean, respectively, accounting for 18.55%, 41.81% and 60.30% of the national total, respectively. However, water resources in Northeast China are scarce and unstable. According to statistics, the total water resources in Northeast China amount to 1.6 × 10¹¹ m3, which only accounts for 5.8% of the total water resources in China. The water resources per capita amount to 1599 m3, which is 77.6% of the national average. In addition, against the background of global climate change, the rainfall in Northeast China has decreased in the past 30 years [17], and the inter-annual and intra-annual fluctuation in rainfall is large. The extreme instability of rainfall and water resources directly affects the degree of guarantee of water for food security. Meanwhile, most of the current studies on WF in Northeast China are limited to the municipal or county level. Grid-level WF calculation can take into account the spatial heterogeneity of the natural factors that affect WF calculation, which will yield more accurate results. The results will enable researchers to analyze the spatial distribution of WF at a more precise scale and to conduct more in-depth studies on the factors affecting the water footprint and their interactions with surrounding elements in the future.
Thus, this study aims to calculate the WF of the three major crops (rice, maize and soybean) at the 1 km grid level in Northeast China in 2019 based on the cropping distribution data of three crops by using the CROPWAT 8.0 model. The spatial patterns of the crop WF at both grid and city level are investigated, in order to provide a scientific basis for the efficient utilization and management of water resources in Northeast China.
2. Materials and Methods
2.1. Study Area
Northeast China is considered one of the most fertile regions in China, located between 115.5–135.1° E and 38.7–53.6° N. It is surrounded by mountains on the western, northern and southeastern sides, namely the Hulun Buir Plateau, Greater Khingan Mountains, Lesser Khingan Mountains and Changbai Mountains. It includes the whole regions of Heilongjiang, Jilin and Liaoning provinces, and Hulun Buir, Hinggan League, Tongliao and Chifeng of Inner Mongolia, covering the Sanjiang Plain, Liaohe Plain and Songnen Plain, which together constitute the northeast plain (Figure 1). The black soil area in Heilongjiang, Jilin, Inner Mongolia and Liaoning, respectively, accounts for 57.44%, 21.85%, 20.5% and 0.15% of the total arable black soil area in China. Black soil resources in Northeast China are rich in soil organic matter, which is suitable for various types of crop production; thus, it is one of the key grain production bases and an important strategic zone to ensure national food security. Northeast China’s grain output and grain transfer account for one fourth and one third of the national total, respectively. In 2019, the per capita grain output in the black soil region of Northeast China was 1099 kg/person, 2.8 times the national level in the same period.
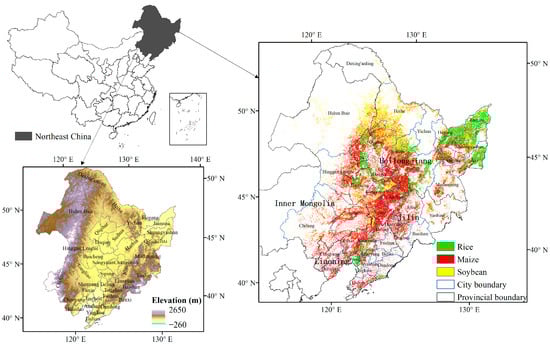
Figure 1.
Geographic location and crop planting map of Northeast China.
2.2. Data
In this study, three major crops, namely rice, maize and soybean, were selected. The data of the 10 m crop-type maps of the three crops in Northeast China in 2019 were provided by You et al. (2019) [18], and they were further resampled into 1 km data. The data showed that the total planting area of the three crops in Northeast China was 0.265 million km2, among which the planting area of rice, maize and soybean was 0.053 million ha, 0.153 million km2 and 0.059 million km2, respectively in 2019. Agrometeorological, crop and soil parameters were required input data for the CROPWAT 8.0 model. The agrometeorological information for 2019 was obtained from the Meteorological Data Sharing Service System of the National Meteorological Information Center of China (http://data.cma.cn/, accessed on 14 July 2022), which includes information on the daily maximum, minimum and average air temperature, rainfall, relative humidity, sunshine duration, radiation and wind speed. Figure 2 shows the spatial distribution of the meteorological monitoring stations selected for the interpolation and the interpolation results of the agrometeorological elements that mainly affected the WF in Northeast China in 2019. The total annual rainfall (Figure 2a) and mean annual humidity (Figure 2b) showed the same increasing trend from west to east. On the contrary, the mean annual sunshine duration gradually decreased from west to east (Figure 2c). The mean annual wind speed showed a large clustering distribution in some areas (Figure 2d). The total annual rainfall, mean annual humidity, mean annual sunshine duration and mean annual wind speed were, respectively, 601.65 mm, 59.34%, 7.33 h and 235.06 km·day−1.
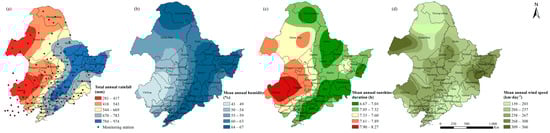
Figure 2.
Spatial patterns of meteorological factors ((a) rainfall, (b) humidity, (c) sunshine duration, (d) wind speed) in Northeast China in 2019.
Crop growth parameters, such as crop coefficients, and soil parameters were obtained from the CROPWAT 8.0 software provided by the FAO, and adjustments were made according to the actual planting and harvesting dates of crops in Northeast China. The data for crop yield and total amount of nitrogen fertilizer application at the city level in 2019 were obtained from the Heilongjiang, Jilin, Liaoning and Inner Mongolia Statistical Yearbooks. The total output of the three crops was 158.71 million tons in Northeast China in 2019, including 38.66 million tons of rice, 109.32 million tons of maize and 10.73 million tons of soybean. The GWF and BWF for each crop were firstly calculated at each meteorological station; then, they were interpolated into 1 km gird data using the ordinary Kriging method; finally, they were overlapped with the crop-type maps to show the spatial pattern of the WF of each crop. The GRWF of each crop was firstly calculated at the city level, and then the value was assigned to each grid cell by crop in the city.
2.3. WF Calculation Methodology
The WF of crop production is a comprehensive index that not only reflects the type and quantity of water consumed during crop growth, but also reflects the degree of pollution. We assessed the GWF, BWF and GRWF of each crop in Northeast China in 2019, and then summed them to obtain the TWF of each crop. The calculation process is as follows:
where represents the type of crop, is the TWF of crop production (m3·ton−1), is the GWF of crop production (m3·ton−1), is the BWF of crop production (m3·ton−1), and is the GRWF of crop production (m3·ton−1).
The first step in calculating the GWF and BWF is to assess the crop water requirement (), which is the water required for crop evapotranspiration and is calculated based on the reference evapotranspiration (). The calculation is conducted in the CROPWAT 8.0 model, which is based on the FAO Penman–Monteith method [19]. The is calculated as follows, and it is mainly influenced by climatic factors.
where is the net radiation (MJm−2·d−1), is the soil heat flux (MJm−2·d−1), is the average air temperature (°C), is the wind speed at 2 m height (m·s−1), is the saturation vapor pressure (kPa), is the actual vapor pressure (kPa), Δ is the slope of the saturation vapor pressure versus air temperature curve (kPa·°C−1), and γ is the hygrometer constant (kPa·°C−1).
The evapotranspiration required by crops from planting to harvest under ideal conditions is called the crop water requirement (). The so-called ideal condition means that rainfall or irrigation can ensure sufficient soil water, and will not affect crop growth or crop yield due to water limitations. In this case, the is calculated by multiplying the reference with a crop coefficient .
Further, the green and blue water evapotranspiration are estimated based on the , as follows.
where and are the evapotranspiration (mm) of green water and blue water for crop growth in the whole growth period, respectively. is the effective rainfall (mm) for crop growth during the whole growth period, which is calculated based on a formula provided by the USDA Soil Conservation Service [20], as follows.
where is the rainfall at a period of ten days (mm).
Finally, GWF and BWF are calculated as follows.
where is the yield of crop ; the constant factor of 10 is the conversion factor, which converts the water depth (mm) into the consumed water volume per unit land area (m3·ha−1).
GRWF quantitatively describes the pollution status of the water environment. Affected by the spraying of pesticides and the application of chemical fertilizers, the local water quality has been polluted to a certain extent. In order to improve the water quality to a safe standard, the amount of freshwater resources required to dilute various pollutants to the standard level is called grey water, which is calculated as follows.
where is the leaching–run-off fraction, i.e., the ratio of pollution entering the water body to the total chemical fertilizer application. is the chemical fertilizer application per hectare for crop (kg·ha−1); and are the maximum acceptable and natural concentrations (kg·m−3), respectively, for the pollutant considered. To avoid double counting, GRWF accounts for the pollutant that yields the highest grey water volume. As nitrogen fertilizer application contributes the most to water pollution, nitrogen is selected for the estimation of the GRWF [5]. According to previous literature, the is assumed as 10%, is zero and is 10 mg·L−1 [21].
Regarding the calculation of GRWF, since the collected data on fertilizer application reflect the total fertilizer application of all crops at the municipal level, there is a lack of separate fertilizer application data for rice, maize and soybean. In this paper, referring to the “China Agrochemical Services: Fertilizer and Fertilization Handbook” [22], the chemical fertilizer application rate of each city is obtained for each crop via the method of fertilization ratio distribution, and the chemical fertilizer application rate of rice, maize and soybean is obtained at the city level. The calculation is as follows.
where is the fertilizer application rate for crop , is the sum of fertilizer application rates for all crops at city level, is the planting area of crop , is the fertilizer application rate per unit area of crop , and ranges from 1 to 6, representing rice, maize, soybean, vegetables, fruits and other crops.
3. Results
3.1. Spatial Patterns of GWF, BWF, GRWF and TWF of Crop Production
3.1.1. WF of Rice Production
The GWF, BWF, GRWF and TWF of rice production (GWFr, BWFr, GRWFr and TWFr) at the grid level are shown in Figure 3. The average TWFr was 624.31 m3·ton−1, with GWFr, BWFr and GRWFr accounting for 63%, 20% and 17%, respectively. Specifically, the GWFr tended to increase steadily from the southwest to the northeast in Northeast China (Figure 3a). The cities with the three lowest GWFr values were Chifeng (156.28 m3·ton−1), Baicheng (196.21 m3·ton−1) and Hinggan League (207.33 m3·ton−1). The cities with the three highest GWFr values were Qitaihe (547.94 m3·ton−1), Fushun (532.06 m3·ton−1) and Harbin (523.48 m3·ton−1). The BWFr showed a progressive decline trend from west to east (Figure 3b). The cities with the three lowest BWFr values were Tonghua (32.41 m3·ton−1), Hegang (41.40 m3·ton−1) and Jilin (51.65 m3·ton−1). The cities with the three highest BWFr values were Chifeng (513.59 m3·ton−1), Baicheng (348.13 m3·ton−1) and Chaoyang (337.22 m3·ton−1). From the southwest to the northeast, the GRWFr primarily exhibited a progressive decline (Figure 3c). The cities with the three lowest GRWFr values were Hegang (39.39 m3·ton−1), Heihe (49.56 m3·ton−1) and Yichun (54.74 m3·ton−1). The cities with the three highest GRWFr values were Jilin (287.64 m3·ton−1), Baicheng (274.67 m3·ton−1) and Songyuan (263.99 m3·ton−1). The TWFr primarily exhibited a progressive decline from the southwest to the northeast (Figure 3d). The cities with the three lowest TWFr values were Hulun Buir (507.91 m3·ton−1), Suihua (515.11 m3·ton−1) and Tieling (536.78 m3·ton−1), where only Suihua had a relatively large rice planting area. The cities with the three highest TWFr values were Baicheng (819.01 m3·ton−1), Dalian (809.61 m3·ton−1) and Qitaihe (804.34 m3·ton−1), where only Baicheng had a relatively large rice planting area.
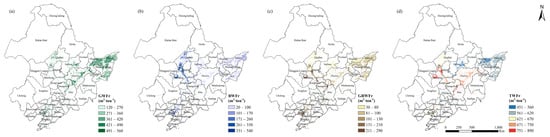
Figure 3.
Spatial patterns of (a) GWFr, (b) BWFr, (c) GRWFr and (d) TWFr in Northeast China in 2019.
3.1.2. WF of Maize Production
The GWF, BWF, GRWF and TWF of maize production (GWFm, BWFm, GRWFm and TWFm) at the grid level are shown in Figure 4. Maize planting is widely distributed throughout Northeast China. The average TWFm was 527.26 m3·ton−1, with GWFm, BWFm and GRWFm accounting for 33%, 25% and 42%, respectively. The GWFm tended to increase steadily from the northwest to the southeast (Figure 4a). The cities with the three lowest GWFm values were Chifeng (72.65 m3·ton−1), Tongliao (97.79 m3·ton−1) and Hinggan League (98.03 m3·ton−1). The cities with the three highest GWFm values were Dalian (405.63 m3·ton−1), Dandong (349.40 m3·ton−1) and Yingkou (345.71 m3·ton−1). The BWFm showed a progressive decline from northwest to southeast (Figure 4b). The cities with the three lowest BWFm values were Tonghua (0.84 m3·ton−1), Dandong (10.08 m3·ton−1) and Jilin (11.10 m3·ton−1). The cities with the three highest BWFm values were Baicheng (318.09 m3·ton−1), Huludao (304.38 m3·ton−1) and Chifeng (291.62 m3·ton−1). The GRWFm showed roughly higher values in the central region and lower in the surrounding regions of Northeast China (Figure 4c). The cities with the three lowest GRWFm values were Hegang (56.28 m3·ton−1), Heihe (66.86 m3·ton−1) and Daxing’anling (79.04 m3·ton−1). The cities with the three highest BWFm values were Yingkou (560.84 m3·ton−1), Baicheng (560.20 m3·ton−1) and Tonghua (549.39 m3·ton−1). The distribution pattern of TWFm was broadly similar to that of GRWFm, but differed in that it was relatively higher in the southernmost areas (Figure 4d). The cities with the three lowest TWFm values were Daxing’anling (291.37 m3·ton−1), Hegang (311.73 m3·ton−1) and Heihe (320.33 m3·ton−1), which had small maize planting areas. The cities with the three highest TWFm values were Baicheng (996.11 m3·ton−1), Yingkou (980.92 m3·ton−1) and Huludao (972.93 m3·ton−1), where maize was their major crop.
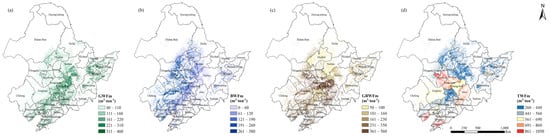
Figure 4.
Spatial patterns of (a) GWFm, (b) BWFm, (c) GRWFm and (d) TWFm for maize production in Northeast China in 2019.
3.1.3. WF of Soybean Production
The GWF, BWF, GRWF and TWF of soybean production (GWFs, BWFs, GRWFs and TWFs) at the grid level are shown in Figure 5. The average TWF was 1298.21 m3·ton−1, with GWF, BWF and GRWF accounting for 37%, 50% and 13%, respectively. The GWFs showed a gradual increase trend from west to east (Figure 5a). The cities with the three lowest GWFs were Chifeng (295.61 m3·ton−1), Chaoyang (335.01 m3·ton−1) and Daqing (337.94 m3·ton−1). The cities with the three highest GWFs were Yichun (904.21 m3·ton−1), Jiamusi (834.65 m3·ton−1) and Harbin (831.72 m3·ton−1). Specifically, the BWF showed a radial distribution with a high center and low periphery (Figure 5b). The cities with the three lowest BWFs were Tonghua (142.68 m3·ton−1), Jilin (160.44 m3·ton−1) and Liaoyuan (176.62 m3·ton−1). The cities with the three highest BWFs were Chifeng (1510.50 m3·ton−1), Baicheng (1307.84 m3·ton−1) and Tongliao (1199.44 m3·ton−1). From the southwest to the northeast, the GRWFs primarily exhibited a progressive decline trend (Figure 5c). The cities with the three lowest GRWFs were Hegang (59.75 m3·ton−1), Heihe (61.61 m3·ton−1) and Yichun (83.31 m3·ton−1). The cities with the three highest GRWFs were Baicheng (545.33 m3·ton−1), Tonghua (458.95 m3·ton−1) and Songyuan (451.46 m3·ton−1). From the southwest to the northeast, the TWFs broadly showed a declining trend (Figure 5d). The cities with the three lowest TWFs were Tieling (926.77 m3·ton−1), Fushun (939.09 m3·ton−1) and Benxi (944.72 m3·ton−1), where soybean was scarcely planted. The cities with the three highest TWFs were Baicheng (2203.06 m3·ton−1), Chifeng (2065.02 m3·ton−1) and Tongliao (1951.03 m3·ton−1), where soybean was planted in a scattered manner.
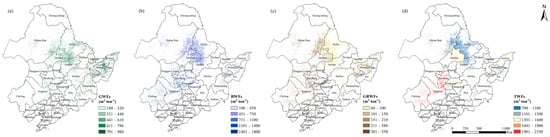
Figure 5.
Spatial patterns of (a) GWFs, (b) BWFs, (c) GRWFs and (d) TWFs in Northeast China in 2019.
3.1.4. WF of the Three Crop Production Types
The GWF, BWF, GRWF and TWF of all three crop production types (GWFc, BWFc, GRWFc and TWFc) at the grid level are shown in Figure 6. Northeast China is one of the largest grain-producing regions in China, so the WF of crop production was spread throughout the region. The GWFc showed an overall distribution pattern with high values in the east and low values in the west (Figure 6a). The cities with the three lowest GWFc values were Chaoyang (118.16 m3·ton−1), Chifeng (139.20 m3·ton−1) and Hinggan League (163.70 m3·ton−1). The cities with the three highest GWFc values were Yichun (689.41 m3·ton−1), Daxing’anling (582.35 m3·ton−1) and Hegang (492.79 m3·ton−1). Specifically, the BWFc showed an overall distribution pattern with high values in the west and low values in the east (Figure 6b). The cities with the three lowest BWFc values were Tonghua (10.49 m3·ton−1), Jilin (24.38 m3·ton−1) and Liaoyuan (27.32 m3·ton−1). The cities with the three highest BWFc values were Chifeng (652.84 m3·ton−1), Baicheng (583.80 m3·ton−1) and Hulun Buir (462.52 m3·ton−1). The GRWFc showed a distribution pattern of roughly high values in the southwest and low in the northeast (Figure 6c). The cities with the three lowest GRWFc values were Hegang (47.36 m3·ton−1), Heihe (62.86 m3·ton−1) and Yichun (75.81 m3·ton−1). The cities with the three highest GRWFc values were Baicheng (498.43 m3·ton−1), Tonghua (491.28 m3·ton−1) and Jilin (449.52 m3·ton−1). The spatial distribution pattern of the TWFc was closely related to the allocation of crops (Figure 6d). The cities with the three lowest TWFc values were Siping (455.41 m3·ton−1), Tieling (459.65 m3·ton−1) and Liaoyuan (501.57 m3·ton−1). The cities with the three highest TWFc values were Baicheng (1276.78 m3·ton−1), Daxing’anling (1125.98 m3·ton−1) and Chifeng (1026.70 m3·ton−1).
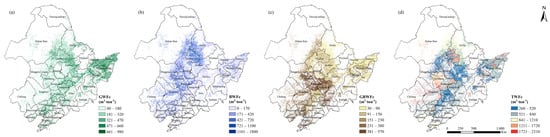
Figure 6.
Spatial patterns of (a) GWFc, (b) BWFc, (c) GRWFc and (d) TWFc in Northeast China in 2019.
3.2. The Picture of Blue, Green and Grey Water Consumption for Crop Production
3.2.1. WC of Crop Production at City Level
Figure 7 displays the TWCr, TWCs and TWCm and the contributions of the GWC, BWC and GRWC to the TWC of each crop at the city level in Northeast China in 2019. It shows that the TWCm was the highest among the three crops in most cities, followed by TWCr and TWCs. The TWC of crops (TWCc) was connected to the WF of crop production and crop yield. The planting area and output of maize in the study region were significantly higher than those of rice and soybean; hence, the TWCm was the largest. The TWCs was the lowest among the three crops, while the TWFs was the highest, indicating that soybean was the crop that consumed the highest water per unit, while its output in the northeast was relatively low compared with rice and maize.
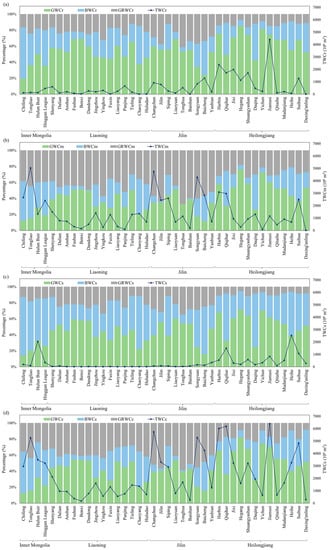
Figure 7.
TWC and contributions of different types of WC to TWC of (a) rice, (b) maize, (c) soybean and (d) all the three crops at city level in Northeast China in 2019.
From the perspective of the WC of rice production at the city level (Figure 7a), we found that Daxing’anling had the smallest TWCr (0.69 × 10⁶ m3·yr−1), followed by Baishan (3.90 × 10⁶ m3·yr−1) and Chaoyang (4.88 × 10⁶ m3·yr−1). Jiamusi had the largest TWCr (4407.62 × 106 m3), followed by Harbin (2376.95 × 106 m3·yr−1) and Jixi (1986.57 × 106 m3·yr−1). From the perspective of the total GWC, BWC and GRWC share, Chifeng had the smallest GWCr share (19.52%), followed by Baicheng (23.96%) and Songyuan (34.14%). Hegang had the largest GWCr share (85.22%), followed by Yichun (81.50%) and Harbin (75.78%). Tonghua had the smallest percentage of BWCr (5.37%), followed by Jilin (6.72%) and Hegang (7.57%). Chifeng had the largest percentage of BWCr (64.16%), followed by Chaoyang (47.68%) and Daqing (45.64%). Hegang had the smallest percentage of GRWCr (7.21%), followed by Yichun (8.78%) and Heihe (8.86%). Tonghua had the largest GRWCr share (41.19%), followed by Jilin (37.45%) and Songyuan (36.77%).
For maize production (Figure 7b), Daxing’anling had the smallest TWCm (3.12 × 10⁶ m3·yr−1), followed by Yichun (85.24 × 10⁶ m3·yr−1) and Panjing (88.27 × 10⁶ m3·yr−1). Tongliao had the largest TWCm (5043.45 × 106 m3·yr−1), followed by Changchun (4760.39 × 106 m3·yr−1) and Songyuan (4293.97 × 106 m3·yr−1). From the perspective of the TWC share, Baicheng had the smallest GWCm share (11.83%), followed by Chifeng (12.31%) and Tongliao (15.22%). Hegang had the largest GWCm share (76.56%), followed by Yichun (72.46%) and Jiamusi (60.37%). Tonghua had the smallest percentage of BWCm (0.10%), followed by Dandong (1.43%) and Jilin (1.45%). Chifeng had the largest percentage of BWCm (49.41%), followed by Daqing (43.89%) and Chaoyang (43.66%). Hegang had the smallest percentage of GRWCm (18.05%), followed by Heihe (20.87%) and Yichun (21.12%). Tonghua had the largest GRWCm share (66.81%), followed by Jilin (63.49%) and Songyuan (59.82%).
For soybean production (Figure 7c), Liaoyang had the smallest TWCs (3.26 × 10⁶ m3·yr−1), followed by Benxi (3.77 × 10⁶ m3·yr−1) and Yingkou (6.74 × 10⁶ m3·yr−1). Heihe had the largest TWCs (2534.13 × 106 m3·yr−1), followed by Hulun Buir (2043.50 × 106 m3·yr−1) and Qiqihar (1503.68 × 106 m3·yr−1). From the perspective of the total GWC, BWC and GRWC share, Chifeng had the smallest GWCs share (14.32%), followed by Baicheng (15.88%) and Tongliao (20.46%). Hegang had the largest GWCs share (71.61%), followed by Yichun (70.70%) and Harbin (67.99%). Tonghua had the smallest percentage of BWCs (10.78%), followed by Jilin (12.42%) and Dandong (15.81%). Chifeng had the largest percentage of BWCs (73.15%), followed by Daqing (66.76%) and Chaoyang (66.18%). Hegang had the smallest percentage of GRWCs (5.41%), followed by Heihe (6.20%) and Yichun (6.51%). Tonghua had the largest GRWCs share (34.68%), followed by Yingkou (33.62%) and Jilin (31.64%).
For the sum of TWCc (Figure 7d), Benxi had the smallest TWCc (178.07 × 10⁶ m3·yr−1), followed by Baishan (244.71 × 10⁶ m3·yr−1) and Daxing’anling (284.12 × 10⁶ m3·yr−1). Jiamusi had the largest TWCc (6404.00 × 106 m3·yr−1), followed by Qiqihar (6196.80 × 106 m3·yr−1) and Harbin (6015.40 × 106 m3·yr−1). From the perspective of the total GWC, BWC and GRWC share, Chifeng had the smallest GWCc share (12.72%), followed by Baicheng (15.63%) and Tongliao (15.86%). Hegang had the largest GWCc share (82.08%), followed by Yichun (74.65%) and Jiamusi (70.23%). Tonghua had the smallest percentage of BWCc (1.90%), followed by Jilin (2.96%) and Benxi (4.81%). Chifeng had the largest percentage of TWCc (51.52%), followed by Heihe (50.39%) and Qiqihar (46.36%). Daxing’anling had the smallest percentage of GRWCc (8.30%), followed by Hegang (8.86%) and Yichun (9.24%). Tonghua had the largest GRWCc share (58.39%), followed by Jilin (56.56%) and Songyuan (55.25%).
3.2.2. WC of Crop Production in the Whole Northeast China Region
The TWC of crops (TWCc) is the sum of the green, blue and grey WC of all three crops for the entire planted area. The TWCc reached 94 billion m3·yr−1, in which the GWC of crops (GWCc), BWC of crops (BWCc) and GRWC of crops (GRWCc) accounted for 42%, 26% and 32%, respectively, in Northeast China in 2019 (Table 1). The average TWC of soybean was the highest among the three crops. Meanwhile, maize took the largest share (60%) in TWCc, consuming 57 billion m3·yr−1, with its GWC, BWC and GRWC (GWCm, BWCm and GRWCm) accounting for 33%, 25% and 42%, respectively. The following were rice with 24.2 billion m3·yr−1 (GWCr 62%, BWCr 19% and GRWCr 19%) and soybean with 12.8 billion m3·yr−1 (GWCs 44%, BWCs 45% and GRWCs 11%). It can be seen that the contributions of different types of WC to the TWC differed among crops.

Table 1.
TWC of each crop and contributions of different types of WC to TWC in Northeast China in 2019.
4. Discussion
In this study, we analyzed the spatial patterns of WF and WC for three major crops (rice, maize and soybean) in Northeast China in 2019. Our calculated WF profile was broadly similar to other scholars’ analyses of WF in this study area [5,23,24,25], which certifies the reliability of our study. At the same time, the GRWF profile obtained in this study was higher than that calculated by other scholars for previous study periods, due to the fact that the annual nitrogen fertilizer application has increased in recent years [26]. From 1980 to 2019, the fertilizer application rate in the black soil region of Northeast China increased from 4.57 × 10⁶ tons to 7.38 × 10⁶ tons, which was due to the degradation of the black soil quality. A direct consequence of the degradation of the black soil quality is the decrease in the cultivated land production potential. In order to maintain the land production capacity, farmers are required to increase the input of production materials such as fertilizer, thus leading to an increase in fertilizer application and a high GRWF.
In this study, the WFs of the three crops were spatially explicit at the grid and prefecture levels. The calculation was based on detailed crop map data. These high-spatial-resolution results could be applied to formulate more region-specific WF reduction and planting layout optimization strategies. The spatial pattern of the WF of crop production was determined by a combination of climate, elevation and soil conditions, etc. Rainfall decreases from southeast to northwest, so the GWF of crop production also showed a general trend of decreasing from the southeast to the northwest. At the same time, altitude and latitude also affect crop evapotranspiration due to the effects on temperature, wind speed, radiation, etc., thus affecting the spatial pattern of the GWF of crop production. The BWF of crop production was distributed according to the GWF of the crop. Soil and topography are the main factors affecting the spatial distribution of the crop’s GRWF, and when the soil itself has excellent fertility, it requires relatively little additional fertilizer application. At the same time, the structure of the soil and the topographic conditions, such as slope and altitude, can affect the fertilizer leaching process, leading to an influence on the GRWF of crop production [27].
Our results have implications for regional planting optimization measures. Clear knowledge of water use during crop production is an important prerequisite for rational food production and the achievement of sustainable development goals. For rice, maize and soybean production, we identified that the regions with a higher TWF for each crop were those with a smaller planting area. The cities with a high TWC for each crop production type were those with a large planting area, while they had a relatively low TWF. This indicated that the planting pattern of the crops in Northeast China was relatively reasonable for sustainable water use. Meanwhile, some cities, such as Suihua, Tieling, Tonghua and Hegang, with a relatively low TWF for rice production; Hegang, Heihe, Tonghua, Dandong and Jilin, with a relatively low TWF for maize production; and Tieling, Fushun, Benxi, Tonghua, Jilin and Liaoyuan, with a relatively low TWF for soybean production, can be considered as potential areas for the corresponding crop’s production, which can be further investigated based on the assessment of their suitability. In addition, those responsible for rice production in Baicheng, Dalian and Qitaihe; maize production in Baicheng, Huludao and Yingkou; and soybean production in Chifeng, Baicheng and Tongliao should pay more attention to improving the water efficiency and reducing the TWF of crop production.
5. Conclusions
This study assessed and analyzed the spatial pattern of the WF and WC of rice, maize and soybean production at both the 1 km grid level and city level in Northeast China in 2019. The average values of TWFr, TWFm and TWFs were 624.31 m3·ton−1, 527.26 m3·ton−1 and 1298.21 m3·ton−1, indicating that soybean was the crop that required the most water per unit ton. The TWCc in Northeast China was 94 billion m3·yr−1 (42% GWCc, 26% BWCc and 32% GRWc), in which maize production accounted for 60%. The production of rice, maize and soybean in Northeast China mainly depends on green water, grey water and blue water, respectively, indicating that maize producers should focus more on fertilizer application reduction.
With regard to the spatial pattern of crop WF and WC, the highest values of TWFr mainly occurred in Baicheng, Dalian and Qitaihe, while TWCr values were highest in Jiamusi, Harbin and Jixi. The highest TWFm values were mainly found in Baicheng, Yingkou and Hulundao, while TWCm values were highest in Tongliao, Changchun and Songyuan. The highest TWFs were mainly found in Baicheng, Chifeng and Tongliao, while TWCs were highest in Heihe, Hulun Buir and Qiqihar. Overall, the spatial differences in the WF of crop production were obvious in Northeast China, while the spatial patterns of WF were not inconsistent with those of WC. Combining the results of WF, WC and crop-type maps, the study revealed that most of the cities with a high TWC for the crops were those with a large plating area, while they had a relatively low WF. Thus, the planting pattern of the crops in Northeast China was relatively reasonable for sustainable water use. Meanwhile, we also identified some cities that can have potential to enhance their crop production, such as Suihua, Tieling, Tonghua and Hegang for rice production; Hegang, Heihe, Tonghua, Dandong and Jilin for maize production; and Tieling, Fushun, Benxi, Tonghua, Jilin and Liaoyuan for soybean production. Moreover, some cities should devote additional efforts to improving the water use efficiency and reducing fertilizer application, such as Baicheng, Dalian and Qitaihe for rice production; Baicheng, Huludao and Yingkou for maize production; and Chifeng Baicheng and Tongliao for soybean production. Thus, during agricultural crop cultivation policymaking, the government should consider local water resources and crop water demand situations in order to adjust the structure and layout of crop cultivation to more low-water-consumption and low-pollution crops, without affecting the original food output. Overall, our study contributes to an improved understanding of the spatial patterns of the WF and WC of crop production in Northeast China and provides information for policymaking on the optimization and adjustment of crop planting structures and layouts and sustainable water resource utilization management.
Author Contributions
Conceptualization, X.D. and Z.L.; methodology, H.W.; formal analysis, H.W. and Z.L.; data curation, H.W.; writing—original draft preparation, Z.L.; writing—review and editing, X.D.; funding acquisition, X.D. All authors have read and agreed to the published version of the manuscript.
Funding
This research was funded by the Strategic Priority Research Program of the Chinese Academy of Sciences, grant numbers XDA28060200 and XDA23070400.
Institutional Review Board Statement
Not applicable.
Informed Consent Statement
Not applicable.
Data Availability Statement
All data and materials are available upon request.
Acknowledgments
This study has been conducted thanks to the financial support of the projects funded by the Strategic Priority Research Program of the Chinese Academy of Sciences, grant numbers XDA28060200 and XDA23070400.
Conflicts of Interest
The authors declare no conflict of interest.
References
- Mekonnen, M.M.; Hoekstra, A.Y. The green, blue and grey water footprint of crops and derived crop products. Hydrol. Earth Syst. Sci. 2011, 15, 1577–1600. [Google Scholar] [CrossRef]
- Huang, Z.; Liu, X.; Sun, S.; Tang, Y.; Yuan, X.; Tang, Q. Global assessment of future sectoral water scarcity under adaptive inner-basin water allocation measures. Sci. Total Environ. 2021, 783, 146973. [Google Scholar] [CrossRef] [PubMed]
- Zhao, D.; Liu, J.; Yang, H.; Sun, L.; Varis, O. Socioeconomic drivers of provincial-level changes in the blue and green water footprints in China. Resour. Conserv. Recycl. 2021, 175, 105834. [Google Scholar] [CrossRef]
- Huang, Z.; Hejazi, M.; Tang, Q.; Vernon, C.R.; Liu, Y.; Chen, M.; Calvin, K. Global agricultural green and blue water consumption under future climate and land use changes. J. Hydrol. 2019, 574, 242–256. [Google Scholar] [CrossRef]
- Duan, P.; Qin, L.; Wang, Y.; He, H. Spatial pattern characteristics of water footprint for maize production in Northeast China. J. Sci. Food Agric. 2016, 96, 561–568. [Google Scholar] [CrossRef]
- Feng, W.; Lu, H.; Yao, T.; Guan, Y.; Xue, Y.; Yu, Q. Water environmental pressure assessment in agricultural systems in Central Asia based on an Integrated Excess Nitrogen Load Model. Sci. Total Environ. 2022, 803, 149912. [Google Scholar] [CrossRef]
- Arunrat, N.; Sereenonchai, S.; Chaowiwat, W.; Wang, C.; Harano, R. Carbon, Nitrogen and Water Footprints of Organic Rice and Conventional Rice Production over 4 Years of Cultivation: A Case Study in the Lower North of Thailand. Agronomy 2022, 12, 380. [Google Scholar] [CrossRef]
- Cech, R.; Leisch, F.; Zaller, J.G. Pesticide Use and Associated Greenhouse Gas Emissions in Sugar Beet, Apples, and Viticulture in Austria from 2000 to 2019. Agriculture 2022, 12, 879. [Google Scholar] [CrossRef]
- Lovarelli, D.; Bacenetti, J.; Fiala, M. Water footprint of crop productions: A review. Sci. Total Environ. 2016, 548–549, 236–251. [Google Scholar] [CrossRef]
- Hoekstra, A.Y. Virtual water trade. In Proceedings of the International Expert Meeting on Virtual Water Trade, Delft, The Netherlands, 12–13 December 2002. Value of Water Research Report Series No. 12. 2003. [Google Scholar]
- Zhao, X.; Tillotson, M.R.; Liu, Y.W.; Guo, W.; Yang, A.H.; Li, Y.F. Index decomposition analysis of urban crop water footprint. Ecol. Model. 2017, 348, 25–32. [Google Scholar] [CrossRef]
- Zhai, Y.; Zhang, T.; Bai, Y.; Ji, C.; Ma, X.; Shen, X.; Hong, J. Energy and water footprints of cereal production in China. Resour. Conserv. Recycl. 2021, 164, 105150. [Google Scholar] [CrossRef]
- Xu, Z.; Chen, X.; Wu, S.R.; Gong, M.; Du, Y.; Wang, J.; Li, Y.; Liu, J. Spatial-temporal assessment of water footprint, water scarcity and crop water productivity in a major crop production region. J. Clean. Prod. 2019, 224, 375–383. [Google Scholar] [CrossRef]
- Siebert, S.; Döll, P. Quantifying blue and green virtual water contents in global crop production as well as potential production losses without irrigation. J. Hydrol. 2010, 384, 198–217. [Google Scholar] [CrossRef]
- Rost, S.; Gerten, D.; Bondeau, A.; Lucht, W.; Rohwer, J.; Schaphoff, S. Agricultural green and blue water consumption and its influence on the global water system. Water Resour. Res. 2008, 44, W09405. [Google Scholar] [CrossRef]
- Singh, K.; Mishra, S.K.; Singh, M.; Singh, K.; Brar, A.K. Water footprint assessment of surface and subsurface drip fertigated cotton-wheat cropping system—A case study under semi-arid environments of Indian Punjab. J. Clean. Prod. 2022, 365, 132735. [Google Scholar] [CrossRef]
- Wang, C.; Linderholm, H.W.; Song, Y.; Wang, F.; Liu, Y.; Tian, J.; Xu, J.; Song, Y.; Ren, G. Impacts of Drought on Maize and Soybean Production in Northeast China During the Past Five Decades. Int. J. Environ. Res. Public Health 2020, 17, 2459. [Google Scholar] [CrossRef] [PubMed]
- You, N.; Dong, J.; Huang, J.; Du, G.; Zhang, G.; He, Y.; Yang, T.; Di, Y.; Xiao, X. The 10-m crop type maps in Northeast China during 2017–2019. Sci. Data 2021, 8, 41. [Google Scholar] [CrossRef]
- Allen, R.G.; Pruitt, W.O.; Wright, J.L.; Howell, T.A.; Ventura, F.; Snyder, R.; Itenfisu, D.; Steduto, P.; Berengena, J.; Yrisarry, J.B. A recommendation on standardized surface resistance for hourly calculation of reference ETo by the FAO56 Penman-Monteith method. Agric. Water Manag. 2006, 81, 1–22. [Google Scholar] [CrossRef]
- Liu, J.; Wu, P.; Wang, Y.; Zhao, X.; Sun, S.; Cao, X. Impacts of changing cropping pattern on virtual water flows related to crops transfer: A case study for the Hetao irrigation district, China. J. Sci. Food Agric. 2014, 94, 2992–3000. [Google Scholar] [CrossRef]
- Chapagain, A.K.; Hoekstra, A.Y.; Savenije, H.H.; Gautam, R. The water footprint of cotton consumption: An assessment of the impact of worldwide consumption of cotton products on the water resources in the cotton producing countries. Ecol. Econ. 2006, 60, 186–203. [Google Scholar] [CrossRef]
- Wang, X.; Zhang, F.; Zhang, W. China Agrochemical Service Fertilizer and Fertilization Manual; China Agriculture Press: Beijing, China, 2013. (In Chinese) [Google Scholar]
- Zhang, G.; Wang, X.; Zhang, L.; Xiong, K.; Zheng, C.; Lu, F.; Zhao, H.; Zheng, H.; Ouyang, Z. Carbon and water footprints of major cereal crops production in China. J. Clean. Prod. 2018, 194, 613–623. [Google Scholar] [CrossRef]
- Yu, Z.; Qingshan, Y. Decoupling agricultural water consumption and environmental impact from crop production based on the water footprint method: A case study for the Heilongjiang land reclamation area, China. Ecol. Indic. 2014, 43, 29–35. [Google Scholar] [CrossRef]
- Wang, J.; Qin, L.; Li, B.; Dang, Y. Assessing the hotspots of crop water footprint in Jilin Province of China. Environ. Sci. Pollut. Res. 2022, 29, 50010–50024. [Google Scholar] [CrossRef] [PubMed]
- Wang, L.; Zhang, Y.; Jia, L.; Yang, G.; Yao, Y.; Wang, W. Spatial characteristics and implications of grey water footprint of major food crops in China. Water 2019, 11, 220. [Google Scholar] [CrossRef]
- Li, H.; Wang, Y.; Qin, L.; He, H.; Zhang, T.; Wang, J.; Zheng, X. Effects of different slopes and fertilizer types on the grey water footprint of maize production in the black soil region of China. J. Clean. Prod. 2020, 246, 119077. [Google Scholar] [CrossRef]


Publisher’s Note: MDPI stays neutral with regard to jurisdictional claims in published maps and institutional affiliations. |
© 2022 by the authors. Licensee MDPI, Basel, Switzerland. This article is an open access article distributed under the terms and conditions of the Creative Commons Attribution (CC BY) license (https://creativecommons.org/licenses/by/4.0/).