Abstract
In this study, we aimed at understanding a relation between PAH accumulation in the soils of brownfields that differed in origin (i.e., waste after coal mining, power plant, zinc–lead- or iron-ore processing) and age (400 years old to present). PAH contents were determined after their extraction with 2-propanol using a gas chromatograph (GC) equipped with a flame ionisation detector (FID) and a FactorFour VF-5MS capillary column. Sources of PAHs were identified using positive matrix factorisation (PMF). In regard to the relevance of the variables that helped explain the PAH accumulation, a random forest (RF) method was used. PMF analysis highlighted the connection of PAH sources with the industrial activity performed in the area. PAH concentrations increased with the age of tailings, but always exceeded the threshold-effect levels, indicating their potential to cause harm to humans. The RF method showed that for 2–3-ring PAHs the most important factor was the carbon content followed by clay, site, depth, pH, and then nitrogen, while for other PAHs, only the N content and depth exceeded 50% importance. PAHs’ vertical distributions reflected the history and the time passing from the brownfield site formation. Severe contamination of the brownfield soils indicates the necessity for remediation measures, especially where there are plans to build on these areas.
1. Introduction
Polycyclic aromatic hydrocarbons (PAHs) are omnipresent, environmental contaminants, usually produced through the incomplete combustion of organic substances. The most common sources of PAH emissions into the atmosphere are from industry; agriculture and transport; fossil fuel and biomass burning; exhaust gas emissions; spills of fuel oil; and domestic and industrial waste [1,2]. Atmospheric PAHs are subject to wet and dry deposition on soils where, not being readily degraded, they tend to accumulate by being adsorbed by soil particles. As a major reservoir of PAHs, the soil system is an important indicator of long-term environmental problems; further, knowledge about contaminant sources and the distribution of PAHs in different soil layers is critical for minimising the attendant environmental risks [1,3]. An important concern at contaminated sites is the risk of groundwater contamination by the leaching of PAHs that are absorbed in soil colloids, especially in the horizons that have a low amount of soil organic matter [4,5].
Generally, PAHs are composed of two or more fused aromatic rings and contain only carbon (C) and hydrogen (H). They occur in the environment as complex mixtures of many components with widely varying toxic potencies. The so-called low-molecular-weight (LMW) PAHs—with two or three aromatic rings—exhibit a significant acute toxicity, whereas those with a larger number (4–6) of aromatic rings, known as high-molecular-weight (HMW) PAHs, present considerable carcinogenic, mutagenic, and teratogenic risks [6]. Several investigations have found that PAHs are widely distributed in urban areas, where inefficient public transport, traffic congestion, combustion of fuel, and population density have all been described as the main sources of the deposition of PAHs in the soils of Chinese—with a sum of 16 PAHs (400–10,900 μg/kg) [7]—Turkish (about 600 μg/kg) [8] and European towns, in which the sum of 16 PAHs were placed in the large ranges from 1900 to 52,000 μg/kg depending on the population density [9,10]. It has also been reported that the exposure of PAHs to the inhabitants of overpopulated Chinese cities—such as Hong Kong [1] and Beijing [11]—and cities in other countries, such as Lisbon (Portugal) [10] and Ulsan (South Korea) [12], have led to an increased incidence of cancer. Błońska et al. [2], in examining the PAH pollution of soils from different functional areas of Krakow, which is the second largest city in Poland, determined that there were areas in which the toxic equivalency factors of benzo(a)pyrene exceeded permissible and safe values for human health by as much as ninefold.
According to our knowledge, few studies have been performed on the contribution to soil pollution of PAHs from other sources, originating from various industries, especially mining operations and industrial activities. Such past and present activities have resulted in many brownfield sites, containing abundant toxic substances, such as PAHs, being located in proximity to urban areas. There are often plans to reuse these brownfield sites to build new housing on, but these contaminants in the soil may pose health risks to the residents. Consequently, these sites require risk assessment in order to ensure that they are safe for residential use [6,13].
We hypothesised that the impact of steel works, specifically zinc (Zn) and lead (Pb) ore mining and also power-plant coal combustion on the concentrations and vertical distributions of PAHs, would be strongly affected by the type of industrial activity and the age of the brownfield site. To address the aim of better understanding the occurrence of PAHs in brownfield soils and the risks they pose, our objectives were to: (1) Evaluate the eco-toxicological risk of PAH-related soil contamination using the toxicity equivalency factor (TEF) method and sediment-quality guidelines (SQGs); (2) identify the sources of the PAHs in the brownfield soils using positive matrix factorisation (PMF); and (3) explore the key drivers behind the vertical distributions of the PAHs using random forest (RF) modelling.
2. Materials and Methods
2.1. History of the Study Areas
All the studied areas were located in southern Poland, in the provinces of Malopolska and Upper Silesia. The sites Buk (50°17′ N, 19°28′ E) and Buk-W (50°18′ N, 19°28′ E) were located near the town of Bukowno (Figure 1), where Zn and Pb ores have been mined and processed since the 14th century [14].
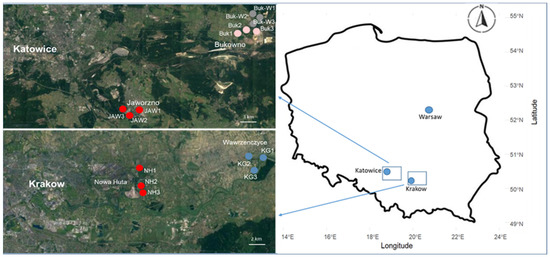
Figure 1.
Map of the studied area with sampling sites.
A large amount of waste, comprising mining residues and waste rock (Triassic dolomitic limestone), from this mining activity was deposited in heaps. In addition, being sensitive to erosion and having poor water retention, these heaps are characterised by very high contents of certain heavy metals (see Table S1 in the Supplementary information). The sites varied in age, the Buk-W sites being approximately 400 years old and the Buk sites approximately 100 years old. On both sites, Technosols had formed [15], they were overgrown with grasses, and were with species characteristic of a calamine flora (e.g., Armeria marritima, Silene vulgaris, Gypsophila fastigiata, Dianthus carthusianorum) [16].
The JAW sites (50°11′ N, 19°18′ E) were located in the environs of the town of Jaworzno, where coal has been mined since the 18th century. This area is also under the strong influence of polluting industries, including the Jaworzno III power plant and the Sobieski–Jaworzno III mining and energy plant. As a result of the development of these industries, there are mine-water sedimentation tanks and landfills containing various types of waste (mining, power plant, and hazardous) in the town, which contain high concentrations of zinc (Zn), lead (Pb), and cadmium (Cd) (Table S1) [17]. The JAW study sites (Figure 1) were situated on a landfill (approximately 40 years old), covered by Technosols [15], were overgrown by grassland vegetation, and contained a rare species characteristic of a calamine flora.
In the eastern part of Krakow, a big steel smelter—ArcelorMittal—was established in the Nowa Huta district around 1949/1950. In the 1970s and 1980s, it emitted dust and gaseous pollutants into the atmosphere, in amounts greater than 100,000 t annually [18]. In the 21st century, the plant significantly reduced its operations and, at the end of 2019 most of the land, which was occupied by the plant for 60 years, has now been returned to the city with the plan of building housing estates or businesses centres on it. Although the amount of dust emitted by a smelter into the atmosphere has decreased by several times, the pollutants, including heavy metals (Table S1), once deposited on the soil surface, remain accumulated in the soil [18]. The studied soils were taken from reworked places (NH, 50°4′ N, 19°7′ E) that had loess as a parent material (Figure 1), belonged to Phaeozems [15], and were covered with grassland vegetation belonging to the Molinio–Arrhenatheretea class, with some ruderal species also included (e.g., Plantago major, Elymus repens, and Tussilago farfara).
As a point of reference, soils with a different content of organic C, from two unspoilt locations due to similar differences occurring among the soils of studied brownfields, were included in the study. The KG (50°6′ N, 20°12′ E) reference site was located in the village of Wawrzenczyce, in the neighbourhood of Krakow, about 15 km from a steel smelter (Figure 1). The soil was derived from loess, belonged to Phaeozems [15], and was covered with similar grassland communities such as those found on the NH sites. The second reference location—TPN (49°16′ N, 19°55′ E)—was located on the border of Tatra National Park, away from the impact of towns and industry. The soil at this site (Cambisol [15]) was made of parent material—shales with thin layers of sandstones, known as the Podhale Flysch—and covered with grass vegetation belonging to the Molinio–Arrhenatheretea class [19].
2.2. Sampling and Laboratory Methods
In each of the localities (Buk, Buk-W, JAW, NH, KG, and TNP), we sampled three areas of around 25 m2 each. Sampling was performed using an incremental methodology in order to obtain composite samples, they were made out of five sub-samples and were representative of the selected areas. In this way, we took samples from three layers: 0–10, 10–30, and 30–50 cm, which gave a total number of 54 samples, 18 from each layer.
The soil samples were air-dried, passed through a 2 mm-mesh sieve and analysed in the following ways. The soil texture was determined using the densimetric-sieve method and the values were presented as the amount of clay, classified according to World Reference Base (WRB) recommendations [15]. The pH values were established potentiometrically in a deionised water suspension, with a soil to water ratio of 1:2.5 [20]. The total C, inorganic C, and total nitrogen N contents were determined by dry combustion [20], using an automatic C, N, and sulphur analyser (Elementar Vario MAX Cube, Germany) with sulphanilic acid as the reference material. Further, it the analyser was used with a detection limit of 0.001% for all elemental contents. The organic C content was calculated as the difference between the total C and total inorganic C content.
The content of PAHs in the examined soils was determined after their extraction with 2-propanol according to Application Note 133 of Macherey–Nagel GmbH (Sample Preparation 1998), [21]. In order to increase the extraction efficiency, the samples were kept in an ultrasonic bath. Determination of the PAHs’ content in the obtained extracts was performed after their concentration into solid-phase extraction (SPE) columns (CHROMABOND C18 ec), using a gas chromatograph (GC) that was equipped with a flame ionisation detector (FID) and a FactorFour VF-5MS capillary column. A detailed description of this method is provided in Appendix A together with the validation method (Table A1). The limit of detection (LOD) for all measured PAHs was 2.1 µg kg−1 d.m. The quantification limit (LOQ) was 6 ± 4 µg kg−1 d.m. The accuracy of the method was controlled using the CRM for PAHs in loamy clay 1, i.e., CRM 141–50 g (ISO/EC 17,025 Cert# AT-1467). The soil samples were analysed in three replications. When the variation in the results exceeded 10%, the analysis was repeated. Certified reference material (CRM) assays were performed in five replicates. Two blank samples in each series of analyses were included in the elaboration of the results.
2.3. Data Analysis
2.3.1. Statistics
The descriptive statistics, including minimum, maximum, mean, standard deviation, coefficient of variation (CV%), and Pearson’s correlation coefficient were all calculated. In order to estimate the least significant differences between the mean values of the homogenous groups, the post-hoc Bonferroni correction (at p < 0.05) was calculated. In order to meet the principles of the analysis of variance, the data were subjected to logarithmic transformation prior to the analysis. To estimate the relevance of the variables explaining the accumulation of PAHs, a random forest (RF) mining method was used. The relevant parameters of the RF model were the number of trees in the forest, the number of variables attempted at each split, and the minimum size of the leaf, set to 100, 3, and 5, respectively. The best combination of the explanatory variables was chosen with the use of the coefficient of determination (R2) between the measured and predicted values, which showed the limits of the model’s accuracy. The analyses were performed using Statistica PL v.13 software [22].
2.3.2. Positive Matrix Factorisation
The sources of the PAHs that accumulated in the soils were studied using positive matrix factorisation (PMF). The PMF analysis was carried out using the US EPA PMF 5.0 model [23]. A detailed description of the procedure is given in the Appendix B.
2.3.3. Toxicity Equivalency Factor (TEF)
In order to estimate the risks of a mixture of the seven most carcinogenic PAHs, TEF methodology was used; further, a benzo(a)pyrene equivalent concentration (BaPeq) was calculated. A detailed description is given in the Appendix C.
3. Results and Discussion
3.1. Basic Physical and Chemical Properties
The mean pH values of the studied soils ranged from 5.2, established at TNP (0–10 cm), to 7.8 at Buk (10–30 and 30–50 cm), and generally increased with the depth of the soil profiles (Table 1).

Table 1.
Descriptive statistics of basic physical and chemical properties of the soils.
The most diversified pH values were established in the JAW soils, in which the CVs were 14.4% and 13% in the 0–10 and 10–30 cm layers. In the soils from other brownfield sites, the CVs for pH did not exceed 3.5%. In the top horizons of the natural soils (KG and TNP), the pH was significantly lower than in the brownfield soils at the same depth. Acidification of the top horizons is typical of natural soils under humid climate conditions. These often result from the leaching of basic cations, whereas the vertical diversity in pH, or the alkalisation of the top layers of the brownfield soils, was caused either by the addition of foreign materials, dolomitic waste rock, or the alkalising effect of dust emitted by the adjacent cement plant [18,24]. The clay fraction contents were diversified both vertically and spatially, with the CVs ranging between 6.9% at Buk and 59% at Buk-W—both in the top layers—while the mean values were from 9.7 (0–10-cm layer at Buk-W) to 23% (10–30-cm layer at NH). All the mining soils (JAW, Buk-W, and Buk) were rich in organic C, at the level of the natural soil at TNP, which was between 5.7% and 7.9%. The amount of organic C decreased with depth but was still around 2% in the 30–50-cm layer. Only at NH (industrial soil) and KG (natural soil) were there about 2.5% organic C in the top horizons, which fell to below 1% at a depth of 30–50 cm (Table 1). The high amount of C in the JAW soil resulted from coal remnants, as also supported by a low amount of N, thus giving a very high C:N ratio (41:1), reflecting the artificial, human-made character of these soils. Higher N concentrations, however, especially in the top layers (0.51% and 0.54%), and a narrower C:N ratio (14–15), occurred in soils from the old sites (Buk-W and Buk) where organic matter had accumulated, serving as a food source and habitat for organisms. This was because, at these sites, a long enough time had passed since the waste heaps were formed for nature to have recovered. This observation is in line with the high enzyme activity determined by Niklińska et al. [25] in the soils of these areas.
3.2. PAH Accumulation and the Environmental Risks They Pose
The mean sums of the PAHs in the topsoil layers (0–10 cm) of the brownfield soils ranged from 3361 (NH) to 7280 µg kg−1 (Buk-W) (see Table S2 in the Supplementary information), with the mean concentration of each—or at least a major part of the individual PAHs—exceeding the threshold-effect levels (TEL) established in the SQGs. The amounts of acenaphthene (Acnaf), fluorene (Flu), phenanthrene (Phe) and anthracene (Ant) were also higher than the probable-effect level (PEL) and the effect range low (ERL). The sum of the 16 PAHs and acenaphthylene (Anaf) exceeded the ERL at NH, while at Buk-W (as well as those mentioned prior), the amounts of Py was also higher than the ERL limit. Additionally, in the 0–10 cm layer at Buk, pyrene (Py) exceeded the PEL (Table S2). It is worth emphasising that the mean value for benzo(a)pyrene (BaP), which has been considered to be the most carcinogenic contributor in other studies [26], exceeded even the effect-range median (ERM) in the top layer of the soils of all the studied sites (Table S2). According to US EPA, the ERL indicates the concentration below which toxic effects are barely observed and the ERM defines the concentrations of contaminants that, when exceeded, have the potential to cause harm or significant risk to humans or animals in the environment [27].
The PAH contents of the brownfield sites (Buk-W, Buk, JAW, and NH) were much lower than those that were obtained by Liu et al. [13] in the top layers of soils from the Pingshuo open-pit coal mine, and in the soils around a chemical plant in Shanxi, both in China. However, they were similar to the amounts that were established in coal-gangue soil in the Heshan coal district of Guangxi, South China [28] and in a mercury and arsenic mining and metallurgy brownfield site located in northern Spain [29]. When compared with soils from certain European cities, the obtained values were within the range of those estimated in urban soils in Lublin (eastern Poland), where the highest PAH content was 2000 μg kg−1 [3], Torino (Italy) at up to 3410 μg kg−1 and Ljubljana (Slovenia) at up to 4490 μg kg−1 [9]. The closest and largest town to the studied locations, in this study, was Krakow, where, in the top layers of soils from the central and industrial parts, the sums of the 16 PAHs were about 30% higher than at JAW and NH, and 10% lower than at Buk, whereas at Buk-W, these amounts were 1.4 times higher than in the Krakow area. In addition, the documented carcinogenic effect of excessive amounts of PAHs [1,3] have been noted. Ciarkowska et al. [30] recently indicated that the amounts of PAHs estimated in the urban soils of the central and industrial areas of Krakow were, at least partly, responsible for an observed increase in myocardial infarction incidences in the habitants of these areas as a result of chronic exposure.
In the deeper layers of the brownfield soils, the mean sum of the 16 PAHs ranged from 1331 (NH) to 3919 µg kg−1 (JAW) at a depth of 10–30 cm, and from 616 to 2948 µg kg−1 at the same sites at a depth of 30–50 cm, thus exceeding the TEL values at all sites in both layers (except for the bottom layer at NH). In the brownfield soils, at 10–30 and 30–50 cm, the TEL values were exceeded by a majority of the individual PAHs. In addition, the PEL values were exceeded by Flu at those depths, while the ERL values were exceeded by certain PAHs at 10–30 cm in all the brownfield soils, and also at 30–50 cm by Phe only at JAW.
In the natural soils, in 0–10 cm layers, the mean sums of the 16 PAHs amounted to 283 (KG) and 451 µg kg−1 (TNP); further, each individual PAH concentration was below the TEL, indicating that these areas are safe for humans and animals.
The toxicity of the carcinogenic PAHs is presented as the sum of BaPeq (Equation (A5) in Appendix C) for each studied area and at the three studied depths (Figure 2).
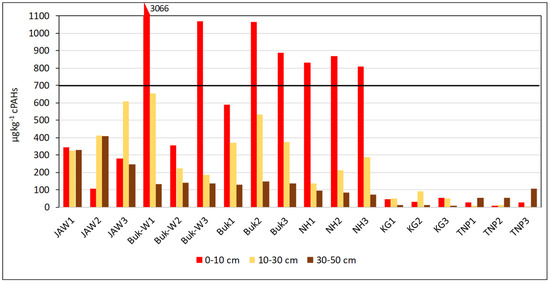
Figure 2.
Sum of toxic equivalent concentrations (BaPeq) in soils of each studied site.
A safe value of 700 µg BaPeq kg−1 has been established by the SQGs for the protection of environmental and human health [31,32]. The concentrations in the soils were above the safe values in the 0–10-cm layer at almost all the sites (Buk-W1, Buk-W3, Buk2 Buk3, NH1, NH2, and NH3). What is more, the BaPeq concentrations in the top layer at Buk-W1 exceeded the safe values by more than four-fold, still only reaching the limit value in the 10–30-cm layer, which highlighted their strong carcinogenic risk to humans. There are three factors that could have caused such strong contamination of the Buk-W1 soils: (1) They had the highest content of PAHs (especially 5–6-ringed ones); (2) They contained the highest organic-matter content, which, due to its heterogeneous structure and composition, has strong sorption properties for the most persistent of organic pollutants, including PAHs. Further, a significant positive correlation between the PAH content and the amount of C and N was found, amounting to r = 0.6027 and 0.3927, respectively (significant at p < 0.05); (3) They had very high contents of certain heavy metals (Zn, Pb, and Cd) (Table S1), which are found in the area and came from an old method used for recovering metals from ores. This, therefore, produced a lot of waste and required a lot of processing [24]. Heavy metals enhance the concentration of contaminants adsorbed onto solid minerals through an increase in the surface hydrophobicity of the soil mineral and organic fractions, thereby resulting in an increase in their persistence in the soil [33,34].
3.3. PAH Source Identification by Positive Matrix Factorisation
The average contributions of the PAH species in the top layers (0–10 cm) to the four PMF factors are presented in Figure 3 and Figure 4.
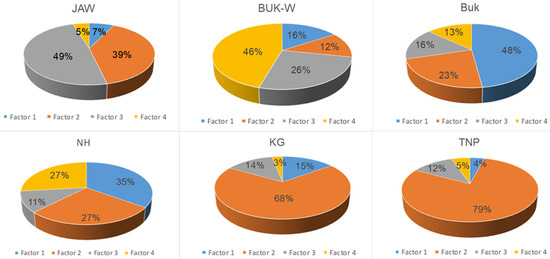
Figure 3.
Source mass contribution of each factor to total PAHs.
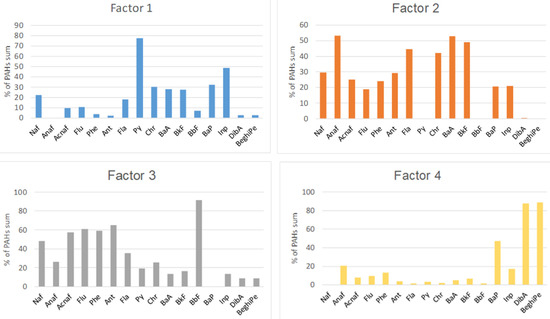
Figure 4.
PAH source profiles obtained from the PMF model.
Factor 1 accounted for 7% of the total measured PAHs at JAW, 16% at Buk-W, 48% at Buk, 35% at NH, 15% at KG, and 4% at TNP. This factor was designated as the influence of vehicle emissions, due to the fact it was dominated by pyrene (Py) and indeno(1,2,3,cd)pyrene (Inp), with contributions from BaP, chrysene (Chr), benzo(a)anthracene (BaA), and benzo(k)fluoranthene (BkF). All of these are typical products of motor vehicle exhaust, with BaA, Chr, InP, and BkF having been used as markers for diesel combustion [7]. Their high contributions to the sums of the PAHs at Buk and NH are likely to have resulted from the traffic of heavy vehicles, which used mainly diesel as fuel, transporting products through these industrial areas [35].
Factor 2 accounted for 39% of the total measured PAHs at JAW, 12% at Buk-W, 23% at Buk, and 27% at NH. This factor dominated in the natural soils at KG (68%) and TNP (79% of the total PAHs). Factor 2 was represented mainly by Anaf (50%), followed by BaA, BkF, fluoranthene (Fla), and Chr accompanied by naphthalene (Naf) and Ant. A similar pattern has previously been related to oil spills and wood combustion [32]. The high share of LMW PAHs (2–3 rings) indicate that this factor likely represents both petrogenic sources and a recent accumulation [2,13]. Its predominance in areas with natural soils may be connected with the parking and driving of many cars in the KG and TNP areas, as well as domestic wood combustion [2].
Factor 3 accounted for 49% of the PAHs at JAW, 26% at Buk-W, and 16% at Buk, with a small contribution at NH, KG, and TNP amounting to 11–14%. It was represented mainly by benzo(b)fluoranthene (BbF), accompanied by Ant, Flu, Acnaf, and Phe, and also with a lower share of Naf. Among these, BbF, Flu, Acnaf, and Phe have generally been identified as originating from coal combustion [36], with Naf being a product of fossil fuel burning and Ant being recognised as a marker for wood combustion [4,36]. Moreover, Naf, Flu, and Phe have been identified as indicators of vehicular emissions [37]. These sources may well explain such a high share of Factor 3 at JAW, where there is a coal power plant that is associated with heavy transport traffic connected with this activity. Furthermore, Naf, Flu, Ant, and Phe are also PAH species that derive from the sintering process [38], which may explain their contribution at Buk-W and Buk, where Zn and Pb ores were processed for several centuries.
The fourth factor accounted for 46% of the PAHs at Buk-W, 27% at NH, and 13% at Buk. At the remaining sites, it contributed 5% (JAW, TNP) and 3% KG. The highest shares in this factor comprised dibenz(ah)anthracene (DiBa), benzo(ghi)perylene (BeghiPe), and BaP (i.e., only 5–6-ringed PAHs). According to Hiller et al. [39], HMW PAHs are generated at high temperatures, and these PAHs are usually associated with the pyrolytic processes used in the steel industry, together with incomplete combustion emissions [38,40]. Therefore, Factor 4 was ascribed to the sintering processes. However, some authors have attributed these PAHs to tire abrasion [37], thus the source of these PAHs may be mixed. The most notable feature was a high contribution of this factor at Buk-W—the oldest former Zn and Pbore mining and processing site—with much lower shares at NH and Buk, both sites that are connected with metallurgy, but only in more recent times. This may be linked to Kwon and Choi’s [12] observation, which was based on the PAH contamination of urban soils in a multi-industrial city in North Korea, that more polluted sites are more influenced by relatively HMW PAHs, which explains why Buk-W had the highest concentration of HMW PAHs among the studied sites.
3.4. Factors Affecting PAH Vertical Distributions
The PAHs were divided into three groups based on the number of their aromatic rings 2–3, 4, and 5–6 (Figures S1 and S2 in the Supplementary information). A general rule observed in brownfield-site soils is that the largest amounts of PAHs accumulate in the top layers, with their contents decreasing with soil depth. This suggests that the input rate of the PAHs in the top layers in the study areas was faster than the rate of vertical mobilisation and transport [41]. Exceptions were noticed at JAW for the 4– and 5–6-ringed PAHs, and also at Buk for the 2–3-ringed PAHs, where higher amounts occurred at 10–30 cm than at 0–10 cm. In the natural soils (KG and TNP), the amounts of the PAHs did not change with the depth. The accumulation of PAHs in the top layers indicated their air-borne transmission, and also their binding with the soil organic matter [42], while the higher accumulation in the deeper layers was the result of the anthropogenic deposition of mining or metallurgical waste containing PAHs [13]. Liu et al. [13] and Pies et al. [43] also found similar results in coal-impacted soils.
Most of the PAHs at the studied sites were of HMW structure (i.e., ≥4 rings), most likely due to their greater persistence and their tendency to accumulate in soils that are close to emissions sources [7]. However, the amounts and variations in relation to the number of rings were related to the age of their brownfield status (Figure 5).
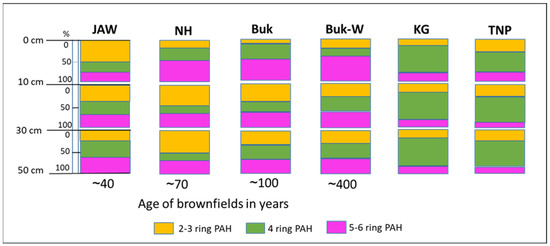
Figure 5.
Vertical distribution of PAHs with different ring numbers at studied locations, grouped according to the brownfield age and in reference soils.
At JAW (the dump formed contemporarily), which is located close to a still-working power plant, 2–3-ringed PAHs (i.e., of LMW) dominated, constituting 50% of all the PAHs accumulated in the 0–10-cm layer, whereas their share was much lower (10–21% of all PAHs, in this layer) in the top horizons of the older mining sites, such as Buk-W and Buk, and the relatively old metallurgy site at NH. The high share of LMW PAHs in the surface layer of the young dumps suggests that more PAHs came from the more recent deposits, which have not yet been bio- and photo-degraded [6]. This also supports the low share of LMW PAHs in the top layers, and their higher share in the deeper layers, of the soils of the older mining/metallurgy sites. Generally, LMW PAHs are characterised by higher mobility, so their migration through soil profiles is faster than HMW PAHs [35,44], (Figure S2).
With an increasing dump age, the share of 5–6-ringed PAHs increased in the 0–10 cm layer, from 22% at JAW to 61% at Buk-W (Figure 5). The higher-ringed PAHs adhere to organic and mineral particles in the soil and can therefore be highly persistent. Sorption to soil colloids, together with the solubility, are the dominant mechanisms for PAH mobility. The higher-ringed PAHs are characterised by a low solubility that results in a very long-term release followed by the leaching of these contaminants [6]. The adsorption of HMW PAHs on organic matter is also enhanced in the presence of Pb and Zn, due to the interactions of ionic metals with different functional groups, such as carboxylic (–COOH) and hydroxyl (–OH) groups of organic matter. There were very high amounts of both Zn and Pb at Buk-W (Table S1). The adsorption of co-contaminant PAHs and heavy metals would cause a reduction in the bioavailability of both. Moreover, our results confirm the observation of Lyszczarz [33], who noted that soils with the highest PAH accumulations also contained high amounts of only slightly decomposed organic matter. At Buk-W and Buk, there were very high C contents from organic matter, originating from calamine-flora residues. Such metallicolous plants develop thick cuticles composed of cutins as a protection against water loss and microbial attack, which results in the accumulation of organic matter that is resistant to microbial degradation and that thus has a low decomposition rate; further, this accumulation of organic matter occurs in soils covered by grass communities [16,45], such as those found at NH and JAW.
A high share of LMW PAHs was noted at Buk and NH in the 10–30-cm level, which could be explained by the occurrence of the highest pH values (7.8 and 7.6) of all the soils in these layers, which would reduce the degradability of the PAHs, as these reactions slightly favour acidic to neutral conditions (pH = 6.5–7) [34]. At other depths, the proportions for all the groups of the PAHs were similar (around 30% each).
In the different layers of the natural soils (KG and TNP), the proportions of three selected groups of PAHs (2–3 ring, 4 ring, and 5–6 ring) were similar, with a dominance of 4-ringed PAHs in all the layers of around 60% at KG and 40–57% at TNP (Figure S1).
An RF model was used to explain the effects of the soil and site parameters, other than the age of the brownfield site as an exception, on PAH distribution. The RF results indicated that, in the brownfield soils, the distribution of 2–3-ringed PAHs was affected by all the considered soil parameters (C, N, clay, pH, depth, and site), with weights exceeding 50% and an R2 calculated between the measured and predicted values amounting to 0.4909. The most important factor was C content, followed by clay, site, depth, pH, and then N (Figure 6).
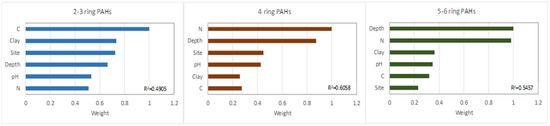
Figure 6.
RF model of factor importance for the accumulation of PAHs with different ring number.
As mentioned above, at sites with a prevalence of 2–3 ringed PAHs, especially at JAW and NH, there was an association with coal as it was used in the power plant as well as in iron and steel furnaces. At JAW, unburned coal particles were observed that had most likely eroded from the coal dumps that accumulated close to the power plant. In addition, during the coal combustion process, the fly ash still contained unburned coal particles at low concentrations. The high importance of C in LMW PAH distributions in the brownfield soils may be partially linked with the high contents of Naf and Phe in coal. This was reported by Achten and Hofmann [46], who noted that the most obvious characteristic of native PAHs from coals is the predominance of these PAHs and their derivatives. Moreover, 2–3-ringed PAHs bind to soil colloids (i.e., organic matter and mineral colloids), as indicated by the importance of the clay content. The highest clay content recorded occurred in the soils at JAW and NH, while Buk-W and Buk were characterised by high organic matter contents. The pathway and history of contamination with PAHs, as expressed by the site, were of great importance for the LMW PAHs, which were more degradable than the HMW PAHs. Depth was also important, but only in fourth place of importance. This was because the low-ringed PAHs were the most mobile, and their amounts were not differentiated as much by depth (Figure 6). The accumulation and distribution of 2–3-ringed PAHs were also affected by pH, as it is a key factor in the availability of nutrients and, thus, in the development of the microorganisms involved in PAH degradation [33].
The highest weights for the 4- and 5–6-ringed PAH distribution were either in regard to N content, followed by depth (4-ringed PAHs) or depth followed by N content (5–6-ringed PAHs), with R2 = 0.6058 (4 rings) and 0.5457 (5–6 rings). Although the relationship between PAH content and soil depth was significant in all cases (2–3, 4, and 5–6 rings), the importance (weight) of depth increased in tandem with the increase in ring number and decrease in PAH mobility. A second important factor affecting PAH accumulation in the brownfields soils was N. This was linked to the higher accumulation of N in the top layers compared with the lower layers. According to Acuña et al. [47] and Mackiewicz-Walec and Krzebietke [48], N deficiency promotes PAH biodegradation in soil, while higher amounts promote PAH accumulation. The weights of the other properties did not exceed 50% for either the 4– or 5–6-ringed PAHs.
4. Conclusions
We investigated the concentration, sources, and vertical distribution of PAHs in soils from brownfield sites that resulted from waste after mining and/or smelting activities. All the soils of the brownfields were contaminated with PAHs at depths of 0–50 cm, with the PAH concentrations exceeding safe values. The amounts and sources of the PAHs were highly connected with the kinds of industrial activity performed in the area, and their vertical distributions reflected the history of the place, and the time that had passed since creation of the brownfield site. Medium- and high-ringed PAHs were generally dominant in the top layers, although coal combustion, the addition of unburned coal, and recent deposition contributed to high accumulations of 2–3-ringed PAHs in the soils of the younger sites. Other important factors that increased the accumulations and affected the distributions of the PAHs included the amount of organic matter and co-contamination of the sites with heavy metals. The older sites, with high amounts of organic matter and strong heavy-metal contamination, were characterised by higher concentrations of PAHs, especially HMW PAHs, in the topsoil layers. The much lower amounts (10 times lower) of PAHs in the natural soils (i.e., locations with no mining or smelting history), and the equal distribution of LMW and HMW PAHs throughout the soil profiles at these sites, emphasised the degree of degradation of the brownfield soils. These findings can be used to inform developers of the potential risks that brownfield sites can pose to human health, if used for building upon. Moreover, the severity of the contamination of the studied brownfield soils indicates the necessity to undertake remediation measures. This is why further exploration of possible bioremediation measures, or other remediation techniques, for these brownfield sites is warranted.
Supplementary Materials
The following supporting information can be downloaded at: https://www.mdpi.com/article/10.3390/su142113796/s1, Figure S1: contribution of PAHs grouped according to the ring number. Different letters show differences that are significant at p < 0.05, shown in Figure S2. Vertical distribution of PAHs grouped according to the ring number. Table S1: ranges of Zn, Pb, and Cd concentrations (mg kg−1) in the soils of study areas; Table S2: mean PAHs content (±SD) in layers of the analysed areas against Canadian soil quality guidelines.
Author Contributions
Conceptualization, K.C. and M.d.C.; methodology, M.d.C. and F.G.; validation, K.C., M.d.C. and F.G.; writing—original draft preparation, K.C.; writing—review and editing, F.G. All authors have read and agreed to the published version of the manuscript.
Funding
This research was funded by The Ministry of Science and Higher Education of Poland (grant numbers: 010013-D014 and 010002-D011).
Institutional Review Board Statement
Not applicable.
Informed Consent Statement
Not applicable.
Data Availability Statement
Not applicable.
Conflicts of Interest
The authors declare no conflict of interest.
Appendix A. Polycyclic Aromatic Hydrocarbons (PAHs) Determination
The content of PAHs in studied soils was estimated as a result of the extraction of air-dried soil, which was ground up in order to pass through a 100-mesh sieve with the use of 2-propanol according to Application Note 133 of Macherey–Nagel GmbH Co. KG’s Sample Preparation sheet (1998). This extractant is recognized in the scientific literature [47] as useful for the determination of bioavailable PAH fractions. It released from 31% (indeno (1,2,3,cd) pyrene) to 91% (phenanthrene) of the total content of tested PAHs contained in the certified reference material (Table S2). For the purposes of the analysis of the risk of toxic effects from the determined PAHs in the studied soils, the obtained raw PAH analysis results were converted into their total contents, taking into account the efficiency of extraction of individual PAHs with the use of 2-propanol (Table A1).
The soil samples were prepared for PAH analysis by adding 70 mL of 2-propanol to 10 g of air-dried soil, followed by 40 min of homogenisation in an ultrasonic bath. Next, the samples were mixed for 60 min, left for 60 min, and then filtered into a 250 mL flask that was next filled with double-distilled water. CHROMABOND C18 ec solid-phase extraction (SPE) columns were conditioned with 3 mL of 2-propanol (85:15 v/v). Each sample was passed through the conditioned column, after which 1 mL of a mixture comprising double-distilled water and 2-propanol (85:15 v/v) was passed twice through the bed, so as to wash out impurities. The SPE column bed was dried, using a stream of N to remove the excess water. The PAHs were eluted with dichloromethane (2 × 500 μL) and filled up to 1 mL with dichloromethane.
Determination of the PAHs was performed on a Varian GCH gas chromatograph equipped with a flame ionisation detector (FID) and a FactorFour VF-5MS capillary column with length = 30 m, internal diameter = 0.25 mm, and film thickness = 0.25 μm. The initial temperature of the column was 80 °C. The temperature was then increased from 80 °C to 310 °C at a rate of 4 °C min−1. The total analysis time was 57.5 min. The injector had a temperature of 250 °C and the FID 330 °C. The carrier gas (helium) flowed through the column at a speed of 1 mL min−1, the flow of H was 40 mL min−1 and the air flow was 300 mL min−1. The PAH content was determined using a calibration curve based on the external standard solution Restek 610 PAH Calibration Mix A (16 PAHs in methylene chloride at 500–1000 μg mL−1). The mixture of tested PAHs included: naphthalene (Naf), acenaphthylene (Anaf), acenaphthene (Acnaft), fluorene (Flu), phenanthrene (Phe), anthracene (Ant), fluoranthene (Fla), pyrene (Py), chrysene (Chr), benzo(a)anthracene (BaA), benzo(b)fluoranthene (BbF), benzo(k)fluoranthene (BkF), benzo(a)pyrene (BaP), indeno(1,2,3,cd)pyrene (Inp), dibenz(ah)anthracene (DibA), and benzo(ghi)perylene (BeghiPe).
Table A1.
Selected elements of the validation method of PAHs in soil.
Table A1.
Selected elements of the validation method of PAHs in soil.
| PAH | CRM Analysis 141 * | Recovery of the Standard Additive to Soil | ||||
|---|---|---|---|---|---|---|
| Certified Value | Determined Value | |||||
| ug/kg | SD | ug/kg | SD | % ** | % | |
| naphthalene | 4780 | 139 | 1530 | 75 | 32 | 85 |
| acenaphthylene | 331 | 9.63 | 109 | 1.7 | 33 | 87 |
| acenaphthene | 463 | 13.5 | 292 | 0.8 | 63 | 86 |
| fluorene | 6118 | 178 | 3242 | 153 | 53 | 94 |
| phenanthrene | 7016 | 204 | 6385 | 461 | 91 | 92 |
| anthracene | 839 | 24.4 | 378 | 8.7 | 45 | 93 |
| fluoranthene | 6514 | 190 | 4755 | 315 | 73 | 94 |
| pyrene | 1719 | 50 | 670 | 40 | 39 | 95 |
| benzo(a)anthracene | 6671 | 194 | 2134 | 93 | 32 | 90 |
| chrysene | 7735 | 225 | 3481 | 247 | 45 | 90 |
| benzo(k)fluoranthene | 4487 | 131 | 2019 | 144 | 45 | 85 |
| benzo(b)fluoranthene | 6475 | 188 | 2719 | 161 | 42 | 86 |
| benzo(a)pyrene | 2147 | 62.5 | 880 | 16 | 41 | 90 |
| indeno(1,2,3,cd)pyrene | 6624 | 193 | 2053 | 110 | 31 | 84 |
| dibenz(ah)anthracene | 685 | 199 | 336 | 38 | 49 | 83 |
| benzo(ghi)perylene | 7686 | 224 | 2459 | 61 | 32 | 80 |
* CRM for PAHs in loamy clay 1; CRM 141: 50 g (ISO/EC 17025 Cert# AT-1467); SD: standard deviation, and ** %: certified value.
Appendix B. Positive Matrix Factorisation (PMF) Calculation
PMF uses positive constraints to obtain physically realistic meanings. The PMF divides receptors into three matrices, the factor contribution (G), factor profile (F), and residual (E), according to the equation:
where Xij is the jth measured species concentration in the ith sample, Gik is the factor contribution of source k to ith sample, Fkj is the fraction of j species in source k, and Eij is the residuals matrix. The resulting PMF is calculated through the weighted least-squares fit-to-search for the appropriate eij by minimising the sum of the normalised Q (US Environmental Protection Agency [19]:
where eij is the scaled residual and vij is the estimated uncertainty. The input data file consisted of sample species concentration values (C) and sample species uncertainty values (U). The uncertainty value for each variable was calculated using the concentration values and the method detection limit (MDL):
If the concentration was less than or equal to the MDL provided, the uncertainty value was calculated using a fixed fraction of the MDL:
Appendix C. Toxicity Equivalency Factor (TEF)
The TEF methodology serves to estimate the risks of a mixture of structurally related chemical compounds, based on the relative toxicity of a given chemical compared to a reference chemical. For the PAHs, the reference chemical was BaP, which was assigned a TEF of 1. The other PAHs were assigned TEFs that were estimated in regard to their orders of magnitude and based on their potency. To calculate the BaP-equivalent concentration (BaPeq) in order to assess the risk from a mixture of PAHs, the concentration of the individual chemical (Ch) had to be multiplied by its TEF value [5,6]:
BaPeq = Σ(Ch × TEF)
In the BaPeq calculation seven cancerogenic PAHs were included such as: Chr, BaA, BkF, BbF, BaP, Inp, and DibA.
References
- Man, Y.B.; Kang, Y.; Wang, H.S.; Lau, W.; Li, H.; Sun, X.L.; Giesy, J.P.; Chow, K.L.; Wong, M.H. Cancer Risk Assessments of Hong Kong Soils Contaminated by Polycyclic Aromatic Hydrocarbons. J. Hazard. Mater. 2013, 261, 770–776. [Google Scholar] [CrossRef]
- Błońska, E.; Lasota, J.; Szuszkiewicz, M.; Łukasik, A.; Klamerus-Iwan, A. Assessment of forest soil contamination in the Krakow surroundings in relation to the type of stand. Environ. Earth Sci. 2016, 75, 1205. [Google Scholar] [CrossRef]
- Bielińska, E.J.; Futa, B.; Ukalska-Jaruga, A.; Weber, J.; Chmielewski, S.; Wesołowska, S.; Mocek-Płóciniak, A.; Patkowski, K.; Mielnik, L. Mutual Relations between PAHs Derived from Atmospheric Deposition, Enzymatic Activity, and Humic Substances in Soils of Differently Urbanized Areas. J. Soils Sediments 2018, 18, 2682–2691. [Google Scholar] [CrossRef]
- Zand, A.D.; Grathwohl, P.; Nabibighendi, G.; Mehrdadi, N. Determination of leaching behaviour of polycyclic aromatic hydrocarbons from contaminated soil by column leaching test. Waste Manag. Res. 2010, 28, 913–920. [Google Scholar] [CrossRef]
- Cai, T.; Ding, Y.; Zhang, Z.; Wang, X.; Wang, T.; Ren, Y.; Dong, Y. Effects of total organic carbon content and leaching water volume on migration behavior of polycyclic aromatic hydrocarbons in soils by column leaching tests. Environ. Pollut. 2019, 254, 112981. [Google Scholar] [CrossRef]
- Jiao, H.; Wang, Q.; Zhao, N.; Jin, B.; Zhuang, X.; Bai, Z. Distributions and Sources of Polycyclic Aromatic Hydrocarbons (PAHs) in Soils around a Chemical Plant in Shanxi, China. Int. J. Environ. Res. Public Health 2017, 14, 1198. [Google Scholar] [CrossRef]
- Jiang, Y.; Yves, U.J.; Sun, H.; Hu, X.; Zhan, H.; Wu, Y. Distribution, Compositional Pattern and Sources of Polycyclic Aromatic Hydrocarbons in Urban Soils of an Industrial City, Lanzhou, China. Ecotoxicol. Environ. Saf. 2016, 126, 154–162. [Google Scholar] [CrossRef]
- Cetin, B.; Ozturk, F.; Keles, M.; Yurdakul, S. PAHs and PCBs in an Eastern Mediterranean Megacity, Istanbul: Their Spatial and Temporal Distributions, Air-Soil Exchange and Toxicological Effects. Environ. Pollut. 2017, 220, 1322–1332. [Google Scholar] [CrossRef]
- Morillo, E.; Romero, A.S.; Maqueda, C.; Madrid, L.; Ajmone-Marsan, F.; Grcman, H.; Davidson, C.M.; Hursthouse, A.S.; Villaverde, J. Soil Pollution by PAHs in Urban Soils: A Comparison of Three European Cities. J. Environ. Monit. 2007, 9, 1001. [Google Scholar] [CrossRef]
- Reis, A.P.M.; Shepherd, T.; Nowell, G.; Cachada, A.; Duarte, A.C.; Cave, M.; Wragg, J.; Patinha, C.; Dias, A.; Rocha, F.; et al. Source and Pathway Analysis of Lead and Polycyclic Aromatic Hydrocarbons in Lisbon Urban Soils. Sci. Total Environ. 2016, 573, 324–336. [Google Scholar] [CrossRef]
- Peng, C.; Ouyang, Z.; Wang, M.; Chen, W.; Li, X.; Crittenden, J.C. Assessing the Combined Risks of PAHs and Metals in Urban Soils by Urbanization Indicators. Environ. Pollut. 2013, 178, 426–432. [Google Scholar] [CrossRef]
- Kwon, H.-O.; Choi, S.-D. Polycyclic Aromatic Hydrocarbons (PAHs) in Soils from a Multi-Industrial City, South Korea. Sci. Total Environ. 2014, 470–471, 1494–1501. [Google Scholar] [CrossRef]
- Liu, X.; Bai, Z.; Yu, Q.; Cao, Y.; Zhou, W. Polycyclic Aromatic Hydrocarbons in the Soil Profiles (0–100 Cm) from the Industrial District of a Large Open-Pit Coal Mine, China. RSC Adv. 2017, 7, 28029–28037. [Google Scholar] [CrossRef]
- Hanus-Fajerska, E.; Ciarkowska, K.; Muszyńska, E. Long-Term Field Study on Stabilization of Contaminated Wastes by Growing Clonally Reproduced Silene Vulgaris Calamine Ecotype. Plant Soil 2019, 439, 431–445. [Google Scholar] [CrossRef]
- WRB Recommendations. Soil Resources Reports; FAO UN: Rome, Italy, 2015; Volume 106. [Google Scholar]
- Ciarkowska, K. Organic Matter Transformation and Porosity Development in Non-Reclaimed Mining Soils of Different Ages and Vegetation Covers: A Field Study of Soils of the Zinc and Lead Ore Area in SE Poland. J. Soils Sediments 2017, 17, 2066–2079. [Google Scholar] [CrossRef]
- Sutkowska, K.; Czech, T.; Teper, L.; Krzykawski, T. Heavy Metals Soil Contamination Induced by Historical Zinc Smelting in Jaworzno. Ecol. Chem. Eng. 2012, 20, 1441–1450. [Google Scholar]
- Ciarkowska, K.; Gambus, F. Building a Quality Index for Soils Impacted by Proximity to an Industrial Complex Using Statistical and Data-Mining Methods. Sci. Total Environ. 2020, 740, 140161. [Google Scholar] [CrossRef]
- Ciarkowska, K.; Miechowka, A. Identification of the factors determining the concentration and spatial distribution of Zn, Pb and Cs in the soils of the non-forest Tatra Mountains (southern Poland). Environ. Geochem. Health 2022. [Google Scholar] [CrossRef]
- Tan, K.H. Soil Sampling, Preparation and Analysis; Taylor & Francis: Boca Raton, FL, USA, 2005. [Google Scholar]
- Cachada, A.; Pereira, R.; da Silva, E.F.; Duarte, A.C. The prediction of PAHs bioavailability in soils using chemical methods: State of the art and future challenges. Sci. Total Environ. 2014, 472, 463–480. [Google Scholar] [CrossRef]
- Statistica (Data Analysis Software System); Version 13.3; StatSoft Inc. Poland: Tulsa, OK, USA, 2014.
- Environmental Protection Agency. Positive Matrix Factorization (PMF) 5.0 Fundamentals and User Guide; EPA/600/R-14/108; Environmental Protection Agency: Washington, DC, USA, 2014. Available online: www.epa.gov (accessed on 24 September 2022).
- Krzaklewski, W.; Barszcz, J.; Małek, S.; Kozioł, K.; Pietrzykowski, M. Contamination of forest soils in the vicinity of the sedimentation pond after zinc and lead ore flotation (in the region of Olkusz, southern Poland). Water Air Soil Pollut. 2004, 159, 151–164. [Google Scholar] [CrossRef]
- Niklińska, M.; Chodak, M.; Laskowski, R. Characterization of the forest humus microbial community in a heavy metal polluted area. Soil Biol. Biochem. 2005, 37, 2185–2194. [Google Scholar]
- Bortey-Sam, N.; Ikenaka, Y.; Nakayama, S.M.M.; Akoto, O.; Yohannes, Y.B.; Baidoo, E.; Mizukawa, H.; Ishizuka, M. Occurrence, Distribution, Sources and Toxic Potential of Polycyclic Aromatic Hydrocarbons (PAHs) in Surface Soils from the Kumasi Metropolis, Ghana. Sci. Total Environ. 2014, 496, 471–478. [Google Scholar] [CrossRef]
- Kwok, K.W.H.; Batley, G.E.; Wenning, R.J.; Zhu, L.; Vangheluwe, M.; Lee, S. Sediment Quality Guidelines: Challenges and Opportunities for Improving Sediment Management. Environ. Sci. Pollut. Res. 2014, 21, 17–27. [Google Scholar] [CrossRef]
- Huang, H.; Xing, X.; Zhang, Z.; Qi, S.; Yang, D.; Yuen, D.A.; Sandy, E.H.; Zhou, A.; Li, X. Polycyclic Aromatic Hydrocarbons (PAHs) in Multimedia Environment of Heshan Coal District, Guangxi: Distribution, Source Diagnosis and Health Risk Assessment. Environ. Geochem. Health 2016, 38, 1169–1181. [Google Scholar] [CrossRef]
- Gallego, J.R.; Esquinas, N.; Rodríguez-Valdés, E.; Menéndez-Aguado, J.M.; Sierra, C. Comprehensive Waste Characterization and Organic Pollution Co-Occurrence in a Hg and As Mining and Metallurgy Brownfield. J. Hazard. Mater. 2015, 300, 561–571. [Google Scholar] [CrossRef]
- Ciarkowska, K.; Konduracka, E.; Gambus, F. Primary Soil Contaminants and Their Risks, and Their Relationship to Myocardial Infarction Susceptibility in Urban Krakow (Poland). Expo. Health 2021, 14, 515–529. [Google Scholar] [CrossRef]
- CCME (Canadian Council of Ministers of the Environment). Canadian Soil Quality Guidelines for the Protection of Environmental and Human Health: Carcinogenics and Other PAHs; CCME, Canadian Council of Ministers of the Environment: Winnipeg, MB, Canada, 2010. [Google Scholar]
- Liu, G.; Niu, Z.; van Niekerk, D.; Xue, J.; Zheng, L.; Whitacre, D.M. Polycyclic Aromatic Hydrocarbons (PAHs) from Coal Combustion: Emissions, Analysis, and Toxicology. In Reviews of Environmental Contamination and Toxicology; Springer: New York, NY, USA, 2010. [Google Scholar] [CrossRef]
- Łyszczarz, S.; Lasota, J.; Błońska, E. Polycyclic Aromatic Hydrocarbons Accumulation in Soil Horizons of Different Temperate Forest Stands. Land Degrad. Dev. 2022, 33, 945–959. [Google Scholar] [CrossRef]
- Ali, M.; Song, X.; Ding, D.; Wang, Q.; Zhang, Z.; Tang, Z. Bioremediation of PAHs and Heavy Metals Co-Contaminated Soils: Challenges and Enhancement Strategies. Environ. Pollut. 2022, 295, 118686. [Google Scholar] [CrossRef]
- Zhao, Z.; Zhuang, Y.-X.; Gu, J.-D. Abundance, Composition and Vertical Distribution of Polycyclic Aromatic Hydrocarbons in Sediments of the Mai Po Inner Deep Bay of Hong Kong. Ecotoxicology 2012, 21, 1734–1742. [Google Scholar] [CrossRef]
- Emoyan, O.O.; Onocha, E.O.; Tesi, G.O. Concentration Assessment and Source Evaluation of 16 Priority Polycyclic Aromatic Hydrocarbons in Soils from Selected Vehicle-Parks in Southern Nigeria. Sci. Afr. 2020, 7, e00296. [Google Scholar] [CrossRef]
- Stogiannidis, E.; Laane, R. Source Characterization of Polycyclic Aromatic Hydrocarbons by Using Their Molecular Indices: An Overview of Possibilities. In Reviews of Environmental Contamination and Toxicology; Whitacre, D.M., Ed.; Springer International Publishing: Cham, Switzerland, 2015; Volume 234, pp. 49–133. ISBN 9783319106373. [Google Scholar]
- Kim, L.; Jeon, H.-J.; Kim, Y.-C.; Yang, S.-H.; Choi, H.; Kim, T.-O.; Lee, S.-E. Monitoring Polycyclic Aromatic Hydrocarbon Concentrations and Distributions in Rice Paddy Soils from Gyeonggi-Do, Ulsan, and Pohang. Appl. Biol. Chem. 2019, 62, 18. [Google Scholar] [CrossRef]
- Hiller, E.; Lachká, L.; Jurkovič, Ľ.; Vozár, J. Polycyclic Aromatic Hydrocarbons in Urban Soils from Kindergartens and Playgrounds in Bratislava, the Capital City of Slovakia. Environ. Earth Sci. 2015, 73, 7147–7156. [Google Scholar] [CrossRef]
- Zhang, J.; Zhan, C.; Liu, H.; Liu, T.; Yao, R.; Hu, T.; Xiao, W.; Xing, X.; Xu, H.; Cao, J. Characterization of Polycyclic Aromatic Hydrocarbons (PAHs), Iron and Black Carbon within Street Dust from a Steel Industrial City, Central China. Aerosol Air Qual. Res. 2016, 16, 2452–2461. [Google Scholar] [CrossRef]
- Xiao, R.; Du, X.; He, X.; Zhang, Y.; Yi, Z.; Li, F. Vertical Distribution of Polycyclic Aromatic Hydrocarbons (PAHs) in Hunpu Wastewater-Irrigated Area in Northeast China under Different Land Use Patterns. Environ. Monit. Assess. 2008, 142, 23–34. [Google Scholar] [CrossRef]
- Zeng, S.; Ma, J.; Ren, Y.; Liu, G.-J.; Zhang, Q.; Chen, F. Assessing the Spatial Distribution of Soil PAHs and Their Relationship with Anthropogenic Activities at a National Scale. Int. J. Environ. Res. Public Health 2019, 16, 4928. [Google Scholar] [CrossRef]
- Pies, C.; Hoffmann, B.; Petrowsky, J.; Yang, Y.; Ternes, T.A.; Hofmann, T. Characterization and Source Identification of Polycyclic Aromatic Hydrocarbons (PAHs) in River Bank Soils. Chemosphere 2008, 72, 1594–1601. [Google Scholar] [CrossRef]
- Sun, Y.; Zhang, S.; Lan, J.; Xie, Z.; Pu, J.; Yuan, D.; Yang, H.; Xing, B. Vertical Migration from Surface Soils to Groundwater and Source Appointment of Polycyclic Aromatic Hydrocarbons in Epikarst Spring Systems, Southwest China. Chemosphere 2019, 230, 616–627. [Google Scholar] [CrossRef]
- Przedpełska, E.; Wierzbicka, M. Arabidopsis Arenosa (Brassicaceae) from a Lead–Zinc Waste Heap in Southern Poland—A Plant with High Tolerance to Heavy Metals. Plant Soil 2007, 299, 43–53. [Google Scholar] [CrossRef]
- Achten, C.; Hofmann, T. Native Polycyclic Aromatic Hydrocarbons (PAH) in Coals—A Hardly Recognized Source of Environmental Contamination. Sci. Total Environ. 2009, 407, 2461–2473. [Google Scholar] [CrossRef]
- Acuña, A.J.; Pucci, O.H.; Pucci, G.N. Effect of Nitrogen Deficiency in the Biodegradation of Aliphatic and Aromatic Hydrocarbons in Patagonian Contaminated Soil. Int. J. Res. Rev. Appl. Sci. 2012, 11, 469–476. [Google Scholar]
- Mackiewicz-Walec, E.; Krzebietke, S.J. Content of Polycyclic Aromatic Hydrocarbons in Soil in a Multi-Annual Fertilisation Regime. Environ. Monit. Assess. 2020, 192, 314. [Google Scholar] [CrossRef]


Publisher’s Note: MDPI stays neutral with regard to jurisdictional claims in published maps and institutional affiliations. |
© 2022 by the authors. Licensee MDPI, Basel, Switzerland. This article is an open access article distributed under the terms and conditions of the Creative Commons Attribution (CC BY) license (https://creativecommons.org/licenses/by/4.0/).