Abstract
The choice of emission control technology in a port supply chain under a cap-and-trade scheme considering low-carbon preferences of customers, is explored in this study. In port areas, the port supply chain consisting of one port and one ship can adopt either shore power (SP) or low sulfur fuel oil (LSFO) to reduce emissions. The economic and social performance of the port supply chain when either SP or LSFO is implemented is compared under three different game models (port-leader Stackelberg game, ship-leader Stackelberg game and the Nash game). The obtained results show that the profits and emissions in the Nash game are higher than those in the other two games. When environmental concern is relatively small, social welfare in the Nash game is the highest, while social welfare in the one-party-dominant structure is superior to that in the Nash structure, under high environmental concern. When the customers’ low-carbon preferences and carbon prices are low, both the supply chain’s profits and carbon emissions when LSFO is used are higher than those from using SP. From the perspective of social welfare maximization, in general, LSFO is preferred when carbon price, customers’ low-carbon preference and environmental concern are all low or are all high. Otherwise, SP is the optimal decision. The findings can provide insights for governments in formulating emission control policies according to their own interests.
1. Introduction
At the 2015 United Nations Climate Change Conference, a history-making agreement to reduce greenhouse gas emissions worldwide was reached by nearly two hundred countries and regions. In September 2020, China formally proposed the goal of reaching a carbon peak by 2030 and achieving carbon neutrality by 2060 at the 75th United Nations General Assembly. The global port and shipping network is an important driving force for world economic growth, and an important part of the global supply chain network. However, frequent shipping activities bring a large amount of pollutants such as NOx, SO2, CO, particulate matter, and CO2 [1]. Port industry as an important part of international shipping also produces a large number of the above pollutants, which seriously threaten the health of coastal residents. As a country with so many ports in the world, the Chinese government has been aware of the port pollution problem and has implemented strict measures. In December 2015, the MOT of the People’s Republic of China set up domestic emission control areas in waters of the Pearl River Delta, the Yangtze River Delta and Bohai Rim (Beijing, Tianjin, Hebei). At the end of 2018, the scope of China’s ECAs extended to the coastal areas and major inland waters of the country. In July 2019, The government of China required ships equipped with shore power (SP) facilities to use SP when docking in ports capable of providing shore power for more than three hours in ECAs, with no effective alternative emissions reduction measures used [2].
At the present time, using SP or LSFO is the popular trend for ships to reduce emission in port areas. Using shore power requires joint effort and investment of ports and ships. Ports builds shore-side facilities to transmit power, while ships install receiving facilities to receive power. The construction of SP facilities requires large initial investment from port and ship, but SP can effectively reduce emissions. Hall [3] proposed that when SP is used, ships in British berths can reduce carbon emissions by approximately 24.5% and reduce NOx by 91.6%. As a type of clean energy, LSFO contains less than 0.1% sulfur. LSFO can be used without upgrading and adding equipment, so there is no initial investment for port or ship. But LSFO is expensive, and produces more carbon emissions than SP.
Emission reduction behaviors of enterprises are usually affected by external factors of the supply chain and their own elements. The external factors of the supply chain mainly include the carbon policy and customers’ low-carbon preference. Carbon tax and cap-and-trade system are two common means for government to regulate enterprises to reduce carbon emissions. Under a cap-and-trade regulation, government firstly allocates a carbon emission quota to enterprises, and the extra quota can be traded on a carbon trading market at a certain carbon price by enterprises. A cap-and-trade scheme has been implemented widely because of the elasticity of the regulation. At present, the Chinese government has piloted cap-and-trade schemes in the shipping markets of Shenzhen and Shanghai.
On the other hand, consumers are increasingly aware of environmental protection, and are inclined to pay higher prices for low-carbon products [4].Wang and Zhao [5] studied the carbon emission reduction behavior of manufacturers and retailers under the circumstance that customers have low carbon preference for products, and found that customers’ low carbon preference plays an important role in supply chain decisions. In July 2016, Maersk Line and Huawei signed a carbon reduction agreement indicating that Maersk Line and Huawei planned to reduce carbon emissions per shipping container by 18% from 2016 to 2020. Prior to the signing of the agreement, Maersk Line and Huawei had cooperated on sustainable development. Huawei awarded Maersk Line the Sustainability Excellence Award in September 2015, recognizing Maersk Line’s sustainability efforts in its supply chain management. In 2020, Maersk Line announced its plan to achieve net Zero CO2 emission by 2050. Maersk Line deems that ship owners and operators increasingly need to be transparent in terms of climate goals and action, which is not only for regulators, but for the expectations of customers, investors, insurance, and the public.
In the port supply chain, as an upstream member, the port provides services to the ship, while the ship provides services to customers. Under a cap-and-trade system, regulators allocate a reasonable carbon emission quota to the port with the maximum supply chain profit and the minimum amount of carbon emissions. These two goals are inevitably conflicting, so, according to Krass et al. [6], the “environmental concern” parameter is introduced to measure society’s environmental concerns on the emissions of the supply chain.
With the above-mentioned goals, what is the impact of a cap-and-trade scheme and customers’ low carbon preference, on the decision of technologies? The game models are built under three scenarios. Firstly, the port possesses the dominant power, acting as a leader [7], namely port-leader Stackelberg (PS); secondly, the shipping company is able to integrate logistics services, and acts as a leader [8], namely ship-leader Stackelberg (SS). Thirdly, both the port and ship are equal, namely the Nash (NS) game.
There are at least three main contributions to this paper. Firstly, the choice of two emission reduction technologies are studied from a supply chain perspective, which is seldom investigated in the available literature. Secondly, two kinds of technologies (SP and LSFO) are compared under three power structures and considering customers’ low-carbon preference with respect to economic and social benefits. Last but not least, the customers’ low-carbon preference is considered, rarely studied in the existing literature. The obtained results help the port and shipping company to choose the appropriate reduction emission technologies, and provide the insights into government policies. The rest of this paper is as follows: the related literature is reviewed in Section 2. Section 3 gives the necessary notation and assumptions. The models are derived and solved in Section 4. Equilibrium results are compared and analyzed in Section 5. Numerical experiments are given in Section 6, followed by conclusions in Section 7.
2. Literature Review
The emissions emitted by the supply chain have aroused wide concern, hence, many governments have implemented a cap-and-trade system in practice to promote emissions reduction. In this context, the impact of a cap-and-trade system on the supply chain and the related operational decisions have become hot topics in academia. Xu et al. [9] illustrated firms in the supply chain could reduce carbon emissions by cooperation without decreasing their profits. Yang et al. [10] investigated a remanufacturing closed-loop supply chain under the cap-and-trade system. Qu et al. [11] studied the impact of a cap-and-trade system on product warranty policy and carbon emission reduction strategies. Ebrahimi et al. [12] proposed a double-level sustainability effort in a sustainable supply chain, consisting of one manufacturer and one retailer, under the cap-and-trade system. Wang et al. [13] investigated the effects of emissions trading on the manufacturer’s abatement investment, supply chain performance and social welfare. Zhou et al. [14] comprehensively analyzed port-related emissions and their environmental impacts. They proposed that the emission control policies to reduce the port-related emissions, especially for the cargo-delivery transport phase from port to city, are key for large coastal port cities such as Shanghai. Although the existing literature investigated the optimization of ship speed [15], the approach to the evaluation of technology and capacity choices for ships [16], and renewable energy sources, clean fuels and measures of efficient energy use in ports [17], there are few studies in the literature concerning the impact of a cap-and-trade system on port and navigation from the perspective of the supply chain. While there is now a rich literature on the cap-and-trade scheme from the perspective of the product supply chain, surprisingly little work of this kind has studied and analyzed it from the perspective of port and navigation supply chains. But the port and navigation supply chain is different from the product supply chain. The port and navigation supply chain is essentially the idea of providing services, which requires the port and shipping company to have good cooperation, to save more costs, and to provide customers with a better service experience. Therefore, this article investigates the emission control technology decision of the port supply chain, which will fill the gap to some extent.
Under the background of global low-carbon economy, customers’ low-carbon preference has also attracted the attention of scholars around the world. In the port supply chain, customers’ low-carbon preference also plays a positive role in port emission reduction, but there is little research on this aspect. In the studies related to the product supply chain, Yu and Hou [18] investigated the influence of consumers’ low-carbon preferences on the market demand. Su et al. [19] built a pricing decision model in a green supply chain in line with consumer green preference, considering different forms of subsidy and various power structures. Pan et al. [20] proposed a two-party game model in a supply chain consisting of one greener and one dirtier manufacturer, considering green consumption preferences under a cap-and-trade scheme. At present, there are abundant articles about the influence of consumers’ low-carbon preference on the operation and decisions of the product supply chain. However, the related work on the influence of customers’ low-carbon preferences on the operational decisions of the port and shipping supply chain are still in the initial stages. This article investigates the influence of customers’ low-carbon preferences on the port and shipping supply chain, which will enrich the related study field.
SP and LSFO are the primary technologies used to reduce emissions. Thalis and Zis [21] analyzed the prospect of shore power by testing the quantitative framework, and showed that when the regulators assisted, the emission reduction by using SP was feasible. Martínez and Romero [22] proposed a calculation method to evaluate a specific environmental charge in ports, which encouraged short-route ships to adopt shore power. Reusser and Pérez [23] evaluated emission impact by using the bi-directional power flow control strategies when ships used shore power in berths, and optimized the auxiliary engine operating profile. Martínez-López et al. [24] evaluated the effect of emission reduction of shore power and LNG in Switzerland respectively using a calculation method. Cao et al. [25] analyzed the environmental benefits of shore power using an economic cost method, and tested the feasibility of the shore power. With regard to LSFO, Panasiuk and Lebedevas [26] compared the advantages and disadvantages of using LSFO and scrubber in ECAs. A cost-benefit analysis of the limit provisions which required the sulfur to be no more than 0.1% in the Baltic Sea ECAs was performed in [27]. The results suggested that ship type and size and fuel consumption would affect the choice of LSFO and scrubber. Most articles analyzed the feasibility of the two technologies from the aspects of emission reduction and cost, and rarely compared the technologies in terms of technological technical differences, or economic and social benefits. The present study compares the service prices, profits, carbon emissions, and social welfare of the two technologies, considering customers’ low-carbon preferences, which will fill the gap to some extent.
3. Notation and Basic Assumptions
In the supply chain, the ship provides services for customers and obtains revenues, but pays the port for berthing services. therefore, the total service price for customers is included in the port’s charges and the fees of the ship. The demand correlation and competition among berthed ships is weak, and hence this paper proposes a supply chain composed of one port and one ship, for simple illustration. This setting describes the reality to some extent, and is widely used in the available literature [28,29]. Of course, it can also be extended to multiple ports and ships settings in future studies.
In a cap-and-trade scheme, the government firstly allocates a carbon emission quota to the port. SP and LSFO can be used by the supply chain to reduce carbon emissions. SP increases the cost of both port and ship for equipping SP facilities, whereas LSFO only increases the ship’s costs as shown in Figure 1.
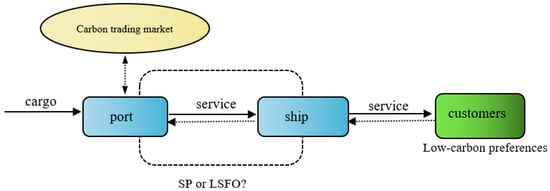
Figure 1.
The decision of emission control technology in the port supply chain.
3.1. Notation
Table 1 shows the relevant parameters and decision variables. SP and LSFO are represented by subscript i (i = E, L). Three types of game (PS, SS, and NS) are denoted by subscript j (j = P, S, N). The superscript n (n = p, s, sc) indicates the object of the port, ship, and the supply chain. p denotes the supply chain’s service price, and satisfies .

Table 1.
Parameters and decision variables.
3.2. Basic Assumptions
Two key assumptions are presented to facilitate the subsequent modelling and analysis.
Assumption 1.
Compared with SP, LSFO produces more carbon emissions [30], i.e.,. In addition, the model would be trivial if the voluntary adoption of SP without policy intervention was in the supply chain’s interest. Therefore, the cost of SP is assumed to be higher, i.e., .
Assumption 2.
Following Liu et al. [31] and Qian et al. [32], the demand function is
4. Models and Solutions
4.1. Implementation of SP
When SP is adopted, the profits are as follows:
The total carbon emissions and social welfare are
In Equation (5), According to Krass et al. [6],
denotes the environmental concern, and T2 indicates the negative disutility of the total emissions.
Solving the above models under three different power structures by standard backward induction as shown in Appendix A.1, the equilibrium results are given in Table 2.
Table 2.
Equilibrium results when SP is adopted.
Where A = .
4.2. Implementation of LSFO
When the supply chain adopts LSFO, the profit and total carbon emission function is derived as Formulas (6)–(8):
Similar to SP, solving the above models again as shown in Appendix A.2, Table 3 gives the results:
Table 3.
Results when LSFO is adopted.
Where B = .
5. Analysis and Discussion
Based on the comparative analysis and the sensitivity analysis, the impacts of different parameters on optimal price, emissions, profits and social welfare are obtained, which can help the port and shipping company to choose the appropriate technologies and provide insights into government policies. The Appendix A.3 can be referenced for detailed proof of the lemmas and propositions.
5.1. Optimal Price Analysis
The influence of operational parameters on the supply chain’s optimal service prices is given in Lemma 1 and Proposition 1.
Lemma 1.
In the port supply chain, when SP is used,is increasing in, , while it is decreasing inis increasing inand, while it is decreasing in. When LSFO is used,is increasing in, while it is decreasing in,. is increasing in, and, while it is decreasing in.
Obviously, of port and ship increase their own operational costs, and the total service price of the supply chain is increasing in and . However, both members of the supply chain may decrease the prices when the costs of the other increase, to earn more profits.
Proposition 1.
Lemma 1 and Proposition 1 indicate that under all the three power structures, the impact of carbon price and low-carbon preference on the overall demand in its pricing is always considered by the leader. Therefore, the optimal price in the Nash game is lower than that in one-part-dominant game.
5.2. Profits Analysis
Comparing the optimal profits under the three power structures and different technologies in the supply chain, the impact of operational parameters on optimal profits are obtained as follows:
Lemma 2.
increases in K and is concave with respect to, . Moreover,is also a convex function of.
With the operational costs, carbon price and emissions increasing, the port supply chain’s total profits suffer firstly from higher costs. In particular, when the operational costs, carbon price and emissions are extremely high, the shipping company may reduce its service to decrease costs. To a certain extent, the port supply chain may not offer service.
Proposition 2.
Profits in the port supply chain satisfy
Proposition 2 shows that leaders in the game always obtain more profits than followers, whether for port or ship. The supply chain’s profits in the Nash game are the highest. Therefore, the equal relationships between port and ship should be encouraged, with the regulators more involved in the supply chain’s overall profits.
Proposition 3.
The profits of port supply chain satisfy: if, then
Proposition 3 indicates that, in a situation where the customer’s low-carbon preference is certain, and when carbon price is low, from the respective of the supply chain’s profits, LSFO is preferred; otherwise, SP is the better choice. In a situation where the carbon price is certain, when customers’ low-carbon preference is high, from the perspective of the supply chain’s profits, LSFO is preferred; otherwise, SP is the better choice. However, with the carbon price and customers’ low-carbon preference increasing, the choice of technology is a complex problem, because it is affected by the relationship between costs and emissions of the technologies, which will be investigated in Section 6, with numerical examples. If the carbon price is extremely high, the price for customers would be very high, resulting in very low market demand. In this situation, no matter which technology is used, the profits of the two technologies are very similar.
5.3. Analysis of the Total Carbon Emissions
The changes of carbon emissions in the port supply chain with respect to the operational costs, carbon price, and low-carbon preference, are investigated in this section.
Lemma 3.
decreases inand,increases in. decreases in, and.
With the operational costs and carbon price increasing, the supply chain service prices also increase, and market demands decline, so the total carbon emissions decrease. When the low-carbon preference of customers increase, the market demands increase, hence the total carbon emissions increase.
Proposition 4.
The supplychain’s carbon emissions satisfy
Proposition 4 shows that when port and shipping company are in a relatively equal relationship, they tend to price low to attract more customers and expand the market, and thus generate more emissions, while in the Stackelberg game, the leader always limits the motivation of the other to provide services, inducing emissions reduction. It is noted that Proposition 2 indicates that the total supply chain profits in the Nash game are the highest, but when carbon emissions is the concern of regulators, the Stackelberg game is preferred.
Proposition 5.
Under different technologies, the total carbon emissions satisfy.If otherwise,
In a situation where the carbon price and low-carbon preference are both very low, the optimal prices and profits of the supply chain almost unaffected by carbon emissions and low-carbon preference, then using LSFO is preferred with respect to the overall cost. At this time, low service prices lead to high demand, and, combined with the higher unit emissions, using LSFO produces more total carbon emissions than using SP. With the increase of carbon price and low-carbon preference, the overall cost superiority of adopting SP gradually emerges. When the carbon price and low-carbon preference satisfy certain conditions, even if the unit emissions of SP are lower, the total emissions of adopting SP may exceed those of LSFO, because the supply chain may tend to offer more services. however, it is important to note that there is an upper limit to the value of the carbon price, to ensure positive demand. The threshold in Proposition 5 may exceed the upper limit, leading to under all possible values of These findings are helpful for regulators to formulate reasonable carbon price policies and management measures to promote emission reductions of the port and ship.
5.4. Social Welfare Analysis
Social welfare is compared under three power structures and two technologies in this section.
Proposition 6.
Referring to channel power structure, the social welfare satisfies.
.
Propositions 2 and 4 indicate that the Nash game has the most total profits and highest carbon emissions. When is low, the negative effects of emissions on sw is small, therefore the sw in the Nash game is the highest. With increasing, the negative effects of emissions on sw rise accordingly. Ultimately, when increases to a certain level, the social welfare of the two Stackelberg games becomes higher than that of the Nash game. The results give some suggestion for regulators to encourage a certain power structure to maximize social welfare.
Proposition 7.
Referring to different technologies, social welfare satisfies
- if , then ,
- if , then ,
- If , then .
where,)(,)().
Proposition 7 shows that when is low, with respect to social welfare, SP is preferred to LSFO, but with a high , LSFO is the better choice. However, because the expression of the threshold is so complex, numerical examples are needed to illustrate this situation.
5.5. Managerial Insights
According to the above propositions and lemmas, in the port supply chain, acting as leaders in the game chain always obtains more profits than being followers, whether for port or ship. The supply chain’s profits in the Nash game are the highest. In practice, ports always act as leaders in the port supply chain because of their own resources, and can obtain more benefits than when they are followers. If ships want to obtain more profits, they should take a leadership position. Therefore, ships strive to gain more discourse rights through alliances in practice, such as the world’s three major ship alliances, 2M, THE, and OCEAN. When the carbon price is low, from the perspective of profits, LSFO is preferred, with the advantage of low overall costs. While the carbon price is high, SP is preferred. Therefore, when the carbon price is low, for port and ship, using LSFO to reduce emissions is preferred. Otherwise, using SP is the better choice.
Proposition 4 shows that the carbon emissions of the port supply chain in the Nash game are higher than in the Stackelberg games, while Proposition 3 indicates the total supply chain profits in the Nash game are highest. Therefore, if the government is concerned to control emissions, encouraging the one-part-dominant structure is the better choice. however, if the government concern to maximize profits, supporting the Nash game would be preferred. If the objective of the government is social welfare maximization, when the carbon price, customers’ low-carbon preferences and environmental concern are low, or all of them are high, LSFO should be supported. Otherwise, SP may be better. The customers’ low carbon preferences can help the supply chain reduce emissions, because it can expand the market demand and increase the profits of the supply chain. Therefore, the government should actively propagandize environmental protection and cultivate enterprises’ low-carbon awareness.
At present, the Chinese government is actively promoting SP by subsidizing ports and shipping enterprises. Statistics released by the MOT of China show that from 2016 to 2018, the central government provided subsidies for ports and ships in coastal and inland port areas to construct SP. In the last three years, a total of CNY 740 million has been arranged to support the use of SP. With the support from the government, more than 40 percent of the major Chinese ports have installed SP infrastructure. However, the current penetration rate of SP refitted ships is less than 1% [33], and the willingness of ships to use SP is still low. According to the obtained results, the Chinese government can implement a cab-and-trade scheme with a higher carbon price, to promote the use of SP. In fact, the Chinese government has piloted a cap-and-trade system in the shipping markets of Shenzhen and Shanghai. It is noted that the influence of customers’ low-carbon preferences should be taken into account. Firstly, the overall emissions of the supply chain increase in the customers’ low-carbon preferences. Secondly when the customers’ low-carbon preferences are high, a high carbon price is needed to promote the SP. However, when the carbon price and customers’ low-carbon preferences increase and satisfy a certain condition, the total carbon emissions of the supply chain using SP may surpass those using LSFO. Therefore, the cab-and-trade scheme should be implemented cautiously, according to customers’ low-carbon preferences.
6. Numerical Examples Analysis
In order to expound more clearly the above lemmas and propositions, some numerical examples are given in this part. Unless otherwise specified, the relevant parameters in the model are as follows [34], .
6.1. Impact of and on Profits
A comparison of the port’s profits between the three power structures is showed in Figure 2, while Figure 3 shows the changes in the shipping enterprise’s profits. Consistent with Proposition 3, the leaders always achieve the highest profits, and the followers always obtained the lowest profits, whether for port or shipping enterprise. It is apparently shown that the Nash game possesses the highest profits compared with the other two power structures in Figure 4. The overall profits of the supply chain are a convex function of and as described in Lemma 2, and this is also shown in Figure 4.
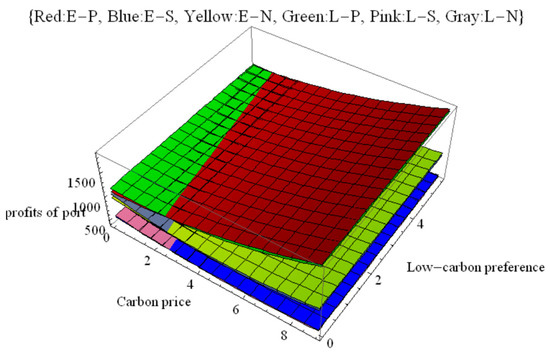
Figure 2.
The profits of the port.
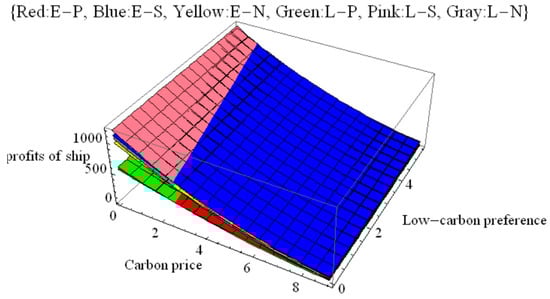
Figure 3.
The profits of the ship.
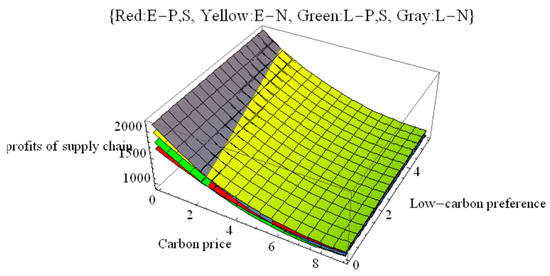
Figure 4.
The profits of the supply chain.
The technologies comparison in respect to profits is complicated. When carbon prices and low-carbon preference are very low, the emission penalties and incentives for low emissions are negligible, and at this time LSFO with low cost is preferred. As the carbon price and low-carbon preference increase, SP will gradually surpass LSFO and become preferred. However, when the carbon price rise to the threshold, the supply chain’s profits will become zero, because the emissions penalties are so high that the port and ship would no longer offer services.
6.2. Impact of and on Carbon Emissions
Figure 5 shows that the carbon emissions under the Nash game are highest, as described in Proposition 5. When the carbon price and low-carbon preference of customers are both low, the carbon emissions from using LSFO are higher. With the increasing of , the carbon emissions of using SP surpass those of using LSFO. However, when rises to a very high level, the service offered by the port supply chain in all power structures drops to an extremely low level, and the emissions of three power structures approach each other. Therefore, if emissions reduction is the only goal of regulators, LSFO would be better in the case of a low carbon price, whereas SP would be preferred in the case of a high carbon price, as shown in Proposition 6.
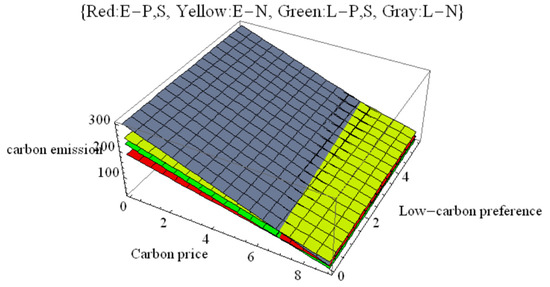
Figure 5.
Total carbon emissions of supply chain.
6.3. Impact of on Social Welfare
Some parameters of Figure 6 are redefined, to better illustrate the impacts of on sw changes. The left-hand side of the figure represents the low carbon price situation in which = 0.2. The right-hand side represents = 8, ∈ [0, 0.02]. In Figure 6, Proposition 6 is clearly illustrated.
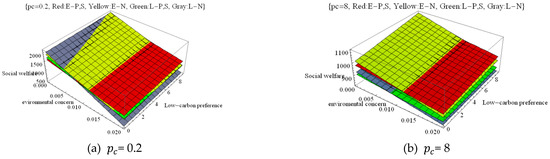
Figure 6.
Change of social welfare under environmental concern and low-carbon preference.
Given a certain technology, from a social welfare maximization perspective, if is small, the Nash game with higher profits would be the first choice. Otherwise, the Stackelberg games would be better.
The comparison of the sw between SP and LSFO is complicated. Here, taking the Nash game as an example, there are two different carbon price cases, as shown in Figure 6.
The case of low carbon price is illustrated in the left figure. When the low-carbon preference of customers is low, according to Proposition 3, the profits of the supply chain from using LSFO are higher than those from adopting SP. In addition, the carbon emissions from adopting LSFO are also higher than those from adopting SP, in line with Proposition 5. Therefore, under a low carbon price, LSFO is preferred to SP as leading to higher social welfare under low environmental concern. As increases, the penalty of carbon emissions increases, hence social welfare decreases. However, the social welfare of adopting LSFO drops more significantly than that using SP, because of higher emissions. Therefore, under high environmental concern, SP is preferred to LSFO with higher social welfare.
However, in the case of high carbon price, as indicated in Propositions 3 and 5, in the port supply chain, both profits and carbon emissions from adopting SP are higher than those from adopting LSFO. Therefore, the change of social welfare with respect to is opposite to that in the low-carbon-price case, as expressed on the right-hand side of Figure 5. Hence, in general, when , and are all low or are all high, LSFO is preferred; otherwise, SP is the better choice.
7. Conclusions and Future Research
The supply chain consisting of one port and one ship under a cap-and-trade scheme with low-carbon preference of customers is discussed in the paper. The supply chain can choose SP or LSFO, to reduce carbon emissions. The game models are built under three power structures. Economic and social benefits of the port supply chain are evaluated when either SP or LSFO is used. The influence of the power structures, the cab-and-trade scheme, customers’ low-carbon preferences, and the environmental concern on the technology choice concerning profits, carbon emissions, and social welfare are discussed.
The total profits and carbon emissions in the Nash game are higher than those in the Stackelberg games. When carbon price and low-carbon preference of customers are both low, the overall profits and carbon emissions from using LSFO are higher than those from using SP. Under a low environmental concern, the Nash game has the highest social welfare, while the social welfare in the Stackelberg games is higher than in the Nash game when the environmental concern is high. In general, when carbon price, low-carbon preference of customers and environmental concern are all low or are all high, the whole social welfare from adopting LSFO is higher than from adopting SP.
Based on the obtained results, if emission control is the only concern, the one-part- dominant supply chain would be preferred, with fewer carbon emissions; however, the balanced power structure is the better choice when profits are the only goal. For the choice of technologies, if profit is the only concern, LSFO would be preferred when the carbon price and customers’ low-carbon preferences are low. If the objective is social welfare maximization, in general, when the carbon price, customers’ low carbon preferences and environmental concern are all low, or all of them are high, LSFO would be preferred. Otherwise, SP would be the better choice. These results can provide meaningful insights for firms to choose the appropriate emission control technologies and for regulators to formulate appropriate emission control policies, according to their own interests.
In practice, the emission reduction decisions of port and navigation enterprises are affected by many factors, such as the resources of the ports, the features of the ships, the competitive relationship among the ports, the competitive relationship of the vessels, and the uncertainty of market demand. Therefore, the choice of emission control technologies of the port and shipping enterprises is more complex. Therefore, a more realistic supply chain with multiple ports, multiple shipping companies, and a random order of the shipping market is the research direction for the future. Furthermore, other carbon emission control policies, such as a carbon tax and subsidies, can also be incorporated into the current study in the future.
Author Contributions
Conceptualization, H.Z.; methodology, H.Z.; software, W.Z.; validation, H.Z.; formal analysis, H.Z. and W.Z.; investigation, W.Z.; resources, H.Z.; writing—original draft preparation, H.Z.; writing—review and editing, W.Z.; funding acquisition, H.Z. All authors have read and agreed to the published version of the manuscript.
Funding
The research is supported by the Natural Science Foundation of Guangdong Province of China (2021A1515110213), Philosophy and Social Science Planning Project of Guangdong Province of China (GD20CGL44).
Institutional Review Board Statement
Not applicable.
Informed Consent Statement
Not applicable.
Data Availability Statement
The data that are presented in this study are available within the figures and tables.
Conflicts of Interest
The authors declare no conflict of interest.
Appendix A
Appendix A.1. Solutions When SP Is Implemented
(1) In ship-leader Stackelberg, the profits of the port are: .
Solving , , Substituting m* into , and solving , , Thus,
(2) In the Nash game, the profits of the shipping company are: , Solving , , the port’s profits are:. Solving , . Now solving above two equations simultaneously,
,
Thus:
(3) In the port-leader game, the profits of the shipping company are: , Solving , substituting into , and solving , , thus,
Appendix A.2. Solutions When LSFO Is Implemented
Similarly to the case of adopting SP, the equilibrium results under LSFO can be obtained easily, so the solution process is omitted.
Appendix A.3. Proofs
Proof of Lemma 1.
□
Proof of Proposition 1.
When the SP is used, comparing the optimal prices as follows,
since , must satisfy therefore, , .
When the LSFO is used, comparing the optimal prices as follows,
since , must satisfies , therefore,. □
Proof of Lemma 2.
- (1)
- .
- (2)
- .
- (3)
- . □
Proof of Proposition 2.
comparing the optimal profits between two technologies as follows, for the port,
therefore,
For the ship company,
therefore,
For the supply chain as a whole
therefore, . □
Proof of Proposition 3.
The profits under two different technologies are compared as follows,
where , , are constants.
Since , must satisfies , , therefore, if , then
□
Proof of Lemma 3.
- (1)
- When .
- (2)
- When . □
Proof of Proposition 4.
the carbon emissions in three power structures are compared as follows,
Since , must satisfy , , Therefore, . □
Proof of Proposition 5.
The carbon emissions under different technologies are compared as follows,
if , then otherwise, . □
Proof of Proposition 6.
Comparing sw under three power structures
Therefore, if . □
Proof of Proposition 7.
Comparing sw under two technologies
Since , therefore,
- If , then ,
- If , then ,
- If , then .
where
□
References
- Yang, L.; Cai, Y.; Wei, Y.; Huang, S. Choice of technology for emission control in port areas: A supply chain perspective. J. Clean. Prod. 2019, 240, 118105. [Google Scholar] [CrossRef]
- Zhang, Q.Z.Z. Study on the development and evolution of Ship emission control zone policy in China. J. Dalian Marit. Univ. 2020, 19, 67–72. [Google Scholar]
- Hall, W.J. Assessment of CO2 and priority pollutant reduction by installation of shore side power. Resour. Conserv. Recycl. 2010, 54, 462–467. [Google Scholar] [CrossRef]
- Zhu, W.; He, Y. Green product design in supply chains under competition. Eur. J. Oper. Res. 2017, 258, 165–180. [Google Scholar] [CrossRef]
- Wang, Q.; Zhao, D. Cooperative strategy of carbon emissions reduction and promotion in a two-echelon supply chain. Control. Decis. 2014, 29, 307–314. [Google Scholar]
- Krass, D.; Nedorezov, T.; Ovchinnikov, A. Environmental taxes and the choice of green technology. Prod. Oper. Manag. 2013, 22, 1035–1055. [Google Scholar] [CrossRef]
- Asadabadi, A.; Miller-Hooks, E. Optimal transportation and shoreline infrastructure investment planning under a stochastic climate future. Transp. Res. Part B Methodol. 2017, 100, 156–174. [Google Scholar] [CrossRef]
- Liu, W.; Wang, S.; Zhu, D.; Wang, D.; Shen, X. Order allocation of logistics service supply chain with fairness concern and demand updating: Model analysis and empirical examination. Ann. Oper. Res. 2018, 268, 177–213. [Google Scholar] [CrossRef]
- Xu, X.; He, P.; Xu, H.; Zhang, Q. Supply chain coordination with green technology under cap-and-trade regulation. Int. J. Prod. Econ. 2017, 183, 433–442. [Google Scholar] [CrossRef]
- Yang, L.; Hu, Y.; Huang, L. Collecting mode selection in a remanufacturing supply chain under cap-and-trade regulation. Eur. J. Oper. Res. 2020, 287, 480–496. [Google Scholar] [CrossRef]
- Qu, S.; Yang, H.; Ji, Y. Low-carbon supply chain optimization considering warranty period and carbon emission reduction level under cap-and-trade regulation. Environ. Dev. Sustain. 2021, 23, 18040–18067. [Google Scholar] [CrossRef]
- Ebrahimi, S.; Hosseini-Motlagh, S.M.; Nematollahi, M.; Cárdenas-Barrón, L.E. Coordinating double-level sustainability effort in a sustainable supply chain under cap-and-trade regulation. Expert Syst. Appl. 2022, 207, 117872. [Google Scholar] [CrossRef]
- Wang, X.; Sethi, S.P.; Chang, S. Pollution abatement using cap-and-trade in a dynamic supply chain and its coordination. Transp. Res. Part E Logist. Transp. Rev. 2022, 158, 102592. [Google Scholar] [CrossRef]
- Zhou, Y.; Zhang, Y.; Ma, D.; Lu, J.; Luo, W.; Fu, Y.; Li, S.; Feng, J.; Huang, C.; Ge, W.; et al. Port-related emissions, environmental impacts and their implication on green traffic policy in Shanghai. Sustainability 2020, 12, 4162. [Google Scholar] [CrossRef]
- Xing, Y.; Yang, H.; Ma, X.; Zhang, Y. Optimization of ship speed and fleet deployment under carbon emissions policies for container shipping. Transport 2019, 34, 260–274. [Google Scholar] [CrossRef]
- Haehl, C.; Spinler, S. Technology choice under emission regulation uncertainty in international container shipping. Eur. J. Oper. Res. 2020, 284, 383–396. [Google Scholar] [CrossRef]
- Hoang, A.T.; Foley, A.M.; Nižetic, S.; Huang, Z.; Ong, H.C.; Ölçer, A.I.; Pham, V.V.; Nguyen, X.P. Energy-related approach for reduction of CO2 emissions: A strategic review on the port-to-ship pathway. J. Clean. Prod. 2022, 355, 131772. [Google Scholar] [CrossRef]
- Yu, S.; Hou, Q. Supply chain investment in carbon emission-reducing technology based on stochasticity and low-carbon preferences. Complexity 2021, 2021, 8881605. [Google Scholar] [CrossRef]
- Su, C.; Liu, X.; Du, W. Green supply chain decisions considering consumers’ low-carbon awareness under different government subsidies. Sustainability 2020, 12, 2281. [Google Scholar] [CrossRef]
- Pan, Y.; Hussain, J.; Liang, X.; Ma, J. A duopoly game model for pricing and green technology selection under cap-and-trade scheme. Comput. Ind. Eng. 2021, 153, 107030. [Google Scholar] [CrossRef]
- Zis, T.P.V. Prospects of cold ironing as an emissions reduction option. Transp. Res. Part A Policy Pract. 2019, 119, 82–95. [Google Scholar] [CrossRef]
- Martínez-López, A.; Romero, A.; Orosa, J.A. Assessment of cold ironing and LNG as mitigation tools of short sea shipping emissions in port: A Spanish case study. Appl. Sci. 2021, 11, 2050. [Google Scholar] [CrossRef]
- Reusser, C.A.; Pérez, J.R. Evaluation of the emission impact of cold-ironing power systems, using a bi-directional power flow control strategy. Sustainability 2021, 13, 334. [Google Scholar] [CrossRef]
- Martínez-López, A.; Romero-Filgueira, A.; Chica, M. Specific environmental charges to boost cold ironing use in the European short sea shipping. Transp. Res. Part D Transp. Environ. 2021, 94, 102775. [Google Scholar] [CrossRef]
- Cao, D.; Ma, Z.; Zheng, W.; Xu, K.; Ma, Z.; Song, C. Research on energy efficiency economy and environmental benefit evaluation method of ship shore electricity technology. In Proceedings of the 2017 4th International Conference on Information Science and Control Engineering (ICISCE), Changsha, China, 21–23 July 2017; pp. 1636–1640. [Google Scholar]
- Panasiuk, I.; Lebedevas, S. The assessment of the possibilities for the Lithuanian fleet to comply with new environmental requirements. Transport 2014, 29, 50–58. [Google Scholar] [CrossRef]
- Antturi, J.; Hänninen, O.; Jalkanen, J.P.; Johansson, L.; Prank, M.; Sofiev, M.; Ollikainen, M. Costs and benefits of low-sulphur fuel standard for Baltic Sea shipping. J. Environ. Manag. 2016, 184, 431–440. [Google Scholar] [CrossRef]
- Chen, K.; Wang, X.; Huang, M.; Ching, W.K. Salesforce contract design, joint pricing and production planning with asymmetric overconfidence sales agent. J. Ind. Manag. Optim. 2017, 13, 873. [Google Scholar] [CrossRef][Green Version]
- Liu, W.; Wang, D.; Tang, O.; Zhu, D. The impacts of logistics service integrator’s overconfidence behaviour on supply chain decision under demand surge. Eur. J. Ind. Eng. 2018, 12, 558–597. [Google Scholar] [CrossRef]
- China Port. Management Suggestions on the Development of China’s Shore Power. 2017. Available online: http://www.escn.com.cn/news/show-430111.html (accessed on 12 June 2017).
- Liu, Z.L.; Anderson, T.D.; Cruz, J.M. Consumer environmental awareness and competition in two-stage supply chains. Eur. J. Oper. Res. 2012, 218, 602–613. [Google Scholar] [CrossRef]
- Qian, X.; Liu, W.; Yang, J. Game theory analysis of technology adoption timing and pricing decision in supply chain system under asymmetric Nash equilibrium. J. Intell. Fuzzy Syst. 2018, 35, 3101–3111. [Google Scholar] [CrossRef]
- Li, L. Why Is It Difficult to Promote Shore Power, China Energy News. 2019. Available online: http://www.escn.com.cn/news/show-702856.html (accessed on 6 August 2022).
- Yang, L.; Cai, Y.; Zhong, X.; Shi, Y.; Zhang, Z. A carbon emission evaluation for an integrated logistics system—A case study of the port of Shenzhen. Sustainability 2017, 9, 462. [Google Scholar] [CrossRef]


Publisher’s Note: MDPI stays neutral with regard to jurisdictional claims in published maps and institutional affiliations. |
© 2022 by the authors. Licensee MDPI, Basel, Switzerland. This article is an open access article distributed under the terms and conditions of the Creative Commons Attribution (CC BY) license (https://creativecommons.org/licenses/by/4.0/).