Article

Spatial Delineation for Great Wall Zone at Sub-Watershed Scale: A Coupled Ecological and Heritage Perspective

1
Key Laboratory of Urban Stormwater System and Water Environment, Ministry of Education, Beijing University of Civil Engineering and Architecture, Zhanlanguan Road, Xicheng District, Beijing 100044, China
2
College of Architecture and Urban Planning, Beijing University of Civil Engineering and Architecture, Beijing 100044, China
3
College of Architecture and Urban Planning, Tongji University, Shanghai 200092, China
*
Author to whom correspondence should be addressed.
Sustainability 2022, 14(21), 13836; https://doi.org/10.3390/su142113836
Submission received: 22 September 2022 / Revised: 13 October 2022 / Accepted: 17 October 2022 / Published: 25 October 2022

Abstract

:
The Great Wall is a world-famous World Heritage Site facing serious environmental and structural fragmentation problems. This study considered the watershed an essential basis for delineating the Great Wall cultural zone boundary. The relevant watersheds and their scope in the Beijing Great Wall cultural zone were determined, and a sub-watershed classification index system was constructed. The sub-watershed type conservation areas were classified using the k-means clustering method. The relationships among heritage, ecological, socioeconomic, and hydrological elements were analyzed to obtain the essential characteristics of the spatial differentiation of watershed types. Heritage had a promoting effect on urbanization; urbanization had a pressurizing effect on the ecological environment, whereas heritage had a binding effect on the ecological environment. The protected areas defined at the sub-watershed scale in this study have better connectivity and integrity. Not only does it help to monitor, prevent and control the various natural and human-related issues and hazards that occur at the watershed scale, but it also helps in informing the sustainable conservation and development of the Great Wall.

1. Introduction

The Great Wall was designated a World Heritage Site by UNESCO in 1987 and is of great historical, cultural, scientific, artistic, and tourism value. However, it also faces significant problems such as high heritage vulnerability, geological hazard damage [1], and weathering and erosion [2]. Inevitably, the threats that occurred in the past and present have rendered some issues regarding the size and representativeness of the protected areas to be designed [3]. Protected areas’ conservation goals and targets range from biological, geological, and economic to sociocultural and heritage [4,5]. Among the studies related to the conservation of the Great Wall’s heritage, many scholars have achieved quite fruitful results in different fields, such as military defense colonies [6,7], landscape vegetation [8,9], ecological hazards [10], and the deterioration of earthen sites of the wall [11,12]. For the purpose of heritage conservation, new protected areas and protected area management classifications have been continuously established based on international environmental organizations or conventions (e.g., World Heritage Sites) and nationally and locally designated names (e.g., national parks) [4].
Currently, the methods to delimit the protection scope of the Great Wall protection area mainly include a heritage corridor [13] and buffer radius protection area [14,15], etc. Some scholars have also put forward a variety of schemes for the division of the site protection area and conducted comparative analyses [16]. In April 2019, the Beijing Great Wall Cultural Belt Protection and Development Plan (2018–2035) had been completed within one and a half years. The spatial scope of the Beijing Great Wall cultural belt was determined and is dominated by the boundary between the Great Wall protection and administrative border of each town. The core area is the Great Wall protection area and the Type I construction control area, covering an area of 2228.02 km2; the buffer area, excluding the core area, is 2701.27 km2, which covers the ecological conservation area in northern Beijing [17]. Located in remote mountainous areas, the Great Wall is faced with problems of heritage protection, ecological integrity, and resilience to natural disturbance. It is not just a wall that is protected, but on top of that, the radiating area around, which is ecologically and socially impacted, is also protected. This shows that the conservation scale is also critical to ensuring the conservation effectiveness of protected areas.
However, these studies at home and abroad are mostly from the perspective of single factors, often only talking about one or several aspects of the Great Wall’s heritage protection, which is the micro-level of the development of heritage protection. Few scholars have analyzed the preservation and development of the Great Wall’s heritage from ecological, environmental protection, protected areas, and spatial layout perspectives. There is a lack of relevant research on the sub-watershed of heritage in this region. These problems directly affect the heritage’s protection, management, research, and surrounding ecology. It is of weak guiding significance to the macroscopic strategic level of heritage protection. Many essential aspects of the Great Wall’s heritage conservation research remain explored.
Combined with the Great Wall’s heritage, this study proposed to delimit the scale of heritage protection and carry out corresponding protection by taking the watershed scale as a protection area unit. The reasons include watershed characteristics, ecological environment, and human history. At the same time, watersheds are defined by topography, have clear geographical boundaries within ecosystems, and are complete, independent, self-contained geographical units [18,19,20]. Additionally, the delineation and classification of watershed units are essential to achieving this goal. The boundary of the sub-watershed of the Ming Great Wall protection zone was delimited using hydrological analysis. The watershed approach is intended to couple social decision-making processes with geographically—rather than politically—defined districts. It offers a special opportunity for addressing environmental inequalities across space [21]. In terms of the ecological environment, a sub-watershed is an ideal spatial scale for studying ecosystem characteristics [22]. In addition, sub-watershed is increasingly becoming an organizational unit for assessing and managing human impacts on the environment [23]. Therefore, there is a need to identify the protection scope of the Great Wall from a coupled ecological and heritage perspective to guide conservation planning and strategies. Watershed boundaries distinguish spatial units because they represent the connectivity and integrity of the ecosystem and heritage. In human history, as an excellent military defense project during the time of cold weapons, the Great Wall’s military functionality was of utmost importance, as castles were often built on top of high mountains or in deep valleys to control watersheds and maximize the use of favorable terrain for military defense [24]. Thus, the watersheds and related heritages were a critical component of the Great Wall’s military defense system, such as the Watergates of the Great Wall, including Badaling Great Wall, Shuiguan Great Wall, Badaling Great Wall relics, Chadao village, the Guangou gorge, and Juyongguan pass [25]. It fits the logic of building a military defense system and integrating it with an ecosystem. Therefore, from the perspective of ecological environment and heritage coupling, research on the demarcation of the Great Wall protection boundary by watershed is the innovation of this paper.
Based on the watershed’s significant impact on the Great Wall’s heritage protection, this paper focuses on the boundary demarcation and watershed-type classification of the heritage sub-watershed protection zone from ecological and heritage coupling perspectives. Specifically, the study attempts to figure out the following issues: (1) identifying the boundary of the heritage-protected zone using the watershed as the study unit; (2) establishing a classification indicator system integrating four attribute dimensions characterized by heritage, ecology, hydrology, and society; (3) the spatial distribution and correlation analysis of the indicators; (4) the method that could be applied to the watershed classification of the Great Wall cultural zone; (5) the classification of results that are used to clarify characteristics and their implications for the management of cultural heritage, ecological conservation, and economic development. The research aims to promote the application of heritage watershed-scale studies, which involve classifying protected areas and describing and analyzing heritage watershed systems in the Great Wall basin. It provides the fundamental scientific basis for Great Wall protection and management decisions.

2. Materials and Methods
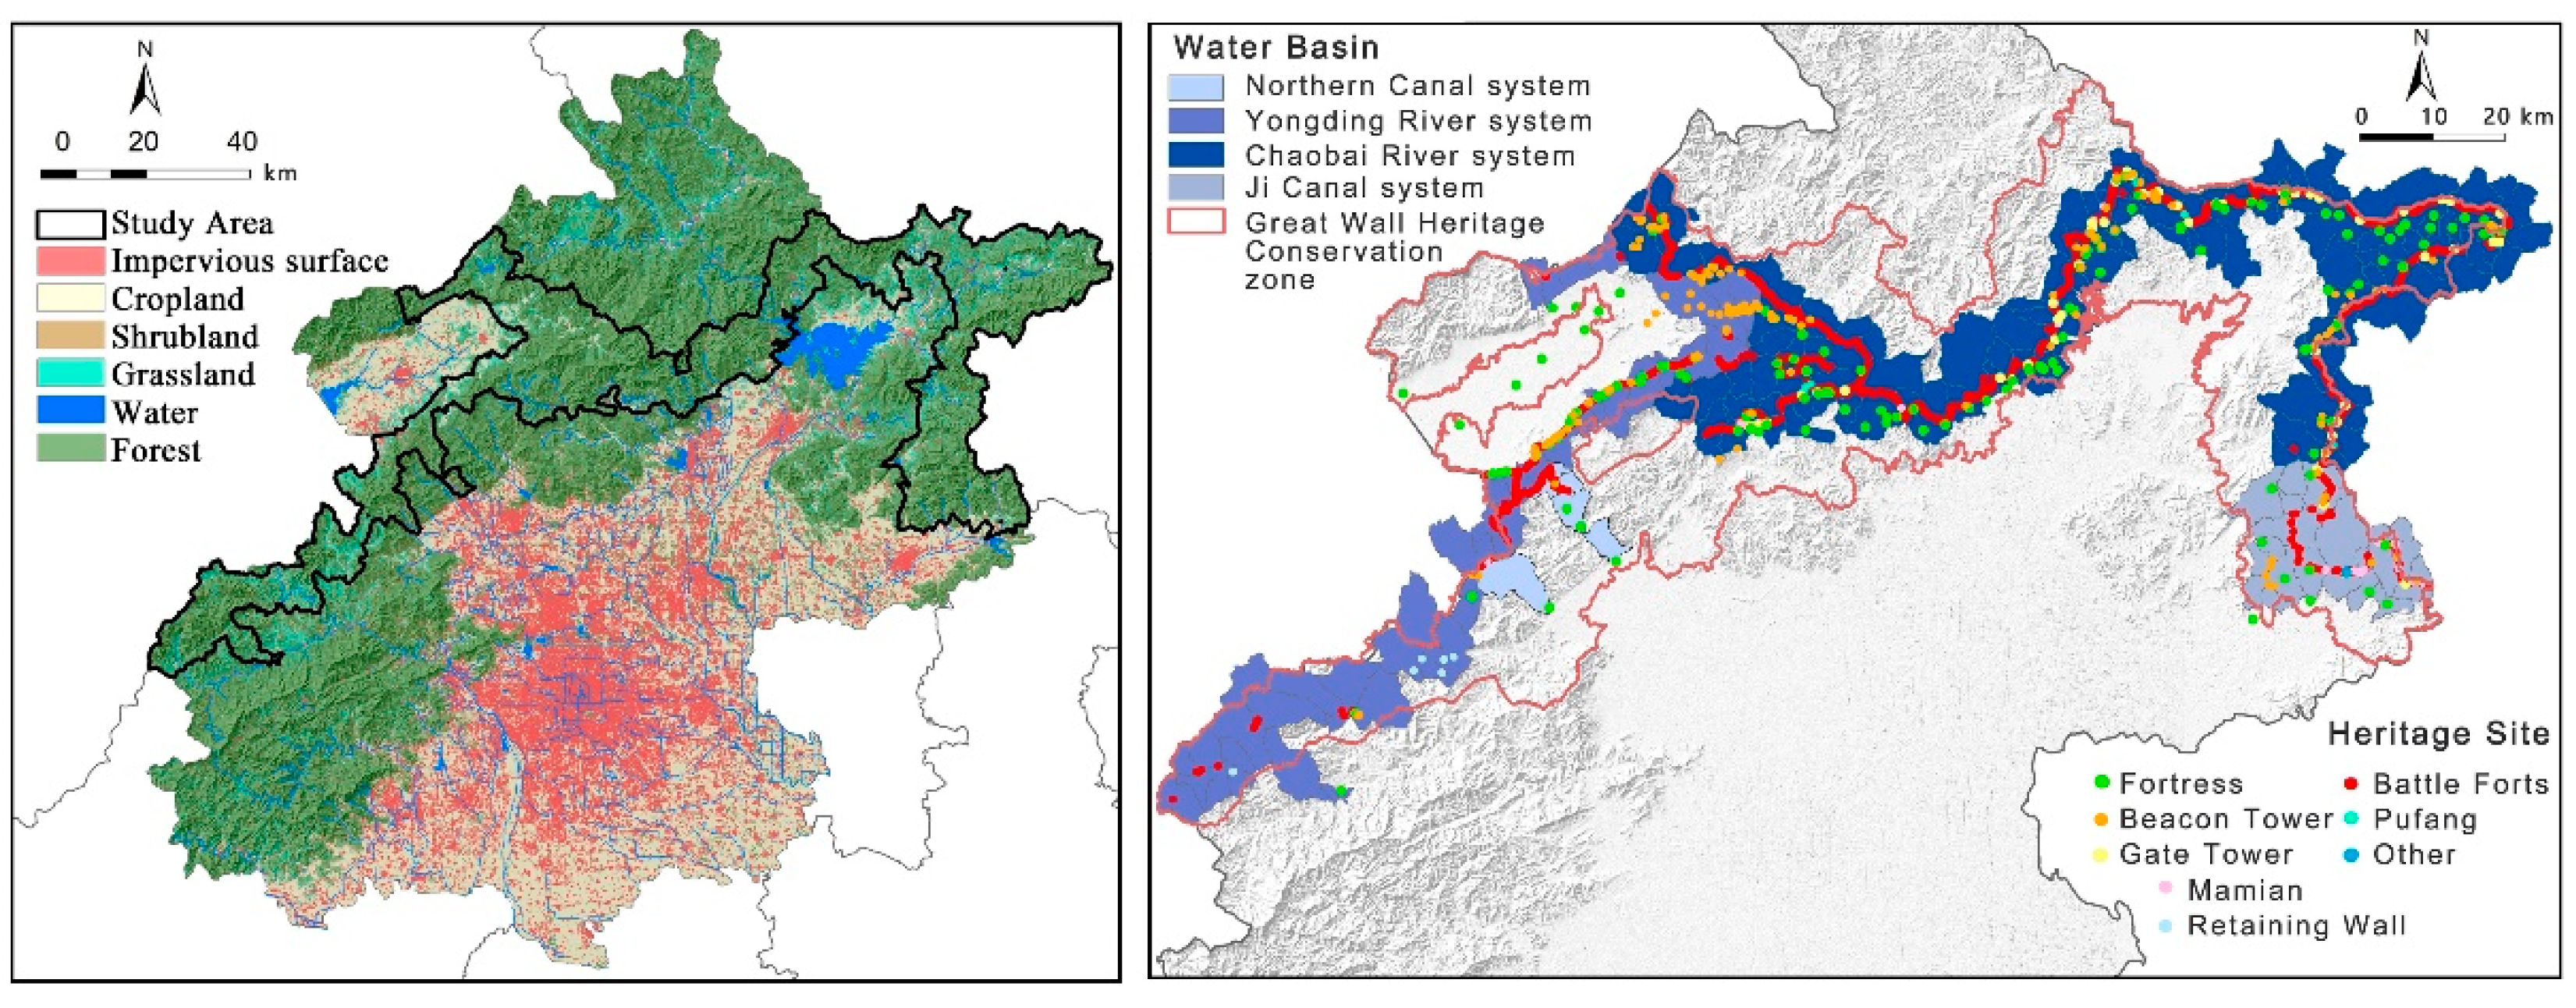
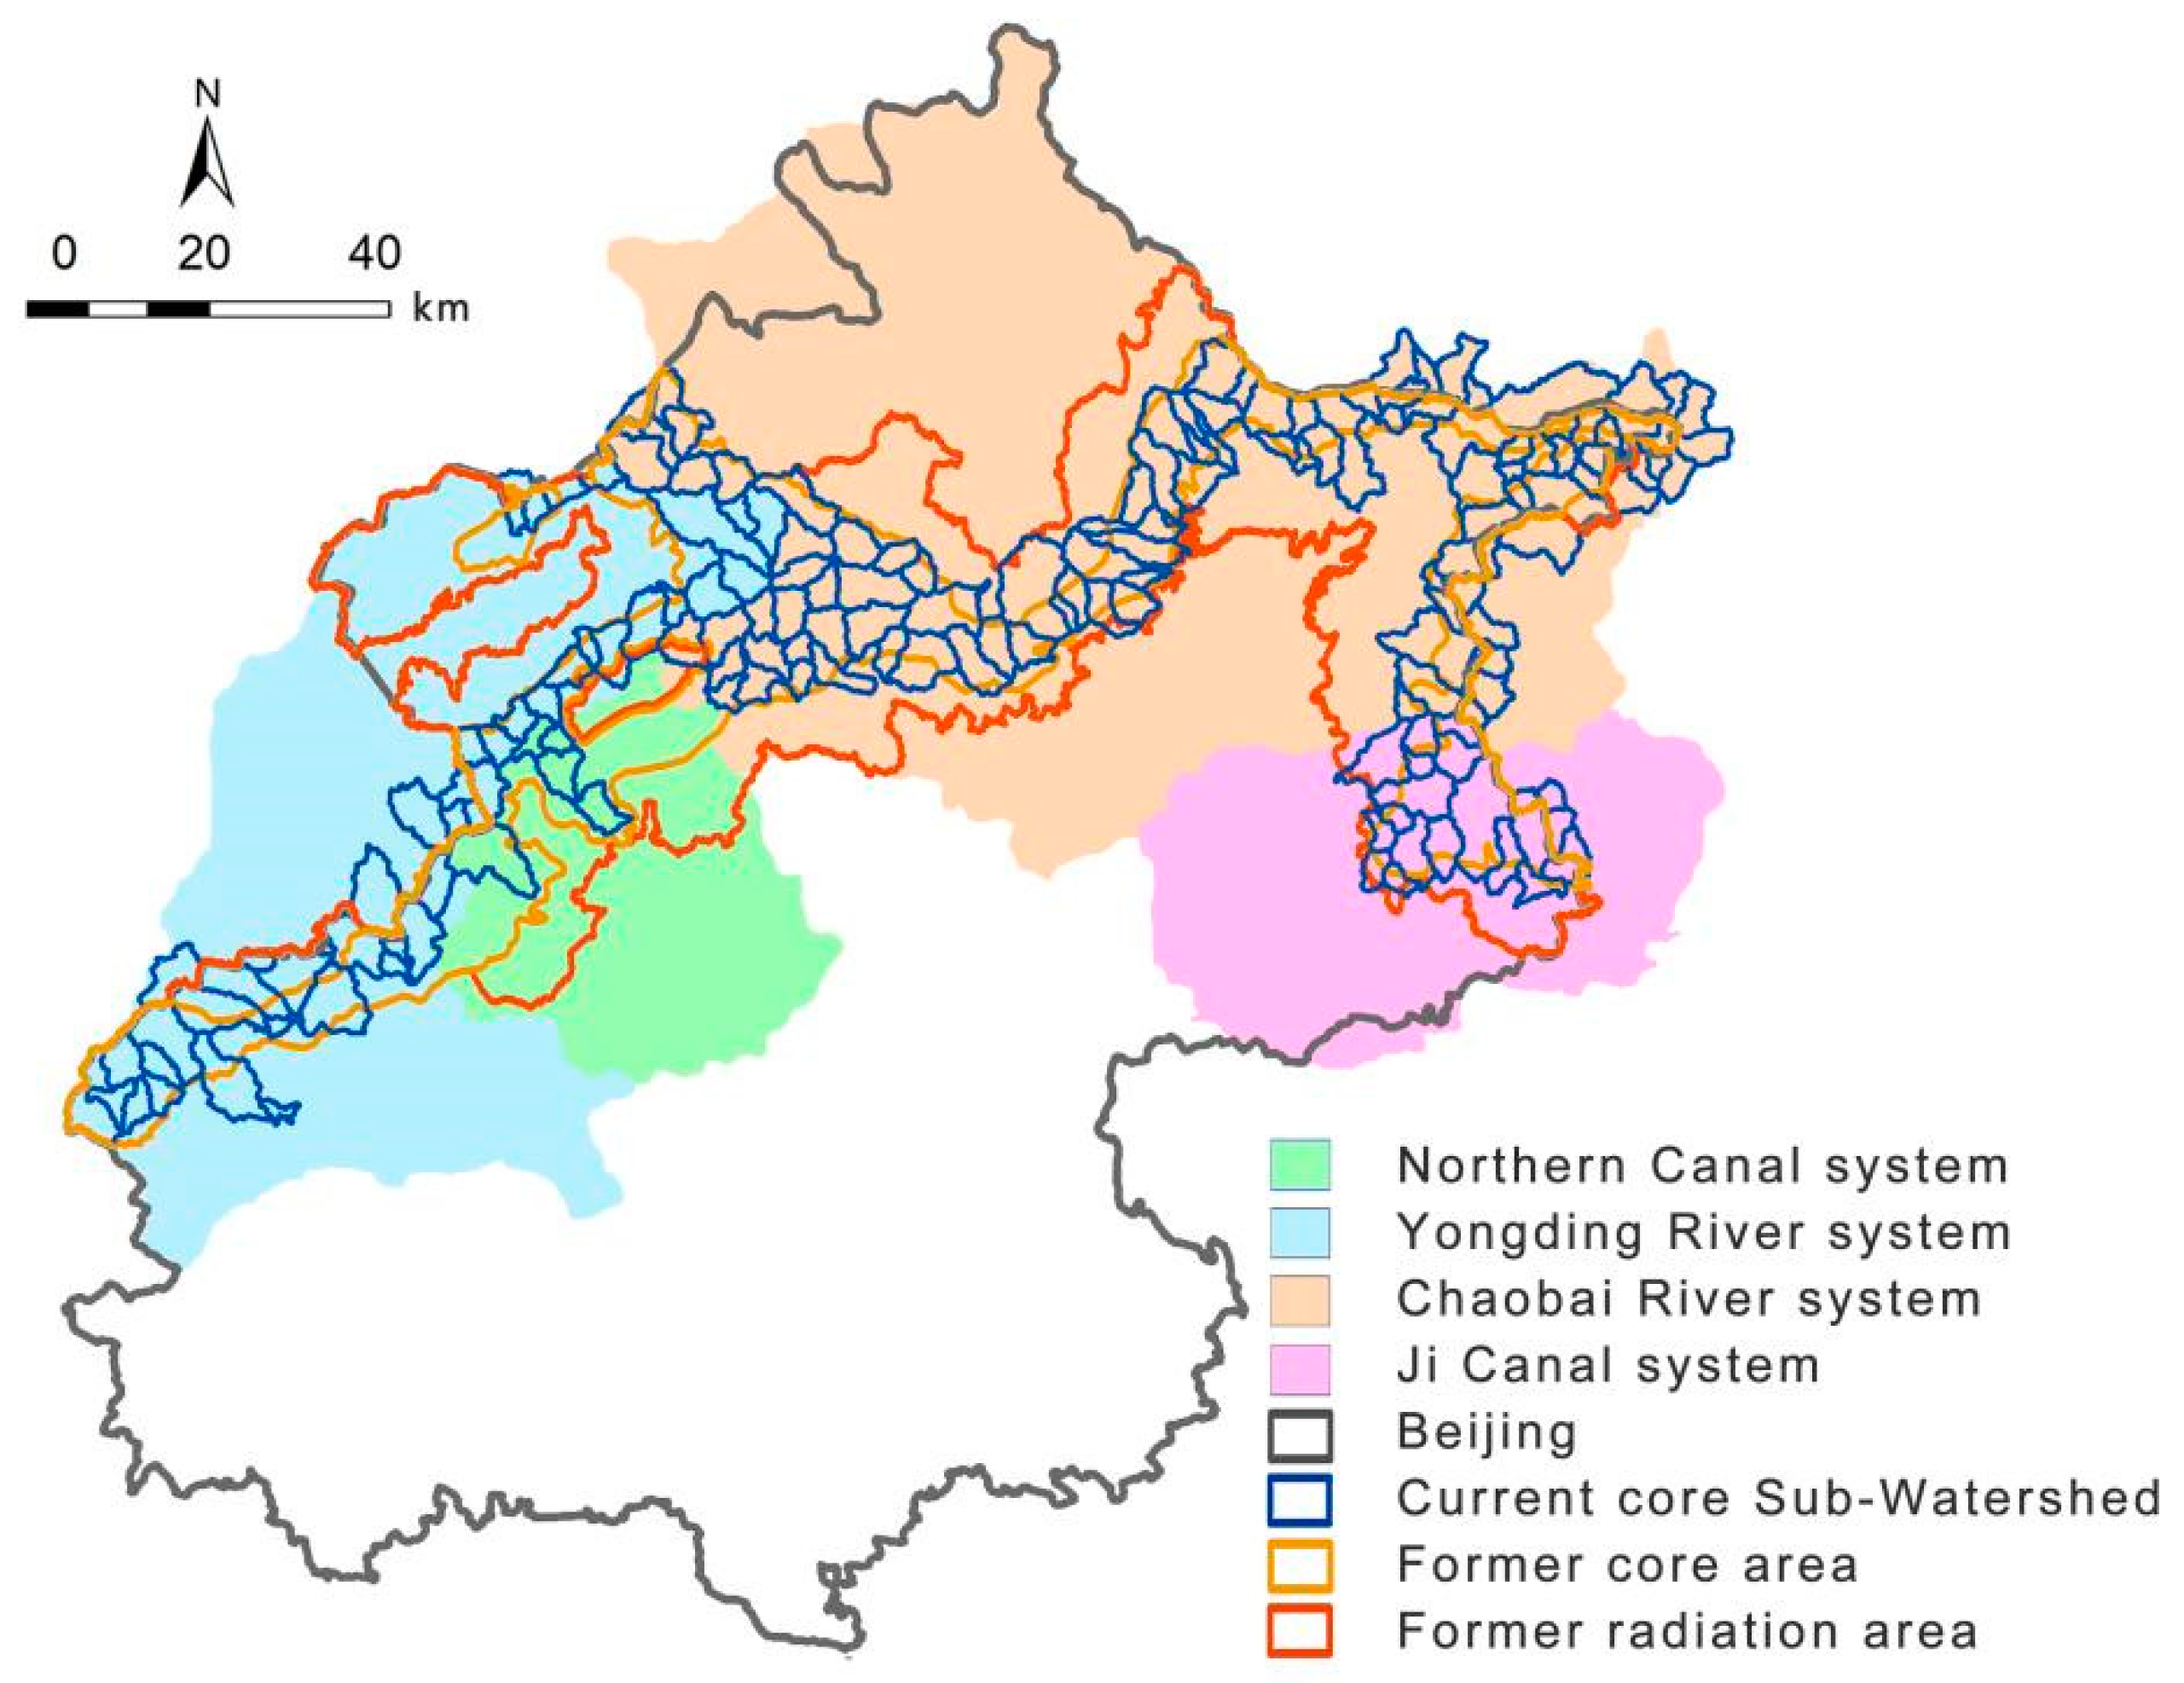
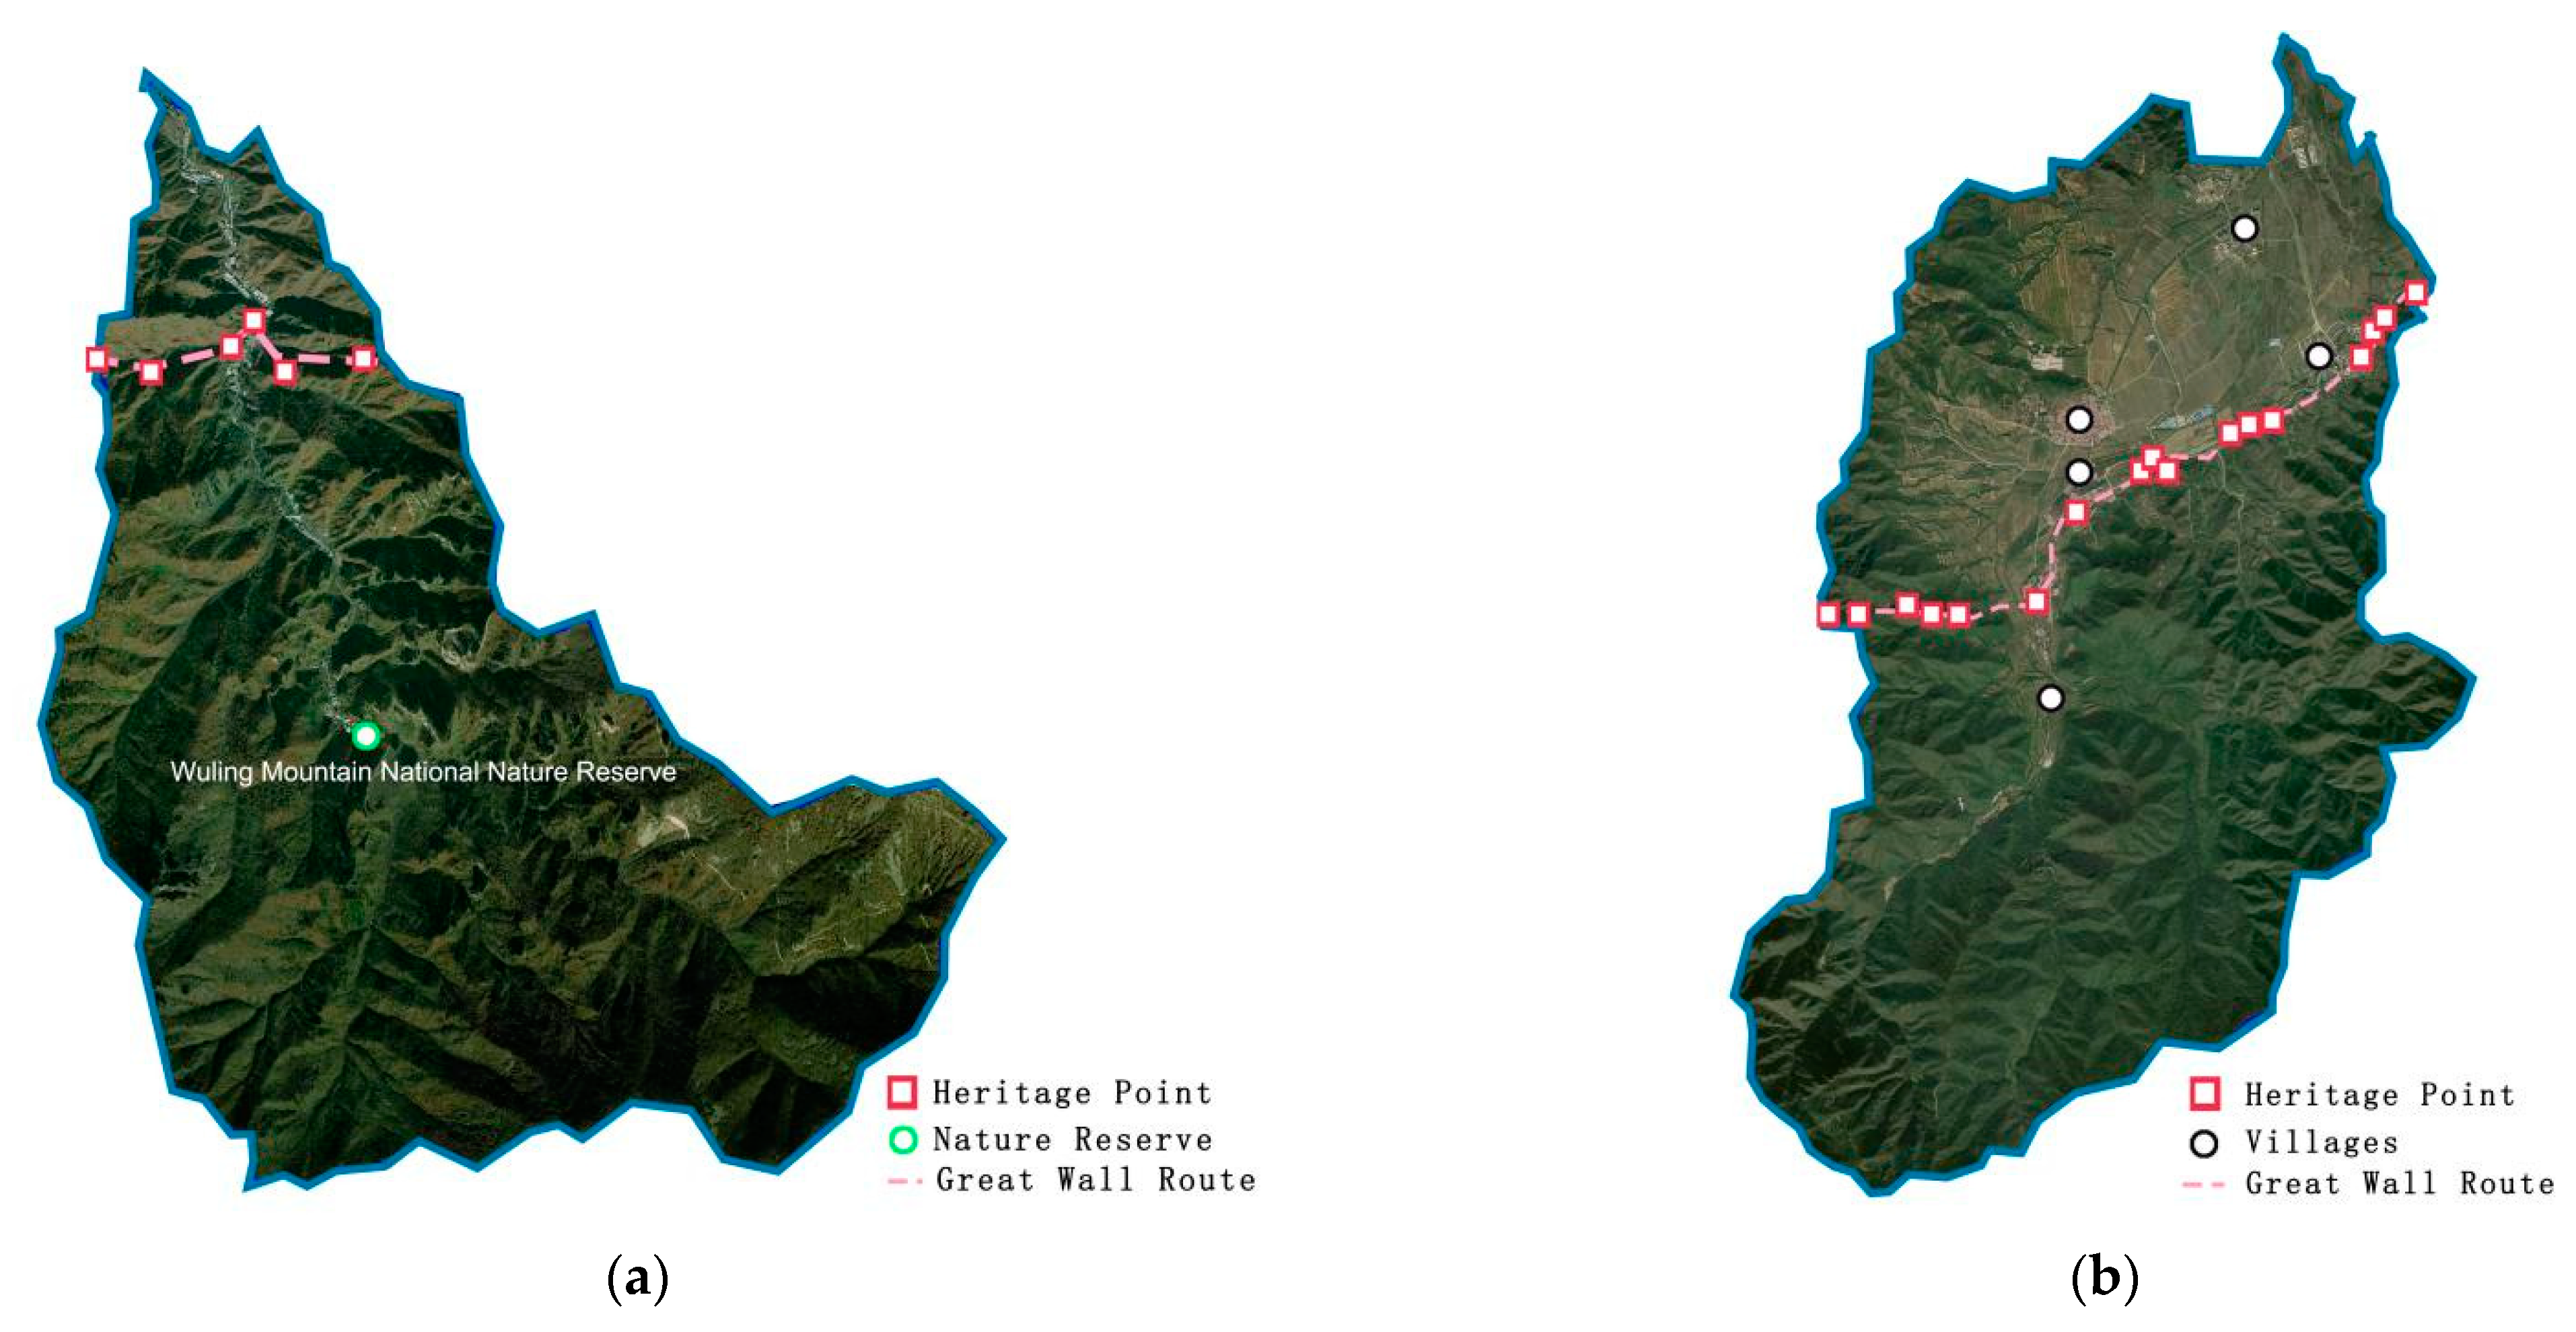
2.1. Study Area

This paper selects the Great Wall cultural zone in Beijing as the study area. Beijing’s section of the Great Wall has high protection levels, concentrated distribution, the most significant number of tourists, and a well-preserved military defense system. It is an essential part of the heritage-protected zone, unique and highly representative. The Great Wall is built on sheer mountain ridges, and the perfect defense works involve battle forts, beacon towers, fortresses, pufangs, mamians, barracks, etc. (A mamian is a rectangular pier projecting from the wall at regular intervals and is a defensive facility of the wall; a pufang is a building built on the city wall or on the enemy platform for the soldiers on patrol and sentry duty to shelter from the wind and rain.) It is mainly located in the Yan Mountain and Jundu Mountain regions, covering most of the mountainous area from southwest to northeast Beijing. The mountainous area of Beijing spans about 200 km, with a width of about 50 km, and is influenced by topographical factors (Figure 1). According to statistics, 40% of the mountainous areas have frequent heavy rainfall and are prone to natural disasters such as flash floods and debris flows due to hydraulic and gravitational erosion [26]. They threaten the heritages, villages, cities, residents’ lives, and property safety.

2.2. Data Collection

The primary data used in this study and their sources are listed in Table 1. They include both statistical and spatial data. The data years are 2015–2020, and the study years’ overall variability is insignificant. The Great Wall’s heritage data come from the Great Wall, and the village distribution data come from the National Bureau of Statistics. The land use, NDVI, GDP, and population density data come from the Data Center for Resources and Environmental Sciences, CAS website. The grid precision of the data is 1 km. The topographical data come from the Geospatial Data Cloud. The soil erosion data come from China Ecosystem Assessment and Ecological Security Patterns Database. The A-class scenic spot comes from the Ministry of Culture and Tourism.

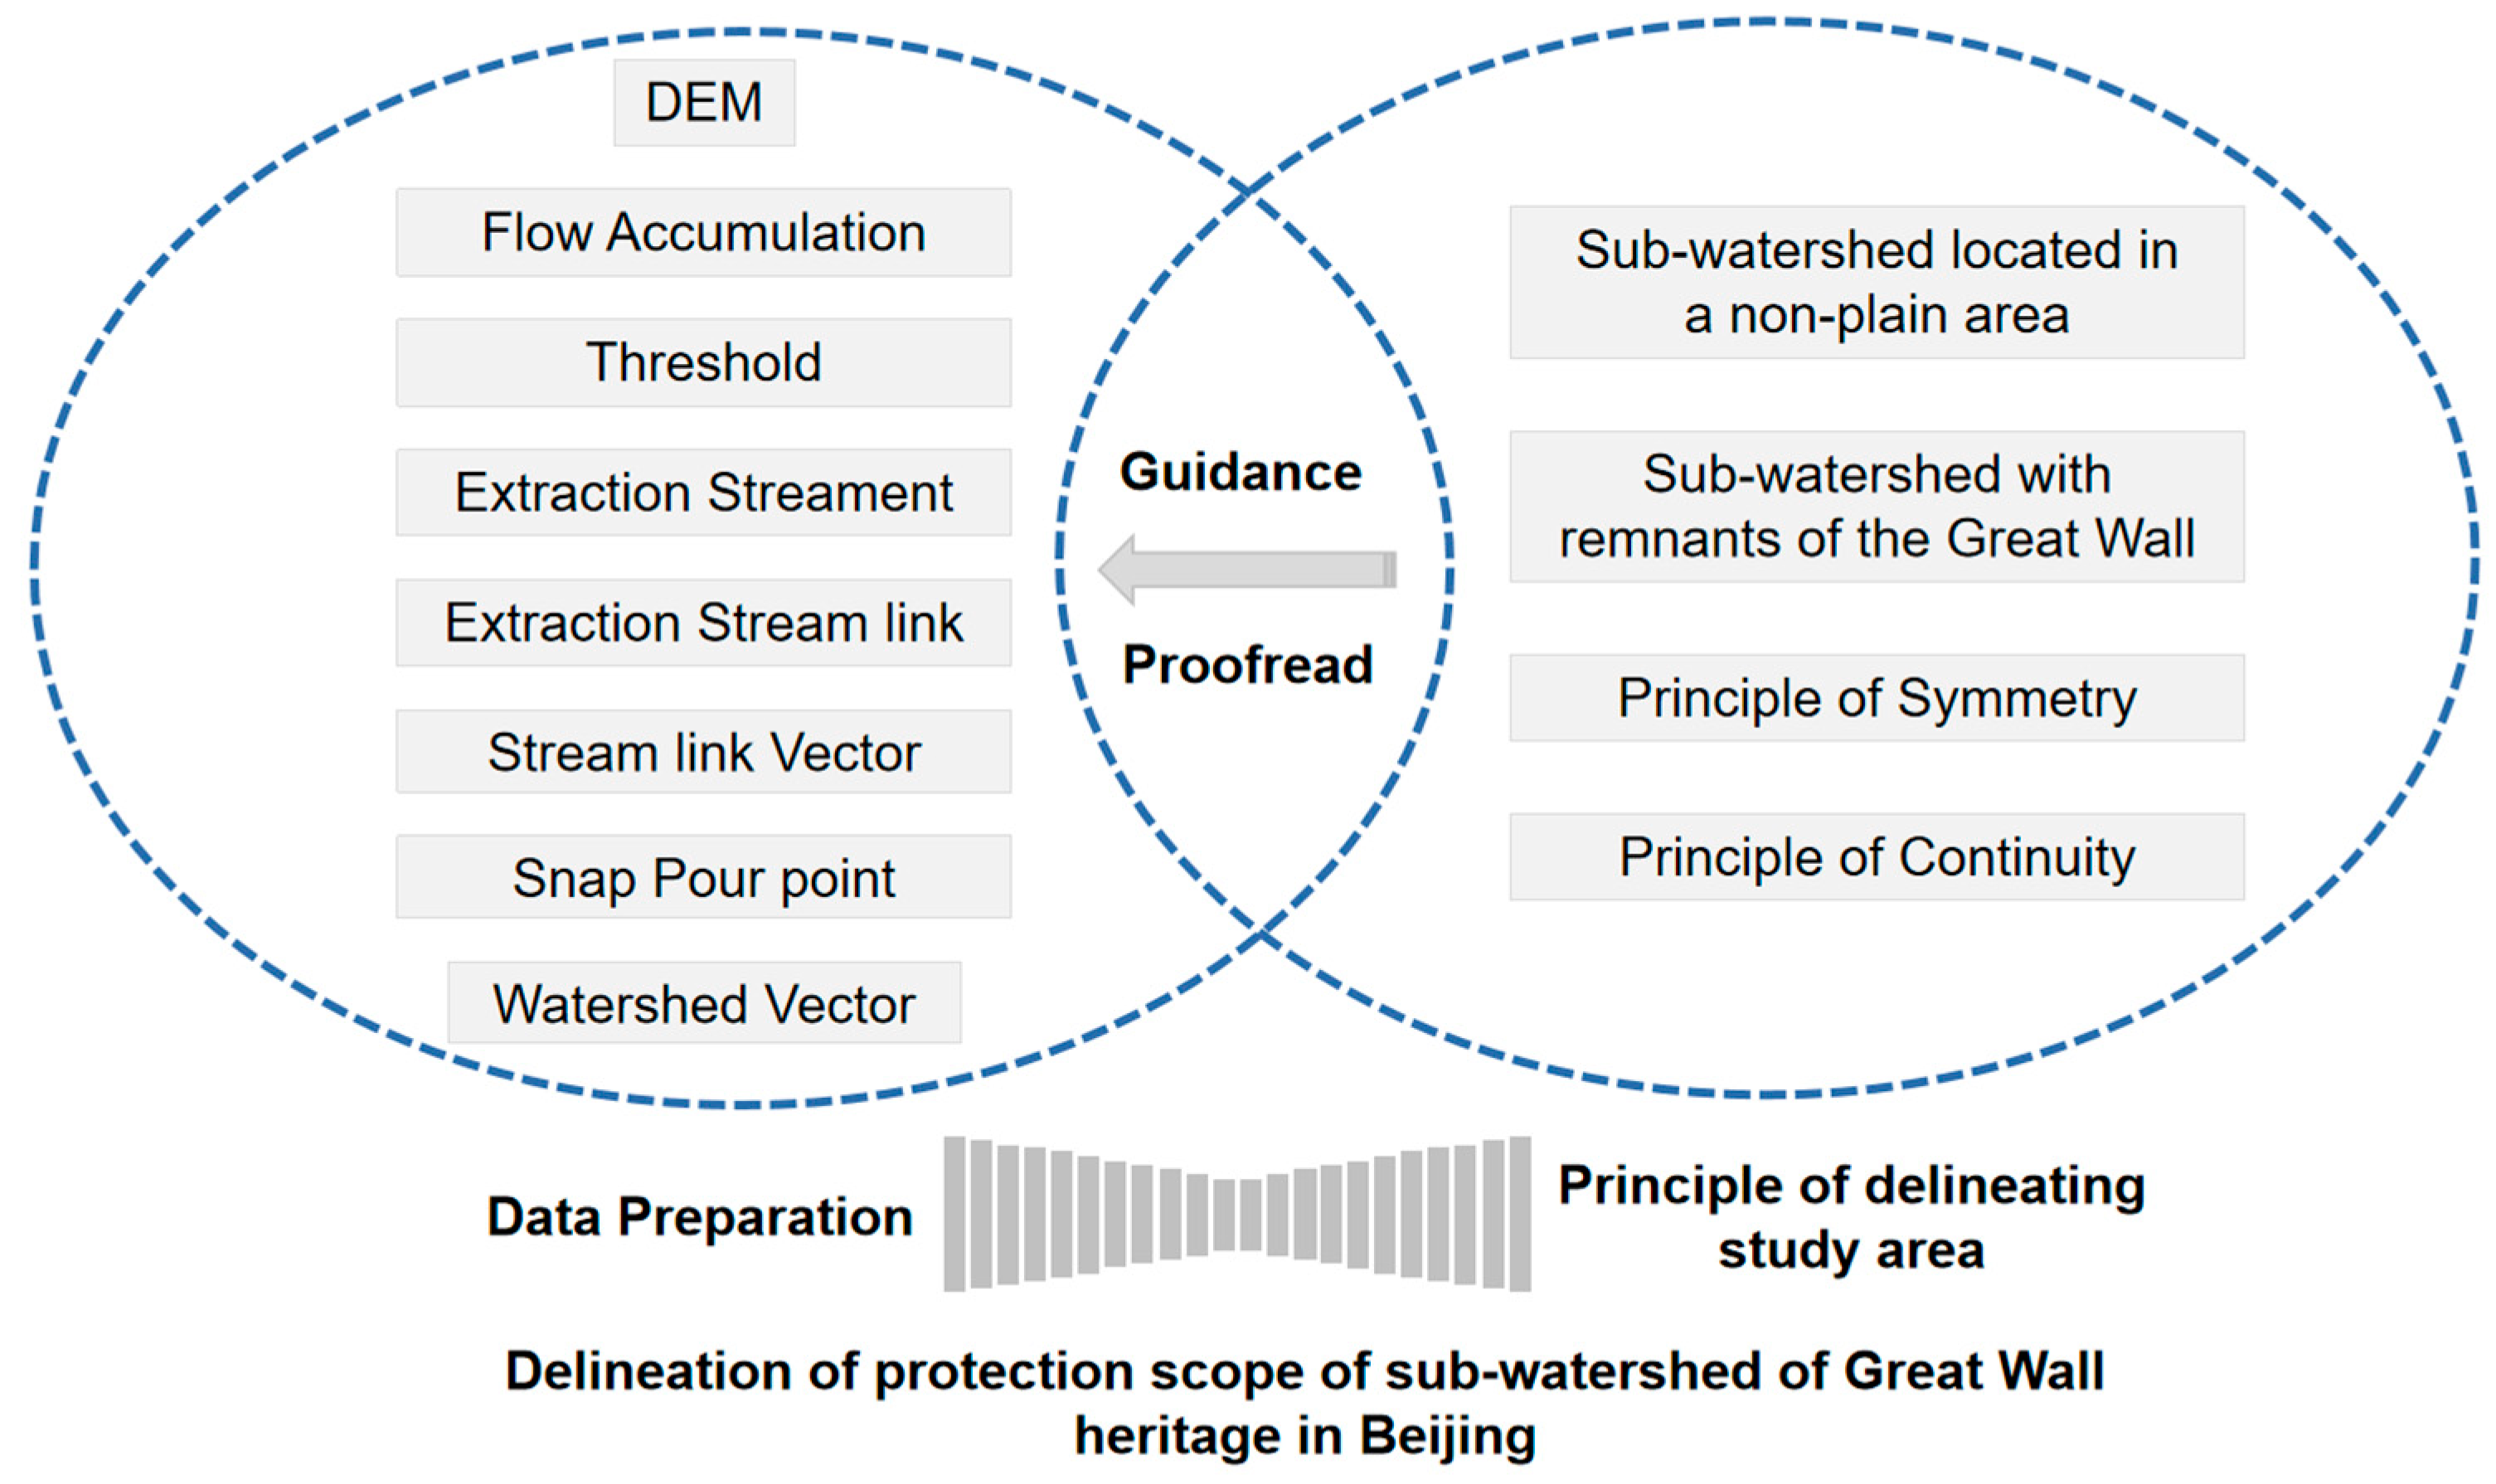
2.3. Methodology of Watershed Delineation

This study used the hydrological analysis module in ArcGIS 10.3 for watershed delineation. The DEM was used to generate the river chain and watershed data for the watershed. The tree relationship of the river chain was used to search for the set of watersheds whose area sums to a given area to generate the final sub-watersheds [35]. The watershed area was determined according to the concept of sub-watershed’s definition in the “Specification for Division and Coding of Sub-watershed” of China [36]: greater than 3 km2 or less than 100 km2 [37].
Based on the identified sub-watersheds, the core sub-watersheds of the heritage-protected zone were selected based on the following principles: sub-watershed located in a non-plain area; sub-watershed with remnants of the Great Wall; sub-watershed on both sides of the ridgeline where the heritage is located are included in a symmetrical pattern; sub-watershed without Great Wall remnants are also considered if they connect to a separate core sub-watershed or are within the envelope of multiple core sub-watersheds. Based on these principles, the core sub-watersheds of the Great Wall were obtained (Figure 2).

2.4. Watershed Classification Indicator System Construction

The main principles of watershed classification indicators selection are scientificity, comprehensiveness, sustainability, and operability, reflecting both the heritage characteristics of the sub-watershed of the Great Wall and based on the ecological and social state of the watersheds. Previous researchers have conducted a large number of classification studies using clustering methods, mainly including natural hazards [38], land use [39], ecosystem services [27,28,40], and riparian ecosystem classification [29]. The study drew lessons from academic literature and other relevant studies and selected eight necessary indicators through the statistics methods (as shown in Table 1). In analyzing the data for each indicator, particular attention was paid to the consistency between the information extracted and the relevant findings to avoid conflicting results. The preliminary indicators are divided into four categories: heritage attributes, ecological attributes, social attributes, and hydrological attributes. Heritage attributes represent heritage density; ecological attributes include soil erosion and vegetation cover; social attributes include population density, GDP, village density, and A-class scenic spot density; hydrological attributes use the average runoff coefficient. Ecological problems in the sub-watershed lead to soil degradation and low land productivity and cause irreversible damage to the security of the Great Wall’s heritage in the sensitive sub-watershed area. Therefore, it is an indispensable indicator type.
The range of values in the raw data often have different scales and are subsequently standardized to reduce the impacts of magnitude and variability [41]. Min–max normalization was used to normalize the indicator values by subtracting the minimum value from the indicator values of the sub-watersheds and dividing by the difference between the maximum and the minimum values to obtain comparable and standardized dimensionless values ranging from 0 to 1 [42]. The data were scaled into small, specific areas to ensure comparability. Finally, the eight indicators were plotted to visualize the spatial distribution. The calculation equation is as follows:
X s = X i X m i n X m a x X m i n
where X s is the standardized value, X i is the initial value, X m i n is the minimum value of indicators over 169 Watersheds, and X m a x is the maximum value of indicators.

2.5. Watershed Classification Indicator System Construction

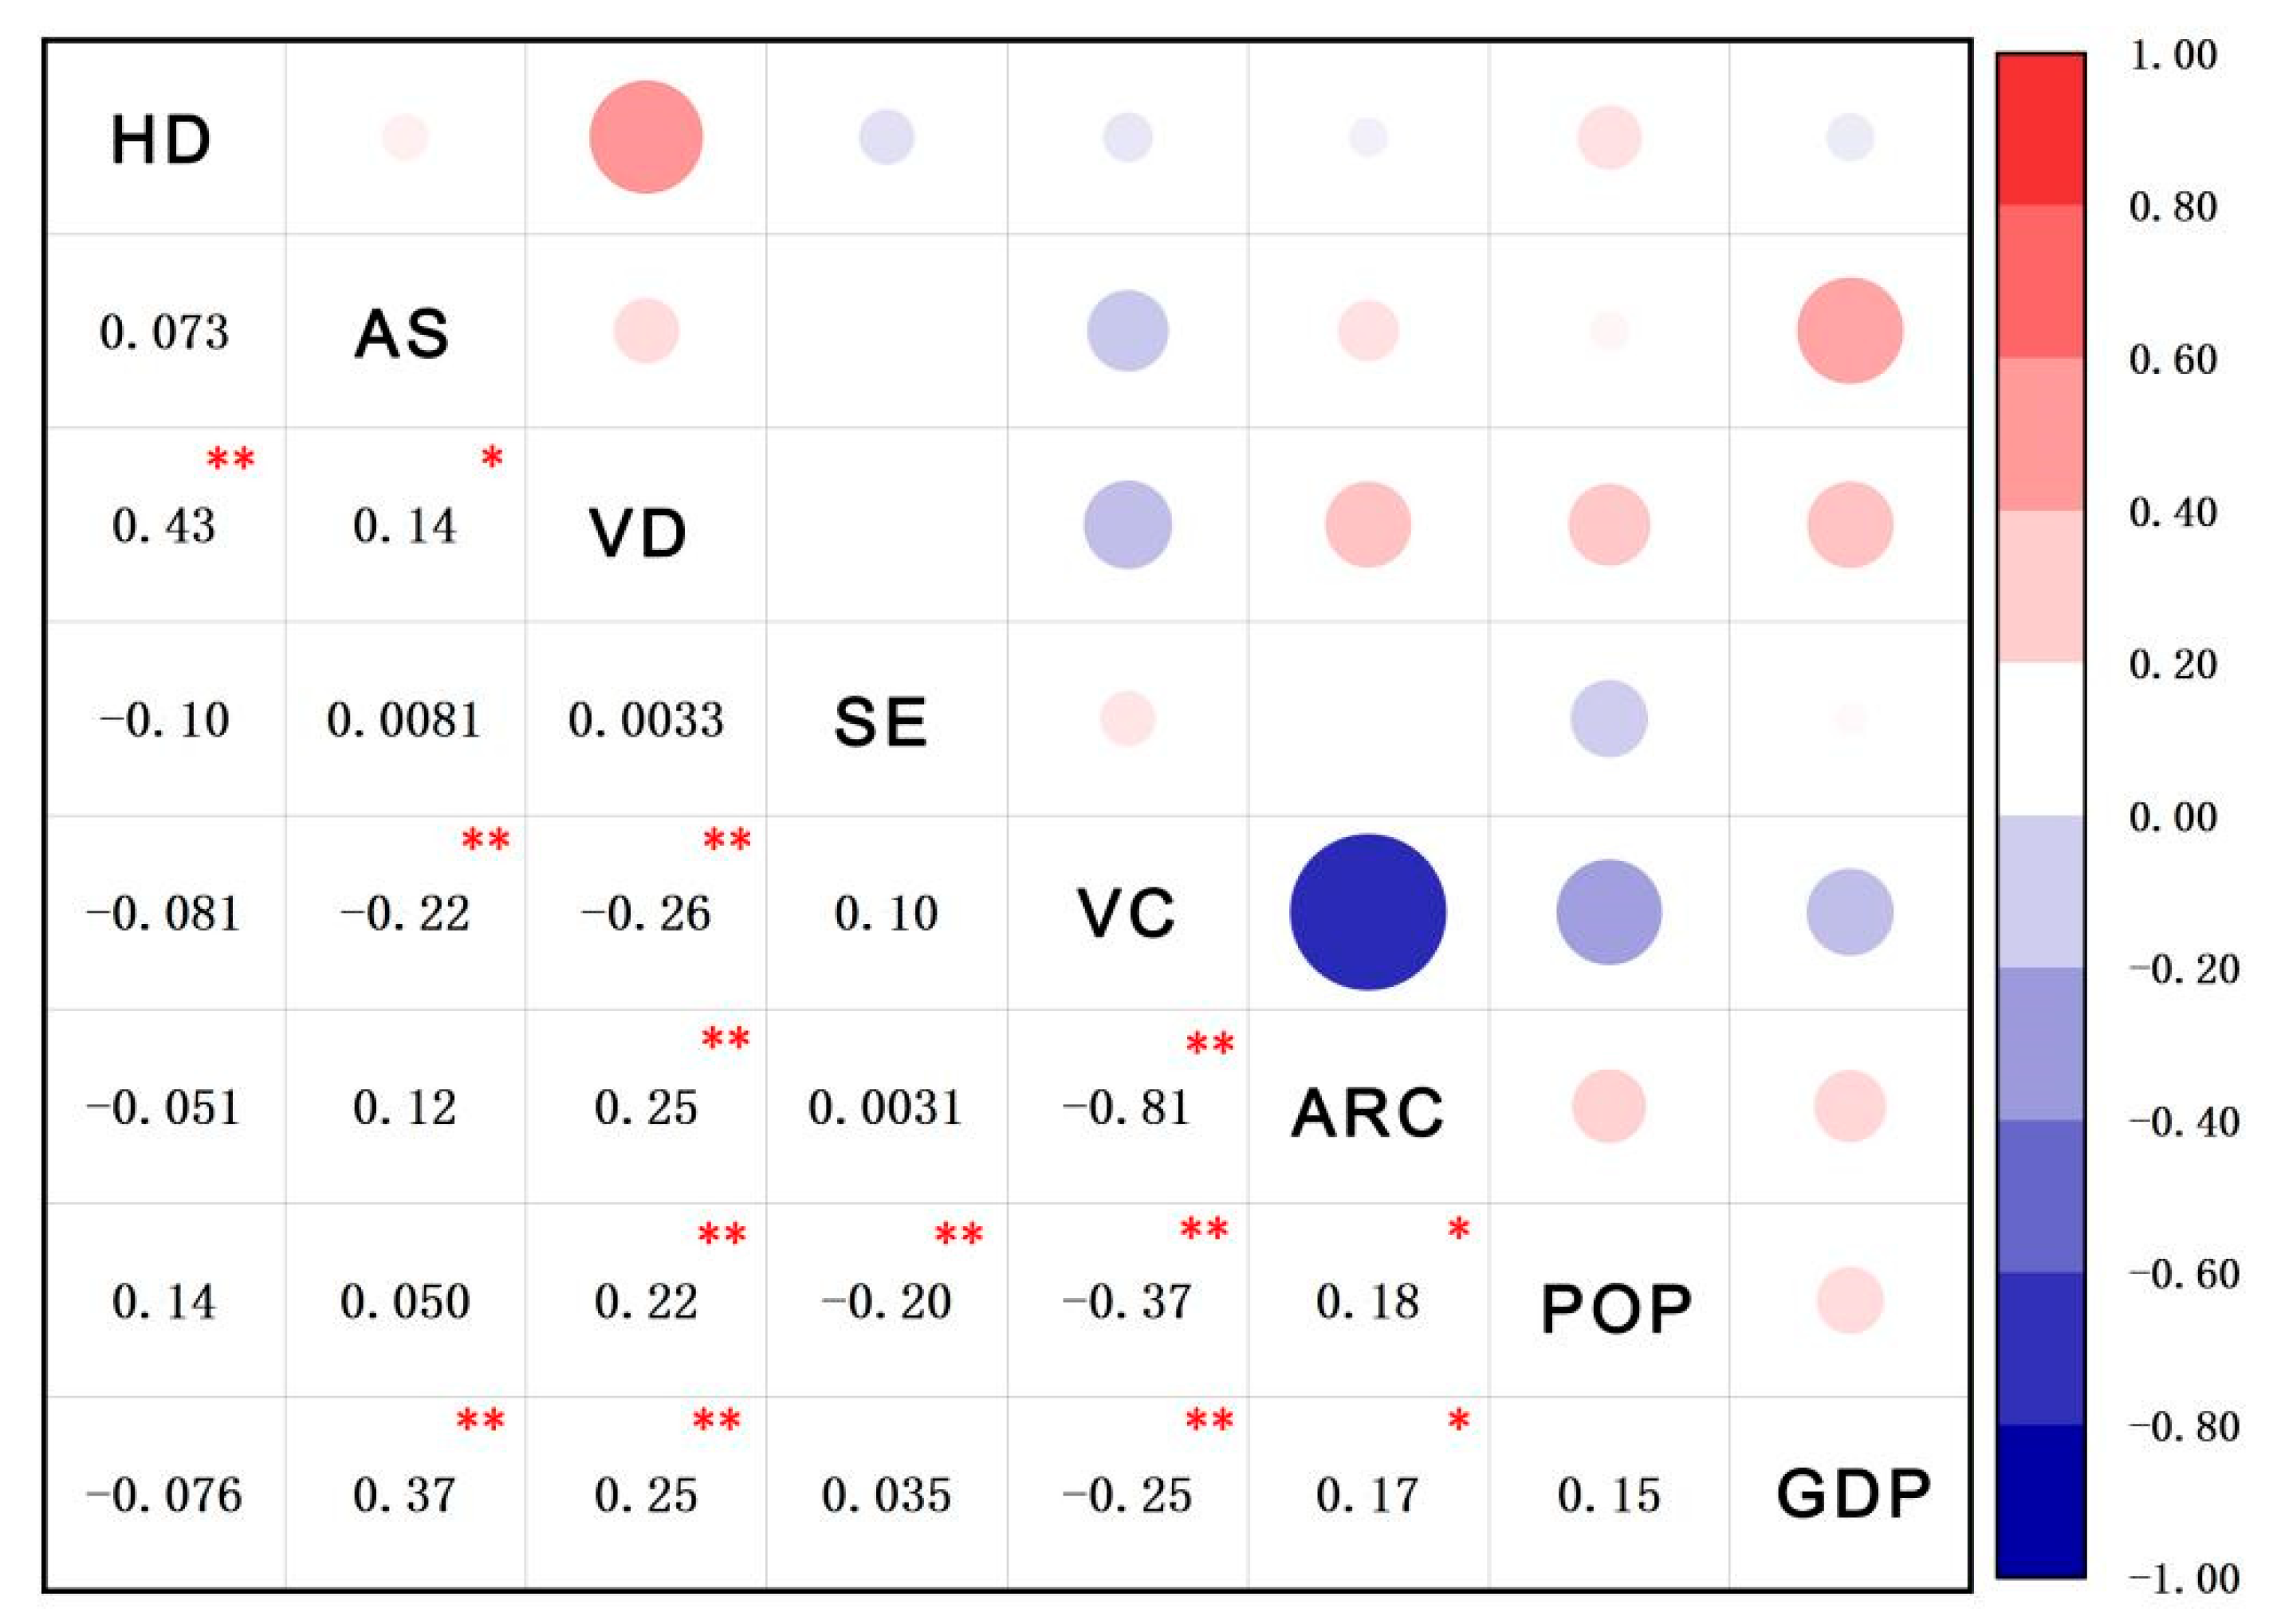
2.5.1. Correlation Analysis

We used Spearman’s rank correlation analysis to determine the correlation between all eight indicators’ paired combinations. This is a simple but effective method frequently used to infer the relationships among indicators provided by the ecosystem [43]. Correlation analysis indicates a positive or negative relationship between two indicators. The correlations were considered statistically significant at p ≤ 0.05 level [40]. The correlation coefficient matrix was drawn by “Heatmap” in Origin Pro statistical software to intuitively display the correlation of multiple indicator values in Beijing Great Wall sub-watersheds.

2.5.2. Cluster Analysis

Sub-watershed classification can be completed by means of k-means clustering. The common classification methods include decision tree [44], k-nearest neighbor [45], and naive bayes [46]. The k-means clustering algorithm aims to group objects to reduce the complexity of the data set accordingly [47], which minimizes intra-cluster variability [33]. Therefore, k-means clustering is the most suitable classification method for this study. Suitable variables were selected according to the objectives of the cluster analysis. The datasets from the sub-watersheds of the Great Wall cultural zone of Beijing were classified into certain defined groups through k-means clustering calculations in SPSS. The spatial distribution of bundles and the indicator characteristics within each bundle were analyzed [27], allowing potential subjectivity problems in statistical methods to be overcome.

3. Results

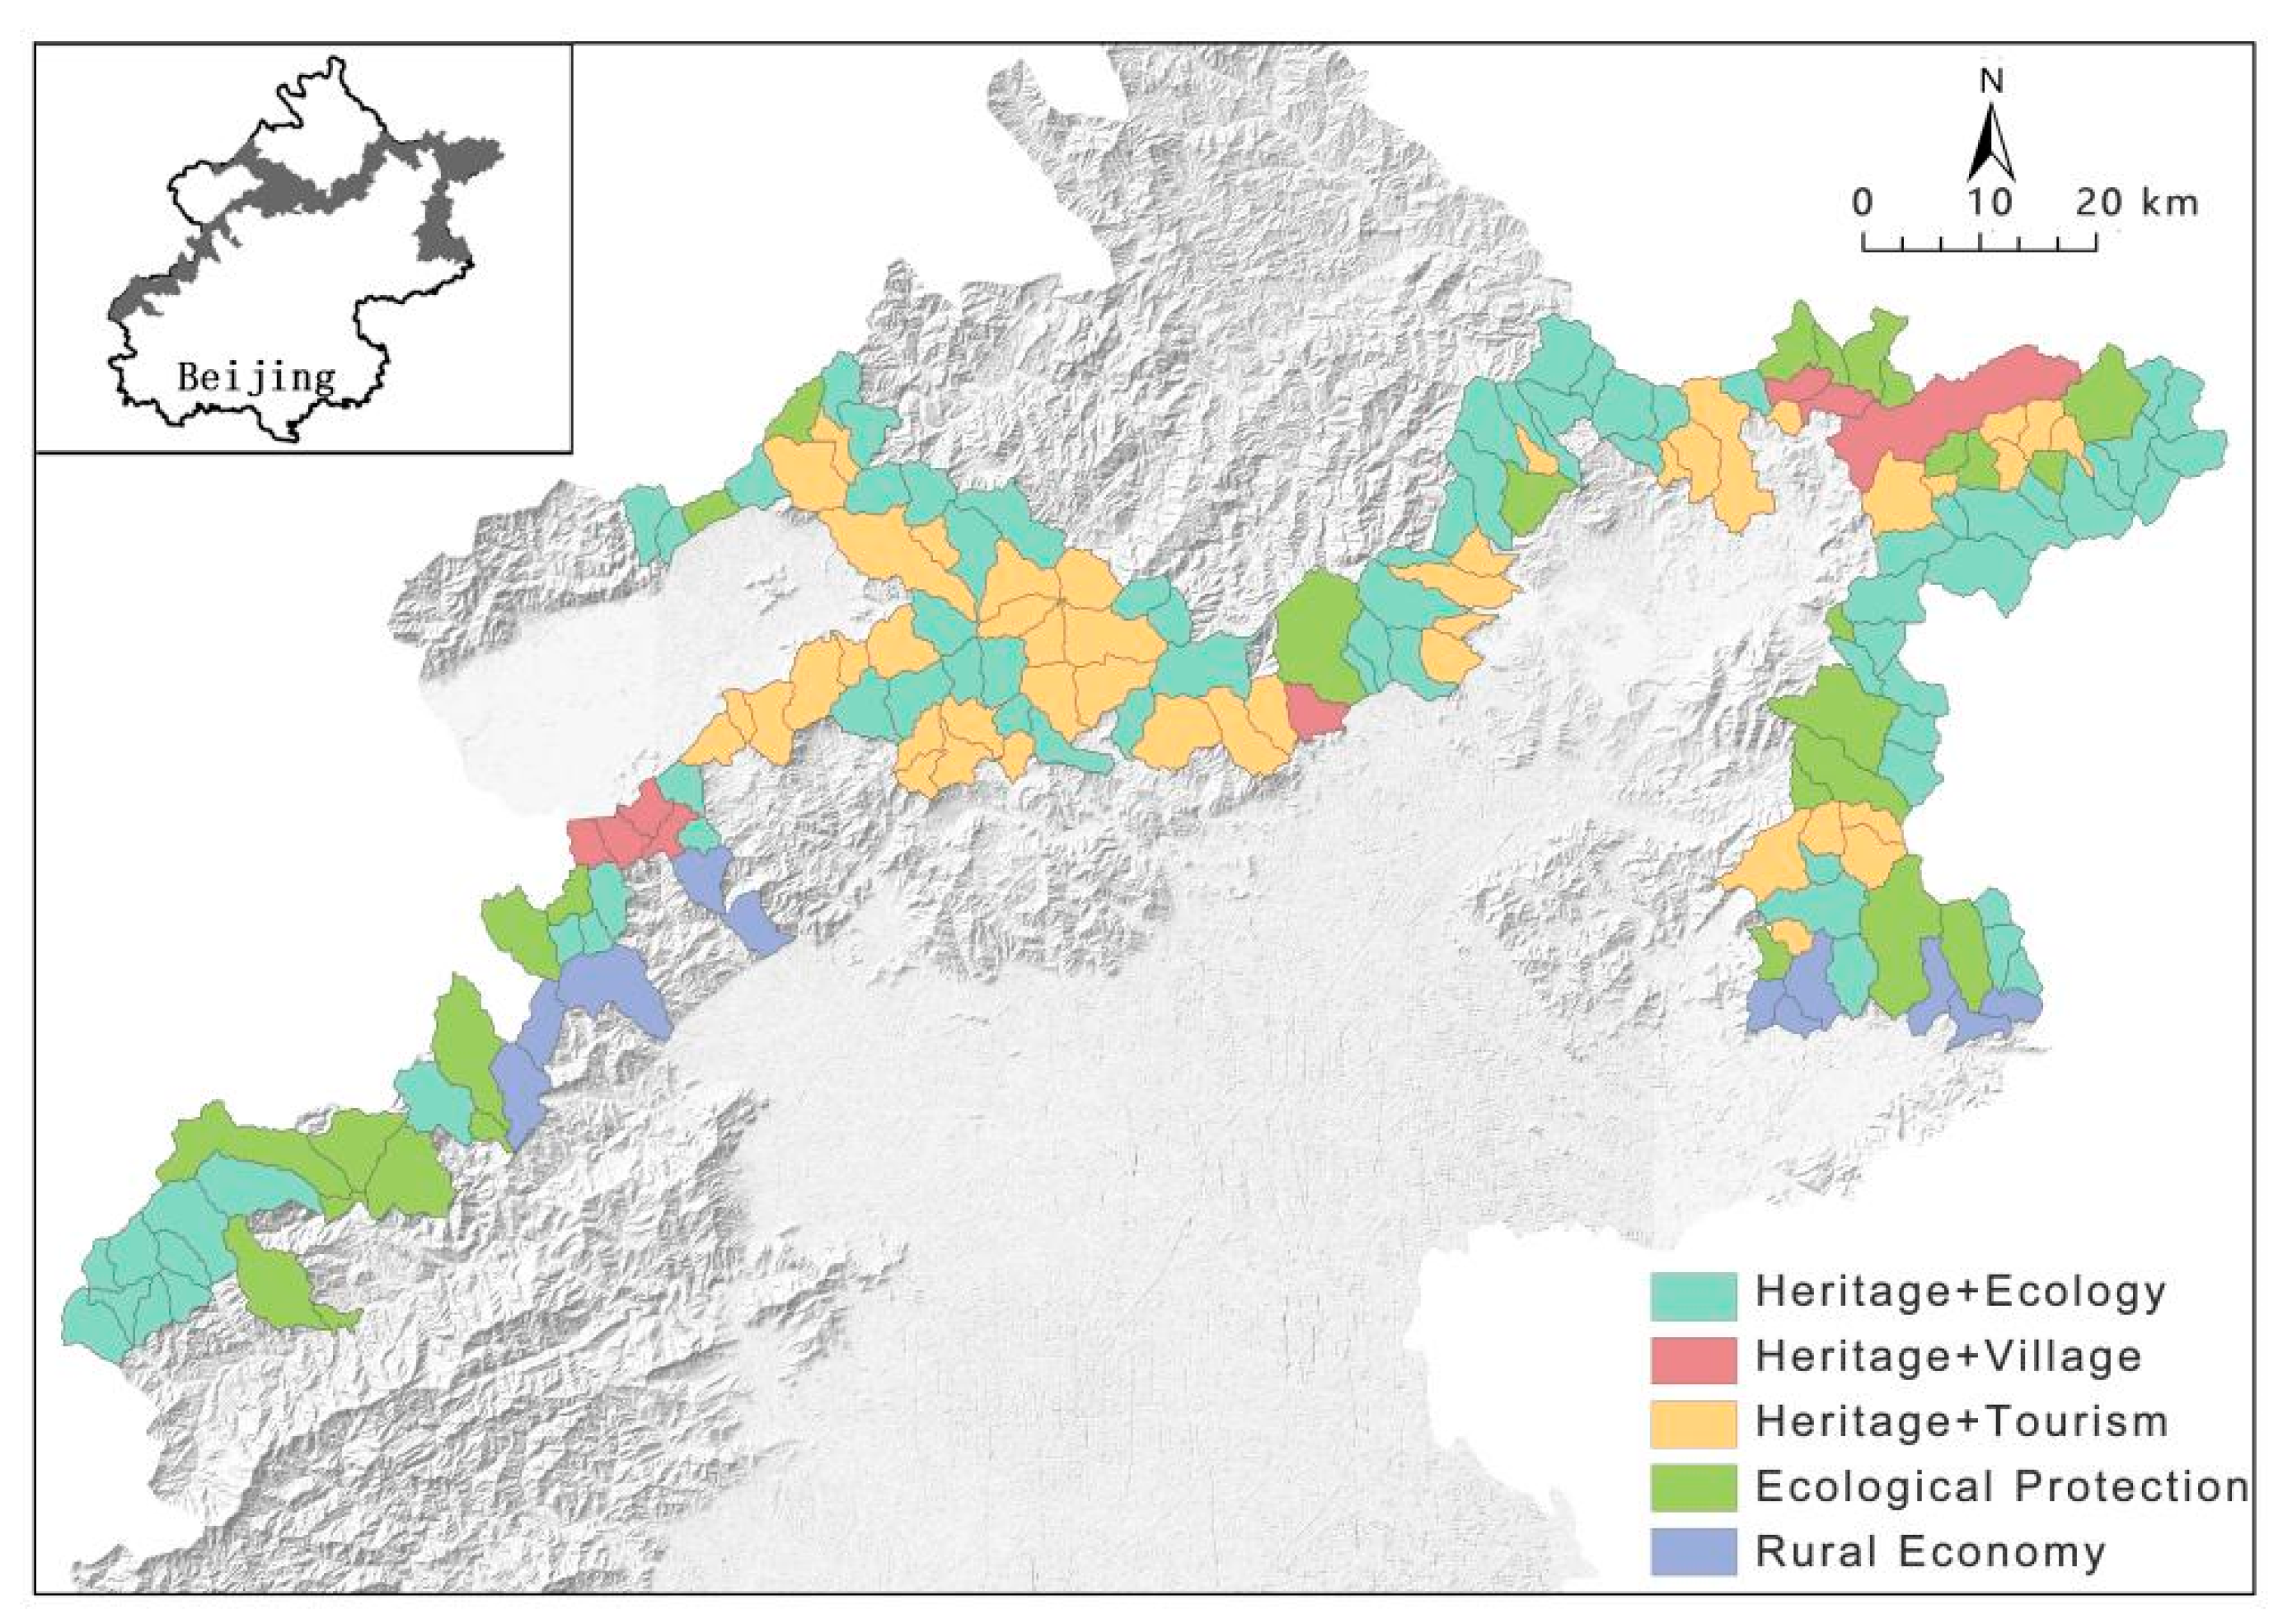
3.1. Results of the Sub-Watershed Classification of the Great Wall Cultural Zone in Beijing

The Great Wall cultural zone in Beijing is situated in four major water systems: the Northern Canal system, the Yongding River system, the Chaobai River system, and the Ji Canal system. The boundary of the cultural zone was revised from an ecological point of view in this study, based on the selection principles and delineation method of the core sub-watersheds of the heritage in Section 2.3. In total, 169 sub-watersheds are distributed in the cultural zone (Figure 3). The most significant number of sub-watersheds were found in the Chaobai River system, mainly located in the Changping, Huairou, and Miyun districts, with 101 sub-watersheds. The Yongding River and Ji Canal systems have 43 and 20 sub-watersheds, respectively. The Northern Canal systems are mainly located in the foothills and plains, so only five sub-watersheds are within the Great Wall cultural zone area. After amending the protection scope of the original Great Wall cultural zone, the total area of the core sub-watersheds is 3186.48 km2, with an average area of 18.86 km2. The smallest sub-watershed is 4.73 km2, and the largest watershed is 97.17 km2 within the given sub-watershed area in Table 2. The average slope of the sub-watersheds is 19.87°, with the core sub-watersheds of the Great Wall in the North Canal water system having a higher average slope.

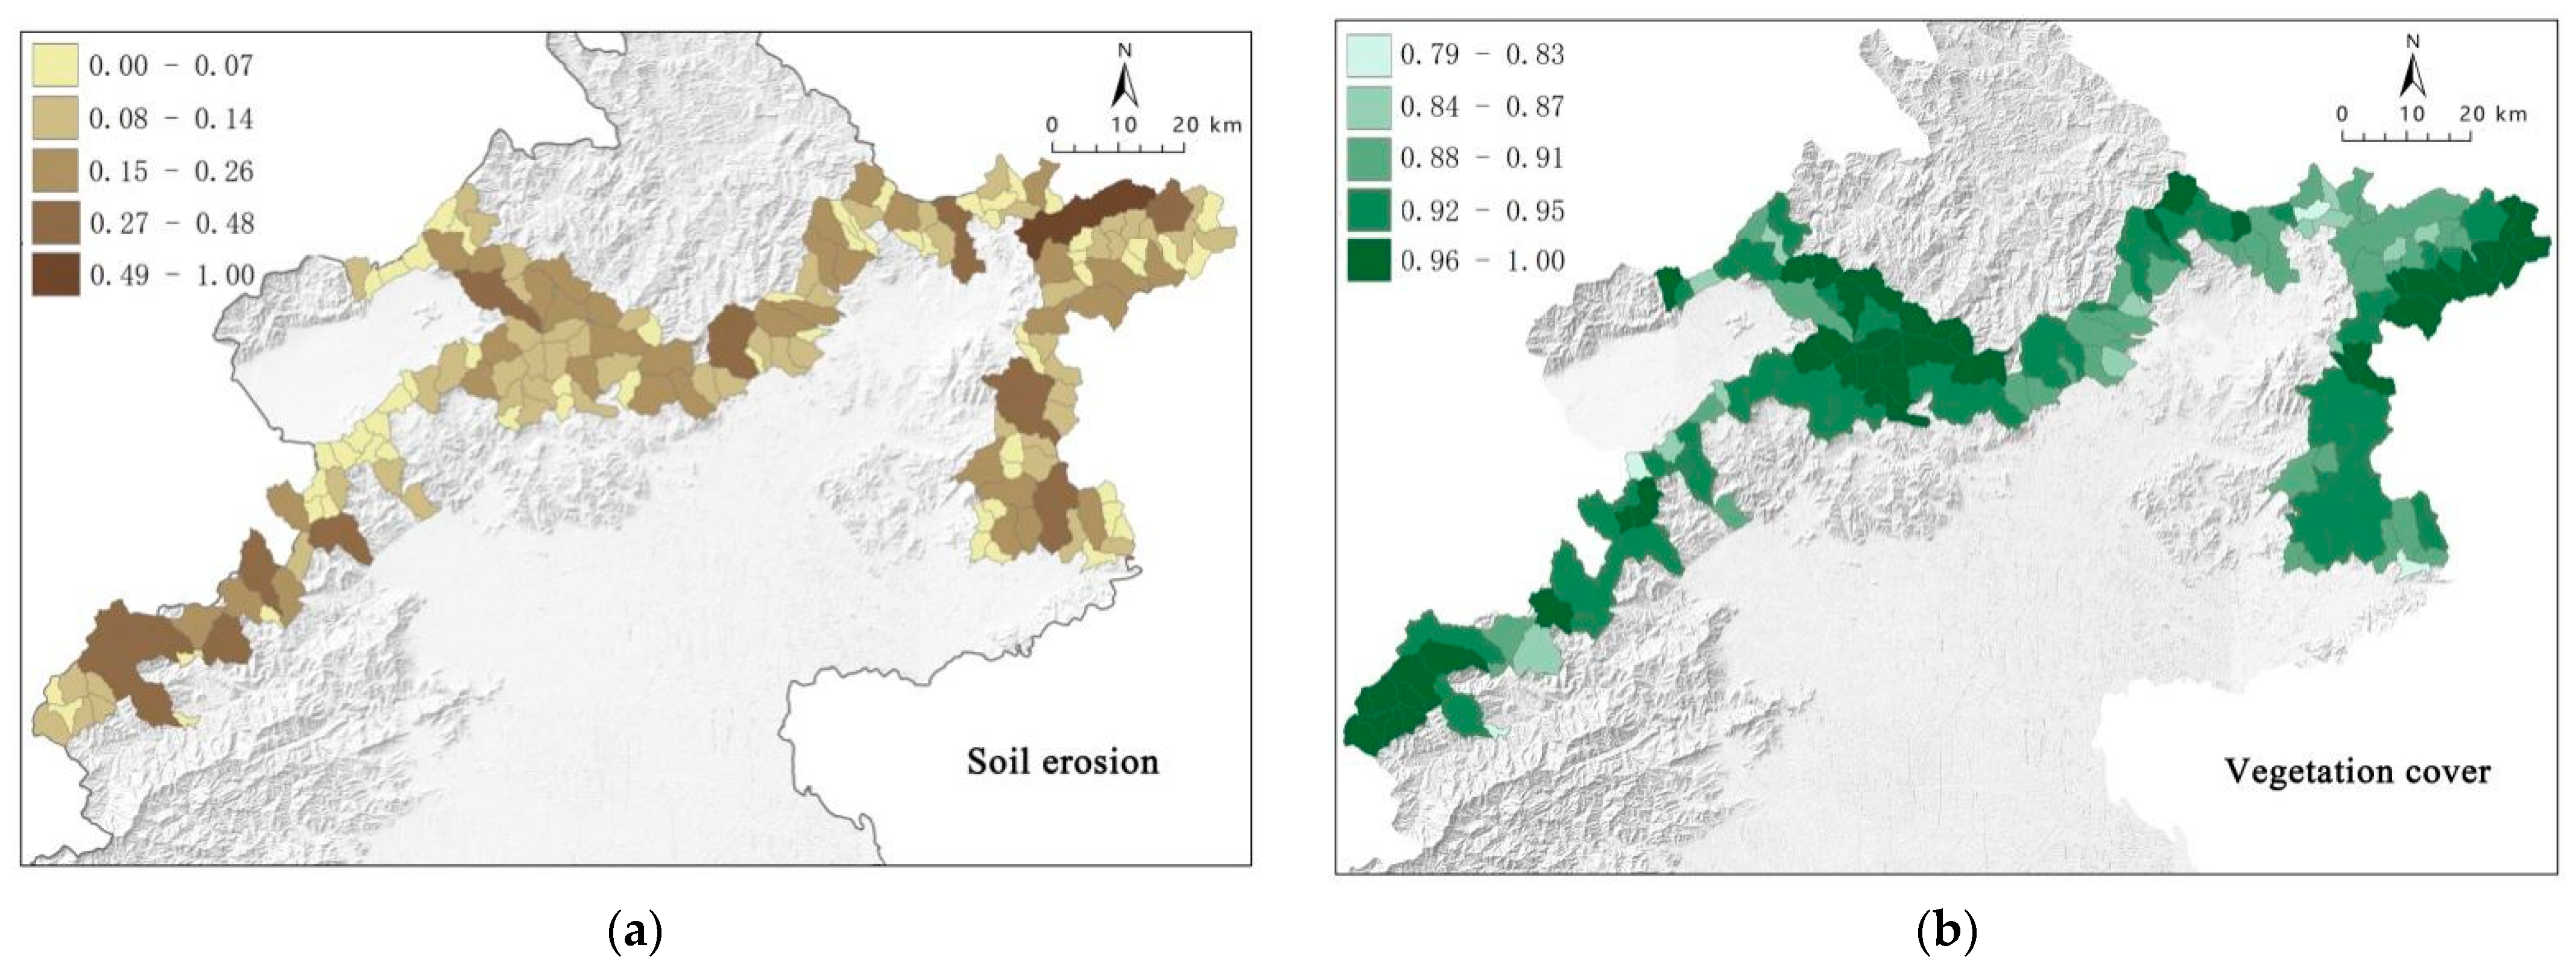
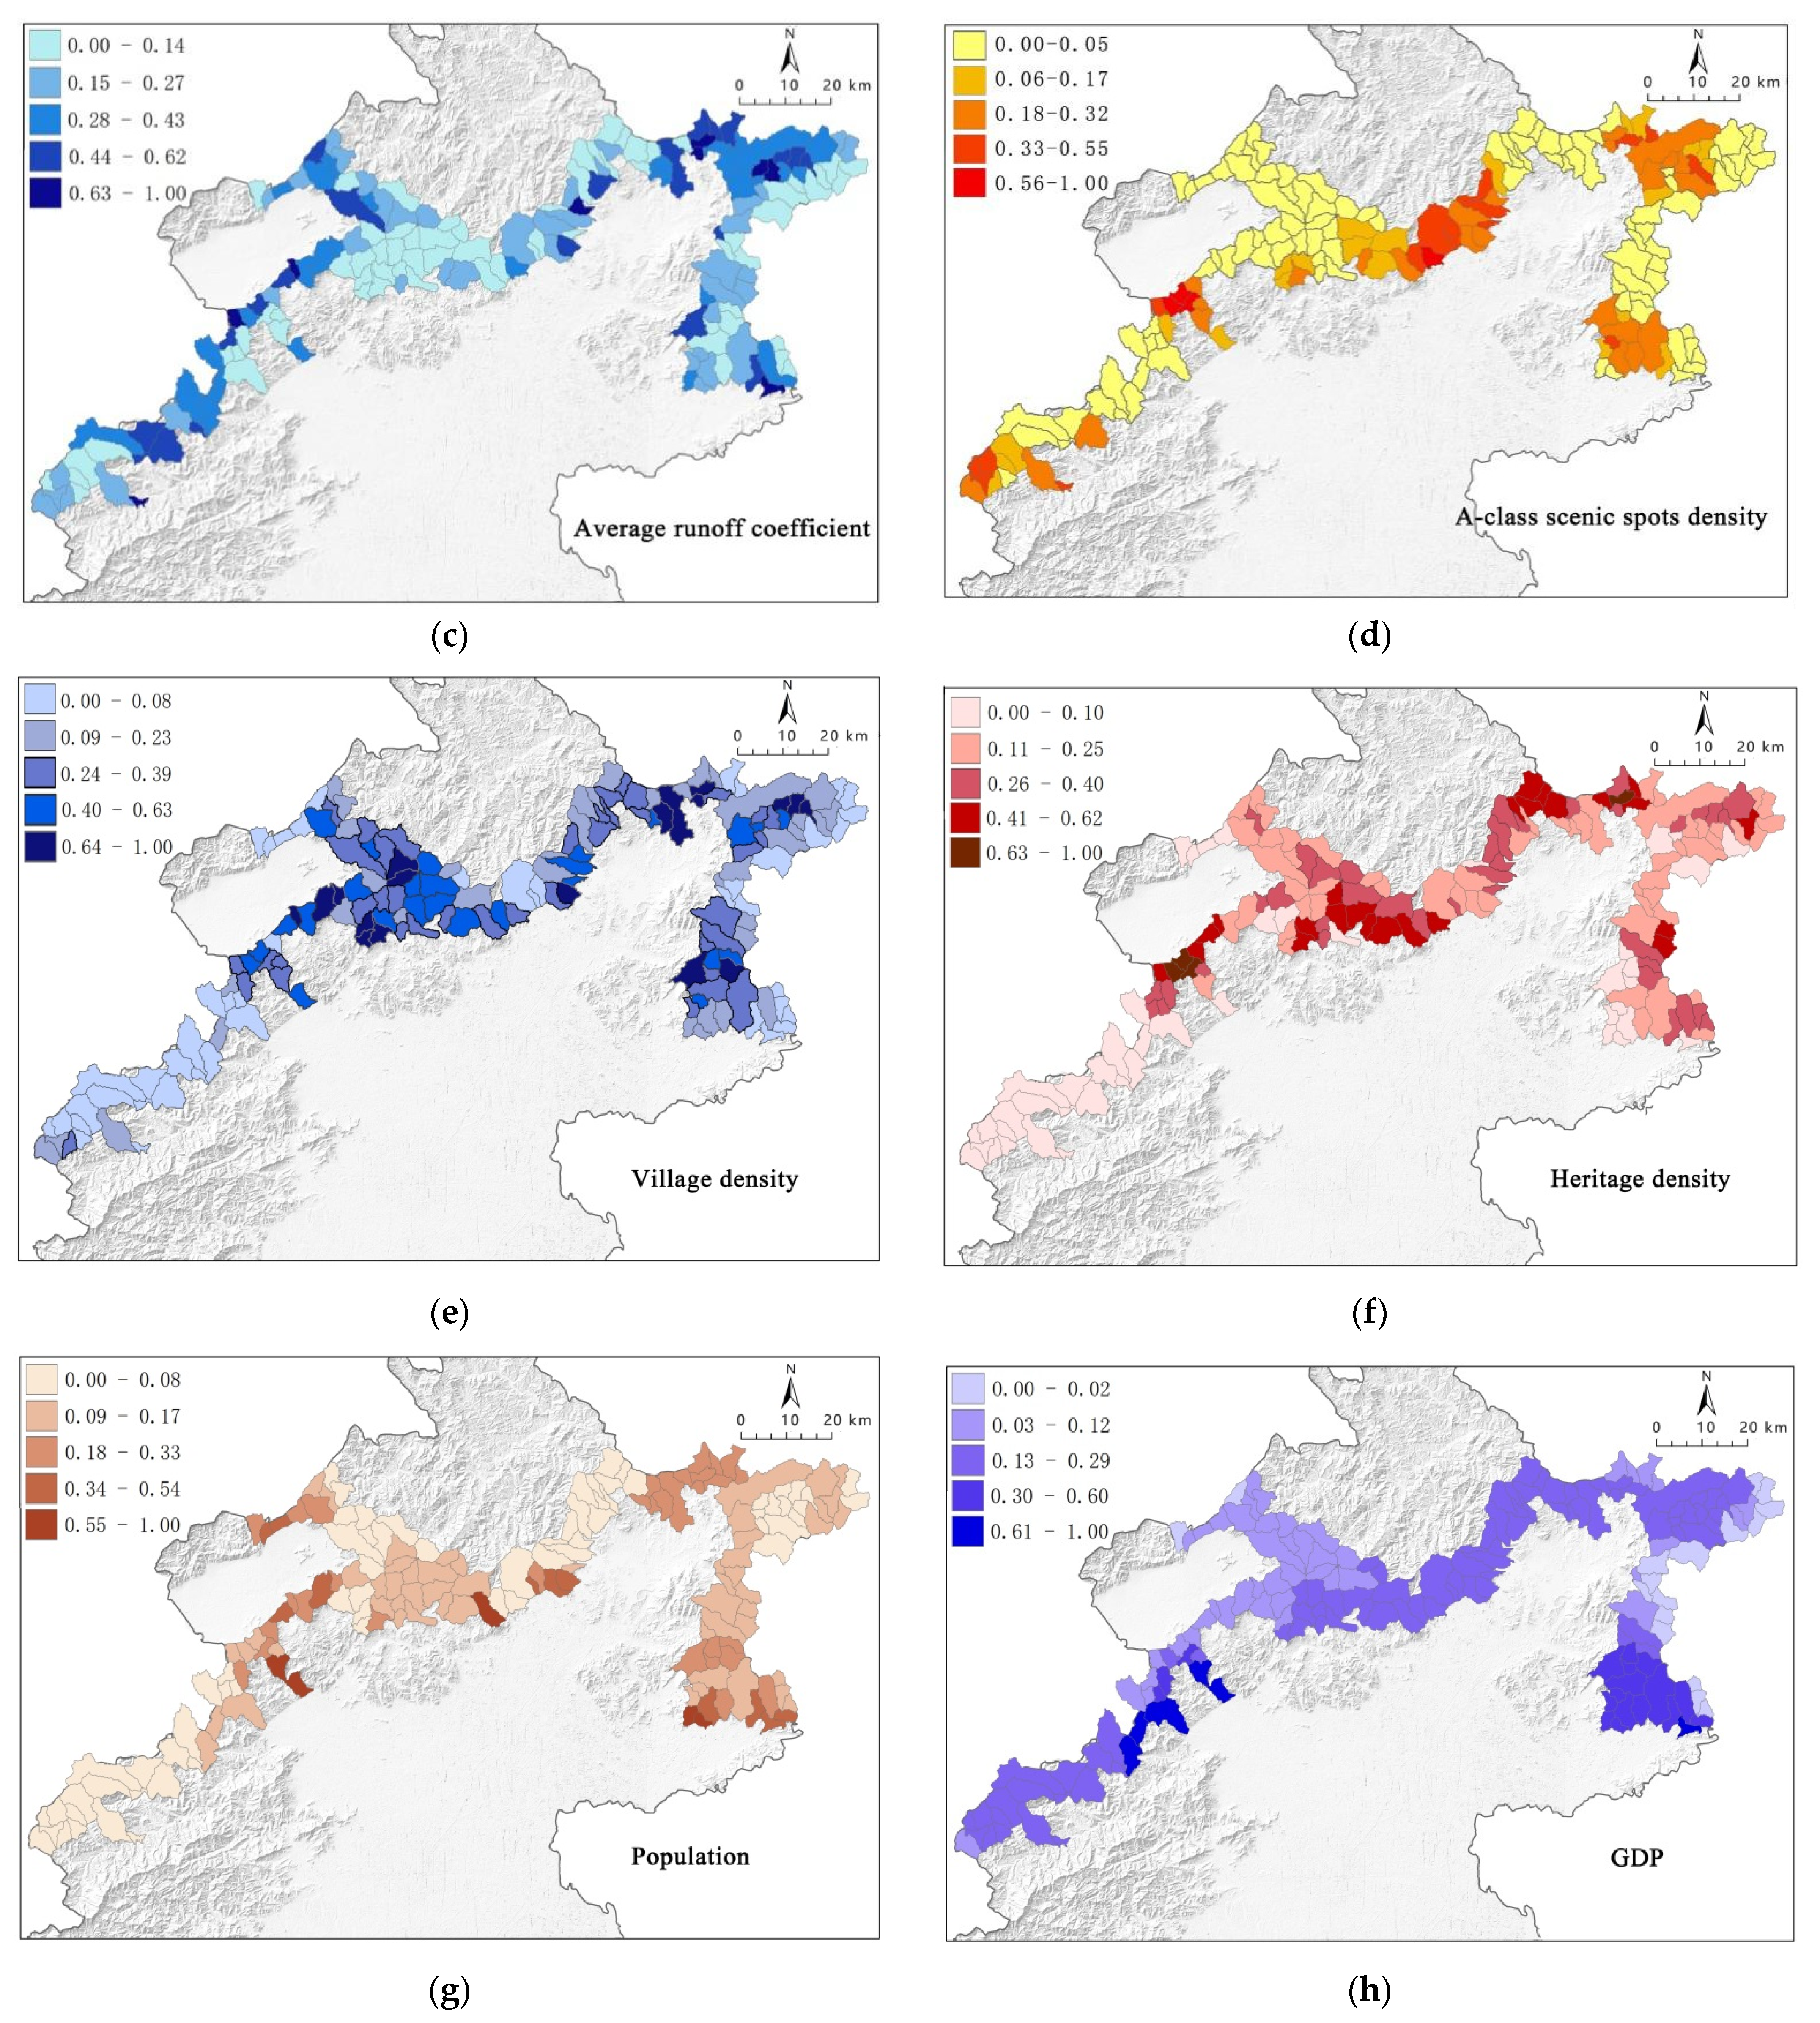
3.2. Spatial Distribution Characteristics of Sub-Watershed Indicators

In the sub-watershed classification, the spatial distribution of the eight indicators varied substantially across the study area (Figure 4). Based on data from these indicators, the spatial relationships among various indicators in the Great Wall sub-watersheds were explored.
Specifically, (1) higher soil erosion areas are mainly found in sub-watersheds with high average slopes, such as Fengjiayu, Gubeikou Town, Gaoling Town, and Xinchengzi Town. They are influenced by rainfall, slope, and geology, with high erosion values in sub-watersheds. Natural processes have caused various geological hazards, including collapse, landslides, debris flow, and unstable slopes. Landslides and gully erosion can damage or destroy cultural heritages [48]. (2) Most sub-watersheds are located in mountainous areas, so the vegetation cover is generally high, with an average of 93%. Therefore, the soil and water conservation capacity are relatively high. (3) The higher the average runoff coefficient, the lower the vegetation cover. Higher values of the mean runoff coefficient occur in sub-watersheds near the plains of the Chaobai and Yongding River systems and around the Miyun Reservoir, indicating that the lower slope areas have more land for construction and development and generate more runoff. (4) A-class scenic spots are concentrated in areas with more heritage and are primarily ecological reserves. (5) The heritage and villages/towns are also concentrated in the Chaobai, Yongding, and Ji Canals, which have spatial distribution correlation. (6) Sub-watersheds with high population density (greater than 200 people per square kilometer) are dominated by urban land-use and have higher GDP (a total GDP value greater than CNY 12,894,500/km2). (7) The GDP of the sub-watersheds distributed in the North Canal and Ji Canal systems is higher. This indicates that they have more social activities and better economic development.

3.3. Correlation Analysis between Indicators

The negative and positive correlation of indicators highlights the trade-offs and synergies across the research area (Figure 5). The spatial distribution of individual indicators may be closely related to multiple indicators. As shown in Figure 4 and Figure 5, 28 significant correlations were found among 14 pairs of indicators (Spearman correlation coefficient p ≤ 0.05; −1 < r < 1), with eight and six pairs of positive and negative correlations, respectively. Furthermore, there is one pair of high correlation (r ≥ 0.7) and thirteen pairs of weak correlation (r < 0.7). The vegetation cover shows the strongest negative correlation with the average runoff coefficient. It is also negatively correlated with population density, GDP, village density, and the density of A-class scenic spots. It shows that social factors such as human activity have a more significant influence on vegetation cover. Conversely, a high average runoff coefficient indicates a sizeable built-up area with a wide range of population activity and a corresponding positive correlation with population density and GDP. Soil erosion negatively correlates with population density, suggesting that natural hazards affect sub-watersheds. The Great Wall is mainly located in secluded and isolated areas, so most damage is caused by natural factors. High slopes and erosion lead to gullies, landslides, and debris flows, so the relatively small number of inhabitants is negatively correlated. Heritage density is more significantly and positively correlated with village density, and the density of A-class scenic spots positively correlates with village density and GDP. It shows that tourism can drive the economy and development, relying heavily on the Great Wall’s heritage and ecological reserves. It contributes to the industry transformation of the surrounding villages and towns and could form a sustainable economic development circle for the watershed.

3.4. Types and Characteristics of Great Wall Sub-Watersheds

Five bundles of the Great Wall’s heritage sub-watersheds were identified by the k-means method and showed significance for all eight indicators (p < 0.001) (Table 2 and Figure 6). To interpret the meaning of the clusters, we labeled each by noting variables for which the cluster demonstrates high and low values. Table 3 provides descriptions for each of the five categories, along with the percentage of watersheds in each type. Based on these high/low attributes and understandings of local areas [23], we labeled the five types as shown: “Heritage + Ecology,” “Heritage + Village,” “Heritage + Tourism,” “Ecological Protection,” and “Rural Economy.” Figure 6 shows the geographical distribution of the sub-watershed classification results.
(1) The Heritage + Ecology type covers 45% of all sub-watersheds and has the most significant proportion. These sub-watersheds have relatively high vegetation cover, are generally well-maintained, and are rich in Great Wall relic sites. The low average runoff coefficient indicates that these sub-watersheds have better soil and water conservation capacity, sparse population, less built-up land, and relatively low village density. Therefore, they have a significantly lower GDP and weaker economies than other sub-watersheds. Industries that combine landscape and ecological tourism can be developed, relying on the excellent ecological environment. The watersheds of Wuling Mountain and Wohu Mountain are typical examples (Figure 7a).
(2) The Heritage + Village type has a high density of villages and heritage sites. Heritage resources significantly contribute to the quality of life and sustainable development [49]. Agricultural sub-watersheds with more tourist-attractive folk characteristics must be appropriately developed [50]. The sustainable development model is based on using natural and cultural resources to generate a new endogenous economy [51]. A typical example of this model is the “Tangquan Xianggu” in Miyun District. Relying on the Great Wall to promote the development of the homestay tourism industry, the agritainment located in the valley accommodates tourists from the surrounding area. Agritainment tourism is usually carried out in suburban areas. Also, it faces the problem of scenic tourist reception, village domestic sewage, livestock breeding, and farmland surface pollution. Environmental monitoring and management systems need to be established to maintain and restore the ecological environment in these areas [52] (Figure 7b).
(3) The Heritage + Tourism type shows that the Great Wall’s heritage resources are clustered in a concentrated belt, with a high density of A-class scenic spots. The historic built environment can play an essential role in sustainability’s basic dimensions, such as sociocultural, socioeconomic, and environmental [53]. For example, tourism development at Badaling and Mutianyu has stimulated local entrepreneurship and generated employment opportunities [54]. As a result, tourism development and human activity are high, with many paved areas. Socioeconomic changes and increased recreational use have led to conflicts with ecological and heritage conservation [55]. As tourism is highly dependent on the rational development of heritage and natural resources and environmental protection, it is crucial to managing the relationship between conservation and development properly (Figure 8a).
(4) The Ecological Protection type shows fewer heritages and more erosion than in other sub-watersheds. These sub-watersheds usually have ecological issues that require environmental restoration. One of them, such as Fengjiayu, is a geological disaster-prone area affected by landslides, steep slopes, and debris flows. It is necessary to protect and restore the ecological environment of the sub-watershed based on safeguarding ecological benefits. Support for the conservation and restoration of sub-watersheds is provided through government support and collective financing, from the initial implementation of afforestation of barren mountains suitable for forestry and transformation of inefficient forests to the simultaneous implementation of afforestation for water and soil conservation, village beautification, and other projects [26], and then to agronomic measures (cross-slope contour tillage, three dimensions were planting, etc.) to prevent soil erosion and to create a beautiful natural landscape (Figure 8b).
(5) The Rural Economy type covers 7.1% of all sub-watersheds and has the minimum proportion. It is found mainly in the adjacent plain areas of the Changping and Pinggu districts. Another essential feature of these sub-watersheds is the high proportion of developed land, which means large impervious areas. Therefore, the average runoff coefficient is relatively higher than in other types. Driven by the overall industry structure of the plain areas, the population density is high, and thus the GDP is higher than in other types, with a more urban character (Figure 9).

4. Discussion

We used the scale of sub-watersheds to integrate social decision-making processes with geographically (rather than politically) defined areas to promote the comprehensive conservation of heritage and ecosystem functions. According to the Beijing Great Wall Cultural District Protection and Development Plan (2018–2035), the protected area is mainly divided by the Great Wall Heritage Architectural Buffer Zone and administrative boundaries, which are only defined from a macroscopic perspective. Its limitation is the lack of effective identification of different types of protected heritage sections and their surrounding ecological environment. It is necessary to add ecological, socioeconomic, and human aspects of the Great Wall and to propose conservation and management strategies tailored to local conditions. All in all, there may be potential conflicts with upper management, and achieving a single policy in a heritage conservation zone is not possible, resulting in less control over actual planning and management. By contrast, this study focuses on combining ecology and heritage, taking the site as the center and its close relationship with the natural environment, topography, and landform, taking the site’s sub-watershed geographical units as the key protection scope. The sub-watershed is a relatively complete ecological management unit with measurable, systematic, structural, and regional variability. The purpose is to identify and interpret sub-watersheds while protecting the heritage and considering the authenticity and integrity of the historical natural features around the heritage site. At the height of ecological environment management in the heritage area, the problem of environmental protection in heritage areas can effectively be solved.
The study revised the protection boundary of the Great Wall based on the watershed. The spatial relationships between multiple factors were assessed, and the results showed spatial variability and statistical correlation of the factors at regional scales. The vegetation cover of the Great Wall heritage core sub-watersheds was high overall, so the common background condition of the sub-watersheds is a relatively good ecological condition. However, the characteristics of each sub-watershed are distinct. The analysis concluded that some sub-watersheds are highly susceptible to damage under harsh natural conditions, with serious soil erosion and more severe collapse. Gullies, debris flows, landslides, and other disasters easily form after rainwater scouring, impacting cultural heritage security [56]. Some sub-watersheds are characterized by low population density and low-income socioeconomic vulnerability. Tourism development relying on the Great Wall’s heritage may be conducive to employment and economic development. Still, these sub-watersheds are also vulnerable to environmental pollution and ecosystem degradation. This study analyzes the relationships among indicators and their heritage, social, and ecological drivers. In conclusion, it is vital to conduct integrated research from a watershed perspective, considering the natural and cultural factors for sustainable heritage management strategies.
Effective management of each sub-watershed, so that one strategy for one type of watershed. Most of the Great Wall’s heritage sites are located in small, ecologically fragile watersheds and face problems such as ecological restoration, natural disaster prevention and control, and soil erosion, which make for poor urban ecological sustainable development ability. Implementing large-scale engineering, such as the newly constructed slopes with different engineering, is necessary to prevent natural disasters and reduce ecological damage caused by human activities, improving the comprehensive ecological environment of the Great Wall’s heritage. In addition, it is necessary to conduct overall planning for the sub-watershed of Heritage + Tourism type to reduce the ecological damage, water environment pollution, and resource over-exploitation caused by over-exploitation. The continuous base flow in the stream should be guaranteed through the regulation of small ponds, weirs, and dams. In the process of ditch reconstruction, the ecological revetment construction needs to be consistent with the overall historical and cultural features of the Great Wall. The development of “agrotourism” in the Heritage + Village type sub-watersheds is rapid, and there is the problem that the development is too much, thus destroying the environmental harmony. Coupled with the lack of supporting facilities, this is bound to bring water, air, soil, and ecological and environmental pollution. Therefore, in villages where activities are concentrated, small-scale wastewater treatment (e.g., the combined AP + DWWSCW + EP process [57]), waste treatment plants, and biogas digesters with mature technology are built in response to the characteristics of mountainous landscapes. Areas in a position to do so should optimize the allocation of resources as much as possible, improve the connection between environmental system facilities, and truly protect heritage ecological resources.
The classification results were verified by field investigation and exploration. It was found that the majority of sub-watersheds were classified in line with the actual results, indicating the validity of the classification method and indicator selection. However, it was found that a Heritage Tourism sub-watershed and a Rural Economy sub-watershed were inconsistent with the actual situation and clustered into Ecological Protection sub-watersheds. After analysis, the Ecological Conservation sub-watersheds depend to a large extent on ecological variables. The main determinants of this category are vegetation cover, soil erosion intensity, and average runoff coefficient. It can be shown that the land cover in this type is mainly water or constructed land and is affected by natural and social human factors, with ecological problems. The sub-watershed size influences the two sub-watersheds. The environmental indicators are overweighted, resulting in low heritage attributes, and the lack of an apparent socioeconomic gradient may limit the diversity of the indicators. In this case, the trade-off between ecological attributes and heritage and economic attributes is prevented, leading to a change in the type of sub-watershed. Therefore, in future studies, the focus is on refining the spatial scale. Statistical data should be used to make a more systematic assessment of a larger area on a fine scale to identify problem catchments. The proposed framework could be coordinated by analyzing existing government plans for protecting heritage areas to solve the specific problems in the practice of small watershed classification and achieve the goal of heritage protection.
This study has some limitations in data collection and quantitative methods. For example, cultural services in social attributes need to be analyzed from the perspective of social behavior. However, due to the lack of large-scale evaluation data, it is difficult to carry out detailed investigations on public cultural construction, human behavior, etc., so the data of A-class scenic spots were used instead. Another limitation of this study is the time scale. Data from the Beijing area for 2010–2020 were selected for analysis. Therefore, no longitudinal comparisons of time series and spatial comparisons of various indicators across different regions were made. The mechanism to facilitate the evolution of the spatial structure of sub-watersheds is lacking.

5. Conclusions

The Great Wall cultural heritage zone has heritage and ecological coupling characteristics. This paper proposes to delimit the protection boundary of heritage from ecological and heritage coupling perspectives, taking the sub-watershed as a unit. One hundred sixty-nine sub-watersheds of Beijing Great Wall heritage are identified and divided into five representative types. The study initially reveals the essential characteristics of the spatial structure of the five types of Great Wall sub-watersheds, showing spatial clustering characteristics.
Different management strategies for different types of sub-watersheds are proposed to adapt to each catchment’s unique socioeconomic and biophysical conditions. Managers should pay more attention to ecological and environmental protection in the Great Wall watershed area, strengthen investment in pollution control, enhance disaster resilience, improve the carrying capacity of the water environment, and enhance environmental awareness. Measures to improve water resources and pollutant discharge are needed in the face of over-exploitation of tourism, and rivers and lakes should maintain the trend of reducing the total amount of ammonia nitrogen and COD, preventing surface source pollution and increasing environmental capacity.
This paper aims to provide a scientific tool for dividing and classifying the core watershed of Great Wall heritage protection. It took the watershed’s edge as the boundary, covering the overall physical geographical pattern of the Great Wall in the Beijing section. Its designation as a site protection area safeguards the authenticity and integrity of the heritage site’s historical ecological geography and natural features. The classification method is adopted to identify and interpret the sub-watershed’s ecological theory and social information. We hope that this approach will enhance the objective practice of heritage conservation ecology, heritage, and planning and improve conservation efficiency and effective conservation. It could also provide references for other heritage zones and similar watersheds.

Author Contributions

Conceptualization, L.J. and S.W.; methodology, L.J. and S.W.; software, L.J.; validation, L.J., Y.Z. and S.W.; formal analysis and C.C.; investigation, L.J. and Y.Z.; resources, S.W.; data curation, Z.S.; writing—original draft preparation, L.J.; writing—review and editing, L.J. and S.W.; visualization, Y.S. and Y.K.; supervision, L.J. and S.W.; project administration, S.W.; funding acquisition, S.W. All authors have read and agreed to the published version of the manuscript.

Funding

This research was funded by the National Natural Science Foundation of China (Project number:31870704; 52008016).

Institutional Review Board Statement

Ethical approval received.

Informed Consent Statement

There are no conflicts of interest existing in the submission of this manuscript, which has been approved by all its authors for publication.

Data Availability Statement

Not applicable.

Conflicts of Interest

The authors declare no conflict of interest.

References

  1. Du, Y.M.; Chen, W.W.; Cui, K.; Zhang, K.W. Study on Damage Assessment of Earthen Sites of the Ming Great Wall in Qinghai Province Based on Fuzzy-AHP and AHP-TOPSIS. Int. J. Archit. Herit. 2020, 14, 903–916. [Google Scholar] [CrossRef]
  2. Richards, J.; Viles, H.; Guo, Q. The importance of wind as a driver of earthen heritage deterioration in dryland environments. Geomorphology 2020, 369, 107363. [Google Scholar] [CrossRef]
  3. Lee, W.H.; Abdullah, S.A. Framework to develop a consolidated index model to evaluate the conservation effectiveness of protected areas. Ecol. Indic. 2019, 102, 131–144. [Google Scholar] [CrossRef]
  4. Davis, S.M.C. Rethinking Biodiversity Conservation Effectiveness and Evaluation in the National Protected Areas Systems of Tropical Islands: The case of Jamaica and the Dominican Repulic; Wilfrid Laurier University: Waterloo, ON, Canada, 2009. [Google Scholar]
  5. Watson, J.E.M.; Dudley, N.; Segan, D.B.; Hockings, M. The performance and potential of protected areas. Nature 2014, 515, 67–73. [Google Scholar] [CrossRef]
  6. Cao, Y.C.; Zhang, Y.K. The fractal structure of the Ming Great Wall Military Defense System: A revised horizon over the relationship between the Great Wall and the military defense settlements. J. Cult. Herit. 2018, 33, 159–169. [Google Scholar] [CrossRef]
  7. Wang, L. Spatial analysis of the Great Wall Ji Town military settlements in the Ming Dynasty: Research and conservation. Ann. GIS 2018, 24, 71–81. [Google Scholar] [CrossRef] [Green Version]
  8. Wang, C.K.; Yang, W.W.; Zhu, Y.F.; Ren, Y.J. Analysis of the impact of ancient city walls on urban landscape patterns by remote sensing. Landsc. Ecol. Eng. 2021, 17, 29–39. [Google Scholar] [CrossRef]
  9. Yuan, X.; LI, J.W.; LI, J.Q. Attibutes of vegetation and status of plant diversity in Great Wall Scenic-spots in Beijing. Acta Geogr. Sin. 2007, 27, 0977–0988. [Google Scholar]
  10. Kong, F.D. Ecological Damage Characteristics Along the Great Wall of China and Protective Measures. Res. Soil Water Conserv. 2006, 13, 42–43. [Google Scholar]
  11. Du, Y.M.; Chen, W.W.; Cui, K.; Gong, S.Y.; Pu, T.B.; Fu, X.L. A Model Characterizing Deterioration at Earthen Sites of the Ming Great Wall in Qinghai Province, China. Soil Mech. Found. Eng. 2017, 53, 426–434. [Google Scholar] [CrossRef]
  12. Du, Y.M.; Chen, W.W.; Cui, K.; Zhang, J.K.; Chen, Z.; Zhang, Q.Y. Damage Assessment of Earthen Sites of the Ming Great Wall in Qinghai Province: A Comparison between Support Vector Machine (SVM) and BP Neural Network. J. Comput. Cult. Herit. 2020, 13, 1–18. [Google Scholar] [CrossRef]
  13. Wang, Y.Y. Nanjing Ming City Wall Heritage Corridor Protection and Construction Research. Mater’s Thesis, Nanjing Forestry University, Beijing, China, 2015. [Google Scholar]
  14. Zhang, O. Research on the Distribution Status and Damage Protection of the Great Wall of Ming Dynasty in Beijing. Mater’s Thesis, Capital Normal University, Beijing, China, 2007. [Google Scholar]
  15. Gong, J.J.; Yang, H.; Deng, H.F. Spatial heterogeneity and complexity of forest landscape along the Ming Great Wall in Beijing. J. Beijing For. Univ. 2015, 37, 81–87. [Google Scholar] [CrossRef]
  16. Wei, D. Research on Conservation Planning of Yumenguan Section of Han Great Wall. Mater’s Thesis, Xi’an University of Architecture and Technology, Beijing, China, 2007. [Google Scholar]
  17. Tang, Y.Y.; Cai, C.; Liu, Z.W. Into Beijing Great Wall Culture Belt Protection and Development. In The Great Wall—A Collection of Essays Celebrating the 70th Anniversary of the Founding of the People’s Republic of China; The Great Wall: Beijing, China, 2019; pp. 36–41. [Google Scholar] [CrossRef]
  18. Lotspeich, F.B. Watersheds as the Basic Ecosystem: This Conceptual Framework Provides a Basis for a Natural Classification System. J. Am. Water Resour. Assoc. 1980, 16, 581–586. [Google Scholar] [CrossRef]
  19. Steiner, F.; Blair, J.; McSherry, L.; Guhathakurta, S.; Marruffo, J.; Holm, M. A watershed at a watershed: The potential for environmentally sensitive area protection in the upper San Pedro Drainage Basin (Mexico and USA). Landsc. Urban Plan. 2000, 49, 129–148. [Google Scholar] [CrossRef]
  20. Zhang, Y.F.; Jia, D.M.; Tan, J.; Zhang, H.Y.; Song, S.Y.; Sun, R.F. The Spatial Structure of Valley Economy Development in the Mountainous Areas of Beijing. Acta Geogr. Sin. 2009, 64, 1231–1242. [Google Scholar]
  21. Karen, M.O. Can Watershed Management Unite Town and Country? Soc. Nat. Resour. 2005, 18, 241–253. [Google Scholar] [CrossRef]
  22. FU, B.J.; XU, Y.D.; LV, Y.H. Scale Characteristics and Coupled Research of Landscape Pattern and Soil and Water Loss. Adv. Earth Sci. 2010, 25, 673–681. [Google Scholar] [CrossRef] [Green Version]
  23. Mayer, A.; Winkler, R.; Fry, L. Classification of watersheds into integrated social and biophysical indicators with clustering analysis. Ecol. Indic. 2014, 45, 340–349. [Google Scholar] [CrossRef]
  24. Shen, Y.; Su, Q.S.; Jia, T.L.; Zhou, X.D. Characteristics of the site selection and the layout of the Great Wall of the Ming dynasty from a military perspective: Xiaohekou section as an example. Front. Archit. Res. 2020, 9, 541–555. [Google Scholar] [CrossRef]
  25. Su, M.M.; Wall, G. Global–local relationships and governance issues at the Great Wall World Heritage Site, China. J. Sustain. Tour. 2012, 20, 1067–1086. [Google Scholar] [CrossRef]
  26. Chen, J.H.; Li, H.; Zhou, L.D. Gully Economy Development’s Exploration and Practice in Beijing Mountain Area. Ecol. Econ. 2010, 1, 57–62. [Google Scholar]
  27. Chen, T.Q.; Feng, Z.; Zhao, H.F.; Wu, K.N. Identification of ecosystem service bundles and driving factors in Beijing and its surrounding areas. Sci. Total Environ. 2020, 711, 134687. [Google Scholar] [CrossRef] [PubMed]
  28. Chen, D.S.; Pan, Y.Q.; Jin, X.L.; Du, H.Y.; Li, M.C.; Jiang, P.H. The delineation of ecological redline area for catchment sustainable management from the perspective of ecosystem services and social needs: A case study of the Xiangjiang watershed, China. Ecol. Indic. 2020, 121, 107130. [Google Scholar] [CrossRef]
  29. Wu, M.; Che, Y.; Lv, Y.P.; Yang, K. Neighbourhood-scale urban riparian ecosystem classification. Ecol. Indic. 2017, 72, 330–339. [Google Scholar] [CrossRef]
  30. Peng, J.; Hu, X.X.; Qiu, S.J.; Hu, Y.N.; Meersmans, J.; Liu, Y.X. Multifunctional landscapes identification and associated development zoning in mountainous area. Sci. Total Environ. 2019, 660, 765–775. [Google Scholar] [CrossRef] [PubMed] [Green Version]
  31. Xinliang, X. Spatial Distribution Dataset of China’s Annual Vegetation Index (NDVI). Resource and Environmental Science Data Registration and Publication System. 2018. Available online: https://www.resdc.cn/DOI/doi.aspx?DOIid=49 (accessed on 21 September 2022).
  32. Xinliang, X.; Chinese Population Spatial Distribution Kilometer Grid Dataset. Resource and Environmental Science Data Registration and Publication System. 2017. Available online: https://www.resdc.cn/DOI/doi.aspx?DOIid=32 (accessed on 21 September 2022).
  33. Fan, Y.T.; Jin, X.B.; Gan, L.; Jessup, L.H.; Pijanowski, B.C.; Yang, X.H.; Xiang, X.; Zhou, Y. Spatial identification and dynamic analysis of land use functions reveals istinct zones of multiple functions in eastern China. Sci. Total Environ. 2018, 642, 33–44. [Google Scholar] [CrossRef]
  34. Xinliang, X. China’s GDP Spatial Distribution Kilometer Grid Dataset. Resource and Environmental Science Data Registration and Publication System. 2017. Available online: https://www.resdc.cn/DOI/doi.aspx?DOIid=33 (accessed on 21 September 2022).
  35. Liang, B. Study of the method of dividing medium and large catchments into small catchments of a given size. Technol. Soil Water Conserv. 2021, 5, 12–14. [Google Scholar] [CrossRef]
  36. Ministry of Water Resources, PRC. Specification for Division and Coding of Small Watershed; China Water & Power Press: Devon, UK, 2013; Chapter 6. [Google Scholar]
  37. Zhou, Y.X.; Duan, S.H. Unit for Beijing Information System of Soil and Water Conservation—Small Watershed Division in Beijing Mountain Area. Res. Soil Water Conserv. 2004, 2, 45–46. [Google Scholar]
  38. Feloni, E.; Mousadis, I.; Baltas, E. Flood vulnerability assessment using a GIS-based multi-criteria approach—The case of Attica region. J. Flood Risk Manag. 2019, 13, e12563. [Google Scholar] [CrossRef] [Green Version]
  39. Zhang, X.Y.; Du, S.H.; Wang, Q. Integrating bottom-up classification and top-down feedback for improving urban land-cover and functional-zone mapping. Remote Sens. Environ. Interdiscip. J. 2018, 212, 231–248. [Google Scholar] [CrossRef]
  40. Zhang, Y.S.; Lu, X.; Liu, B.Y.; Wu, D.T.; Fu, G.; Zhao, Y.T.; Sun, P.L. Spatial relationships between ecosystem services and socioecological drivers across a large-scale region: A case study in the Yellow River Basin. Sci. Total Environ. 2020, 766, 142480. [Google Scholar] [CrossRef] [PubMed]
  41. Spake, R.; Lasseur, R.; Crouzat, E.; Bullock, J.M.; Lavorel, S.; Parks, K.E.; Schaafsma, M.; Bennett, E.M.; Maes, J.; Mulligan, M.; et al. Unpacking ecosystem service bundles: Towards predictive mapping of synergies and trade-offs between ecosystem services. Glob. Environ. Change 2017, 47, 37–50. [Google Scholar] [CrossRef] [Green Version]
  42. Peng, J.; Tian, L.; Liu, Y.X.; Zhao, M.Y.; Hu, Y.N.; Wu, J.S. Ecosystem services response to urbanization in metropolitan areas: Thresholds identification. Sci. Total Environ. 2017, 607–608, 706–714. [Google Scholar] [CrossRef]
  43. Mouchet, M.A.; Lamarque, P.; Martín-López, B.; Crouzat, E.; Gos, P.; Byczek, C.; Lavorel, S. An interdisciplinary methodological guide for quantifying associations between ecosystem services. Glob. Environ. Change 2014, 28, 298–308. [Google Scholar] [CrossRef]
  44. Safavian, S.R.; Landgrebe, D. A Survey of Decision Wee Classifier Methodology. IEEE Trans. Syst. Man Cybern. 1991, 21, 660–674. [Google Scholar] [CrossRef] [Green Version]
  45. Ertuğrul, Ö.F.; Tağluk, M.E. A Novel Version of k Nearest Neighbor: Dependent Nearest Neighbor. Appl. Soft Comput. 2017, 55, 480–490. [Google Scholar] [CrossRef]
  46. Aggarwal, C.C.; Zhai, C. A Survey of Text Classification Algorithms. In Mining Text Data; Springer: Boston, MA, USA, 2012; Chapter 6; pp. 163–222. [Google Scholar] [CrossRef] [Green Version]
  47. Capó, M.; Pére, A.; Lozano, J.A. An efficient approximation to the k-means clustering for massive data. Knowl.-Based Syst. 2017, 117, 56–69. [Google Scholar] [CrossRef] [Green Version]
  48. Jiao, Y.M.; Zhao, D.M.; Ding, Y.P.; Liu, Y.; Xu, Q.; Qiu, Y.; Liu, C.; Liu, Z.L.; Zha, Z.Q.; Li, R. Performance evaluation for four GIS-based models purposed to predict and map landslide susceptibility: A case study at a World Heritage site in Southwest China. CATENA 2019, 183, 104221. [Google Scholar] [CrossRef]
  49. Battis-Schinker, E.; Al-Alawi, S.; Knippschild, R.; Gmur, K.; Belof, M. Towards quality of life indicators for historic urban landscapes—Insight into a German-Polish research project. Environ. Sustain. Indic. 2021, 10, 100094. [Google Scholar] [CrossRef]
  50. Cano, M.; Garzón, E.; Sánchez-Soto, P.J. Historic preservation, GIS, & rural development: The case of Almería province, Spain. Appl. Geogr. 2013, 42, 34–47. [Google Scholar] [CrossRef]
  51. Stanganelli, M.; Torrieri, F.; Gerundo, C.; Rossitti, M. An integrated strategic-performative planning methodology towards enhancing the sustainable decisional regeneration of fragile territories. Sustain. Cities Soc. 2019, 53, 101920. [Google Scholar] [CrossRef]
  52. Wang, H. Environmental problems in the exploitation and management of the farmhouse enjoyment and their solving ways. J. Anhui Agric. Sci. 2008, 36, 10081–10082. [Google Scholar] [CrossRef]
  53. Seduikyte, L.; Grazuleviciute-Vileniske, I.; Kvasova, O.; Strasinskaite, E. Knowledge transfer in sustainable management of heritage buildings. Case of Lithuania and Cyprus. Sustain. Cities Soc. 2018, 40, 66–74. [Google Scholar] [CrossRef]
  54. Su, M.M.; Wall, G. Community involvement at Great Wall World Heritage sites, Beijing, China. Curr. Issues Tour. 2013, 18, 137–157. [Google Scholar] [CrossRef]
  55. Schirpke, U.; Scolozzi, R.; Dean, G.; Haller, A.; Jäger, H.; Kister, J.; Kovács, B.; Sarmiento, F.O.; Sattler, B.; Schleyer, C. Cultural ecosystem services in mountain regions: Conceptualising conflicts among users and limitations of use. Ecosyst. Serv. 2020, 46, 101210. [Google Scholar] [CrossRef]
  56. Nicu, I.C. Frequency ratio and GIS-based evaluation of landslide susceptibility applied to cultural heritage assessment. J. Cult. Herit. 2017, 28, 172–176. [Google Scholar] [CrossRef]
  57. Wu, T.M. Discussion on sewage treatment method in mountain scenic area. Shanxi Architec. 2007, 35, 207–208. [Google Scholar]
Figure 1. The location of Beijing Great Wall cultural zone and heritage distribution.
Sustainability 14 13836 g001
Figure 2. Watershed delineation process.
Sustainability 14 13836 g002
Figure 3. Distribution of the core sub-watersheds of the Great Wall cultural zone in Beijing.
Sustainability 14 13836 g003
Figure 4. Spatial distribution characteristics of sub-watersheds. Indicators: (a) soil erosion; (b) vegetation cover; (c) average runoff coefficient; (d) A-class scenic spot density; (e) village density; (f) heritage density; (g) population; (h) GDP: Gross Domestic Product.
Sustainability 14 13836 g004aSustainability 14 13836 g004b
Figure 5. Correlation heat map. The number of * in the figure positively correlates with the degree of significance. The more *, the higher the correlation. * means p <= 0.05 ** means p <= 0.001 ** means p <= 0.0001. Blue indicates a negative correlation, while red indicates a positive. When the color becomes dark, it thereby indicates a high correlation. HD: Heritage density; AS: A-class scenic spot density; VD: Village density; SE: Soil erosion; VC: Vegetation coverage; ARC: Average runoff coefficient; GDP: Gross Domestic Product; POP: Population.
Sustainability 14 13836 g005
Figure 6. Spatial distribution of bundles in Beijing Great Wall heritage zone.
Sustainability 14 13836 g006
Figure 7. (a) Heritage + Ecology type sub-watersheds; (b) Heritage + Village type sub-watersheds.
Sustainability 14 13836 g007
Figure 8. (a) Heritage + Ecology type sub-watersheds; (b) Ecological Protection type sub-watersheds.
Sustainability 14 13836 g008
Figure 9. Rural Economy type sub-watersheds.
Sustainability 14 13836 g009
Table 1. Data sources and description of this study.
Indicator TypeIndicatorCalculation MethodExplanationReferences and Data Source
1. Heritage Attributes1.1. Great Wall heritage densityCalculations through the heritage (heritage/km2)Reflecting the distribution of heritage resources in the watershed, the more heritage sites there are, the more prominent the heritage attributes.[27] (http://www.ilovegreatwall.cn/public/TheGoogleGreatWall/ (accessed on 21 September 2022))
2. Ecological Attributes2.1. Degree of soil erosionUSLE (universal soil loss equation) (km2·a)Reflecting the intensity of soil erosion in the watershed, the greater the soil erosion, the greater the ecological sensitivity.[28,29] (http://www.ecosystem.csdb.cn, accessed on 21 September 2022)
2.2. Degree of vegetation coverEstimation of vegetation cover from NDVI (%)The vegetation growth status can influence the quantity and quality of ecosystem services [30]. The higher the vegetation cover, the better the ecological functions.[30,31] (http://www.resdc.cn/, accessed on 21 September 2022)
3. Social Attributes3.1. Population densityPopulation per square kilometer (inhabitants/km2)Population distribution is an important indicator; higher population densities are associated with higher levels of villagization and more human activities.[32,33] (http://www.resdc.cn/, accessed on 21 September 2022)
3.2. GDPGDP value per square kilometer (million/km2)An essential indicator of the gross domestic value of a watershed’s economy, the higher the GDP value, the better the economic development.[33,34] (http://www.resdc. cn/, accessed on 21 September 2022)
3.3. Village densityNumber of villages per square kilometer (village/km2)Reflecting the distribution of villages in the catchment, the higher the density of villages, the richer the human activity and disturbance.(National Bureau of Statistics)
3.4. A-class scenic spots densityData from the 2020 list of A-class scenic spots obtained from the Ministry of Culture and Tourism of the People’s Republic of China was crawled through the Baidu API for the longitude and latitude. Number of A-class attractions per square kilometer (Scenic Area/km2)The Great Wall heritages are located in valleys, where numerous tourist attractions are developed, representing the cultural services provided by the heritages and ecosystems. The higher the density of tourist attractions, the more developed the tertiary sector.[27,33] (https://www.mct.gov.cn/, accessed on 21 September 2022)
4. Hydrological Attributes4.1. Average runoff coefficientMultiplying the land use of each catchment by the corresponding runoff coefficient and making a weighted averageThe runoff coefficient reflects the catchment’s land cover, building density, and soil characteristics and is significant for watershed classification. The higher the average runoff coefficient of the watershed, the higher the surface runoff yield.[28,29]
Table 2. Comparison Results of variance analysis for clustering categories.
ClusteringError
Mean SquareDegree of FreedomMean SquareDegree of FreedomFSignificance
Soil erosion0.07240.0121646.1940.000
Vegetation coverage0.03040.00116428.0230.000
Average runoff coefficient0.78540.02416432.7230.000
Heritage density0.57540.02116426.7820.000
Village density1.73240.01916489.9040.000
A-class scenic spot density0.52340.02316423.0040.000
GDP0.76340.01416453.3540.000
Population0.37040.01716421.1870.000
All differences between means are significant for p < 0.001.
Table 3. Descriptive Classifications for k-means.
CategoryNumber in Each Category (Fraction of Total)Description
High AttributesLow Attributes
1. Heritage + Ecology76 (45%)Vegetation coverage, Heritage densityPopulation, GDP, Soil erosion, A-class scenic spot density
2. Heritage + Village44 (26%)Heritage density, Village density, Average runoff coefficient
3. Heritage + Tourism8 (4.7%)Average runoff coefficient, Heritage density, A-class scenic spot density, Village densitySoil erosion
4. Ecological Protection29 (17.2%)Soil erosion, Average runoff coefficientHeritage density, GDP, Population
5. Rural Economy12 (7.1%)Population, GDPHeritage density, A-class scenic spots density
Publisher’s Note: MDPI stays neutral with regard to jurisdictional claims in published maps and institutional affiliations.

