
Assessment of Sustainable Maintenance Strategy for Manufacturing Industry

Faculty of Engineering and the Built Environment, University of Johannesburg, Johannesburg 2092, South Africa
Sustainability 2022, 14(21), 13850; https://doi.org/10.3390/su142113850
Submission received: 3 August 2022
/
Revised: 6 September 2022
/
Accepted: 6 September 2022
/
Published: 25 October 2022
Abstract
:This study creates a framework to aid in the sustainability of maintenance strategies. The framework was created using expertise from the industry and academia. Using this knowledge, three multi-criteria tools were chosen for the maintenance strategies evaluation. The tools include grey relational analysis (GRA) techniques, additive ratio assessment (ARAS), and step-wise weight assessment ratio analysis (SWARA). In a production system, they were used to assess four planned maintenance strategies. The strategies are periodic maintenance (S1), meter-based maintenance (S2), predictive maintenance (S3) and prescriptive maintenance (S4). The ARAS approach was used to obtain the strategy rating for the various requirements. This study used the SWARA method to determine the requirements’ importance using an intuitionistic fuzzy triangular number. The ARAS results were combined using the GRA method. This study observed that the criteria utilised to choose a maintenance strategy for equipment depend on the information collected from six specialists in a manufacturing organisation. For instance, it was discovered that S3 was the maintenance approach that best suited the system’s technical needs. At the same time, S2 was found to be less effective. The economic needs analysis showed that S1 is the maintenance strategy that is most appropriate for the system, while S3 is the least appropriate. S1 is the most appropriate maintenance method for the system, given the social requirements, whereas S2 is the least effective. According to the results of the environmental requirements, S2 is the best maintenance plan for the system, while S4 is the worst. According to the GRA approach, the system’s best and least appropriate maintenance strategies are S2 and S4, respectively.
1. Introduction
Since many variables determine whether maintenance planning is successful, it is a complicated undertaking. To modify and capture the requirements of their short- and medium-term maintenance policies, stakeholders, are, therefore, continuously examining their maintenance strategy. The burden of maintenance managers increased due to this necessity as they look for models to help them make wise decisions regarding their systems. Hence, manufacturing industries continually review maintenance strategies to meet daily operational needs. A manufacturing system’s effectiveness is decided by its design’s calibre and a suitable maintenance plan to prevent failure and collapse. Production costs include a sizable amount of maintenance costs, and this percentage has rapidly increased as automation, and sophisticated technologies have improved. A systematic maintenance strategy reduces equipment failures and prevents expensive production shutdowns [1]. As a result, maintenance practices are becoming more popular in the manufacturing sector, emphasising system dependability and availability and lengthening the usable life of the equipment. Any asset’s life cycle includes a key stage called maintenance. It is essential to achieving an organisation’s long-term objectives.
Due to its effects on performance, overall cost-effectiveness, quality, availability, on-time performance, safety, and environmental requirements, maintenance has gained importance. Some of the maintenance terminologies used in the literature to describe maintenance strategies include approaches, techniques, tasks, policies, methodologies, and concepts. It is crucial to pick a maintenance strategy to meet environmental and safety standards, increase availability, and extend asset life while reducing expensive breakdowns. Facilities and equipment are now more complicated and dependable because of the rapid development of new technology. Preventive maintenance and condition-based maintenance strategies replace the old maintenance philosophy of breakdown and scheduled maintenance [2]. It is critical to have a planned framework for optimising and prioritising maintenance activities because it is estimated that between 18 and 30 per cent of additional maintenance costs are incurred owing to inadequate maintenance planning [3,4].
To achieve operational and business objectives, maintenance which is a method for boosting the availability and dependability of a company’s assets, is inevitable [5]. Maintenance can be carried out in various methods depending on several variables, including cost, danger, and the seriousness of consequences. The three main categories of maintenance strategies currently employed in the building maintenance sector are corrective maintenance [6,7,8], preventive maintenance [9,10,11], and predictive maintenance [12].
Preventive maintenance is an effective technique to decrease or eliminate equipment failure and boost reliability. With today’s manufacturing systems becoming more sophisticated than previous ones, much research has been conducted on preventive maintenance. The results imply that system maintenance is necessary to prevent equipment failure. Performing preventative maintenance on equipment at integer multiples for a predetermined period is known as periodic maintenance, sometimes known as time-based maintenance [11]. According to a usage-based maintenance mode that some academics proposed, equipment maintenance decisions should incorporate monitoring technologies and consider the possibility that the system would occasionally be inactive or only partially operational. Studies on time-based or usage-based maintenance have only briefly examined a few prognostic systems.
In unexpected circumstances, developing a maintenance schedule well in advance could be challenging. As a result, most equipment may be maintained even when it still has a significant amount of useful life left, incurring high maintenance costs. As a result, several preventative maintenance strategies fall short of the fundamental operational requirements of contemporary business. Therefore, this study proposed a framework incorporating sustainability indicators for planned maintenance strategy selection.
2. Methodology
The advantages of employing an equipment maintenance strategy are considered when considering equipment’s technical, environmental, and social sustainability requirements. From those mentioned above, this study analyses maintenance strategies from techno-economic, social-economic, and environmental viewpoints (Figure 1). The cost of implementing an equipment maintenance strategy is determined using sustainability standards for equipment. This issue opened up a possibility for applying the SWARA, ARAS, and GRA methods to rank the equipment maintenance strategies from various angles. The following nomenclatures are used to describe the parameters in the conceptual framework.
2.1. Interval-Valued Triangular Fuzzy Numbers (IVTFN)
Ref. [13] proposed the fuzzy number set theory. A fuzzy number is a convex fuzzy set with membership values between 0 and 1, defined by a range of real numbers. One of its applications is judging decision-makers based on hazy and ambiguous information. In these circumstances, linguistic variables are widely utilised to denote judgments in intricate and ill-defined problems. In order to address the shortcomings of the fuzzy technique and represent real-world problem scenarios, ref. [13] offered several enhancements, including n-type fuzzy sets. Since it is pretty challenging to calculate this value precisely, the membership value is represented as an interval of real integers. In this regard, ref. [14] introduced interval-valued fuzzy sets as a generalised concept of fuzzy numbers. Ref. [15] described an interval-valued triangular fuzzy number as:
where represent lower and upper triangular fuzzy numbers, respectively; ; . represents the membership function and the degree to which an event may be a member of ; and are the lower and upper membership functions, respectively.
If , then fuzzy triangular numbers are obtained by normalised interval-valued triangular fuzzy numbers [16].
2.2. SWARA Method Based on Interval-Valued Triangular Fuzzy (IF) Numbers
Several multi-criteria decision-making processes demand criteria weights. Weights assigned to criteria may be arbitrary or ill-defined. In addition to computing weighted criterion values, decision-makers may utilise other methods for assessing the importance of criteria (weights) [17,18,19].
Ref. [20] suggested the SWARA (Step-wise Weight Assessment Ratio Analysis) approach for weighing criteria subjectively based on the views and judgment of decision-makers and experts [21,22]. The method’s key characteristic is its ability to gauge experts’ or stakeholders’ opinions regarding the weighting of several criteria. Due to its ease of use and short time commitment, this method is subjective. The following steps describes the SWARA-IVTFN method [23]:
Prioritisation of Criteria: During this stage, each decision-maker must arrange the final criteria for ranking the choices according to importance in decreasing order. The following is how the relative weight of the criteria (S) is determined: the relative importance of each criterion is determined in proportion to the criterion with the greatest rank. Equation (2) is used to determine each criterion’s fuzzy coefficient [24]:
where denotes criterion j, . denotes the fuzzy coefficient for criterion j and . denotes the criterion j significance.
To calculate the initial weight for the criteria: This stage requires that the initial weight of each criterion is obtained using Equation (3).
where . denotes the calculated weight for criterion j.
To obtain the final normalised weights (W): Finally, decision-makers are aided by Equation (4) to obtain the final normalised fuzzy weight for the criteria:
where . denotes the normalised fuzzy weight for criterion j.
Furthermore, the defuzzification process has been used as Equation (5) to express the final weights of the criteria:
where . denotes the crisp weight for criterion j; l and u denote lower and upper membership functions, respectively, of an interval-valued fuzzy number; l’ and u’ denotes the lower and upper non-membership functions of an interval-valued fuzzy number; m denotes the core of an interval-valued fuzzy number.
2.3. Additive Ratio Assessment (ARAS) Method Based on Interval-Valued Triangular Fuzzy Numbers
Decision-makers’ knowledge is used in solving complicated economic problems by various MCDM methodologies [25]. As one of the unique and valuable methodologies in the field of MCDM, Zavadskas and Turskis introduced the ARAS method in 2010 [26]. The following are the steps of the ARAS-ITF technique [27]:
Forming a decision matrix and determining the optimal performance rating for each criterion Equation (6):
where the decision matrix is given as m x n – m denotes the alternatives and n denotes criteria; ; is the optimal value of criterion j. The symbol ‘~’ above each letter rresents an interval-valued fuzzy set.
Equation (7) is used to compute the best performance rating for each interval-valued criterion:
Other symbols are defined as follows:
2.4. Grey Relational Analysis
The Grey Relational Analysis Method creates single values for a multi-criteria problem [28,29]. This approach can solve issues involving intricate interactions between different criteria or elements. The Taguchi technique and grey relational analysis were coupled by [28] to handle the multi-response simulation challenge. Their analysis showed that the proposed strategy produced results that did not considerably deviate from the literature methods for this issue (TOPSIS, response surface method, dual-response system, and scatter search).
The sustainability criteria are normalised to ensure comparability of the data used to produce the grade-related grades for the sustainability standards [30]. Equations (13) and (14) are used to determine normalised values of the benefit- and cost-based sustainability criteria, respectively.
where yijk and xijk denotes the actual and normalised values, respectively, for sustainability index i regarding criterion j based on maintenance strategy’s k.
The grey relational coefficient of the sustainability criteria is determined based on Equation (15).
where represents a distinguishing coefficient [24]; denotes the grey relational coefficient for sustainability index i regarding criterion j based on maintenance strategy’s k;
denotes the referenced value for criterion j.
The grey relational grade for a maintenance strategy is expressed as Equations (17) and (18).
where and represents the benefit and cost values, respectively, of a sustainability index i regarding a maintenance strategy k and denotes the cost-benefit value for performance index a maintenance strategy k.
3. Case Study
The case study for this study was a manufacturer of non-alcoholic beverages whosebusiness is situated in Lagos, Nigeria. Currently, the company has a dedicated maintenance department and runs two production shifts. The maintenance department is in charge of maintaining the production lines that make canned and bottled beverages. The department uses in-house staff to carry out planned maintenance tasks in accordance with the company’s maintenance policy. Periodic training programs are provided to the maintenance personnel to increase their productivity. After equipment audits, this study found that four planned maintenance strategies could be used to increase the company’s equipment sustainability. The strategies are periodic maintenance (S1), meter-based maintenance (S2), predictive maintenance (S3), and prescriptive maintenance (S4) (Table 1).
During the implementation of the suggested conceptual framework, energy consumption, water pollution, soil pollution, air pollution, noise control, and vibration control were considered environmental sustainability criteria. Labor, administrative and overhead costs, outsourcing, materials, spare parts, and penalty charges are the factors for economic sustainability. Social sustainability requirements include tenant satisfaction, tenant relations, psychosocial well-being, safety, compliance with laws, and security [31]. In contrast, technical sustainability criteria include equipment longevity, dependability, availability, efficiency, reparability, and service quality (Table 2).
Based on Table 2, the maintenance strategies are evaluated using the linguistic variables in Table 3. On the other hand, Table 4 presents linguistic variables used to evaluate the significance of the sustainability criteria in Table 2. The proposed framework’s implementation is based on industry understanding of maintenance systems. The data needed for the framework’s execution was generated by this study using the expertise of six groups of specialists [32]. A well-structured questionnaire was employed to gather data from the specialists during the data collection procedure. There are two parts to the questionnaire. Information regarding the significance of the sustainable needs is given in the first element of the questionnaire, whilst data on the strategies’ ratings are found in the second. The questionnaire includes a succinct introduction and purpose statement. This study ensures that the questionnaire is brief and contains no presumptive questions. It contains impartial questions while including open-ended questions and a rating scale.
4. Results and Discussion
Two viewpoints are taken into consideration when analysing the results of the tactics. The ARAS approach was utilised to generate the necessary information in the first viewpoint, which examined the methods from a requirement standpoint. The second viewpoint examined the techniques from the sustainability standpoint; GRA was utilised to produce the necessary data.
4.1. Technical Requirement Results
Based on the evaluation received from the manufacturing system specialists, the maintenance plans are examined. This study first established the significance of the sub-criteria included in this requirement. The experts’ evaluation of the technical requirements is shown in Table 5. When the SWARA approach was implemented, this information was transformed into an intuitive fuzzy number. The SWARA outputs for the technical criteria in this study are in Table 6. When the interval-valued fuzzy numbers in Table 6 were reduced to single values using Equation (5), it was discovered that c11 and c15 are the most and least critical technical criteria, respectively.
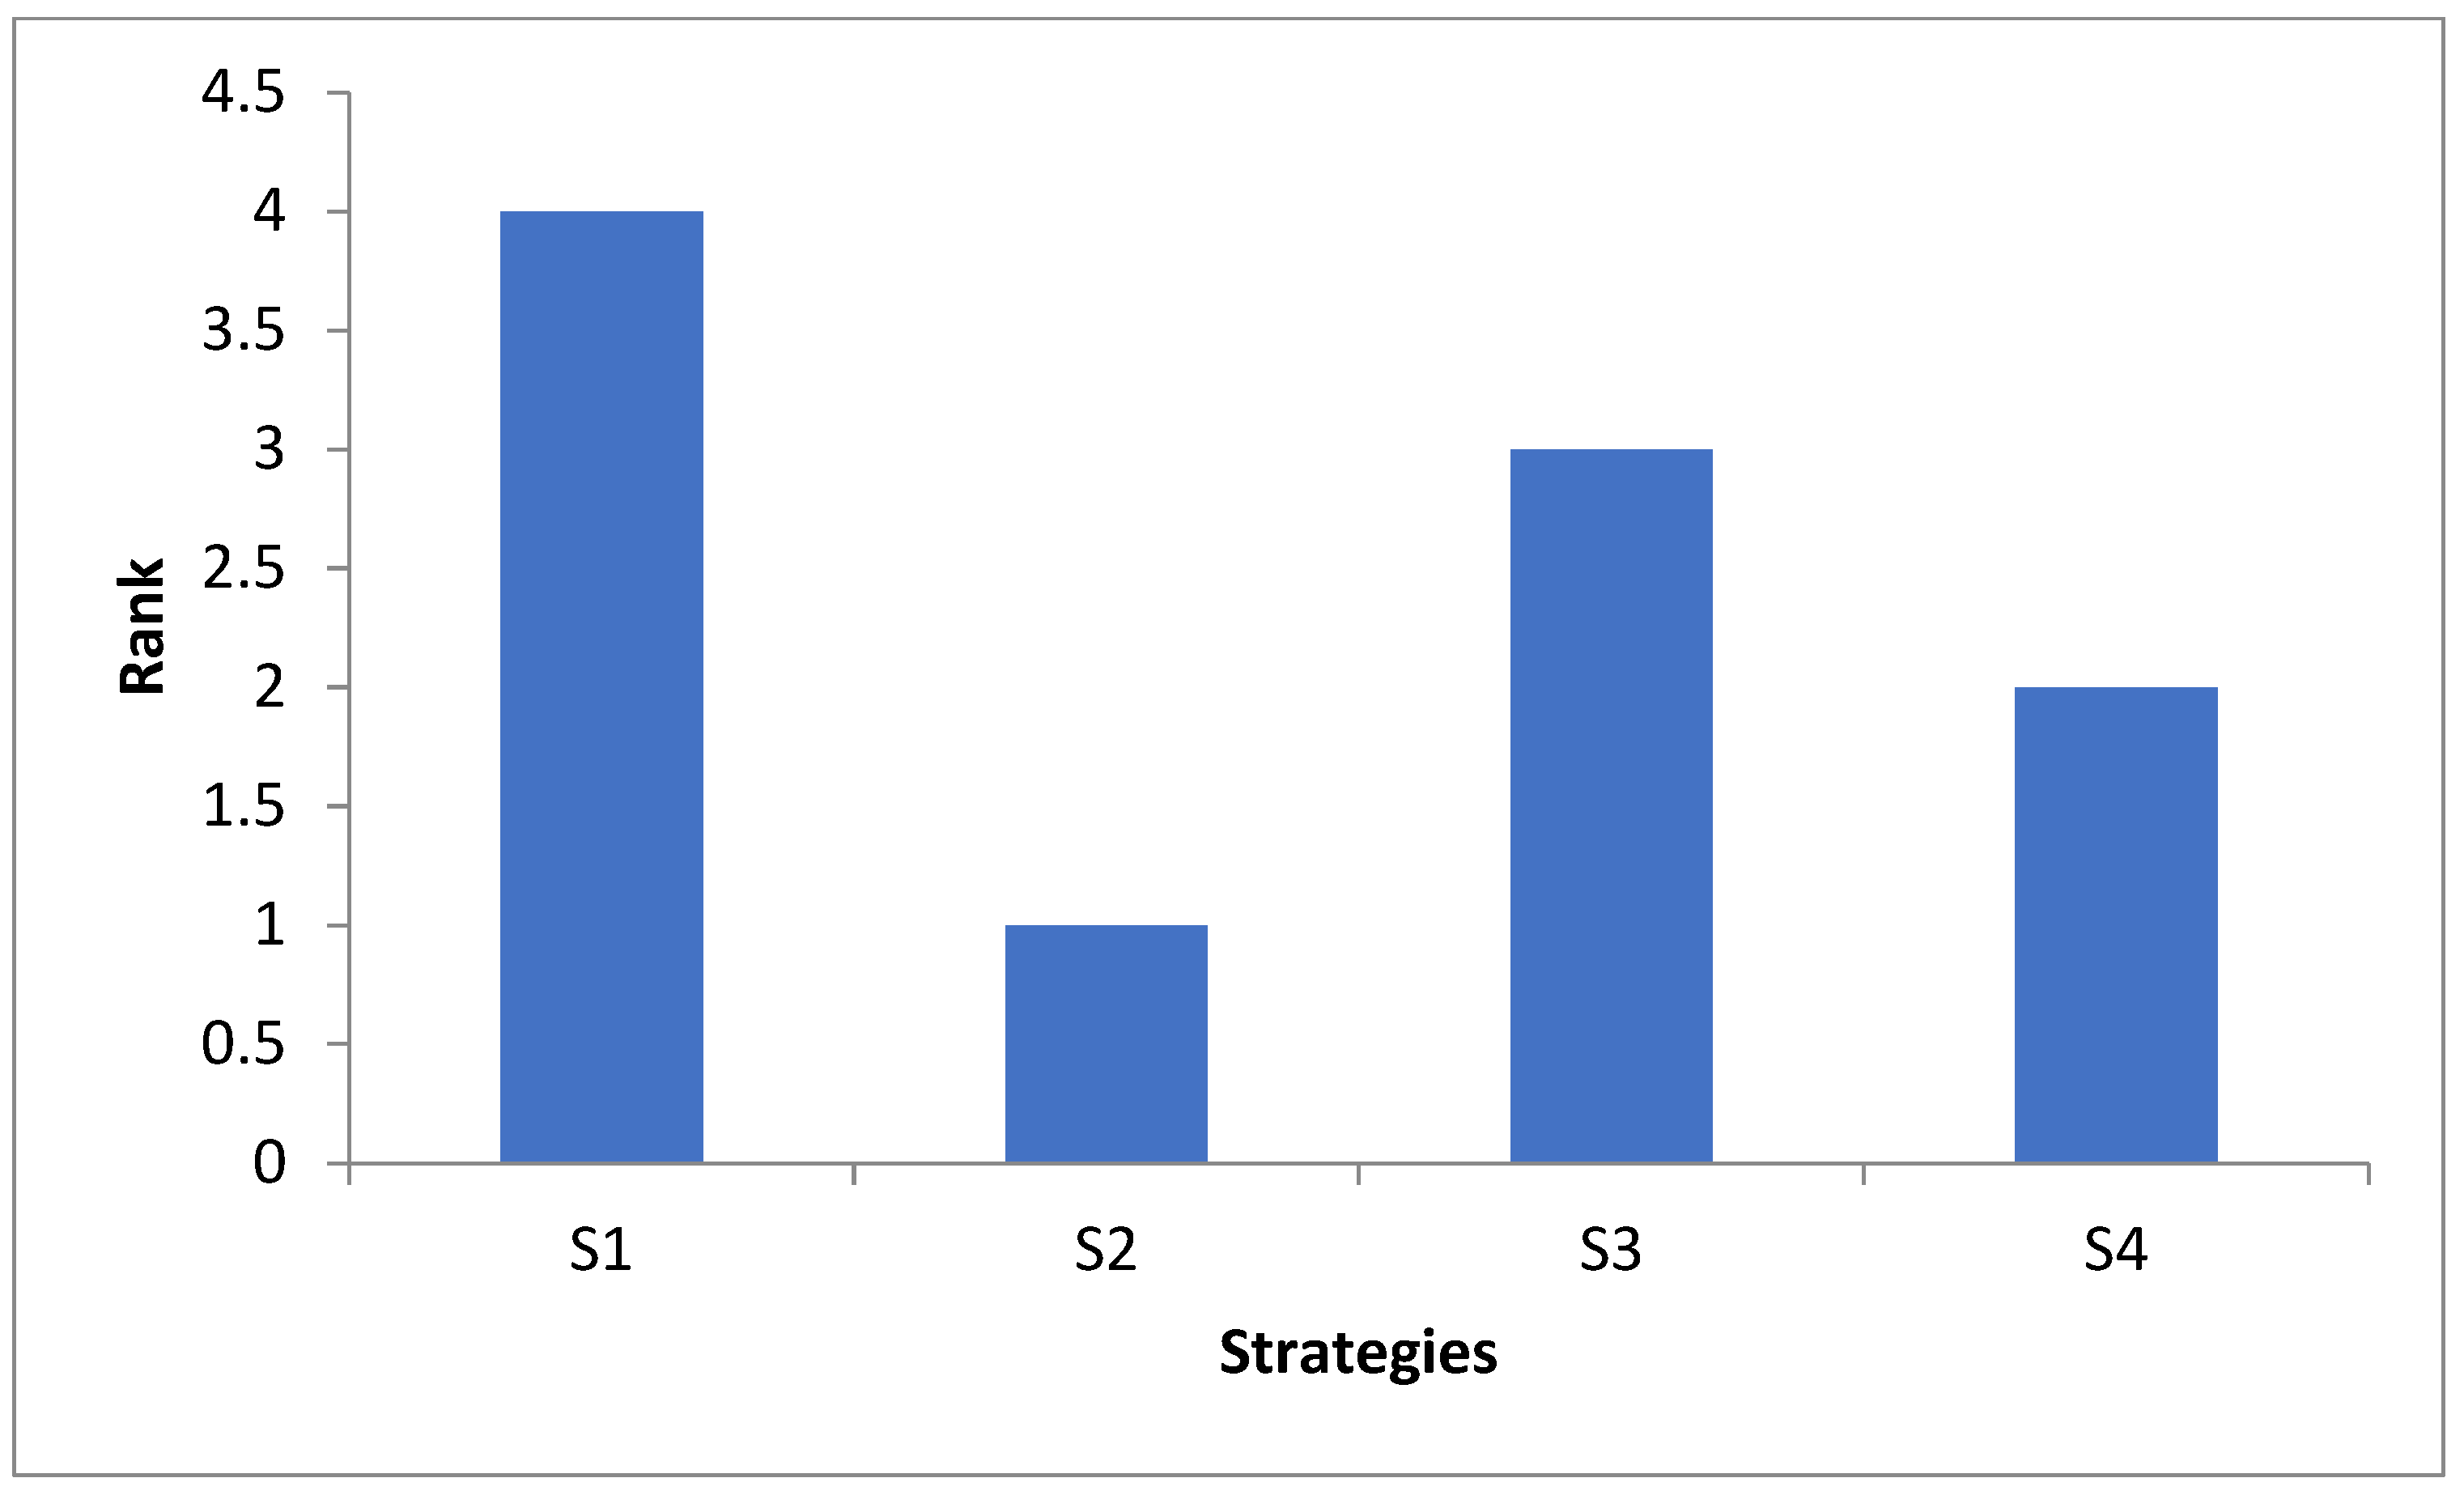
The experts’ responses to the maintenance plans under the technical criteria are shown in Table 7. These data were translated to ITF values and combined to create the aggregated decision matrix. This study normalised the matrix and created the weighted normalised matrix by combining the normalised decision matrix with the criteria weights (Table 8). Figure 2 shows that S3 is the best suitable maintenance approach based on the ARAS outputs. S2, on the other hand, is the system’s least effective maintenance method (Figure 2).
4.2. Economic Requirement Results
Table 9 lists the experts’ opinions on the significance of the economic criteria. the SWARA approach for requirements evaluation was implemented usingng this data,. The linguistic values in this table were translated to ITF values for processing in this investigation. Table 10 lists the final results for the economic requirements. Equation (5) was used to convert the interval-valued fuzzy numbers in Table 10 to single values, and it was found that c21 and c26 are the most and least significant economic criteria, respectively.
The data shown in Table 11 serves as the foundation for the empirical study of the maintenance strategies based on the economic criterion. This study transformed the linguistic data in the table into ITF values for analysis. A normalised decision matrix for the strategies was created by averaging and normalising the values. For this decision-making issue, we created a weighted normalised decision matrix with this new matrix and the data in Table 11—see Table 12 for more details about the weighted normalised decision matrix. When this data was processed using the ARAS approach, it is discovered that S1 is the best maintenance strategy for the system (Figure 3); in contrast, S3 is the worst.
4.3. Social Requirement Results
Table 13 lists the linguistic evaluations of the social prerequisites for the maintenance plan selection dilemma. This study produced ITF values for the social criteria (Table 14) using the information in Table 13. These linguistic values were transformed to ITF values while evaluating the requirements’ crisp values. When the interval-valued fuzzy numbers in Table 14 were converted to single values using Equation (5), it was discovered that c31 and c34 were the most and least significant social criteria, respectively.
The data in Table 15 are the empirical study of the maintenance strategies under societal requirements. The verbal data were transformed into ITF values and then analysed. The values were combined and normalised to create the normalised decision matrix for the strategies. Based on the normalised values and the data in Table 14 and Table 16, Table 16 displays the weighted normalised decision matrix for the strategies. S4 is the best method for the case study, as shown in Figure 4. Conversely, S2 is the system’s least effective method.
4.4. Environmental Requirement Results
The data shown in Table 17 provides the foundation for examining maintenance tactics under environmental requirements. To use the SWARA approach, we transformed this data into ITF data. The SWARA outputs for the environmental requirements are shown in Table 18. The most and least significant environmental criteria were c41 and c45, respectively, when the interval-valued fuzzy numbers in Table 18 were transformed to single values using Equation (5). The data in Table 19 provides the foundation for the empirical study of the maintenance strategies under the environmental criterion. This study transformed the linguistic data in the table into ITF values for analysis. The total values for the maintenance strategies are shown in Table 20. These values were normalised to create the normalised decision matrix for the technical requirements to analyse the strategies.
The data in Table 18 and Table 20 were combined to create the weighted normalised matrix. The data in Table 20 was processed using ARAS, while the ARAS outputs for the strategies based on the environmental criteria are shown in Figure 5. The conclusion that S2 is the best maintenance method is logical. On the other hand, S4 is the least suitable maintenance strategy for the system (Figure 5).
4.5. Sustainability Results
The GRA techniques combined the ARAS data (Table 21). The decision-making problem’s final outputs were produced based on the weighted criteria in Table 22. Figure 6 demonstrates that S2 is the most effective system maintenance method. On the other hand, S1 was determined to be the system’s least effective maintenance plan (Figure 6).
5. Conclusions
This study has shown how vital sustainability is when deciding on the best maintenance plan for equipment. This was accomplished by outlining various criteria for building sustainability needs. The analysis of several preventive maintenance procedures regarding equipment sustainability needs was achieved using a framework that included SWARA, ARAS, and GRA. The performance of the proposed framework took into account four maintenance strategies: periodic maintenance (S1), meter-based maintenance (S2), predictive maintenance (S3) and prescriptive maintenance (S4). The framework’s applicability—was demonstrated using an illustration example. Six specialists were also engaged in assessing the maintenance system techniques for a manufacturing organisation. The following findings were reached:
- S3 is the most appropriate maintenance strategy for the system based on the technological requirements, while S2 is the least effective method.
- The economic needs analysis showed that S1 is the maintenance strategy that is most appropriate for the system, whereas S3 is the least appropriate.
- S1 is the most appropriate maintenance method for the system, given the social requirements, while S2 is the least effective.
- The results of the environmental requirements indicated that S2 is the best maintenance plan for the system, while S4 is the worst.
- According to the GRA approach, the system’s best and least appropriate maintenance strategies are S2 and S4, respectively.
The design specifications for the selection problems are what drive the suggested framework. System specifications could be included in it to expand its applicability. Our upcoming research efforts will address this issue.
Funding
This research is supported by the University of Johannesburg, South Africa.
Institutional Review Board Statement
Not applicable.
Informed Consent Statement
Not applicable.
Data Availability Statement
Not applicable.
Acknowledgments
As a part of the project “sustainable maintenance planning for manufacturing industries in the global south”, he help of the University of Johannesburg in South Africa in sponsoring this research is appreciated.
Conflicts of Interest
The authors declare no conflict of interest.
Abbreviations
| MCDM | Multi-criteria decision making |
| SWARA | Step-wise weight assessment ratio analysis |
| ARAS | additive ratio assessment |
| GRA | Grey relational analysis |
| Normalised fuzzy weight for criterion j | |
| Crisp weight for criterion j | |
| Cost-benefit value for performance index a maintenance strategy k | |
| K | Total number of maintenance strategies |
| k | maintenance strategy |
| M | Total number of sustainability criteria |
| N | Total number of sub-criteria |
| i | Sustainability criterion |
| j | Sub-criterion |
References
- Froger, A.; Gendreau, M.; Mendoza, J.E.; Pinson, E.; Rousseau, L.M. Maintenance scheduling in the electricity industry: A literature review. Eur. J. Oper. Res. 2016, 251, 695–706. [Google Scholar] [CrossRef]
- Moubray, J. Reliability-Centered Maintenance; Industrial Press: New York, NY, USA, 1997; pp. 2–10. [Google Scholar]
- Mulcahy, R. The CMMS technology revolution—why “Best-of Breed” will still be best. Int. J. Maint. Asset Manag. 1999, 14, 11–14. [Google Scholar]
- Bever, K. Enterprise Systems Integration: Opportunities & Obstacles Developing Plant Asset Management Systems; National Manufacturing Week: Chicago, IL, USA, 2000. [Google Scholar]
- Pintelon, L.; Pinjala, S.K.; Vereecke, A. Evaluating the effectiveness of maintenance strategies. J. Qual. Maint. Eng. 2006, 12, 7–20. [Google Scholar] [CrossRef]
- Clarotti, C.; Lannoy, A.; Odin, S.; Procaccia, H. Detection of equipment aging and determination of the efficiency of a corrective measure. Reliab. Eng. Syst. Saf. 2004, 84, 57–64. [Google Scholar] [CrossRef]
- Reboh, Y.; Riza, S.; Reguly, A. Failure analysis of fifth wheel coupling system TR Strohaecker. Eng. Fail. Anal. 2008, 15, 332–338. [Google Scholar] [CrossRef]
- Al-Meshari, A.; Al-Zahrani, E.; Diab, M. Failure analysis of cooling fan gearbox. Eng. Fail. Anal. 2011, 20, 166–172. [Google Scholar] [CrossRef]
- Cheng, C.Y.; Chen, M.C. The periodic preventive maintenance policy for deteriorating systems by using improvement factor model. Int. J. Appl. Sci. Eng. 2003, 1, 114–122. [Google Scholar]
- Park, D.H.; Jung, G.M.; Yum, J.K. Cost minimisation for periodic maintenance policy of a system subject of slow degradation. Reliab. Eng. Syst. Saf. 2000, 68, 105–112. [Google Scholar] [CrossRef]
- Lee, J.; Ni, J.; Djurdjanovic, D.; Qiu, H.; Liao, H. Intelligent prognostics tools and e-maintenance. Comput. Ind. 2006, 57, 476–489. [Google Scholar] [CrossRef]
- Fernando, N.; Loke, S.W.; Rahayu, W. Mobile cloud computing: A survey. Future Gener. Comput. Syst. 2013, 29, 84–106. [Google Scholar] [CrossRef]
- Zadeh, L.A. Fuzzy sets as a basis for a theory of possibility. Fuzzy Sets Syst. 1978, 1, 3–28. [Google Scholar] [CrossRef]
- Dziech, A.; Gorzałczany, M.B. Decision making in signal transmission problems with interval-valued fuzzy sets. Fuzzy Sets Syst. 1987, 23, 191–203. [Google Scholar] [CrossRef]
- Yao, J.S.; Lin, F.T. Constructing a fuzzy flow-shop sequencing model based on statistical data. Int. J. Approx. Reason. 2002, 29, 215–234. [Google Scholar] [CrossRef] [Green Version]
- Stanujkic, D. An extension of the ratio system approach of MOORA method for group decision-making based on interval-valued triangular fuzzy numbers. Technol. Econ. Dev. Econ. 2016, 22, 122–141. [Google Scholar] [CrossRef]
- Turskis, Z.; Goranin, N.; Nurusheva, A.; Boranbayev, S. Information security risk assessment in critical infrastructure: A hybrid MCDM approach. Informatica 2019, 30, 187–211. [Google Scholar] [CrossRef]
- Baradari, I.; Shoar, M.; Nezafati, N.; Motadel, M. A new approach for KPI ranking and selection in ITIL processes: Using simultaneous evaluation of criteria and alternatives (SECA). J. Ind. Eng. Manag. Stud. 2021, 8, 152–179. [Google Scholar]
- Keshavarz-Ghorabaee, M. Assessment of distribution center locations using a multi-expert subjective–objective decision-making approach. Sci. Rep. 2021, 11, 19461. [Google Scholar] [CrossRef]
- Keršuliene, V.; Zavadskas, E.K.; Turskis, Z. Selection of rational dispute resolution method by applying new step-wise weight assessment ratio analysis (SWARA). J. Bus. Econ. Manag. 2010, 11, 243–258. [Google Scholar] [CrossRef]
- Ruzgys, A.; Volvačiovas, R.; Ignatavičius, Č.; Turskis, Z. Integrated evaluation of external wall insulation in residential buildings using SWARA-TODIM MCDM method. J. Civ. Eng. Manag. 2014, 20, 103–110. [Google Scholar] [CrossRef] [Green Version]
- Karabašević, D.; Stanujkić, D.; Urošević, S.; Maksimović, M. An approach to personnel selection based on SWARA and WASPAS methods. Bizinfo (Blace) J. Econ. Manag. Inform. 2016, 7, 1–11. [Google Scholar]
- Mohammadian, A.; Heidary Dahooie, J.; Qorbani, A.R.; Zavadskas, E.K.; Turskis, Z. A new multi-attribute decision-making framework for policy-makers by using interval-valued triangular fuzzy numbers. Informatica 2021, 32, 583–618. [Google Scholar] [CrossRef]
- Ghoushchi, S.J.; Jalalat, S.M.; Bonab, S.R.; Ghiaci, A.M.; Haseli, G.; Tomaskova, H. Evaluation of Wind Turbine Failure Modes Using the Developed SWARA-CoCoSo Methods Based on the Spherical Fuzzy Environment. IEEE Access 2022, 10, 86750–86764. [Google Scholar] [CrossRef]
- Skvarciany, V.; Jurevičienė, D.; Žitkienė, R.; Lapinskaitė, I.; Dūdė, U. A different approach to the evaluation of smart cities’ indicators. TalTech J. Eur. Stud. 2021, 11, 130–147. [Google Scholar] [CrossRef]
- Zavadskas, E.K.; Turskis, Z. A new additive ratio assessment (ARAS) method in multi-criteria decision-making. Technol. Econ. Dev. Econ. 2010, 16, 159–172. [Google Scholar] [CrossRef]
- Heidary Dahooie, J.; Kazimieras Zavadskas, E.; Abolhasani, M.; Vanaki, A.; Turskis, Z. A novel approach for evaluation of projects using an interval–valued fuzzy additive ratio assessment (ARAS) method: A case study of oil and gas well drilling projects. Symmetry 2018, 10, 45. [Google Scholar] [CrossRef] [Green Version]
- Kuo, Y.; Yang, T.; Huang, G.-W. The use of a grey-based Taguchi method for optimising multi-response simulation problems. Eng. Optim. 2008, 40, 517–528. [Google Scholar] [CrossRef]
- Lv, H.; Chen, X.; Wang, X.; Zeng, X.; Ma, Y. A novel study on a micromixer with Cantor fractal obstacle through grey relational analysis. Int. J. Heat Mass Transf. 2022, 183, 122159. [Google Scholar] [CrossRef]
- Huang, J.T.; Liao, Y.S. Optimisation of machining parameters of wire-EDM based on grey relational and statistical analyses. Int. J. Prod. Res. 2003, 41, 1707–1720. [Google Scholar] [CrossRef]
- Ighravwe, D.E.; Oke, S.A. A multi-criteria decision-making framework for selecting a suitable maintenance strategy for public buildings using sustainability criteria. J. Build. Eng. 2019, 24, 100753. [Google Scholar] [CrossRef]
- Guan, X.; Zhao, J. A Two-Step Fuzzy MCDM method for implementation of sustainable precision manufacturing: Evidence from China. Sustainability 2022, 14, 8085. [Google Scholar] [CrossRef]
Figure 1.
Conceptual framework for maintenance strategies evaluation.
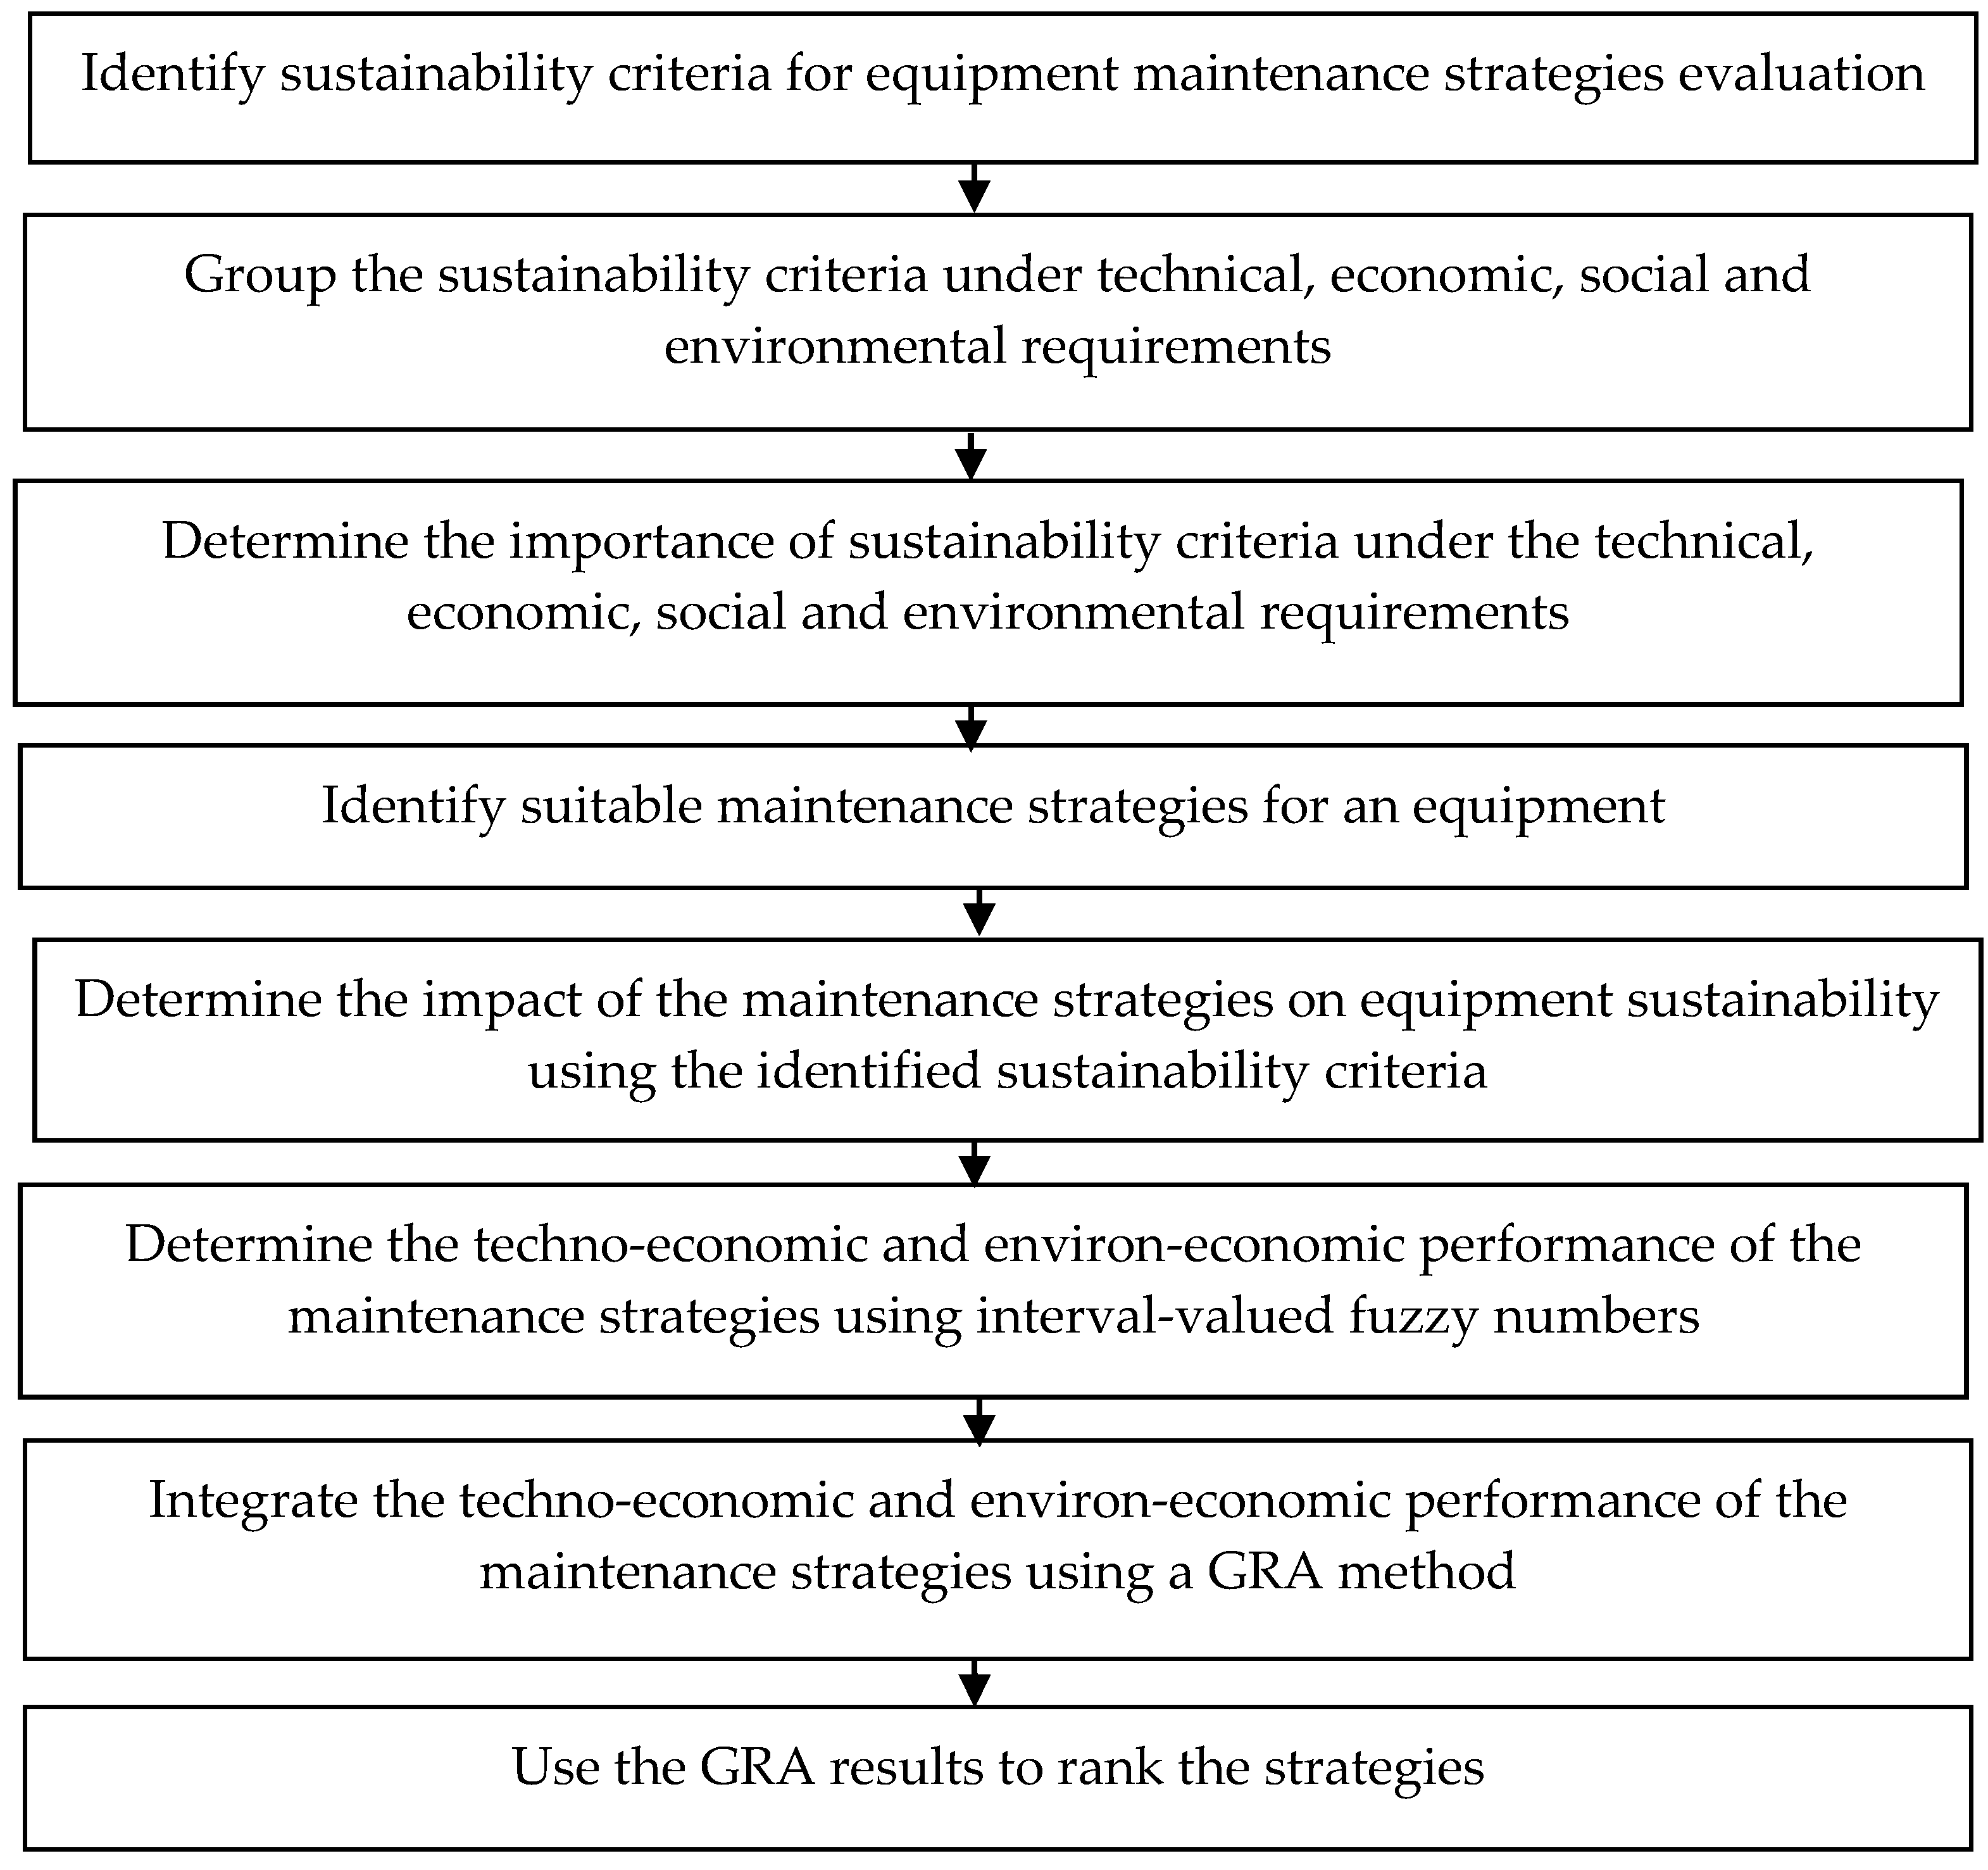
Figure 2.
Ranking of the strategies using technical requirements.
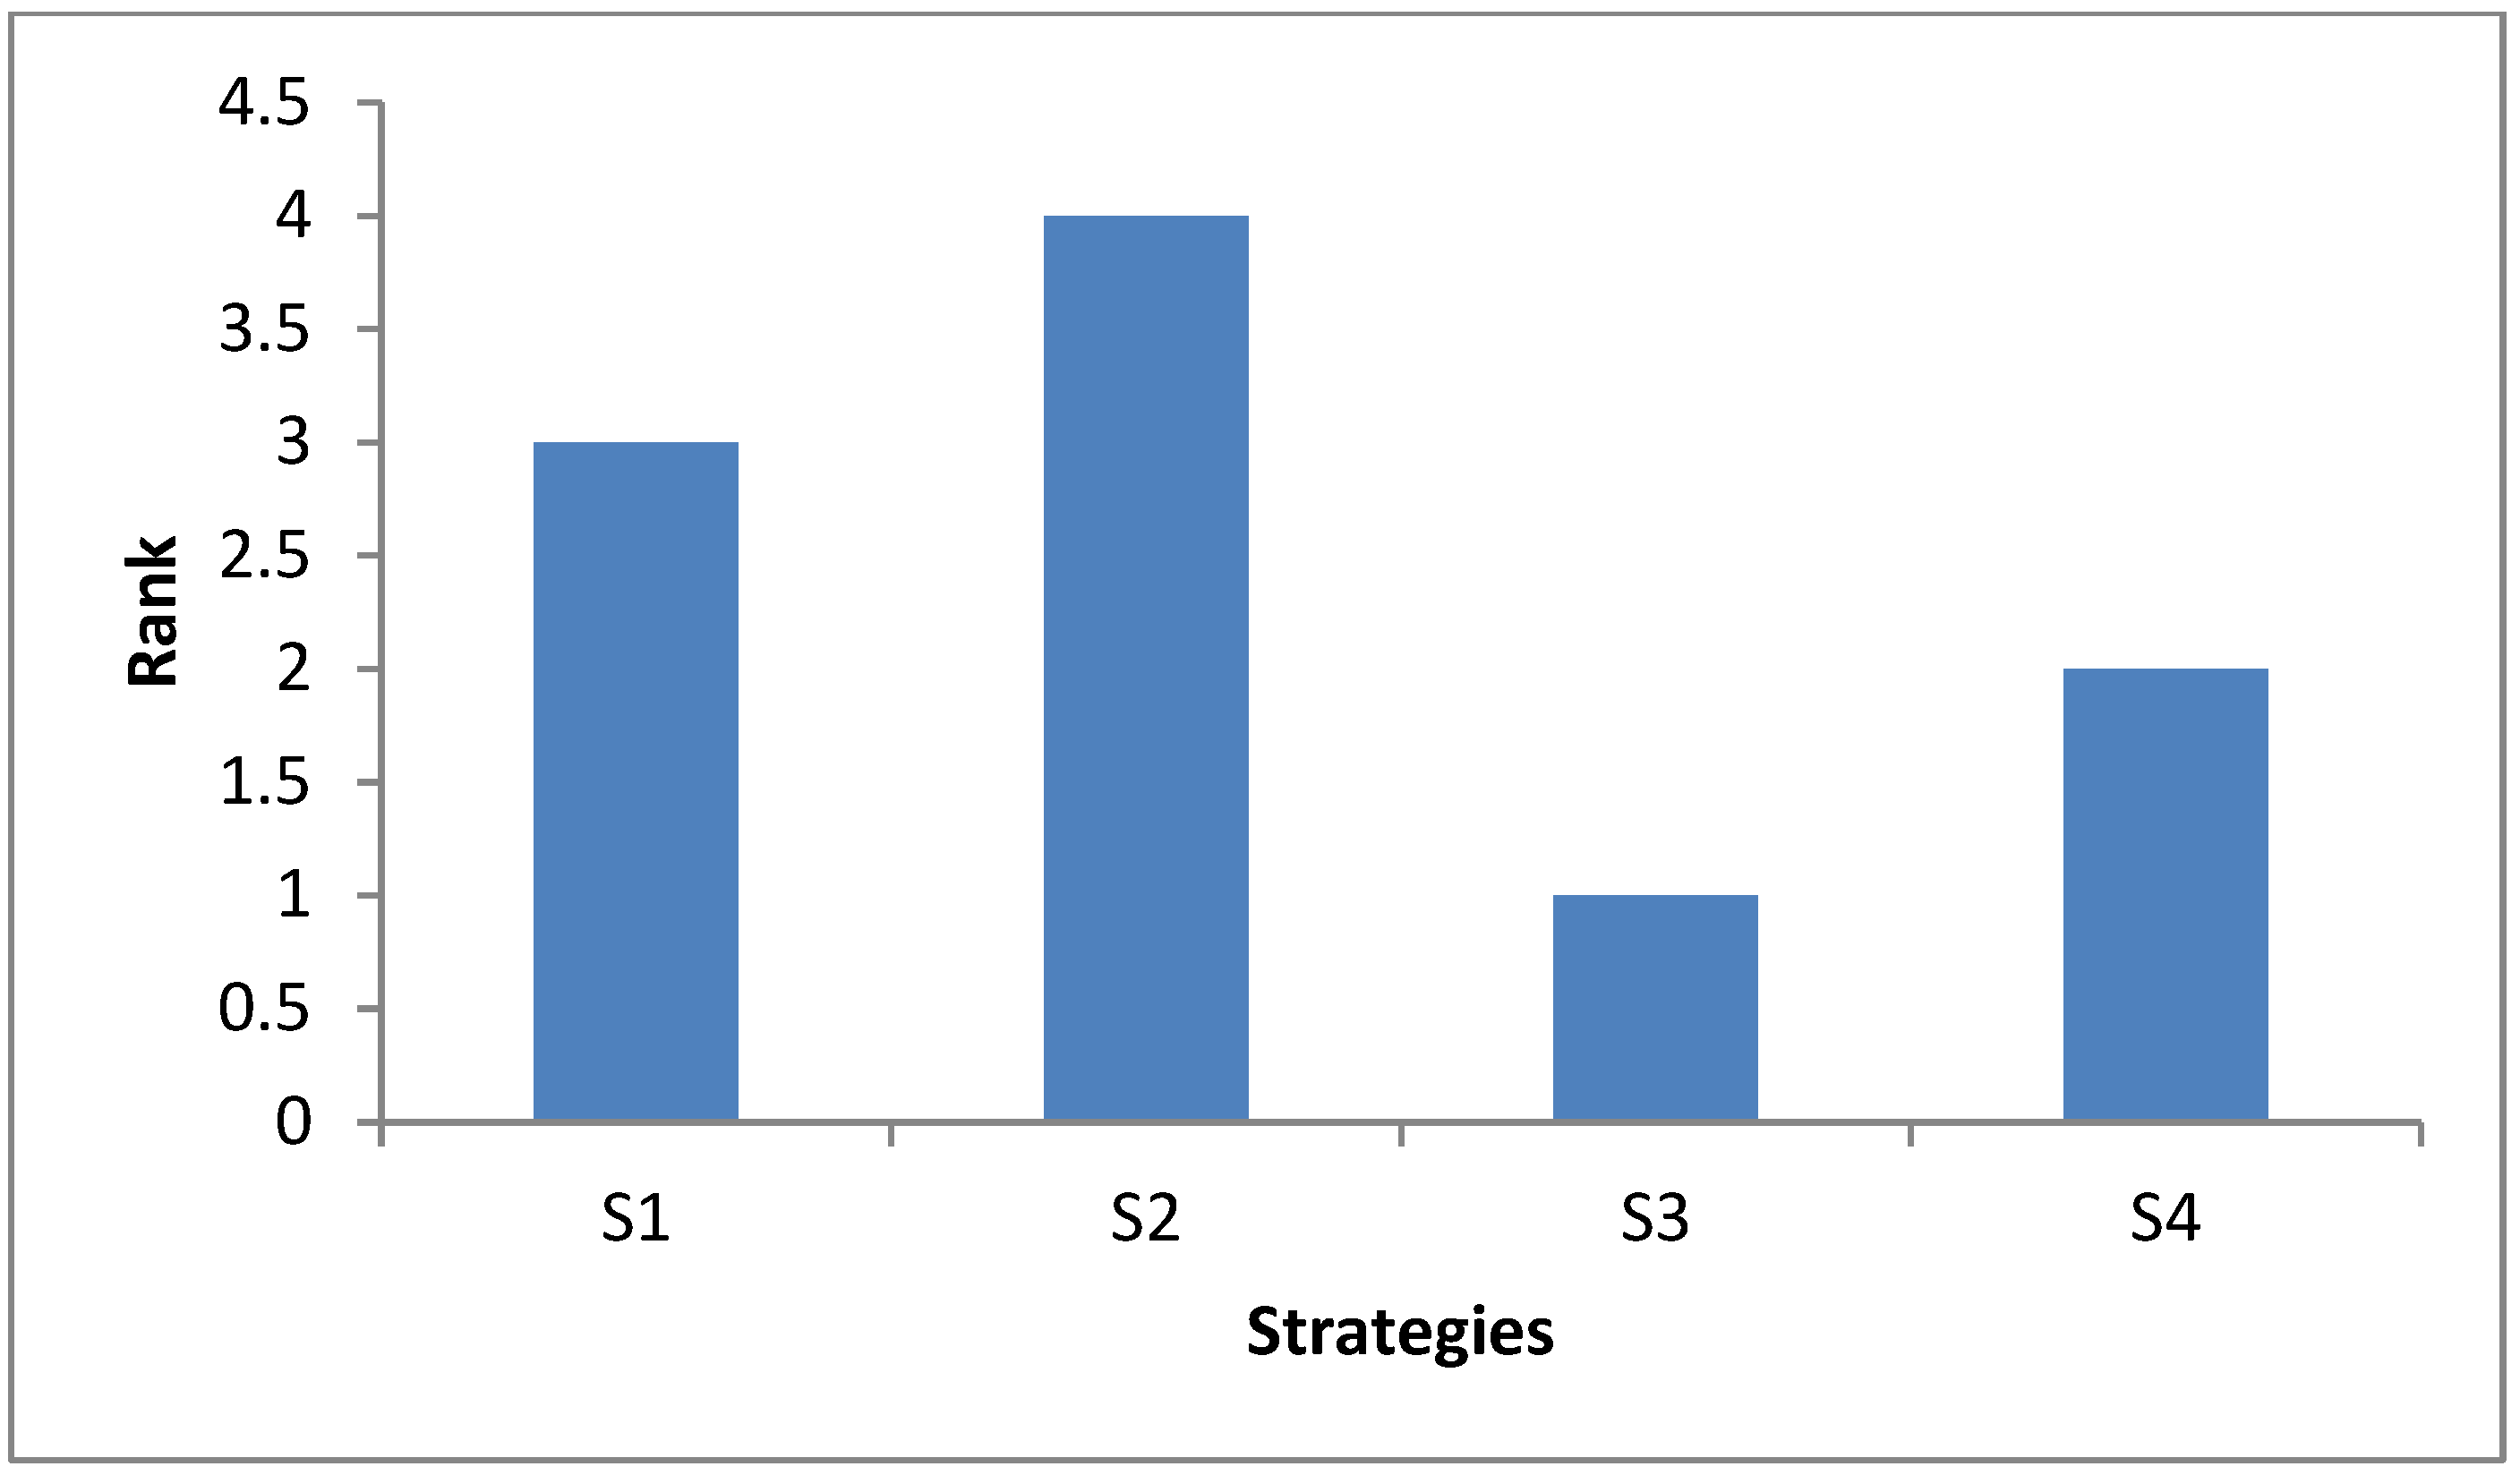
Figure 3.
Ranking of the strategies using economic requirements.
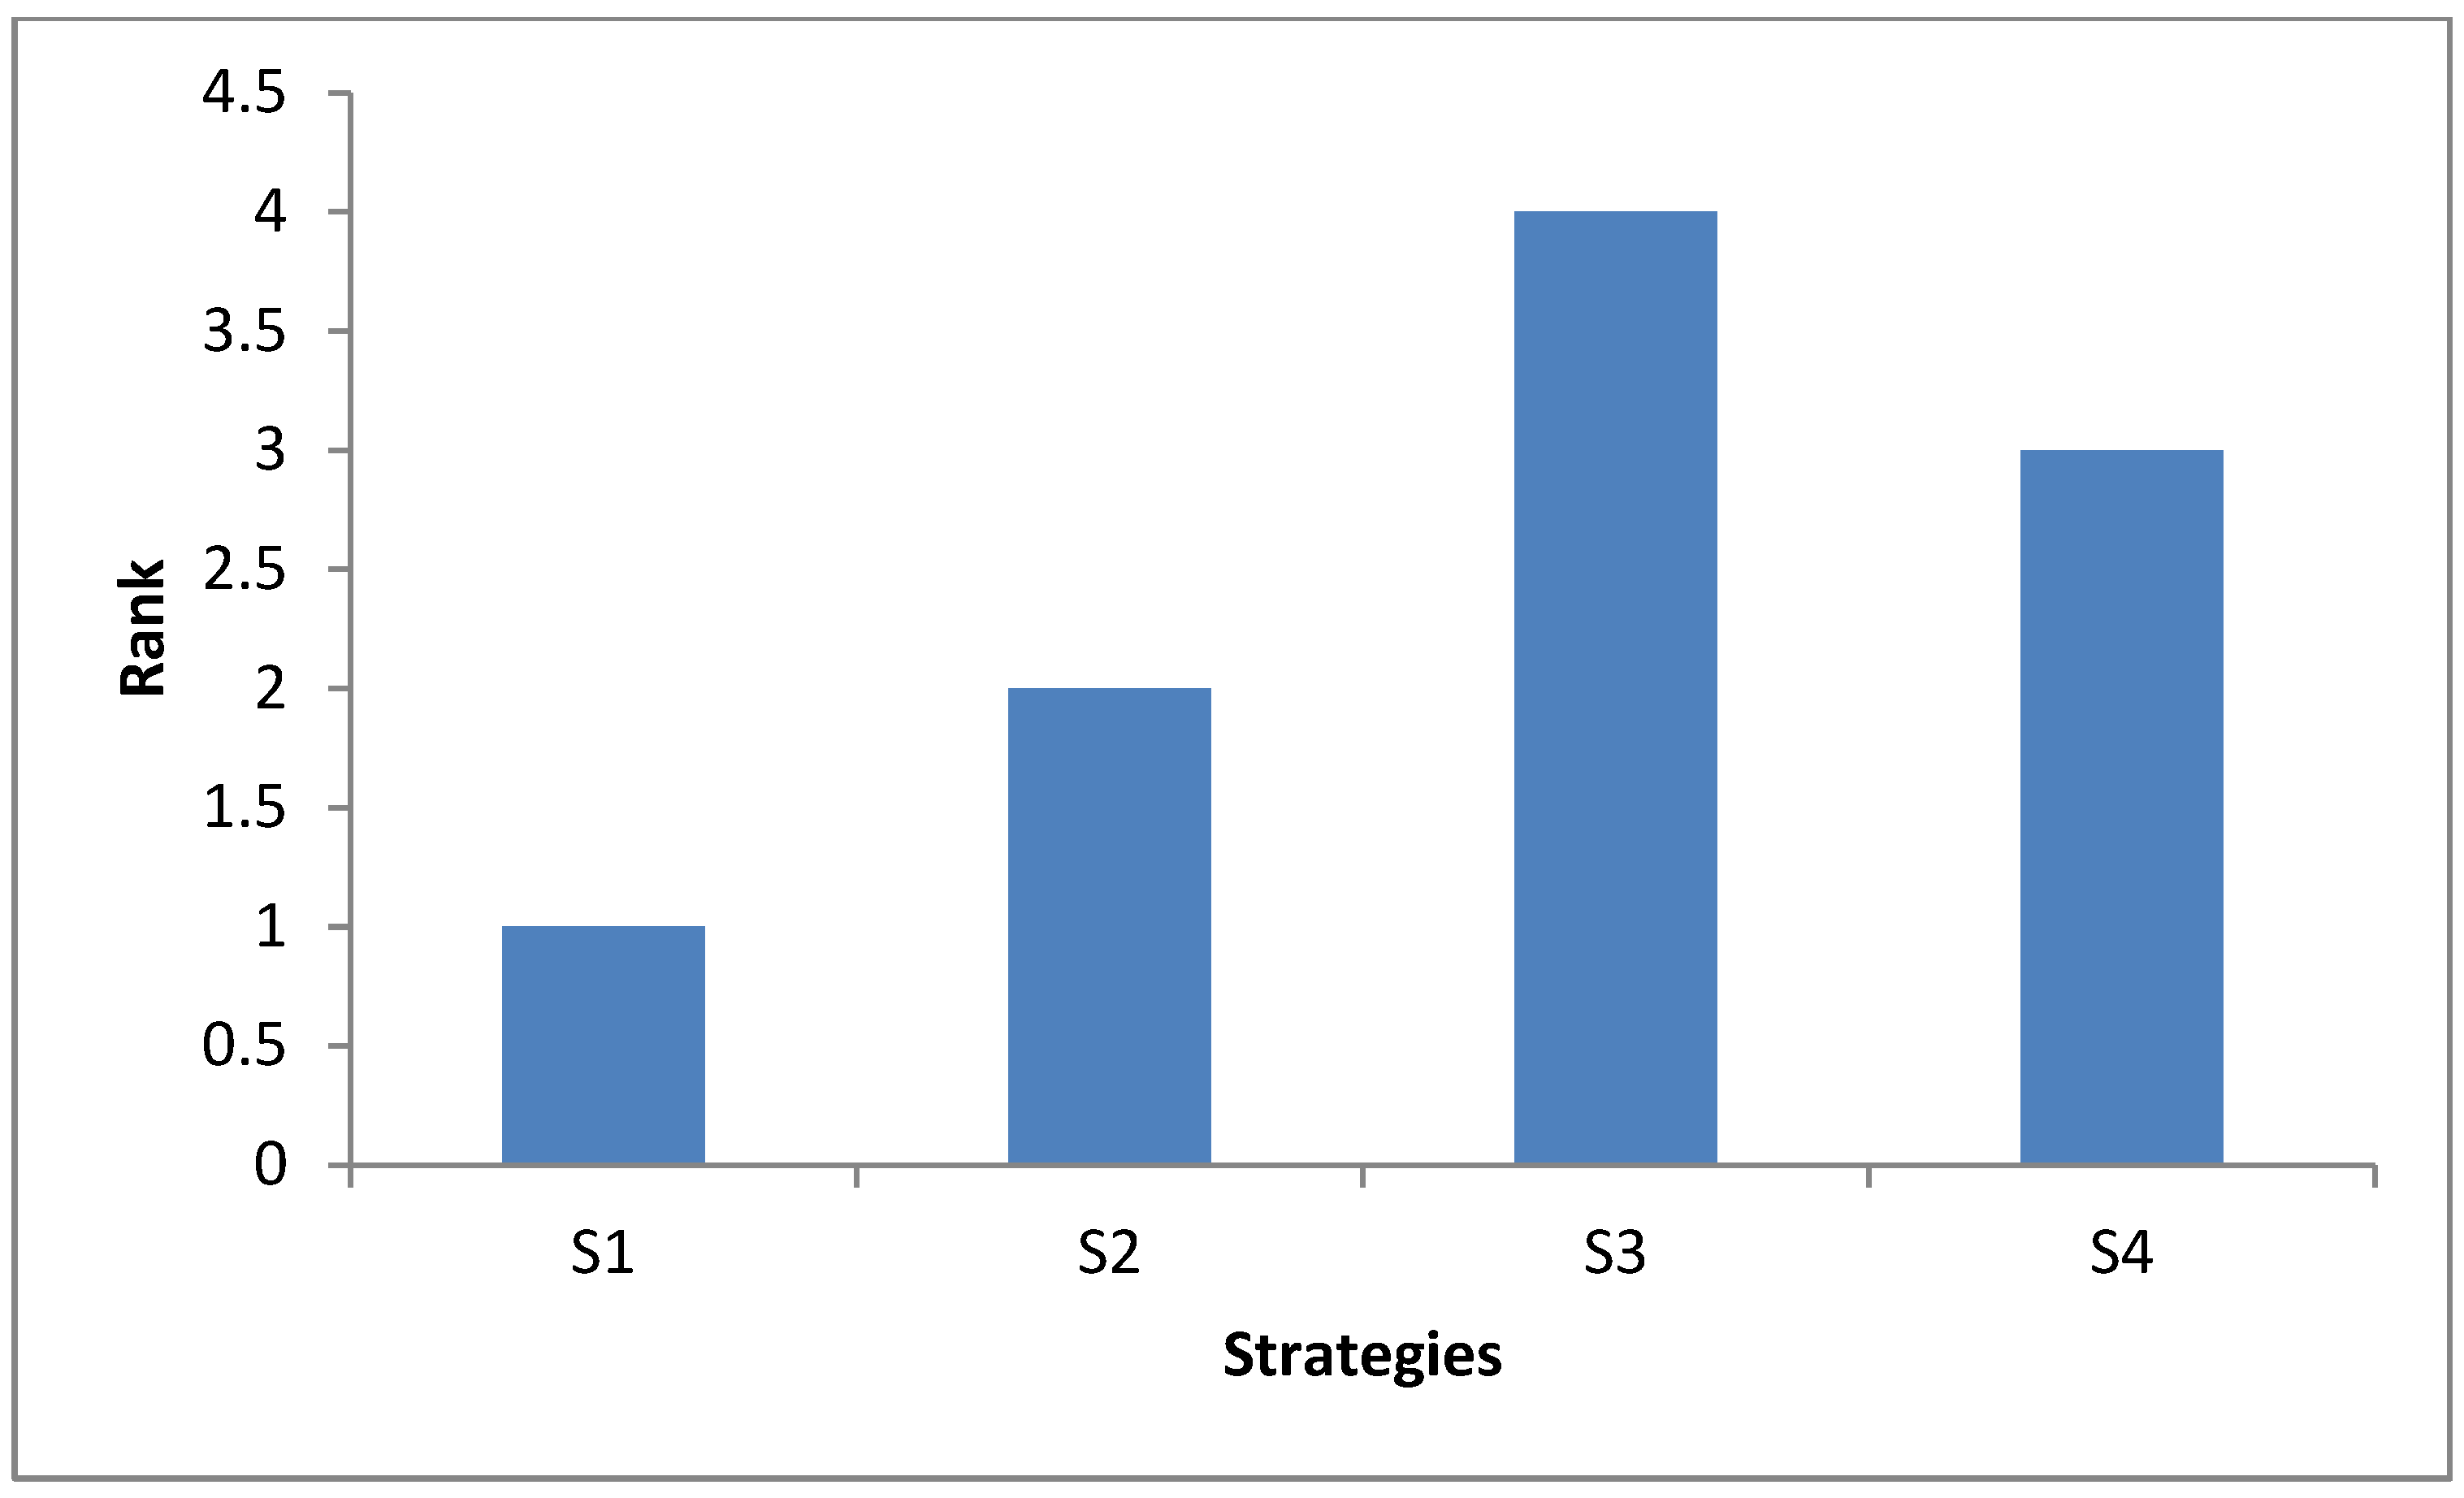
Figure 4.
Ranking of the strategies using social requirements.

Figure 5.
Ranking of the strategies using environmental requirements.
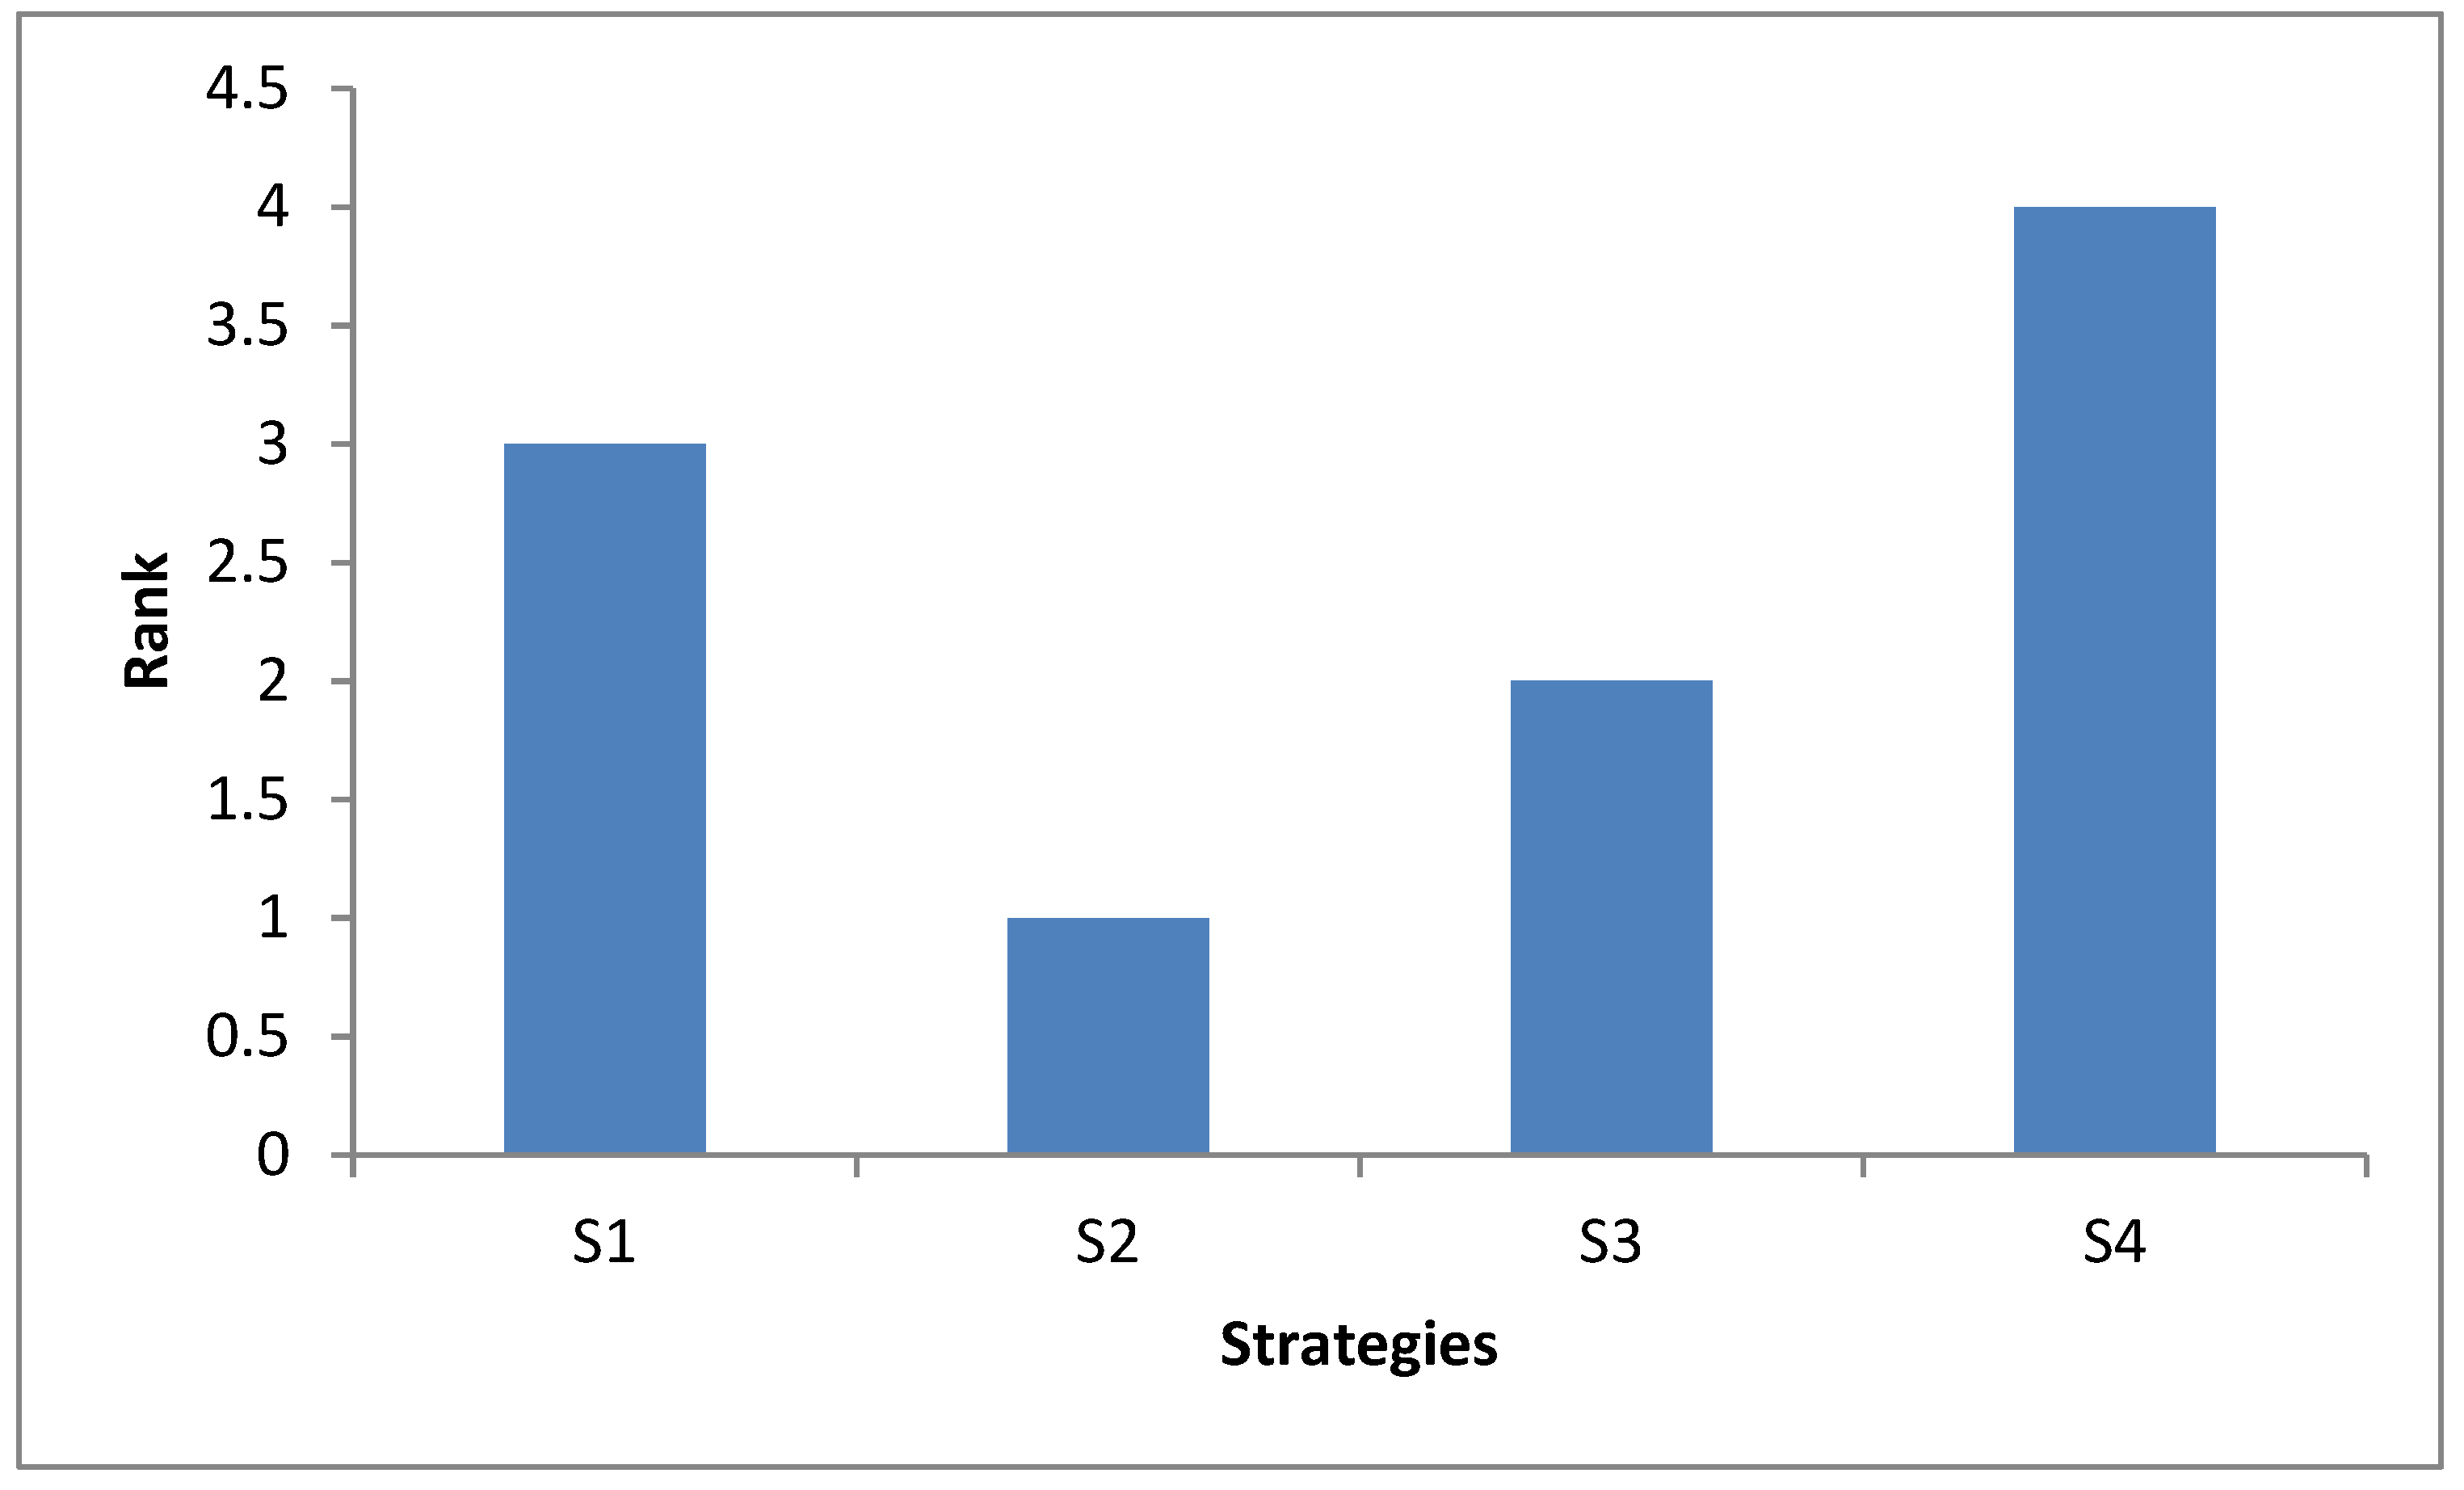
Figure 6.
Sustainability rating of the maintenance strategies.

Table 1.
Maintenance strategies.
| Strategy | Description |
|---|---|
| Periodic maintenance (S1) | Is a strategy that mandates routine maintenance to be carried out while the asset is in use at predetermined periods. |
| Meter-based maintenance (S2) | Is carried out as a result of a meter reading trigger. A meter counts the hours a piece of equipment has been in operation, the distance it has been driven, the number of parts produced, or an operational factor such as pressure or flow rate. |
| Predictive maintenance (S3) | Is based on the equipment’s condition rather than average or predicted life statistics. This strategy aims to directly monitor a machine when it is in normal operating condition to predict the breakdown before it occurs. |
| Prescriptive maintenance (S4) | It leverages the internet of things, machine learning, and artificial intelligence to provide detailed advice on maintaining equipment. It incorporates methods for making assumptions, testing and retesting data, and analysing historical data. |
Table 2.
Sustainability requirements.
| Technical Requirements | Economic Requirements |
|---|---|
| Equipment longevity (c11) | Labour cost (c21) |
| Equipment reliability (c12) | Overhead cost (c22) |
| Equipment availability (c13) | Outsourcing cost (c23) |
| Equipment efficiency (c14) | Materials cost (c24) |
| Service quality (c15) | Spare parts cost (c25) |
| Equipment reparability (c16) | Penalty cost (c26) |
| Social requirements | Environmental requirements |
| Occupants’ health and safety (c31) | Water pollution (c41) |
| Human traffic (c32) | Soil pollution (c42) |
| Job satisfaction (c33) | Air pollution (c43) |
| Employee development (c34) | Noise control (c44) |
| Vibration control (c45) |
Table 3.
Linguistic terms for the maintenance strategies.
| Linguistic Terms | Fuzzy Numbers |
|---|---|
| Very high (VH) | (0.75, 0.8); 0.9; (0.9, 0.9) |
| High (H) | (0.55, 0.6); 0.7; (0.8, 0.85) |
| Moderate (M) | (0.35, 0.4); 0.5; (0.6, 0.65) |
| Low (L) | (0.15, 0.2); 0.3; (0.4, 0.45) |
| Very low (VL) | (0.1, 0.1); 0.1; (0.2, 0.25) |
Table 4.
Linguistic terms for the sustainability criteria importance.
| Linguistic Terms | Fuzzy Numbers |
|---|---|
| Equally important (EI) | (0.75, 0.8); 0.9; (0.9, 0.9) |
| Moderately less important (MLI) | (0.55, 0.6); 0.7; (0.8, 0.85) |
| Less important (LI) | (0.35, 0.4); 0.5; (0.6, 0.65) |
| Very less important (VLI) | (0.15, 0.2); 0.3; (0.4, 0.45) |
| Much less important (MLI) | (0.1, 0.1); 0.1; (0.2, 0.25) |
Table 5.
Technical assessment of the criteria.
| Criterion | E1 | E2 | E3 | E4 | E5 | E6 |
|---|---|---|---|---|---|---|
| C11 | LI | MLI | VLI | EI | EI | EI |
| C12 | MLI | LI | VLI | LI | LI | EI |
| C13 | MLI | VLI | MLI | EI | LI | LI |
| C14 | MLI | VLI | LI | EI | MLI | EI |
| C15 | VLI | EI | EI | VLI | MLI | VLI |
| C16 | MLI | MLI | MLI | EI | MLI | MLI |
Table 6.
Technical requirement weights.
| Criterion | l | l’ | m | u’ | u |
|---|---|---|---|---|---|
| C11 | 0.3142 | 0.3292 | 0.3541 | 0.3755 | 0.3918 |
| C12 | 0.2349 | 0.2388 | 0.2424 | 0.2426 | 0.2470 |
| C13 | 0.1734 | 0.1713 | 0.1649 | 0.1588 | 0.1542 |
| C14 | 0.1250 | 0.1202 | 0.1099 | 0.1024 | 0.0949 |
| C15 | 0.0888 | 0.0825 | 0.0756 | 0.0709 | 0.0657 |
| C16 | 0.0636 | 0.0580 | 0.0532 | 0.0497 | 0.0463 |
Table 7.
Technical assessment of the maintenance strategies.
| Criterion | E1 | E2 | E3 | E4 | E5 | E6 | E1 | E2 | E3 | E4 | E5 | E6 |
|---|---|---|---|---|---|---|---|---|---|---|---|---|
| S1 | S2 | |||||||||||
| C11 | L | L | M | L | VH | M | L | M | H | VH | L | L |
| C12 | VH | L | VH | VH | H | L | L | H | H | L | H | L |
| C13 | H | H | H | L | VH | L | H | M | VH | VH | M | L |
| C14 | H | VH | VH | L | M | H | M | VH | VH | L | M | H |
| C15 | M | L | VH | VH | H | L | VH | L | H | VH | M | VH |
| C16 | VH | L | M | H | M | M | L | H | H | M | H | L |
| S3 | S4 | |||||||||||
| C11 | VH | VH | VH | H | L | M | H | VH | M | H | L | VH |
| C12 | VH | VH | L | H | VH | VH | M | VH | M | M | L | L |
| C13 | M | L | M | L | M | L | VH | H | H | M | L | M |
| C14 | H | H | M | VH | M | M | VH | L | VH | VH | L | L |
| C15 | L | L | VH | L | L | H | VH | H | VH | H | VH | M |
| C16 | M | L | M | H | H | H | L | H | VH | L | L | L |
Table 8.
Weighted normalised technical IF values.
| Criterion | S1 | S2 | S3 | S4 | S1 | S2 | S3 | S4 | ||
|---|---|---|---|---|---|---|---|---|---|---|
| C11 | 0.0489 | 0.0541 | 0.1082 | 0.1030 | 0.0594 | 0.0648 | 0.0971 | 0.1079 | ||
| C12 | 0.0569 | 0.0385 | 0.0871 | 0.0569 | 0.0634 | 0.0448 | 0.0746 | 0.0560 | ||
| C13 | l | 0.0404 | 0.0434 | 0.0341 | 0.0493 | l’ | 0.0443 | 0.0473 | 0.0266 | 0.0532 |
| C14 | 0.0289 | 0.0271 | 0.0312 | 0.0275 | 0.0305 | 0.0287 | 0.0287 | 0.0323 | ||
| C15 | 0.0179 | 0.0219 | 0.0158 | 0.0243 | 0.0185 | 0.0222 | 0.0135 | 0.0283 | ||
| C16 | 0.0145 | 0.0133 | 0.0164 | 0.0127 | 0.0148 | 0.0137 | 0.0148 | 0.0148 | ||
| C11 | 0.0708 | 0.0759 | 0.1062 | 0.1012 | ||||||
| C12 | 0.0664 | 0.0498 | 0.0764 | 0.0498 | ||||||
| C13 | m | 0.0443 | 0.0467 | 0.0295 | 0.0443 | |||||
| C14 | 0.0289 | 0.0275 | 0.0275 | 0.0260 | ||||||
| C15 | 0.0179 | 0.0209 | 0.0139 | 0.0229 | ||||||
| C16 | 0.0141 | 0.0133 | 0.0141 | 0.0116 | ||||||
| C11 | 0.0832 | 0.0832 | 0.1084 | 0.1008 | 0.0840 | 0.0888 | 0.1101 | 0.1089 | ||
| C12 | 0.0655 | 0.0479 | 0.0734 | 0.0559 | 0.0647 | 0.0567 | 0.0712 | 0.0545 | ||
| C13 | u’ | 0.0391 | 0.0447 | 0.0336 | 0.0414 | u | 0.0409 | 0.0414 | 0.0310 | 0.0409 |
| C14 | 0.0259 | 0.0259 | 0.0253 | 0.0253 | 0.0248 | 0.0237 | 0.0245 | 0.0218 | ||
| C15 | 0.0172 | 0.0194 | 0.0140 | 0.0203 | 0.0158 | 0.0175 | 0.0134 | 0.0190 | ||
| C16 | 0.0137 | 0.0119 | 0.0126 | 0.0115 | 0.0119 | 0.0118 | 0.0124 | 0.0102 |
Table 9.
Economic assessment for the criteria.
| Criterion | E1 | E2 | E3 | E4 | E5 | E6 |
|---|---|---|---|---|---|---|
| C21 | MLI | EI | VLI | EI | MLI | VLI |
| C22 | LI | MLI | MLI | VLI | EI | EI |
| C23 | MLI | EI | EI | VLI | EI | VLI |
| C24 | LI | VLI | MLI | MLI | LI | LI |
| C25 | LI | MLI | EI | VLI | EI | EI |
| C26 | EI | EI | MLI | LI | EI | LI |
Table 10.
Economic requirement weights.
| Criterion | l | l’ | m | u’ | U |
|---|---|---|---|---|---|
| C21 | 0.3159 | 0.3288 | 0.3495 | 0.3728 | 0.3839 |
| C22 | 0.2337 | 0.2381 | 0.2428 | 0.2466 | 0.2481 |
| C23 | 0.1655 | 0.1640 | 0.1586 | 0.1549 | 0.1530 |
| C24 | 0.1352 | 0.1308 | 0.1209 | 0.1097 | 0.1046 |
| C25 | 0.0908 | 0.0850 | 0.0787 | 0.0713 | 0.0679 |
| C26 | 0.0589 | 0.0534 | 0.0495 | 0.0447 | 0.0426 |
Table 11.
Economic assessment of the maintenance strategies.
| Criterion | E1 | E2 | E3 | E4 | E5 | E6 | E1 | E2 | E3 | E4 | E5 | E6 |
|---|---|---|---|---|---|---|---|---|---|---|---|---|
| S1 | S2 | |||||||||||
| C21 | M | VH | M | VH | VH | M | H | H | H | VH | VH | H |
| C22 | L | M | VH | M | VH | VH | VH | M | L | VH | VH | H |
| C23 | M | L | H | H | VH | H | VH | M | H | VH | L | VH |
| C24 | M | L | M | VH | H | M | L | H | H | L | VH | M |
| C25 | H | H | M | VH | L | H | L | L | H | L | H | L |
| C26 | VH | VH | H | VH | H | VH | M | VH | M | H | M | VH |
| S3 | S4 | |||||||||||
| C21 | VH | L | L | VH | VH | H | VH | L | VH | M | M | H |
| C22 | H | VH | M | H | VH | M | M | M | VH | H | M | H |
| C23 | VH | H | H | M | H | L | H | L | H | VH | H | H |
| C24 | VH | H | VH | H | VH | L | M | VH | M | H | M | M |
| C25 | H | H | L | M | H | H | VH | L | VH | VH | H | VH |
| C26 | M | M | M | VH | VH | M | H | VH | M | L | M | H |
Table 12.
Weighted normalised values for the economic requirements.
| Criterion | S1 | S2 | S3 | S4 | S1 | S2 | S3 | S4 | ||
|---|---|---|---|---|---|---|---|---|---|---|
| C21 | 0.0881 | 0.0786 | 0.0727 | 0.0765 | 0.0842 | 0.0758 | 0.0891 | 0.0797 | ||
| C22 | 0.0669 | 0.0628 | 0.0513 | 0.0576 | 0.0629 | 0.0594 | 0.0594 | 0.0563 | ||
| C23 | l | 0.0492 | 0.0432 | 0.0359 | 0.0334 | l’ | 0.0445 | 0.0395 | 0.0445 | 0.0356 |
| C24 | 0.0414 | 0.0414 | 0.0210 | 0.0233 | 0.0372 | 0.0372 | 0.0274 | 0.0289 | ||
| C25 | 0.0219 | 0.0374 | 0.0153 | 0.0108 | 0.0195 | 0.0312 | 0.0208 | 0.0136 | ||
| C26 | 0.0130 | 0.0171 | 0.0118 | 0.0112 | 0.0109 | 0.0141 | 0.0150 | 0.0133 | ||
| C21 | 0.0859 | 0.0784 | 0.0902 | 0.0950 | ||||||
| C22 | 0.0614 | 0.0584 | 0.0584 | 0.0646 | ||||||
| C23 | m | 0.0411 | 0.0372 | 0.0411 | 0.0391 | |||||
| C24 | 0.0325 | 0.0325 | 0.0251 | 0.0307 | ||||||
| C25 | 0.0181 | 0.0265 | 0.0191 | 0.0150 | ||||||
| C26 | 0.0100 | 0.0125 | 0.0131 | 0.0139 | ||||||
| C21 | 0.0868 | 0.0930 | 0.0953 | 0.0977 | 0.0961 | 0.0859 | 0.1004 | 0.1015 | ||
| C22 | 0.0598 | 0.0598 | 0.0612 | 0.0659 | u | 0.0642 | 0.0615 | 0.0595 | 0.0628 | |
| C23 | u’ | 0.0401 | 0.0345 | 0.0401 | 0.0401 | 0.0389 | 0.0380 | 0.0389 | 0.0372 | |
| C24 | 0.0284 | 0.0300 | 0.0244 | 0.0269 | 0.0274 | 0.0274 | 0.0235 | 0.0262 | ||
| C25 | 0.0169 | 0.0223 | 0.0184 | 0.0136 | 0.0160 | 0.0208 | 0.0162 | 0.0149 | ||
| C26 | 0.0098 | 0.0112 | 0.0112 | 0.0127 | 0.0093 | 0.0107 | 0.0112 | 0.0113 |
Table 13.
Social assessment of the requirements.
| Criterion | E1 | E2 | E3 | E4 | E5 | E6 |
|---|---|---|---|---|---|---|
| C31 | VLI | MLI | EI | MLI | EI | LI |
| C32 | LI | LI | VLI | LI | LI | MLI |
| C33 | EI | VLI | LI | MLI | MLI | MLI |
| C34 | MLI | MLI | LI | LI | MLI | EI |
Table 14.
Social requirement weights.
| Criterion | l | l’ | m | u’ | u |
|---|---|---|---|---|---|
| C31 | 1.0826 | 1.1192 | 0.3964 | 0.4175 | 0.4372 |
| C32 | 0.8049 | 0.8025 | 0.2654 | 0.2670 | 0.2659 |
| C33 | 0.6510 | 0.6381 | 0.2044 | 0.1925 | 0.1854 |
| C34 | 0.4615 | 0.4402 | 0.1338 | 0.1231 | 0.1116 |
Table 15.
ITF for the social requirements.
| Criterion | E1 | E2 | E3 | E4 | E5 | E6 |
|---|---|---|---|---|---|---|
| C31 | VLI | MLI | EI | MLI | EI | LI |
| C32 | LI | LI | VLI | LI | LI | MLI |
| C33 | EI | VLI | LI | MLI | MLI | MLI |
| C34 | MLI | MLI | LI | LI | MLI | EI |
Table 16.
Weighted normalised social IF values.
| Criterion | S1 | S2 | S3 | S4 | S1 | S2 | S3 | S4 | ||
|---|---|---|---|---|---|---|---|---|---|---|
| C31 | 0.2760 | 0.2760 | 0.2654 | 0.2654 | 0.2500 | 0.2500 | 0.3500 | 0.2692 | ||
| C32 | l | 0.2071 | 0.2224 | 0.1251 | 0.2502 | l’ | 0.1928 | 0.2057 | 0.1469 | 0.2571 |
| C33 | 0.1708 | 0.1501 | 0.1238 | 0.2063 | 0.1533 | 0.1362 | 0.1442 | 0.2044 | ||
| C34 | 0.1137 | 0.1064 | 0.0916 | 0.1499 | 0.0986 | 0.0928 | 0.1052 | 0.1435 | ||
| C31 | 0.0859 | 0.0859 | 0.1123 | 0.1123 | ||||||
| C32 | m | 0.0599 | 0.0632 | 0.0474 | 0.0948 | |||||
| C33 | 0.0461 | 0.0417 | 0.0438 | 0.0729 | ||||||
| C34 | 0.0283 | 0.0269 | 0.0298 | 0.0488 | ||||||
| C31 | 0.0888 | 0.0939 | 0.1174 | 0.1174 | u | 0.1000 | 0.1000 | 0.1186 | 0.1186 | |
| C32 | u’ | 0.0648 | 0.0631 | 0.0533 | 0.0857 | 0.0614 | 0.0665 | 0.0532 | 0.0847 | |
| C33 | 0.0431 | 0.0401 | 0.0431 | 0.0663 | 0.0438 | 0.0414 | 0.0419 | 0.0583 | ||
| C34 | 0.0290 | 0.0268 | 0.0290 | 0.0383 | 0.0248 | 0.0245 | 0.0259 | 0.0364 |
Table 17.
Environmental assessment for the criteria.
| Criterion | E1 | E2 | E3 | E4 | E5 | E6 |
|---|---|---|---|---|---|---|
| C41 | MLI | VLI | MLI | LI | MLI | EI |
| C42 | EI | EI | MLI | VLI | EI | MLI |
| C43 | MLI | VLI | MLI | MLI | MLI | MLI |
| C44 | VLI | VLI | EI | MLI | LI | EI |
| C45 | EI | LI | LI | LI | VLI | MLI |
Table 18.
Environmental requirement weights.
| Criterion | l | l’ | m | u’ | u |
|---|---|---|---|---|---|
| C41 | 0.3221 | 0.3320 | 0.3488 | 0.3712 | 0.4005 |
| C42 | 0.2310 | 0.2332 | 0.2353 | 0.2398 | 0.2590 |
| C43 | 0.1956 | 0.1950 | 0.1922 | 0.1850 | 0.1599 |
| C44 | 0.1463 | 0.1417 | 0.1322 | 0.1205 | 0.1094 |
| C45 | 0.1050 | 0.0981 | 0.0916 | 0.0835 | 0.0712 |
Table 19.
Environmental assessment for the maintenance strategies.
| Criterion | E1 | E2 | E3 | E4 | E5 | E6 | E1 | E2 | E3 | E4 | E5 | E6 |
|---|---|---|---|---|---|---|---|---|---|---|---|---|
| S1 | S2 | |||||||||||
| C41 | VH | H | H | M | L | VH | VH | M | M | M | VH | M |
| C42 | H | M | H | H | H | VH | M | H | L | L | L | H |
| C43 | L | VH | VH | VH | M | M | L | M | M | M | VH | L |
| C44 | M | L | M | VH | VH | H | L | L | L | VH | L | H |
| C45 | H | H | H | M | M | L | VH | VH | L | L | L | H |
| S3 | S4 | |||||||||||
| C41 | H | M | L | H | M | L | L | L | VH | H | VH | VH |
| C42 | VH | H | H | H | L | L | VH | L | VH | H | H | M |
| C43 | M | VH | VH | L | M | VH | H | M | VH | L | VH | M |
| C44 | H | H | H | L | VH | L | VH | L | H | M | L | VH |
| C45 | M | VH | L | H | H | L | L | L | M | M | M | M |
Table 20.
Weighted normalised environmental IF values for the strategies.
| Criterion | S1 | S2 | S3 | S4 | S1 | S2 | S3 | S4 | ||
|---|---|---|---|---|---|---|---|---|---|---|
| C41 | 0.0831 | 0.0888 | 0.0858 | 0.0644 | 0.0767 | 0.0815 | 0.1087 | 0.0652 | ||
| C42 | 0.0516 | 0.0896 | 0.0473 | 0.0426 | 0.0492 | 0.0806 | 0.0591 | 0.0443 | ||
| C43 | l | 0.0481 | 0.0710 | 0.0373 | 0.0392 | l’ | 0.0452 | 0.0641 | 0.0452 | 0.0405 |
| C44 | 0.0354 | 0.0540 | 0.0285 | 0.0285 | 0.0321 | 0.0467 | 0.0343 | 0.0286 | ||
| C45 | 0.0284 | 0.0284 | 0.0209 | 0.0273 | 0.0241 | 0.0241 | 0.0241 | 0.0259 | ||
| C41 | 0.0795 | 0.0837 | 0.1060 | 0.0795 | ||||||
| C42 | 0.0499 | 0.0748 | 0.0582 | 0.0524 | ||||||
| C43 | m | 0.0438 | 0.0584 | 0.0438 | 0.0461 | |||||
| C44 | 0.0296 | 0.0401 | 0.0312 | 0.0312 | ||||||
| C45 | 0.0213 | 0.0213 | 0.0213 | 0.0278 | ||||||
| C41 | 0.0888 | 0.0846 | 0.1110 | 0.0867 | 0.0940 | 0.0983 | 0.1109 | 0.0972 | ||
| C42 | 0.0546 | 0.0710 | 0.0609 | 0.0533 | 0.0569 | 0.0761 | 0.0647 | 0.0612 | ||
| C43 | u’ | 0.0430 | 0.0528 | 0.0430 | 0.0462 | u | 0.0381 | 0.0452 | 0.0381 | 0.0385 |
| C44 | 0.0269 | 0.0347 | 0.0307 | 0.0283 | 0.0255 | 0.0316 | 0.0258 | 0.0267 | ||
| C45 | 0.0210 | 0.0198 | 0.0204 | 0.0223 | 0.0164 | 0.0176 | 0.0170 | 0.0202 |
Table 21.
GRA data.
| Criterion | S1 | S2 | S3 | S4 |
|---|---|---|---|---|
| Technical (C1) | 0.1706 | 0.1652 | 0.1922 | 0.1898 |
| Economic (C2) | 0.1827 | 0.1814 | 0.1768 | 0.1776 |
| Social (C3) | 0.2619 | 0.2594 | 0.2617 | 0.3369 |
| Environmental (C4) | 0.1661 | 0.2032 | 0.1855 | 0.1653 |
Table 22.
Criteria importance.
| Criterion | Importance |
|---|---|
| C1 | 0.3841 |
| C2 | 0.2778 |
| C3 | 0.1970 |
| C4 | 0.1411 |
Publisher’s Note: MDPI stays neutral with regard to jurisdictional claims in published maps and institutional affiliations. |
© 2022 by the author. Licensee MDPI, Basel, Switzerland. This article is an open access article distributed under the terms and conditions of the Creative Commons Attribution (CC BY) license (https://creativecommons.org/licenses/by/4.0/).
Share and Cite
MDPI and ACS Style
Ighravwe, D.E. Assessment of Sustainable Maintenance Strategy for Manufacturing Industry. Sustainability 2022, 14, 13850. https://doi.org/10.3390/su142113850
AMA Style
Ighravwe DE. Assessment of Sustainable Maintenance Strategy for Manufacturing Industry. Sustainability. 2022; 14(21):13850. https://doi.org/10.3390/su142113850
Chicago/Turabian StyleIghravwe, Desmond Eseoghene. 2022. "Assessment of Sustainable Maintenance Strategy for Manufacturing Industry" Sustainability 14, no. 21: 13850. https://doi.org/10.3390/su142113850
Note that from the first issue of 2016, this journal uses article numbers instead of page numbers. See further details here.