Article

A Low-Carbon Land Use Management Framework Based on Urban Carbon Metabolism: A Case of a Typical Coal Resource-Based City in China

1
College of Geography and Environmental Science, Northwest Normal University, Lanzhou 730070, China
2
College of Earth and Environmental Sciences, Lanzhou University, Lanzhou 730000, China
3
College of Economics, Northwest Normal University, Lanzhou 730070, China
*
Author to whom correspondence should be addressed.
Sustainability 2022, 14(21), 13854; https://doi.org/10.3390/su142113854
Submission received: 3 October 2022 / Revised: 15 October 2022 / Accepted: 20 October 2022 / Published: 25 October 2022
(This article belongs to the Special Issue Urban Planning and Sustainable Land Use)

Abstract

:
It is of great significance to study urban carbon metabolism and explore the low-carbon land use management framework from the perspective of “ecological-production-living” space, an important means for the government to strengthen spatial regulation. In the study, first of all, a carbon metabolism network model was established based on the evolution of the “ecological-production-living” space. Secondly, an ecological network analysis (ENA) method was used to identify the ecological relationships between land use types under the effect of carbon metabolism. In addition, ArcGIS software was used to visualize the spatial distribution of carbon flow and ecological relationships. Finally, a low-carbon oriented land use management framework was proposed based on the above research. Yulin, a typical coal resource-based city in China, was taken as a case study for verification. The results showed that Yulin had net carbon emissions from 2010 to 2020, indicating that the evolution of “ecological-production-living” space had a negative impact on the carbon metabolism. Industrial, mining and transportation land dominated carbon emissions, while forestland played an important role in carbon sequestration. Under the effect of carbon metabolism, a controlling and exploitative relationship was the main ecological relationship, and a mutualism relationship accounted for the smallest proportion, indicating that the urban ecological conflict was obvious in the evolution of the “ecological-production-living” space. Based on the above research, a land use management framework was proposed, which divided urban space into six types of control units. In conclusion, the results provided experience for other coal resource-based cities to promote low-carbon and sustainable land use.

1. Introduction

Global climate change caused by increasing carbon emissions has become the focus of attention. Studies have shown that urban areas account for 75% of global carbon dioxide emissions (the Intergovernmental Panel on Climate Change, IPCC, 2006). The increase in urban carbon emissions is mainly due to the expansion of economic scale [1]. Large-scale urbanization caused by economic growth further stimulates energy consumption and land use and land cover change (LUCC) [2,3], which profoundly affects the urban carbon metabolism system. LUCC caused by urbanization is usually characterized by the transition of carbon sink land (e.g., forestland and grassland) to carbon source land (e.g., industrial, mining, and transportation land) [4,5]. Studies have shown that carbon emissions generated by such LUCC account for one third of urban carbon emissions [6]. Therefore, countries worldwide have attempted to optimize the urban carbon metabolism system through adjustments of land use management measures, which has become a strategy to promote low-carbon development and realize sustainable urbanization [7,8]. “Ecological-production-living” space is the general term for an ecological space, production space and living space. Ecological space refers to the geographical space that has an ecological protection function and can provide ecological products and ecological services [9]. Production space refers to a specific functional area where people engage in production activities [10]. Living space refers to the territorial space for people to live, consume, relax and entertain [11]. The 18th Party Congress of the Communist Party of China [12], held in November 2012, is a very important congress held at the decisive stage of building a moderately prosperous society in all respects. The theme of the report is to unswervingly advance along the path of socialism with Chinese characteristics and strive to finish building a moderately prosperous society in all respects. The report made the first summary of the development essentials of “ecological-production-living” space from a strategic perspective, namely “intensive and efficient production space, livable and comfortable living space, and beautiful ecological space”. The method of spatial division coincides with the “three pillars” concept of sustainable development: environment, society and economy widely recognized at home and abroad [13]. The sustainable development of the city is based on the sustainable development of “ecological-production-living” space. As a development goal, “ecological-production-living” space has important guiding significance to the urban land layout. Therefore, the analysis of urban carbon metabolism and the discussion of the land use management framework from the perspective of “ecological-production-living” space are helpful for urban low-carbon and sustainable development.
Urban carbon metabolism refers to the flow of carbon between the biosphere, atmosphere and artificial components of the urban system, including carbon emissions from the biosphere to the atmosphere, carbon sequestration from the atmosphere to the biosphere, and carbon transition through LUCC [14]. The balance between these processes determines whether cities function as carbon sources or sinks.
At present, the content of the research on urban carbon metabolism can be summarized into two aspects. On the one hand, the estimation of carbon emissions and carbon sequestration is the basis of carbon metabolism research [15,16]. When estimating carbon emissions, most studies were based on 2006 IPCC Guidelines for National Greenhouse Gas inventories. For example, Liang et al. [17] calculated energy-based CO2 emissions by the IPCC carbon emissions coefficient method, covering 30 provinces in China. Cellura et al. [18] used the IPCC and the Life Cycle Assessment (LCA) approach to estimate the energy-related greenhouse gas (GHG) balance for Italian cities. However, for the case study of China, the Guidelines for Compiling Provincial GHG Inventories issued by China’s National Development and Reform Commission in 2011 may be more suitable, as the emission factors provided in the guideline are obtained by measuring carbon emissions in some Chinese cities, which is more in line with China’s national conditions. For example, Ma et al. [19] used the emission factors in the guideline to measure the carbon emissions of Yantai, China. When estimating carbon sinks, researchers mainly used the carbon sink coefficient method to calculate the carbon sinks of carbon sink land (such as woodland, grassland, water, etc.). For example, Kong et al. [20] estimated carbon emissions and sequestration of urban turfgrass systems in Hong Kong. Escobedo et al. [21] analyzed the efficacy of subtropical urban forests in offsetting carbon emissions from cities. On the other hand, analyzing and simulating the carbon metabolism process from the perspective of “network” has gradually become an emerging research direction. In the early stage, some scholars constructed a carbon metabolic network model with socioeconomic sectors as metabolic compartments, aiming to provide suggestions for carbon emission reduction in various industries of the city [22]. With the deepening influence of LUCC on urban carbon emissions, the research on the carbon metabolism network based on land conversion with land use types as metabolic compartments has been gradually carried out [23]. Ecological network analysis (ENA) method was widely used in the analysis of the carbon metabolic network. The reason is that the method can not only quantitatively identify the key nodes and paths that affect the urban metabolic system, but also quantitatively analyze the ecological relationships among components, which can provide information for urban low-carbon construction [24]. For example, Chen et al. [25] took Dongguan as a case study, established a carbon metabolism network model including 42 socio-economic sectors based on the input-output table, and combined with the ENA method to reveal the main contributors and action paths of carbon emissions in all social sectors. The results showed that the total direct and embodied carbon flows were mainly concentrated in the manufacturing industry. Zhang et al. [26] took Beijing as an example, constructed a carbon metabolism model based on LUCC, and used the ENA method to analyze the structure and function of the network, as well as the ecological relationship between components. The results showed that carbon throughflow of the network decreased and positive relations mostly outweighed negative relations.
The research objects of urban carbon metabolism were mainly cities that do not rely on resources and less coal resource-based cities [27,28]. In 2013, the Chinese State Council issued the Sustainable Development Plan for National Resource-based Cities (2013–2020), which clearly points out that resource-based cities are cities with mining and processing of natural resources such as minerals and forests as the leading industries. A coal resource-based city refers to the city with mining and processing of local coal resources as the leading industry. Coal resource-based cities are a kind of special city in the world, mainly distributed in the United States, Russia, Australia, China and other countries with rich coal resources. There are 58 coal resource-based cities in China, accounting for 61% of the number of mining cities. Coal resource-based cities play an important role in China’s economic development, but most of them have an extensive economic development mode, large energy consumption and arduous low-carbon construction task. Therefore, they are the main undertakers to achieve the goal of “carbon peaking and carbon neutrality”.
In general, the research on urban carbon metabolism has achieved rich results, which have an important reference for this paper, but there are still the following shortcomings: (1) The carbon emission accounting list was not comprehensive enough, especially for farmland and industrial land; (2) As a new target of land use layout at the present stage, few studies studied carbon metabolism from the perspective of “ecological-production-living” space, which cannot fully meet the needs of decision makers for land use management practices; (3) The spatial characteristics of the carbon metabolism network were not sufficiently described; (4) It provided policy suggestions at the macro level, but did not provide a land use management framework from the practical level; (5) Lack of attention to coal resource-based cities, an important carrier of carbon emission reduction.
Therefore, from the perspective of “ecological-production-living” space, the study constructed a carbon metabolism network based on a comprehensive carbon emissions and carbon sinks accounting system and LUCC. Then, the ENA method was used to identify the ecological relationships between components under the effect of carbon metabolism. Additionally, ArcGIS software was used to analyze the spatial characteristics of carbon flow and ecological relationships. Finally, a low-carbon land use management framework based on carbon metabolism was proposed. Figure 1 shows the technical route of the paper. Taking Yulin, a typical coal resource-based city, as an example, the above technical thinking was verified to form a complete and propagable technical system. The following aspects are solved: (1) What is the comprehensive impact of LUCC on urban carbon metabolism? What is the direction and spatial distribution of carbon transfer induced by LUCC? What are the key nodes and paths associated with net carbon emissions? (2) What is the ecological relationship between land use types under the effect of carbon metabolism and its distribution characteristics? (3) How do we construct the land use management framework based on carbon metabolism? The purpose of the study is to provide a scientific basis for the technical path of sustainable land use management in coal resource-based cities.

2. Materials and Methods
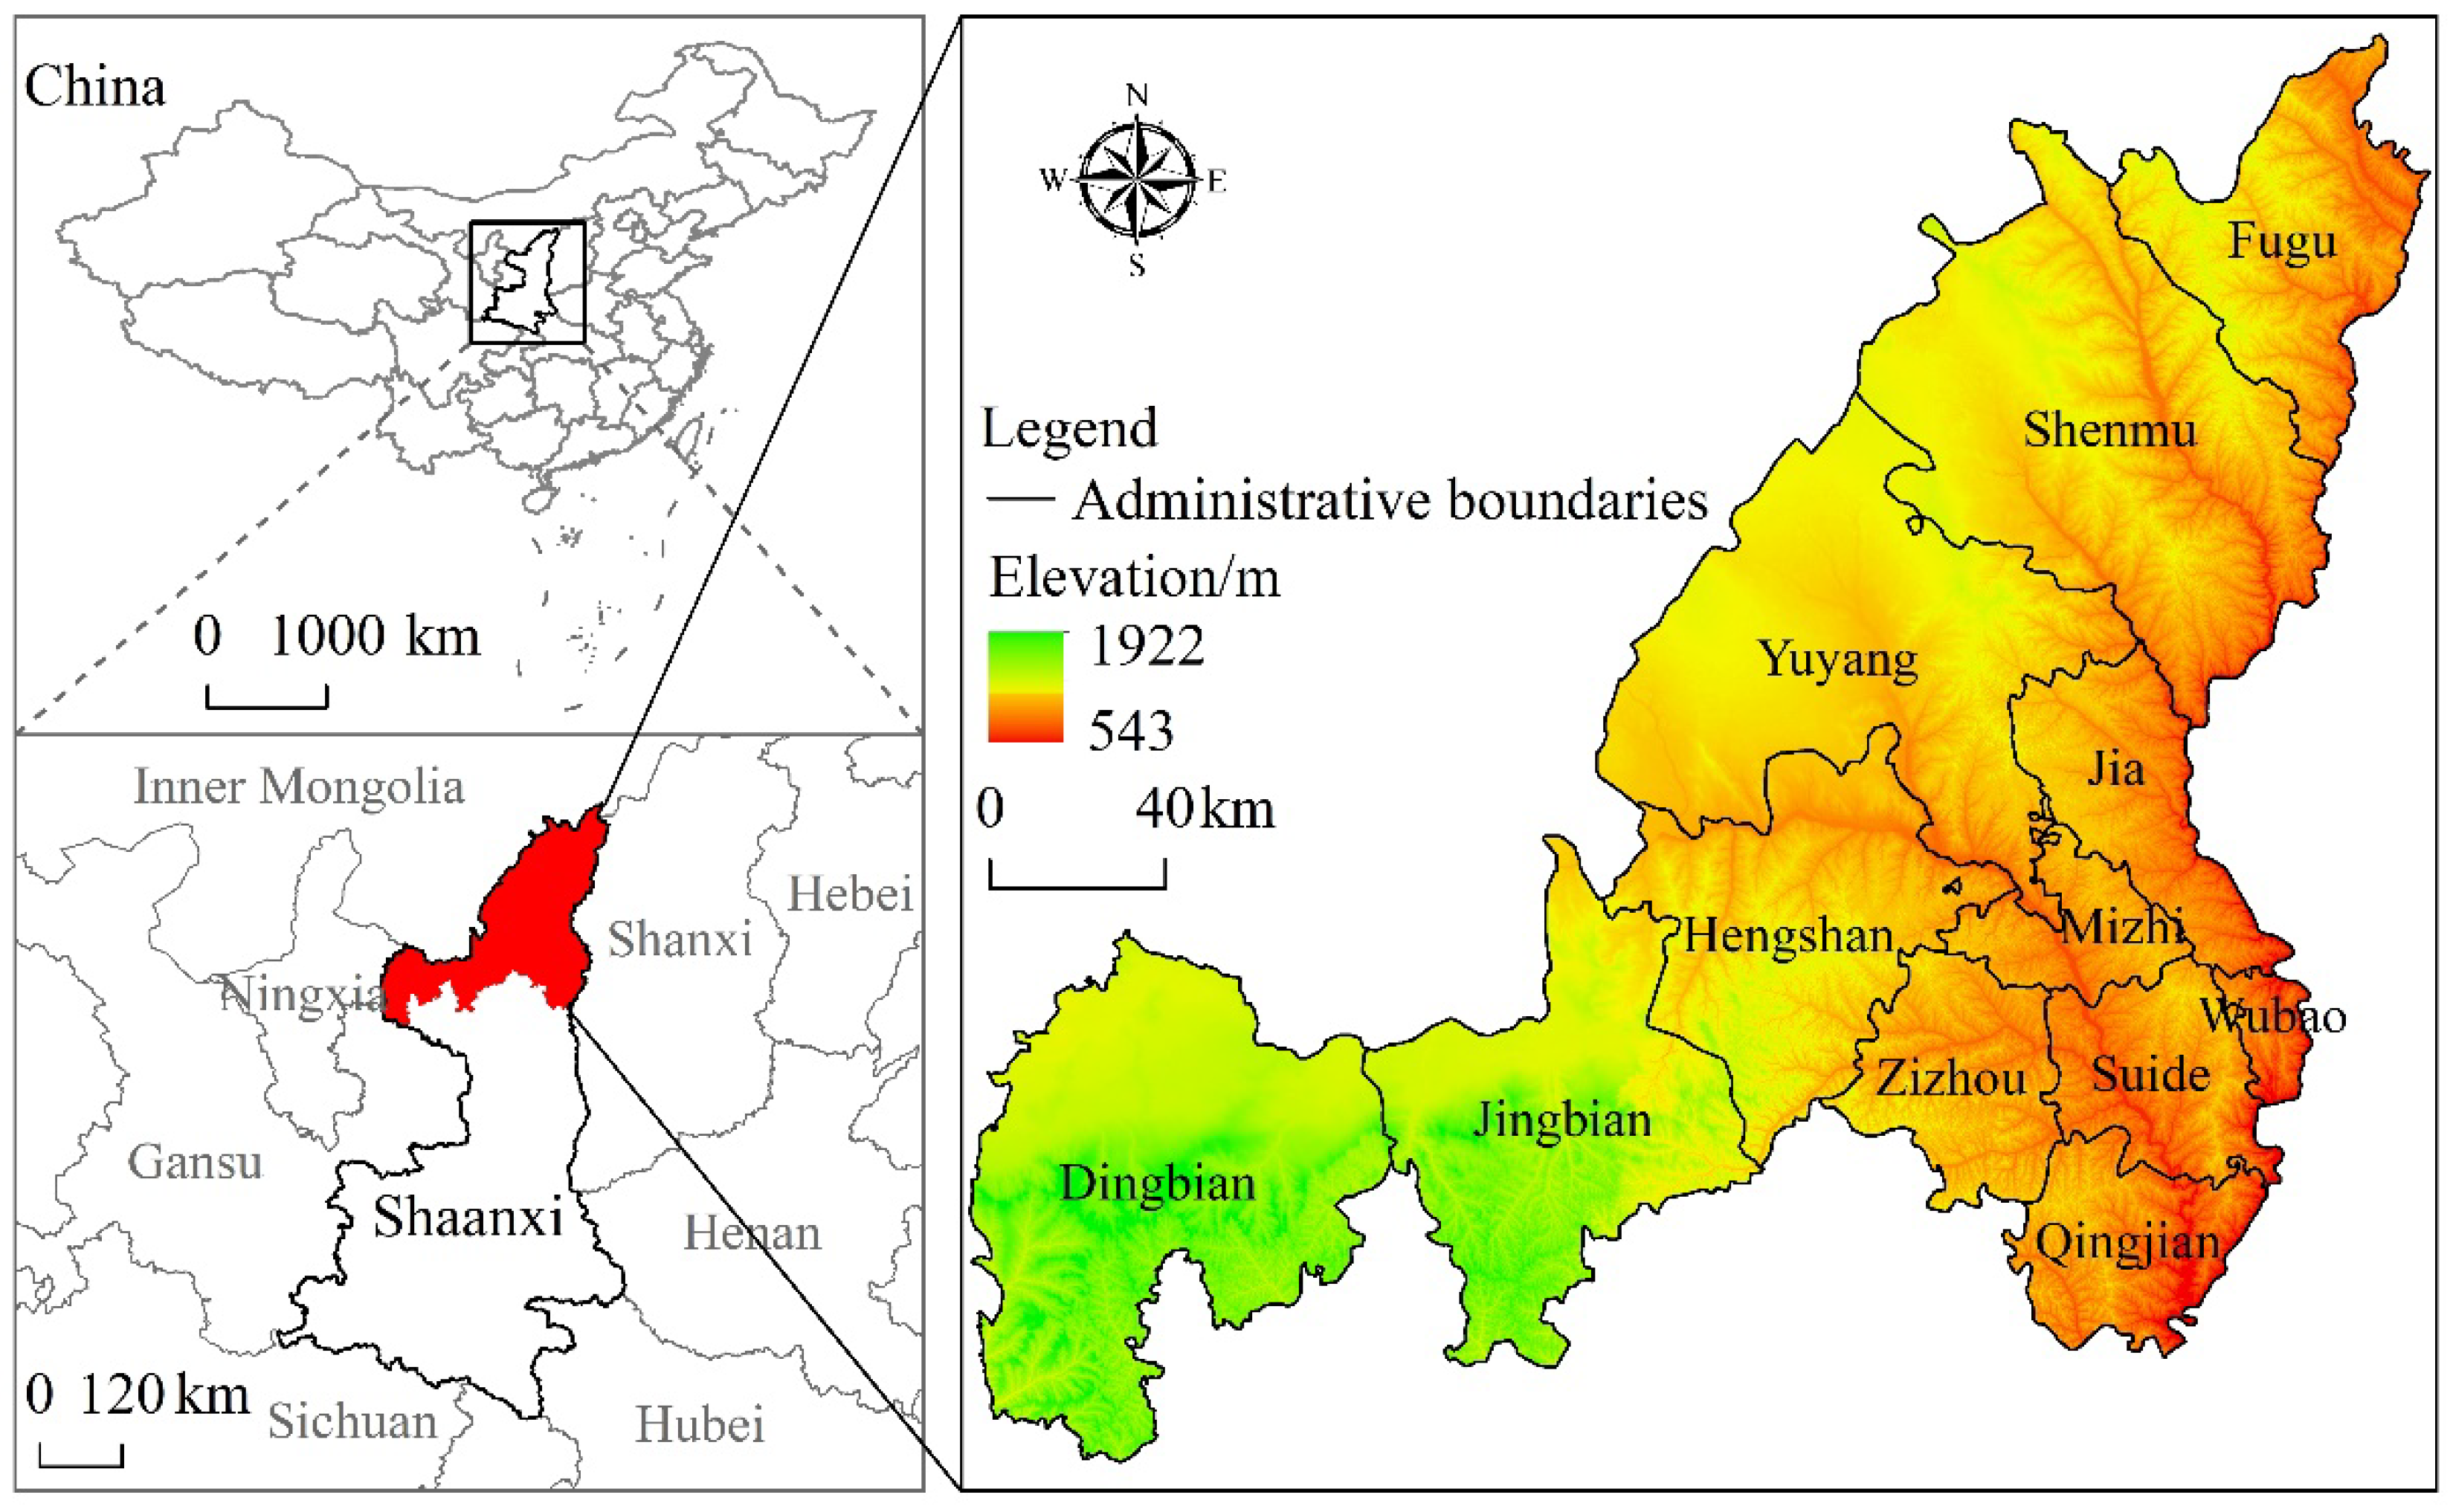
2.1. Study Area

Yulin is located in the northernmost part of Shaanxi Province in China (36°57′ N~39°35′ N, 107°28′ E~111°15′ E), at the boundary of the Loess Plateau and the Mu Us Sandy Land. It has jurisdiction over one county-level city, two districts and nine counties, with an area of 4.29 × 10⁴ km2 (Figure 2). As a city with growing resources, Yulin is rich in energy resources, known as China’s “Kuwait”, and is China’s emerging energy and chemical industry base. At present, 48 kinds of mineral resources in 8 categories have been discovered in Yulin. In the north, there is the Jurassic coal field, one of the seven largest coal fields in the world. In the west, there is the largest integrated gas field in China’s interior. In the south, there is the largest rock salt deposit in China. Among them, the most advantageous resource is the coal resource. Yulin has the largest reserves of high quality coal in China. About 54% of the land in Yulin City contains coal; its predicted coal reserves are 2.720 × 10¹¹ t, and its proven reserves are 1.490 × 10¹¹ t, accounting for 12% of China’s proven reserves. Yulin relies on coal resources to develop and grow, and the coal chemical industry is the pillar industry of its economic and social development. In the Sustainable Development Plan for National Resource-based Cities (2013–2020) issued by the Chinese State Council, Yulin was defined as a coal resource-based city and the supply and reserve base of China’s energy resources. In recent years, Yulin’s urbanization and industrialization process accelerated. The process of urban development and expansion relied on coal resources mining, processing and other related industries, causing resource development to rise. While driving regional economic development and social progress, the inertial dependence on carbon-based energy such as coal also brought challenges to the low-carbon development of Yulin. As a typical representative of the growing coal resource-based cities, Yulin is faced with a more complex and urgent task of low-carbon construction under the “carbon peak and carbon neutrality” goal. Therefore, it is typical and universal to select Yulin as the research area to study urban carbon metabolism.

2.2. Data Sources

The data used in this paper includes DEM data, land use data and statistical data. DEM data were obtained from Geospatial Data Cloud (http://www.gscloud.cn, accessed on 5 January 2022). The land use data were obtained from Resource and Environment Science and Data Center (http://www.resdc.cn/Default.aspx, accessed on 5 January 2022), with a resolution of 1 km × 1 km. Statistical data were obtained from Yulin Statistical Yearbook, Shaanxi Statistical Yearbook and Yulin Statistical Bulletin of National Economic and Social Development.

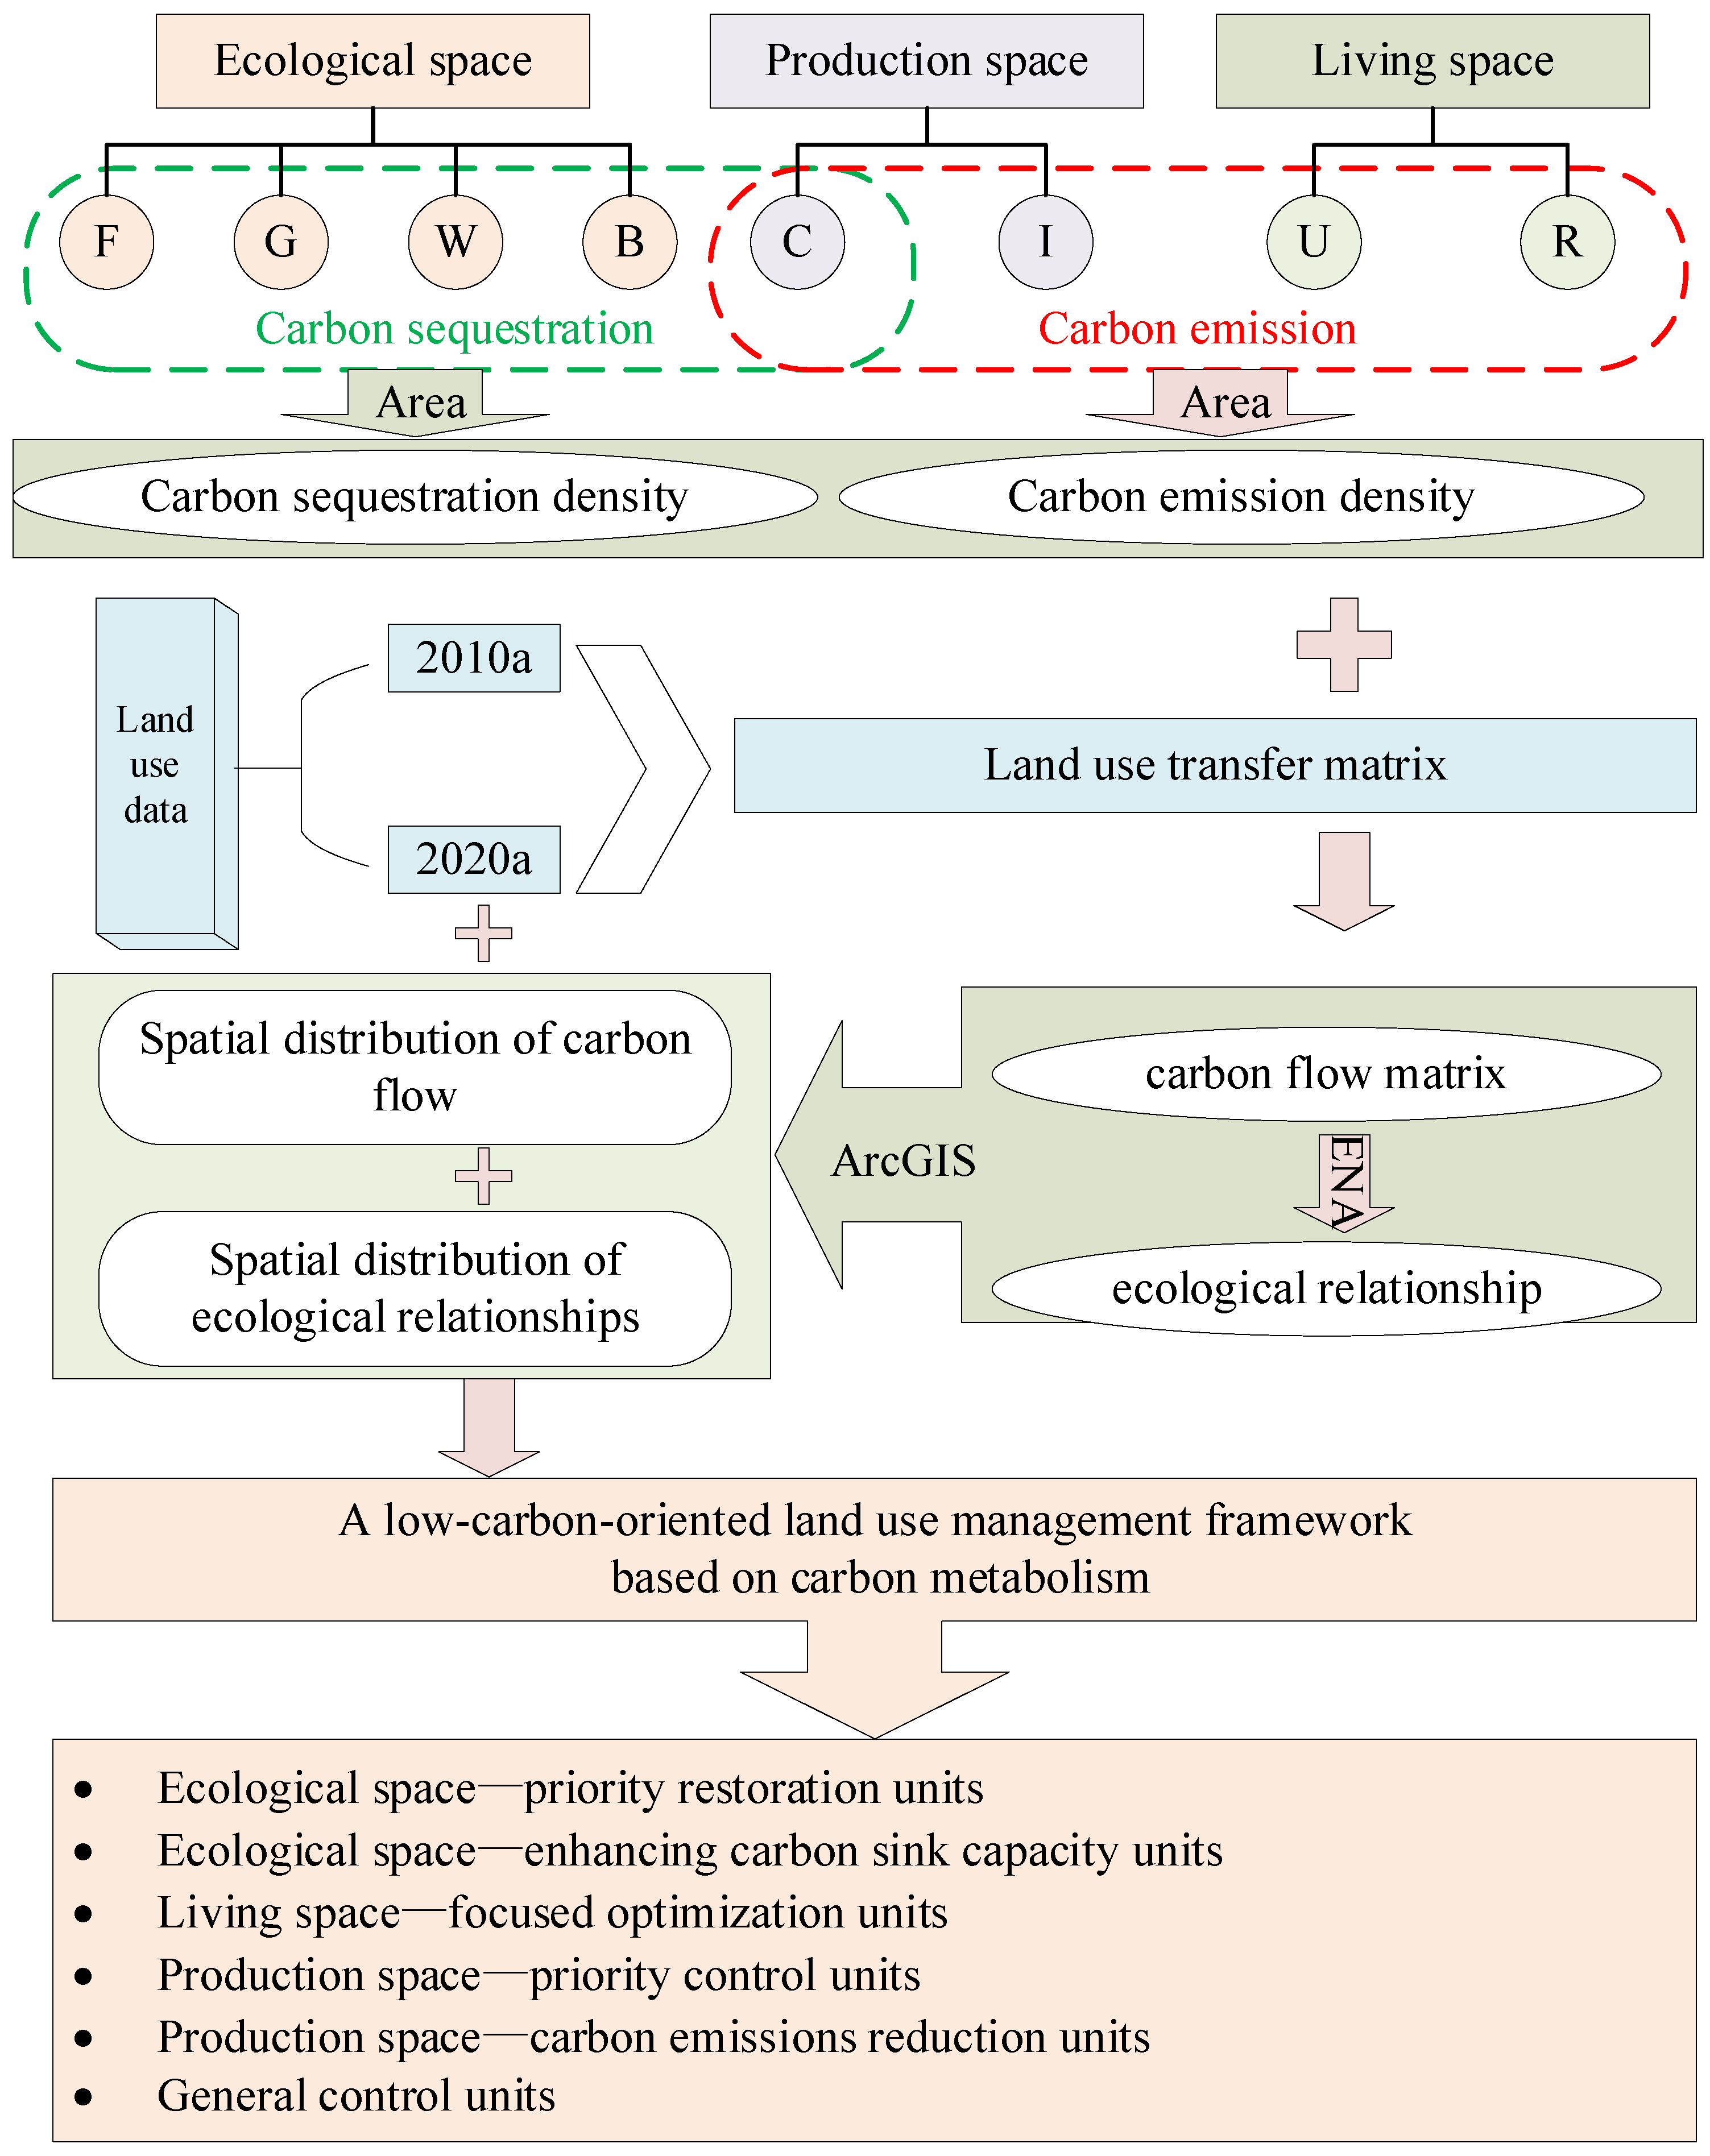
2.3. Research Methods

2.3.1. Land Classification of “Ecological-Production-Living” Space

Referring to relevant research [29,30,31,32], according to the land use classification system of the Chinese Academy of Sciences, the “ecological-production-living” space was divided on the basis of the dominant function of land use (Table 1).

2.3.2. Carbon Metabolism in “Ecological-Production-Living” Space

The carbon metabolism of this paper fully considers the carbon emissions from the biosphere to the atmosphere, the carbon sequestration from the atmosphere to the biosphere, and the potential carbon transfer among land use types in “ecological-production-living” space.
(1)
Carbon emission from the biosphere to the atmosphere
Urban carbon emission sources include all land use types of production space and living space. Carbon emissions for these land use types are calculated as follows.
The carbon emission sources of cultivated land mainly include agricultural production activities, animal enteric fermentation, animal manure management and rice fields. Carbon emissions from agricultural production activities are calculated as:
C A = B × k B + D × k D + E × k E + F × k F + G × k G + H × k H + W × k W
where CA is the carbon emissions of agricultural production activities; B, D, E and F are the usage of chemical fertilizer, pesticide, agricultural film and agricultural diesel oil, respectively; G and H are the irrigation and planting area of agricultural land, respectively; W is the total power of agricultural machinery; k is the carbon emission coefficient, which refers to Tian and Zhang [33], as shown in the Supplementary Table S3.
The CH4 emissions from animal enteric fermentation are calculated by multiplying the year-end number by the corresponding emission factors. The CH4 emissions from animal manure management are calculated by multiplying the number of animals by the corresponding emission factors. The CH4 emissions from rice field are calculated by multiplying the sown area by its emission factors. The above emission factors refer to Guidelines for Compiling Provincial Greenhouse Gas Inventories, as shown in the Supplementary Tables S3 and S4.
Carbon emissions from industrial, mining and transportation land mainly come from transportation, energy activities and industrial production processes. In the paper, the carbon emission calculation method of transportation in the study refers to Du et al. [14]. Additionally, the greenhouse gas calculation method recommended by the IPCC is adopted to calculate the carbon emissions of energy activities:
C e = i = 1 n E i × N i × δ i × O i × 44 / 12
where Ce is the total amount of carbon emissions from energy activities, n is energy types; Ei, Ni, δi and Oi are the consumption, average low calorific value, carbon content and carbon oxidation rate of i energy, respectively. The molecular weight ratio of CO2 and C is 44/12. The relevant index values refer to Wang et al. [34].
For Yulin, this paper considers carbon emissions in the production of cement and calcium carbide. It is obtained by multiplying the output of cement or calcium carbide by the corresponding emission factors, which refer to Guidelines for Compiling Provincial Greenhouse Gas Inventories, as shown in the Supplementary Table S3.
The carbon emissions of urban land mainly come from residents’ respiration and living energy consumption, but the carbon emission source of rural land is the burning of straw besides two parts. First of all, the carbon emissions of residents’ breathing are calculated by multiplying the urban or rural permanent population by the carbon emission coefficient of human breathing. The carbon emission coefficient of human breathing is 79 kg/per./a. [14]. Secondly, the carbon emissions of living energy consumption are calculated according to Equation (2). Finally, the carbon emissions from straw combustion are calculated as Equation (3):
C s = i = 1 m P i × S i × θ i × a × b
where Cs is carbon emissions from straw burning; m is the number of crop species; Pi is the production of i crop; Si and θi are the ratio of grain to straw and the carbon emission coefficient of straw burning of i crop, respectively; a is the open burning ratio of straw; b is the burning efficiency of straw. The values of above indicators refer to Du et al. [14].
(2)
Carbon sequestration from the atmosphere to the biosphere
The components that play the role of carbon sink are all land use types of ecological space and cultivated land. Their carbon sinks are calculated as follows.
The formula for calculating the carbon sink of woodland, grassland, water and unused land is:
C i = S i × K i
where Ci, Si and Ki are carbon sink, area and carbon sink coefficients of i component, respectively. The carbon sink coefficients refer to existing research [35,36,37] and are shown in the Supplementary Table S1.
The carbon sequestration of cultivated land is calculated by Equation (5):
C c = i = 1 n P i / H i × ( 1 r i ) × f i
where Cc is the carbon sequestration of cultivated land, n is the number of crop species, Pi, Hi, ri, fi are the economic output, economic coefficient, moisture content and carbon absorption rate of the i crop, respectively. The values of relevant indicators refer to Tian and Zhang [33], as shown in the Supplementary Table S2.
(3)
Carbon flow caused by LUCC
A carbon flow from component j to component i was represented as fij [38].
f i j = Δ W × Δ S
Δ W = W j W i = V j / S j V i / S i
where ΔW is the difference in carbon metabolism density between component j and i; ΔS is the area difference between j and i; Wj and Wi are the net carbon metabolism density of j and i, respectively; Vj and Vi are the net carbon metabolism of component j and i, respectively; Sj and Si are area of component j and i, respectively.

2.3.3. Ecological Network Utility Analysis

In order to characterize the effective direct utility amount among the components, the direct utility matrix D is defined, as shown in Equation (8) [39]. Based on this, we calculate the dimensionless total utility matrix U, as shown in Equation (9) [39]:
d i j = ( f i j f j i ) / T i
U = ( u i j ) = D 0 + D 1 + D n = ( I D ) 1
where dij is the element of matrix D; fij is the direct flow from j to i; fji is the direct flow from i to j; Ti is the carbon flux of i; uij is the element of matrix U; n is the number of components; I is identity matrix.
In the matrix U, positive elements represent positive utility, and negative elements represent negative utility. According to the matrix U, the ecological relationship between the two components can be judged. The possible types of ecological relationships are shown in the Supplementary Table S5. Among them, four common ecological relationships are competition, control, exploitation, and mutualism. Control and exploitation relationships indicate that one component benefits from the relationship and the other is harmed. Competitive relationships indicate that two compartments compete with each other and both lose their utility. Mutualism relationships indicate that both compartments increase their utility in the process of interaction.
The utility of the ecological relationship to the system is evaluated using the mutualism index M, as shown in Equation (10) [39]:
M = N + / N
where N+ and N are the numbers of positive and negative elements in matrix U, respectively. M > 1 indicates that the evolution of “ecological-production-living” space has a positive effect on the urban carbon metabolism balance, and the larger the value, the stronger the positive effect; when M < 1, the effect is opposite.

3. Results

3.1. Carbon Metabolism in “Ecological-Production-Living” Space

Table 2 shows the carbon emissions and carbon sinks of Yulin City’s “ecological-production-living” space in 2010 and 2020. In terms of carbon emissions, Yulin’s total carbon emissions in 2020 were 4.46 times that of 2010. The dominance of carbon emissions from industrial, mining and transportation land during the study period was prominent, accounting for about 99% of the total carbon emissions on average, indicating that the carbon emissions of industrial, mining and transportation land determined the total carbon emissions of Yulin City. Therefore, the carbon emission reduction work of Yulin City needs to start from the carbon emission reduction in the industrial and transportation industry. In 2020, compared with 2010, the carbon emissions of rural land decreased by 14.78%, and the carbon emissions of cultivated land, urban land, industrial and transportation land increased by 32.03%, 28.37% and 348.33%, respectively. Figure S1 shows the distribution of “ecological-production-living” space in Yulin City in 2010 and 2020. Combined with Figure S1, the reasons are analyzed. It is found that the area of rural land increased from 2010 to 2020, but its carbon emissions decreased. This indicates that the carbon emission density of rural land decreased from 2010 to 2020. Possible causes are as follows. On the one hand, with the implementation of the rural revitalization strategy, the farmers’ production and living conditions have improved, the level of rural electrification has enhanced, and rural activities such as cooking and heating have been gradually replaced by clean energy, so the carbon emissions from rural coal fired have reduced. On the other hand, in recent years, with the implementation of a ban on straw burning in Yulin city, carbon emissions from straw burning in rural areas have decreased. However, with the continuous improvement of the rural mechanization level, the widespread use of chemical fertilizers, pesticides and agricultural machinery has led to an increase in carbon emissions from cultivated land. In addition, Yulin City is in the stage of rapid industrialization and urbanization, so that energy consumption is rapidly increasing. As a result, carbon emissions from urban land as well as industrial and transportation land during the study period increased.
In terms of carbon sinks, the total carbon sinks of Yulin in 2020 were 1.10 times that of 2010. Forest land was the most important components of carbon sink in 2010 and 2020, accounting for 89.64% of the total carbon sinks on average. In addition, the carbon sink capacity of cultivated land could not be ignored, whose carbon sinks accounted for about 10.02% of the total carbon sinks on average. Compared with 2010, the carbon sinks in ecological space increased by 4.63% in 2020. Among them, the carbon sinks of forest land and grassland increased by 4.66% and 1.78%, respectively, the carbon sinks of waters decreased by 13.87%, and the carbon sinks of unused land remained unchanged. It can be seen from Figure S1 that the area of the ecological space decreased from 2010 to 2020, but here we see an increase in its carbon sink. The reason is that the area of forest land and grassland in ecological space increased, indicating that the carbon sink role of forest land and grassland in the ecological space is more obvious. In addition, from 2010 to 2020, the carbon sinks of cultivated land increased by 61.25%, but according to Figure S1, the area of cultivated land decreased. This indicates that the carbon sink capacity of cultivated land was enhanced from 2010 to 2020. Overall, the carbon emissions of Yulin City in 2010 and 2020 were greater than the carbon sinks, and the carbon emissions were 5.82 and 27.79 times the carbon sinks, respectively, indicating that the carbon metabolism imbalance in Yulin City intensified during the study period.
Based on the land use transition matrix (Table S6), the “carbon flow” matrix of Yulin’s “ecological-production-living” space was obtained (Table S7). Figure 3 shows the carbon flow network among components. The results showed that the net carbon flow in Yulin from 2010 to 2020 was −2.76×10⁸ t, which indicated that the evolution of Yulin’s “ecological-production-living” space had led to an increase in carbon emissions. Among them, the main path for negative carbon flow was the transfer of ecological space and cultivated land into industrial, mining and transportation land, accounting for 81.24% and 16.24% of the total negative carbon flow, respectively. The positive carbon flow was only 26.07% of the negative carbon flow; its main path was the transfer of industrial, mining and transportation land into various lands of ecological space and cultivated land, accounting for 25.66% and 12.07% of the total positive carbon flow, respectively. This indicated that industrial, mining and transportation land was the key component of carbon metabolism in Yulin city. In addition, the transfer of other land use types to forest land was also an important path for positive carbon flow, and the positive carbon flow on the path accounted for 10.37% of the total positive carbon flow. Among them, the positive carbon flow along the path from cultivated land to forest land accounted for 42.69%, indicating that the implementation of the project of returning farmland to forestland had a certain promoting effect on the balance of urban carbon metabolism.
In order to more intuitively display the spatial distribution of net carbon flow in the “ecological-production-living” space of Yulin city from 2010 to 2020, the study finally divided both positive and negative carbon flow into four grades, which achieved the best grading effect, as shown in Figure 4. From 2010 to 2020, the patches without carbon transfer in the horizontal direction of Yulin City accounted for 55.76% of the total area, and the patches with negative carbon flow and positive carbon flow accounted for 23.24% and 21.00%, respectively. Although the area of the plaques with positive and negative carbon flow was not much different, it could be seen from above that the overall net carbon flow was a large negative number, which indicated that the carbon emission intensity of the plaques with negative carbon flow was far greater than that with positive carbon flow. It could be seen from Figure 4a that according to the flow grade from low to high, the area proportions of the plaques with negative carbon flow accounted for 77.76%, 1.40%, 13.75% and 7.09%, respectively. The lowest grade patches with negative carbon flow accounted for the largest proportion, whose carbon flow was mainly caused by the transfer of cultivated land to grassland. In addition, although the plaques with carbon flow higher than 100 × 104 t only accounted for 7.09%, their contribution to the negative carbon flow was 54 times that of other grades of plaques. Moreover, the study found that the spatial distribution of these patches with the highest grade of negative carbon flow was consistent with that of the newly added industrial, mining and transportation land mentioned above, which further highlighted the negative effects of industrial, mining and transportation land on urban carbon metabolism. It could be seen from Figure 4b that according to the flow grade from low to high, the area proportions of the plaques with positive carbon flow accounted for 82.02%, 0.97%, 16.73% and 0.28%, respectively. The lowest grade patches with positive carbon flow accounted for the largest proportion and were widely distributed, whose carbon flow was mainly caused by the transfer of grassland to cultivated land and the transfer of unused land to grassland. In view of the small area, small number, and scattered distribution of patches with the highest grade of positive carbon flow, green circles were added around them for convenient observation. It was found that the plaques with the highest grade of positive carbon flow were mainly distributed in the coal mining areas of Shenmu, Fugu and Yuyang. This was closely related to the fact that the Yulin City government took the Shenmu-Fugu coal distribution area, Yulin-Shenmu coal distribution area and Fugu coal distribution area as key governance areas of the mining environment during the study period, and carried out vegetation restoration and land reclamation for abandoned mines.

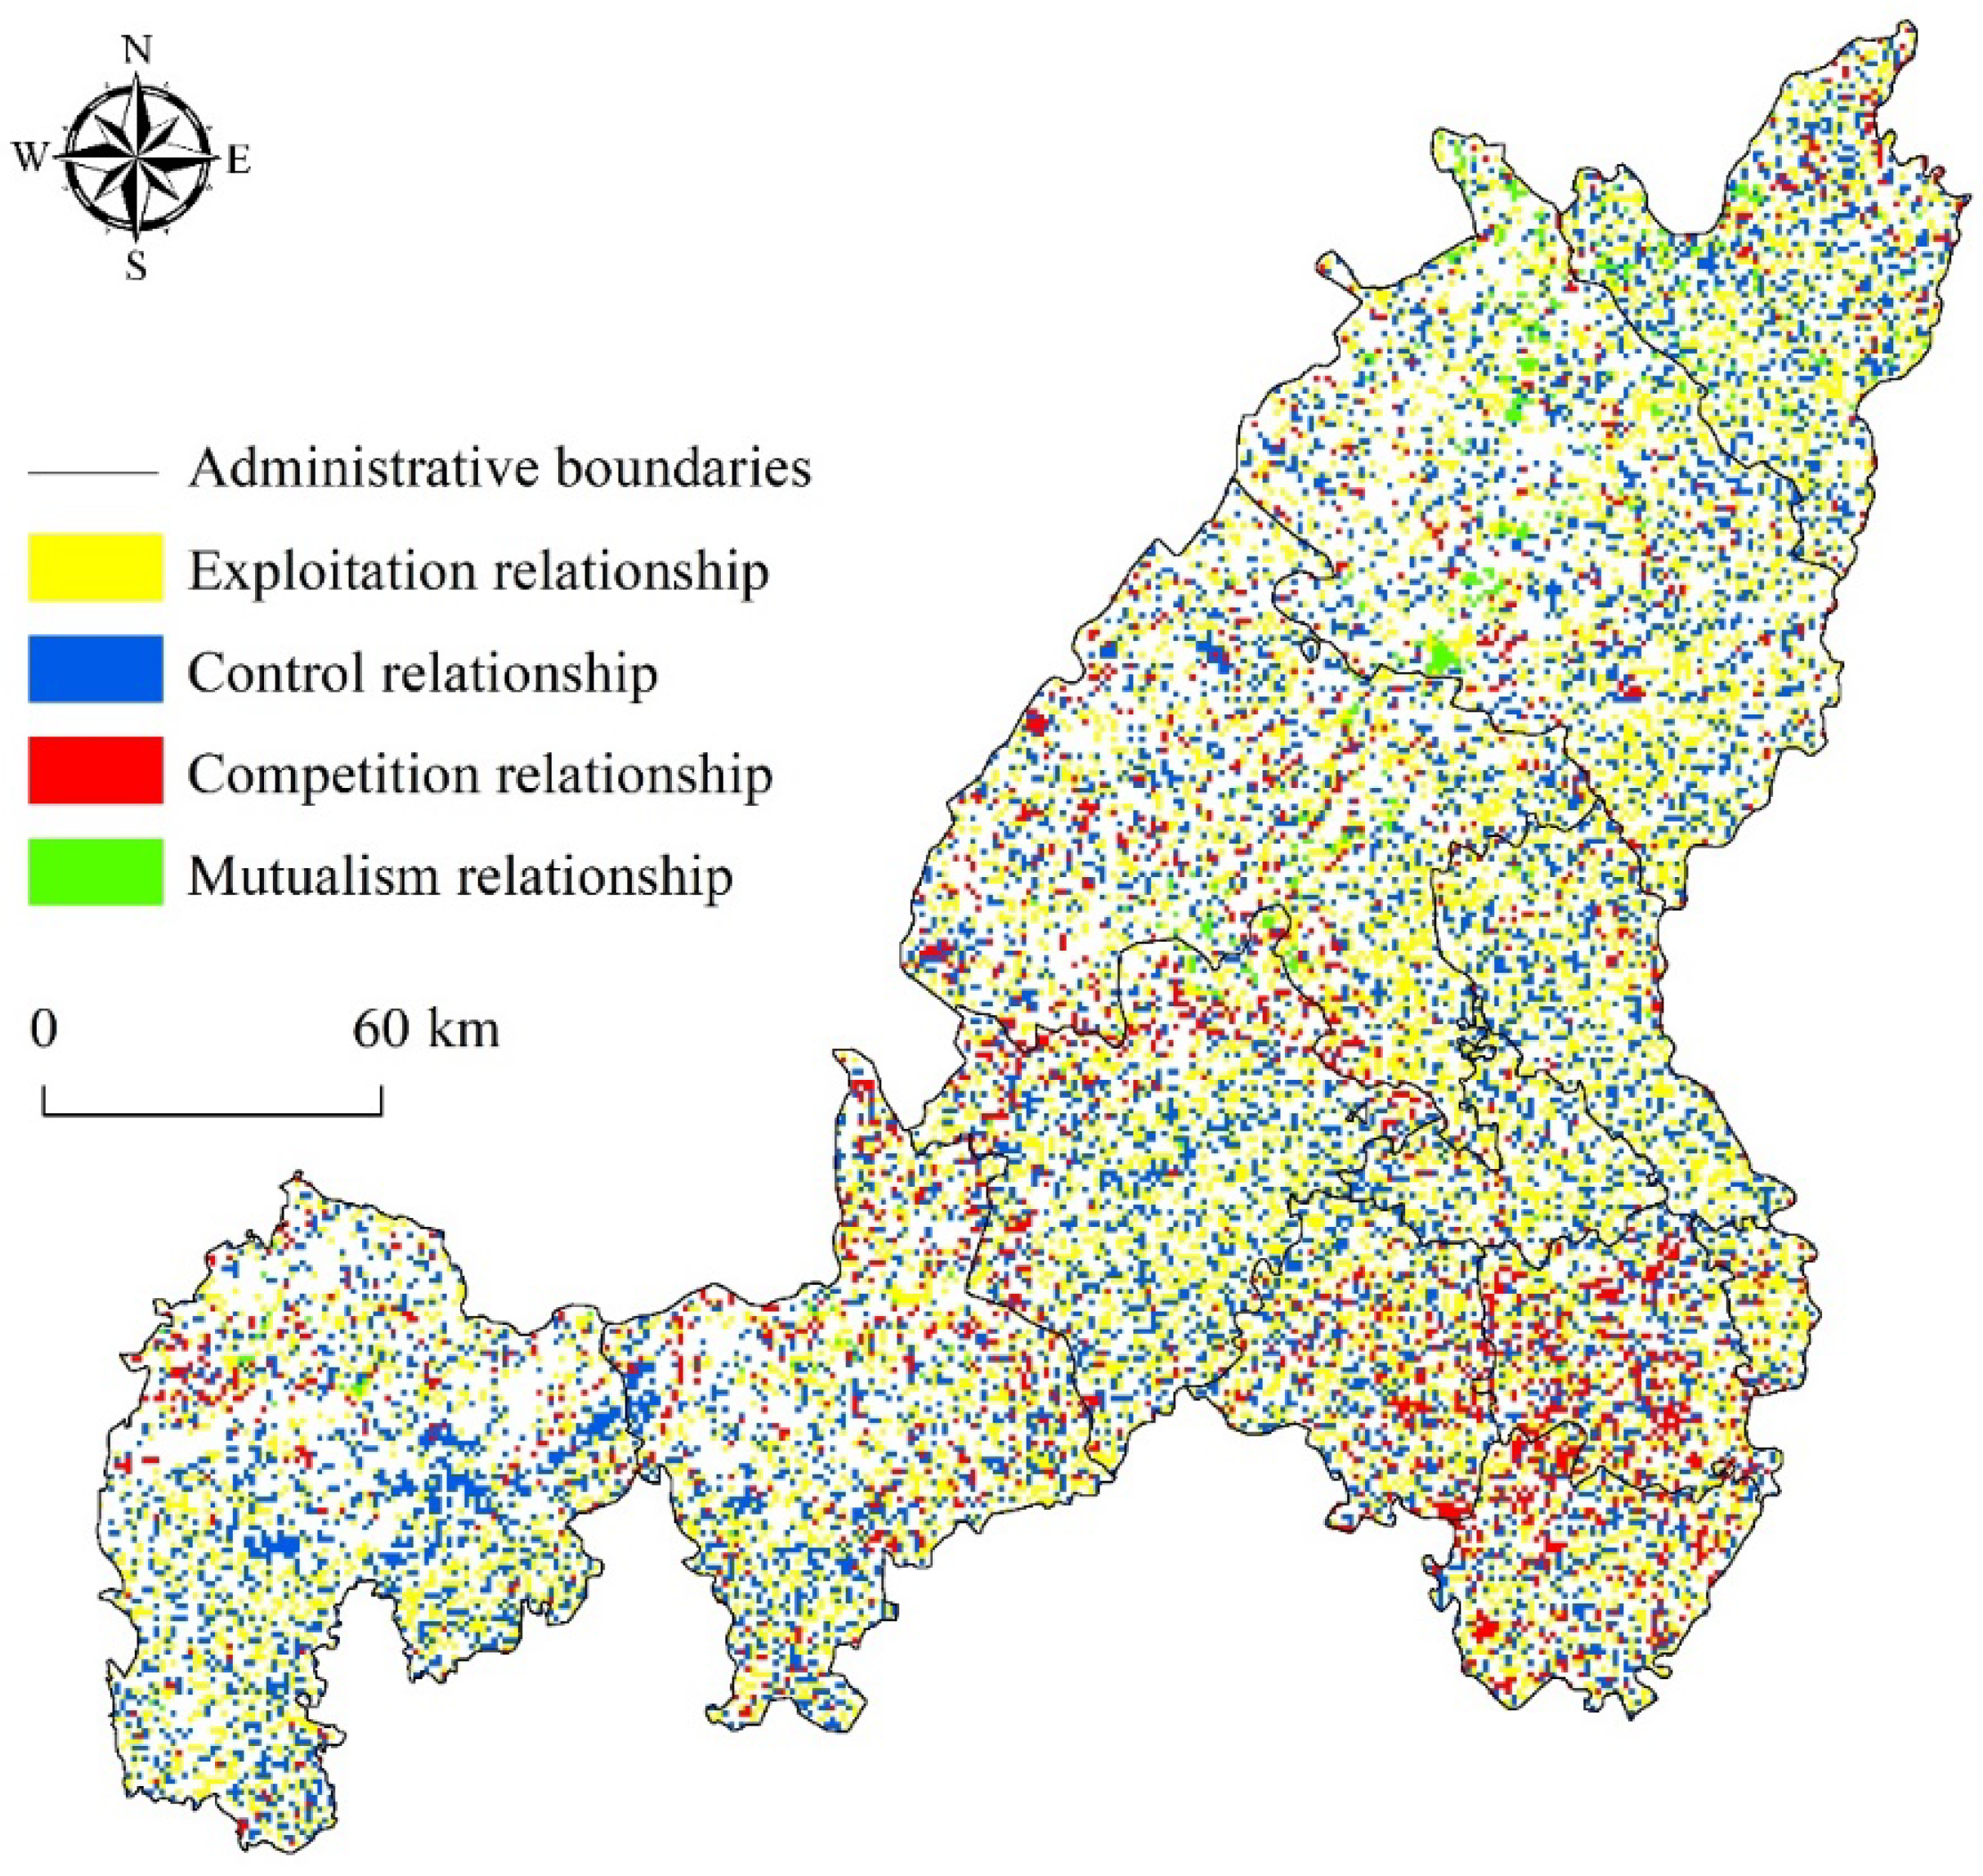
3.2. Ecological Relationships among “Ecological-Production-Living” Space Land

Figure 5 shows the ecological relationships between various land use types in the “ecological-production-living” space in Yulin City under the action of carbon metabolism, including the four relationships: competition, control, exploitation, and mutualism. Among them, control and exploitation are identical in essence although they are presented in opposite ways. Therefore, these two relationships are combined for statistics in the study. The results showed that the number of control and exploitation relationships accounted for 60.72% of the total, and they were widely distributed among the components. Among them, grassland, industrial, mining and transportation land were very important components of the exploitation relationship, both of which accounted for 23.53% of the relationship. It showed that the increase in grassland area and the expansion of industrial, mining and transportation land had important effects on urban carbon metabolism. Competition relationships accounted for 28.57% of all relationships, 75% of which existed in cultivated land and the land of ecological space. This indicated that under the action of the system, there was fierce competition for carbon storage among land use types, including cultivated land and all types of land in ecological space. The reason was that all these land use types have the function of carbon sequestration, and competition between them was inevitable under the premise of limited carbon storage in the system. Mutualism relationships accounted for only 10.71% of all relationships. There were mutualism relationships between grassland and urban land, between grassland and industrial, mining and transportation land, and between urban land and rural land. Under the premise that carbon emission was fixed and there was no obvious land transfer between these two types of land, the carbon emitted by urban land and industrial, mining and transportation land was absorbed by grassland, which promoted the expansion of grassland. At the same time, the enhanced carbon absorption brought about by the expansion of grassland also reduced the pressure on the carbon emission of the system, which was beneficial to the expansion of urban land and industrial and transportation land. For urban land and rural land, although the direct “carbon flow” will not bring about a mutualism relationship, the transfer of these two types of land to other types of land to a certain extent will reduce the carbon emissions of these two types of land relatively. In general, the carbon metabolism system of “ecological-production-living” space in Yulin was dominated by the control and exploitation relationship, and the proportion of mutualism relationships in all relationships was smaller than that of competition relationships. This showed us that the relationship among the components in the carbon metabolism system was relatively conflicted and the reciprocal level of the carbon metabolism system was not high.
The spatial distribution of ecological relationships is shown in Figure 6. The white area in the figure is the area where the land use type has not changed. It could be seen from the figure that the control and exploitation relationships were widely distributed, mainly in Shenmu, Dingbian and Yuyang, accounting for 30.70%, 30.35% and 28.42% of the relationship, respectively. This is because the area of mutual transfer between cultivated land and grassland, grassland and rural land, forestland and grassland in these areas is relatively large. The competition relationships were mainly distributed in Yuyang, Jingbian and Suide, accounting for 16.11%, 14.15% and 12.00%, respectively. The main reason is that the area of mutual transfer between rural land and cultivated land, and cultivated land and forestland, in these areas is relatively large. In addition, there was also a large transfer area between cultivated land and forest land. The mutualism relationships were mainly concentrated in Shenmu, Fugu and Yuyang, accounting for 45.41%, 21.00% and 16.27%, respectively. The reason for this is that the transfer area between grassland and industrial, and mining and transportation land, in these areas was relatively large. Generally speaking, the distribution of control and exploitation relationships were relatively broad, the distribution of competition relationships were relatively scattered, and the distribution of mutualism relationships were more concentrated.
The mutualism index M considers both the ecological relationship of direct and indirect carbon flow, which reflects the impact of the comprehensive effect of carbon flow on urban carbon metabolism, and can more comprehensively evaluate the carbon metabolism of urban “ecological-production-living” space. The value of M obtained by the calculation is 0.94 < 1, indicating that the positive effect of carbon flow is less than the negative effect in the carbon metabolism system, and the evolution of the “ecological-production-living” space exacerbates the disturbance of urban carbon metabolism, which is consistent with the calculation results of net carbon flow.

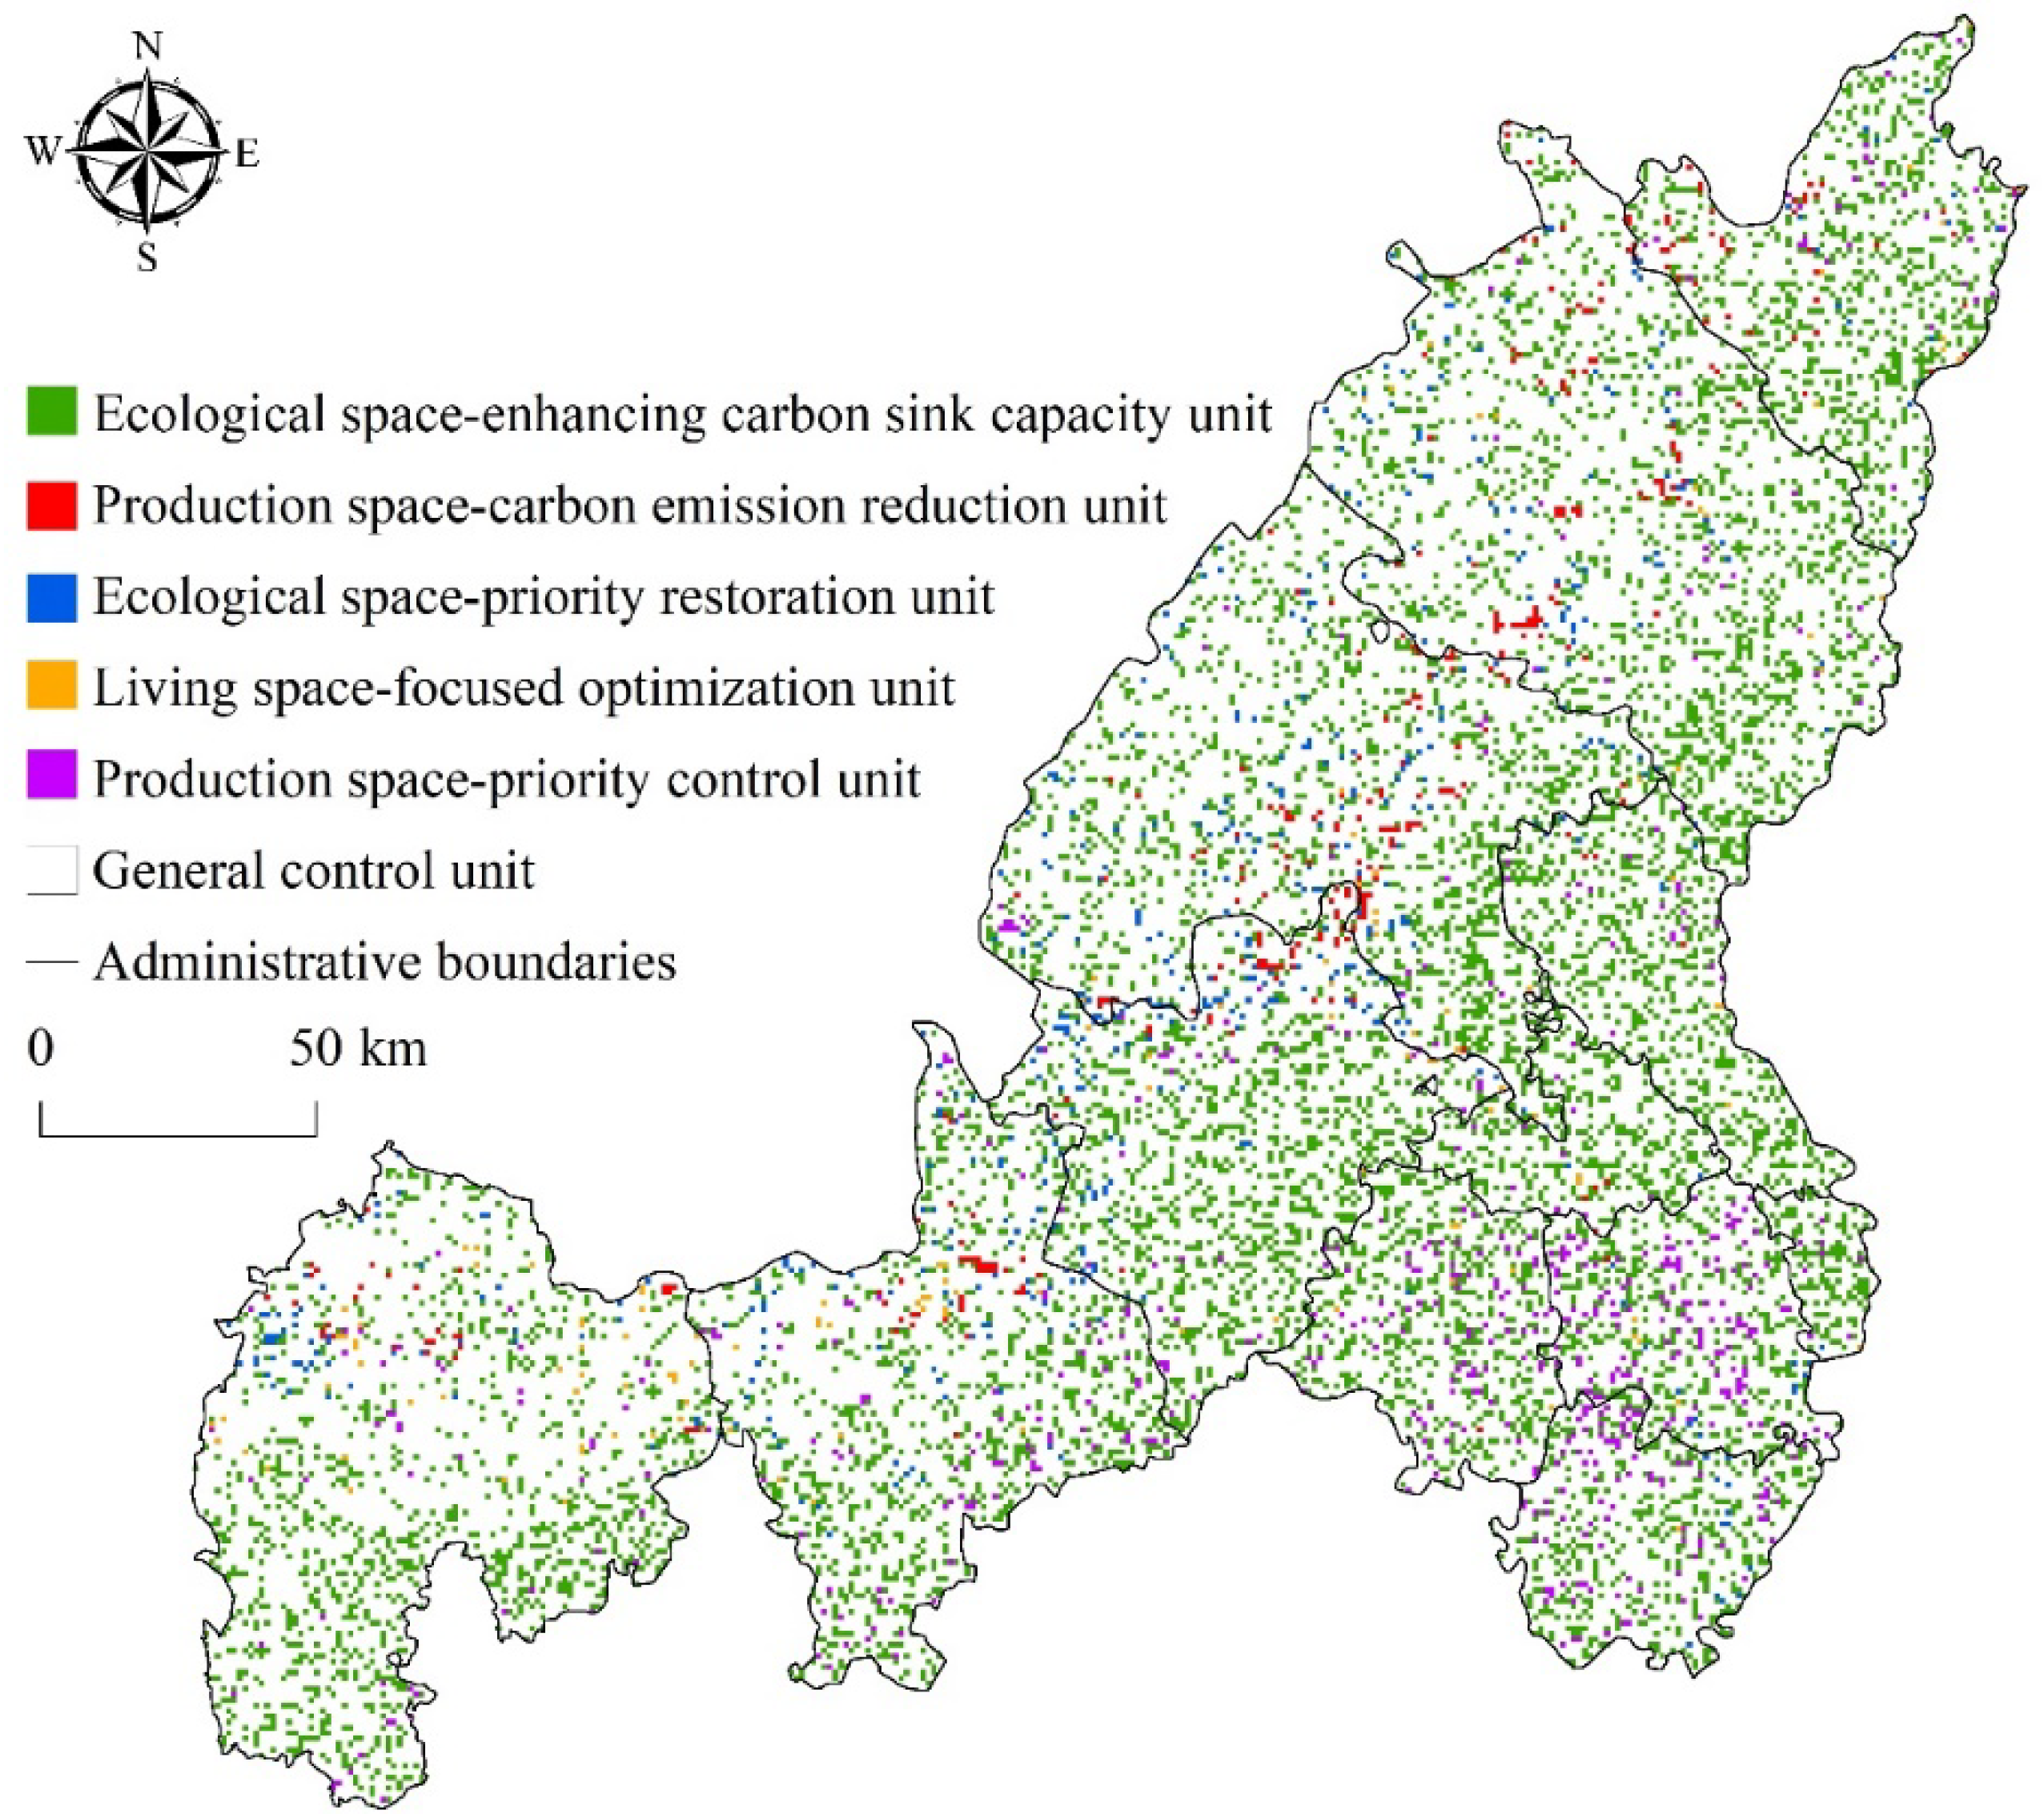
3.3. Low-Carbon Land Use Management Framework in”Ecological-Production-Living” Space

According to the dominant factors such as the distribution pattern of carbon flow and its ecological relationships, the status quo of “ecological-production-living” space and so on, a low-carbon land use management framework was proposed. In the paper, an overlay analysis was carried out on the spatial distribution map of Yulin’s “ecological-production-living” space in 2020, and the spatial distribution map of carbon flow and its ecological relationships from 2010 to 2020, and the whole area of Yulin was divided into six types of management and control units (Figure 7).
(1)
Ecological space—priority restoration units
These units refer to the area with negative carbon flow and a competitive ecological relationship in the ecological space at the end of the study period. The main reason is that water and bare land with a lower carbon sink density compete with cultivated land and forest land with a higher carbon sink density, resulting in a decline in the carbon sink capacity of the system and a negative effect on urban carbon metabolism. These units accounted for 1.27% of the whole area, and were mainly distributed in Yuyang, Hengshan, Shenmu, Jingbian and Dingbian, accounting for 26.67%, 18.70%, 17.04%, 16.67% and 10.56%, respectively. The changes in land use types during the study period of these units indicated that there were phenomena of human destruction of the ecological environment, such as deforestation and abandonment of land. Therefore, it was necessary to strengthen management, resolutely stop and punish all man-made destruction activities that lead to the continuous deterioration of ecological functions, and it was also necessary to strengthen the follow-up construction work such as supplementary afforestation and land reclamation.
(2)
Ecological space—enhancing carbon sink capacity units
These units refer to the area with negative carbon flow and control and the exploitation relationship in ecological space at the end of the study period. Grassland can be found to be a very important component in forming an exploitation relationship. A total of 87.81% of such units were derived from the exploitation of other land by grassland. Among them, 78.11% of the units originated from the exploitation of cultivated land by grassland, which may be influenced by the policy of returning farmland to grassland. For these units, on the basis of suitability evaluation, priority should be given to restoring the cultivated land that needs to be transferred to forest land, so as to improve the carbon sequestration capacity. In addition, 7.9% of the units originated from the exploitation of forest land by grassland. However, it was the large carbon sink density difference between grassland and forestland that caused 91.31% of the negative carbon flow. These units accounted for 18.54% of the whole area, and were widely distributed but mainly in Shenmu, Yuyang, Dingbian, Hengshan and Jingbian, accounting for 15.66%, 14.11%, 12.98%, 11.08% and 10.61%, respectively. These units may be anthropogenically affected by logging, mining, etc., so the forest land is degraded and turned into grassland. Therefore, it was necessary to revegetate these units to improve the ecological restoration effect.
(3)
Living space—focused optimization units
These units refer to the area with negative carbon flow and control and exploitation relationship in the living space at the end of the study period. They accounted for 0.32% of the total area, mainly distributed in Dingbian, Jingbian, Yuyang, Shenmu and Hengshan, accounting for 33.33%, 15.22%, 11.59%, 9.42% and 9.42%, respectively. They originated from the exploitation of ecological space and cultivated land by living space, resulting in an increase in carbon emission sources and a decrease in carbon sinks, which had an important impact on the balance of urban carbon metabolism. Therefore, the expansion of such units should be controlled in time to avoid the exploitation of the carbon sink land. At the same time, resource allocation should be used to attract the population to live in a concentrated area, so as to improve the efficiency of resource utilization, and then achieve the goal of reducing carbon emissions.
(4)
Production space—priority control units
These units refer to the area with a negative carbon flow and competitive ecological relationship in the production space at the end of the study period. They accounted for 1.44% of the total area, mainly distributed in Suide, Qingjian, Zizhou, Jingbian and Dingbian which belong to the loess hilly region, accounting for 22.39%, 15.85%, 14.71%, 14.05% and 8.50%, respectively. They mainly included the following two types. One was the competition between industrial, mining and transportation land and rural land; such units accounted for only 0.33%. They reflected the industrialization of rural areas to a certain extent, and were conducive to promoting economic development and social progress in rural areas. Therefore, it was necessary to accelerate the exploration of low-carbon technologies and reduce carbon emissions in the production process. The other was the competition between cultivated land and forest land; such units accounted for 99.67%. The reason for this was that in order to achieve cultivated land requisition-compensation, the supplementary cultivated land mainly came from forestland. Therefore, these units should be based on the premise of farmland protection and ecological protection, and the farmland that is not suitable for farming should be transferred into forest land to enhance carbon sinks.
(5)
Production space—carbon emissions reduction units
These units refer to the area with a negative carbon flow and a control and exploitation relationship in the production space at the end of the study period. They were mainly the exploitation of ecological space and cultivated land by industrial and transportation land, and their negative carbon flow exceeds 5.00 × 10⁸ t, which seriously affected the carbon metabolism balance of Yulin. These units accounted for 0.81% of the whole area, and were mainly distributed in Yuyang, Shenmu, Hengshan, Fugu and Jingbian, accounting for 26.88%, 24.57%, 13.01%, 12.14% and 10.98%, respectively. The main reason is that these areas are the coal mines of Yulin. As a growing resource-based city, Yulin’s resource exploitation is on the rise. Especially under the “dual circulation” strategy, it is bound to speed up resource exploitation and utilization. Therefore, on the one hand, these units should eliminate high energy-consuming industries and support new energy industries; on the other hand, it is necessary to optimize the layout of industrial production space, establish industrial parks to form low-carbon, efficient, and high-quality production spaces.
(6)
General control units
These units refer to areas other than the above-mentioned units. They account for 77.62% of the total area and are widely distributed. They include three types, namely units with no change in land use type during the study period, units with positive carbon flow, and units with negative carbon flow but with a mutualism relationship. Such units have no negative effect on the urban carbon metabolism balance. Therefore, under the premise of prioritizing the quality of the ecological environment, management and utilization should be carried out according to the original land use type, and a low-carbon mode of land use should be sought at the same time.

4. Discussion

The study analyzed the carbon metabolism process of the “ecological-production-living” space in Yulin, a coal resource-based city, and found that the carbon emissions from industrial, mining and transportation land dominated the total carbon emissions, and forest land was the most important component of carbon sink. This is the same as the research results of Xia [24], but different from those of Du et al. [14]. Xia [24] analyzed the carbon metabolism process in Hangzhou from the perspective of land use, and found that industrial and transportation land was the main source of carbon emissions in Hangzhou from 1995 to 2015, whose carbon emissions accounted for about 86.89% of the total carbon emissions on average, and forest land is the most important component for carbon sink, whose carbon sinks accounted for 70% of the total carbon sink on average. Du et al. [14] studied the carbon metabolism of the “ecological-production-living” space in Zhaotong City, a coal resource-based city. He took the industrial land and road land as two independent components and compared its carbon emissions with those of the cultivated land, urban land, and rural land. It was found that cultivated land had the largest carbon emissions in 2010, and industrial land had the largest carbon emissions in 2018. However, by summing up the carbon emissions of industrial land and road land, it was found that in 2010 and 2018, the carbon emissions of industrial land and road land in Zhaotong City accounted for 41.96% and 79.00%, respectively, which is the most important source of carbon emissions. Compared with this study, the proportion of carbon emissions from industrial and road land in Zhaotong City is lower than that of Yulin City. The possible reason is that the industrial development level of Zhaotong City is lower than that of Yulin City. For example, in 2010, the industrial added value of Yulin City was about 7.44 times that of Zhaotong City. Therefore, the industrial carbon emission of Zhaotong City is lower than that of Yulin City. In addition, Du et al. [14] found that cultivated land was the most important land for carbon sink in Zhaotong City during the study period, which was different from the results of the study. The possible reason is that the proportion of the added value of Zhaotong City’s primary industry in GDP is higher than that of Yulin. For example, in 2010, the proportion of primary industry in Zhaotong City and Yulin City was 19.5% and 5.3%, respectively. Therefore, the proportion of crop planting areas in Zhaotong City may be higher than that in Yulin City, resulting in a more prominent role of cultivated land as a carbon sink. To sum up, irrespective of whether they are resource-based cities or non-resource-based cities, industrial and transportation land are the main sources of carbon emissions in cities, and forest land and cultivated land are the main components of carbon sinks in cities.
The limitation of the study is that the resolution of land use data is coarse. This is because the land use classification of the higher resolution land use data in Yulin at this stage cannot meet the needs of the land use classification of “ecological-production-living” space in this study, so the data with a resolution of 1 km is selected. In the future, it is necessary to use higher-resolution spatial data to carry out research to accurately grasp the spatial evolution of Yulin City’s “ecological-production-living” space and carbon flow changes, so as to formulate regional land use management framework more accurately.

5. Conclusions

Taking Yulin, a typical coal resource-based city in China, as an example, we proposed a low-carbon land use management framework based on the urban carbon metabolism network. The results showed that industrial, mining and transportation land had the largest carbon emissions, accounting for more than 90% of the total carbon emissions. Carbon sequestration of forestland was prominent, accounting for 89.64% of the total carbon sequestration. The main path of negative carbon flow was the transfer of ecological land and cultivated land to industrial, mining and transportation land. The positive carbon flow was mainly caused by the transfer of industrial, mining and transportation land to ecological land and cultivated land. The ecological relationships between land use types under the effect of carbon metabolism was dominated by control and exploitation relationships, and mutualism relationship accounted for the lowest proportion. The value of mutualism index M was 0.94 < 1, indicating that the evolution of “ecological-production-living” space in Yulin had a negative effect on urban carbon metabolism. Based on the spatial analysis of carbon flow and the ecological relationship, combined with the current situation of “ecological-production-living” space, and oriented by low-carbon development, six types of control units are divided: Ecological space—priority restoration units; Ecological space—enhancing carbon sink capacity units; Living space—focused optimization units; Production space—priority control units; Production space—carbon emissions reduction units; General control units. This provides a reference framework of low-carbon land use management on a practical level for international coal resource-based cities.

Supplementary Materials

The following supporting information can be downloaded at: https://www.mdpi.com/article/10.3390/su142113854/s1, Figure S1: “ecological-production-living” space of Yulin City in 2010 and 2020; Table S1: Carbon sink coefficients of ecological land; Table S2: Economic coefficient, moisture content and carbon absorption rate of main crops in Yulin; Table S3: Carbon emission coefficients of production space; Table S4: Carbon emission coefficients of major animals; Table S5: Ecological relationships classification in ecological network analysis; Table S6:”Ecological-production-living” land transfer matrix of Yulin from 2010 to 2020 (104 hm2); Table S7: Carbon flow matrix of “ecological-production-living” space in Yulin from 2010 to 2020 (104 t).

Author Contributions

Conceptualization, L.L. and F.Q.; methodology, L.L. and X.Y.; software, L.L. and Z.G.; validation, L.L. and J.L.; formal analysis, L.L. and J.L.; investigation, L.L. and C.Z.; resources, L.L. and Y.B.; data curation, L.L. and X.Y.; writing—original draft preparation, L.L.; writing—review and editing, Y.B., X.Y., Z.G., F.Q., J.L. and C.Z.; visualization, L.L. and C.Z.; supervision, Y.B.; project administration, Y.B.; funding acquisition, Y.B. All authors have read and agreed to the published version of the manuscript.

Funding

This research was funded by “the National Natural Science Foundation of China, grant number 40771054”; “the Key R&D Program of Gansu Province, grant number 18YF1FA052”; “the Research Fund for the Doctoral Program of Higher Education of China, grant number 20106203110002”.

Institutional Review Board Statement

Not applicable.

Informed Consent Statement

Not applicable.

Data Availability Statement

Not applicable.

Conflicts of Interest

The authors declare no conflict of interest.

References

  1. Zhang, W.; Duan, X. The research progress in the relationship among economic growth, industrial structure, and carbon emissions. Prog. Geogr. 2012, 31, 442–450. [Google Scholar]
  2. He, W.J.; Zhang, B. A comparative analysis of Chinese provincial carbon dioxide emissions allowances allocation schemes in 2030: An egalitarian perspective. Sci. Total Environ. 2021, 765, 142705. [Google Scholar] [CrossRef] [PubMed]
  3. Liu, X.P.; Wang, S.J.; Wu, P.J. Impacts of urban expansion on terrestrial carbon storage in China. Environ. Sci. Technol. 2019, 53, 6834–6844. [Google Scholar] [CrossRef] [PubMed]
  4. Abbasi, M.A.; Parveen, S.; Khan, S.; Kamal, M.A. Urbanization and energy consumption effects on carbon dioxide emissions: Evidence from Asian-8 countries using panel data analysis. Environ. Sci. Pollut. Res. 2020, 27, 18029–18043. [Google Scholar] [CrossRef] [PubMed]
  5. Hong, C.; Burney, J.A.; Pongratz, J.; Nabel, J.; Mueller, N.D.; Jackson, R.B.; Davis, S.J. Global and regional drivers of land-use emissions in 1961–2017. Nature 2021, 589, 554–561. [Google Scholar] [CrossRef] [PubMed]
  6. Friedlingstein, P.; Houghton, R.A.; Marland, G.; Hackler, J.; Boden, T.A.; Conway, T.J.; Canadell, J.G.; Raupach, M.R.; Ciais, P.; Le Quéré, C. Update on CO2 emissions. Nat. Geosci. 2010, 3, 811–812. [Google Scholar] [CrossRef]
  7. Pacheco-Torres, R.; Roldán, J.; Gago, E.J.; Ordóñez, J. Assessing the relationship between urban planning options and carbon emissions at the use stage of new urbanized areas: A case study in a warm climate location. Energy Build. 2017, 136, 73–85. [Google Scholar] [CrossRef]
  8. Zhang, R.; Matsushima, K.; Kobayashi, K. Can land use planning help mitigate transport-related carbon emissions? A case of Changzhou. Land Use Policy 2018, 74, 32–40. [Google Scholar] [CrossRef]
  9. Xu, W. The connotation, relationship and optimization path of “ecological-production-living” space. Dongyue Trib. 2022, 43, 126–134. [Google Scholar]
  10. Li, J.; Sun, W.; Yu, J. Change and regional differences of production-living-ecological space in the Yel-low River Basin: Based on comparative analysis of resource-based and non-resource-based cities. Resour. Sci. 2020, 42, 2285–2299. [Google Scholar]
  11. Dou, Y.; Ye, W.; Li, B.; Liu, P. Tourism adaptability of traditional village based on living-production-ecological spaces: A case study of Zhangguying Village. Econ. Geogr. 2022, 42, 215–224. [Google Scholar]
  12. Hu Jintao’s Report at the Eighteenth National Congress of the Communist Party of China. Available online: http://www.gov.cn/ldhd/2012-11/17/content_2268826.htm (accessed on 29 September 2022).
  13. Li, G.; Fang, C. Quantitative function identification and analysis of urban ecological-production-living spaces. Acta Geogr. Sin. 2016, 71, 49–65. [Google Scholar]
  14. Du, J.; Fu, J.; Hao, M. Analyzing the carbon metabolism of “Production-Living-Ecological” space based on ecological network utility in Zhaotong. J. Nat. Resour. 2021, 36, 1208–1223. [Google Scholar] [CrossRef]
  15. Eduardo, B.S.L.; Luís, F.M.N.; José, A.P.O. Carbon accounting approaches and reporting gaps in urban emissions: An analysis of the Greenhouse Gas inventories and climate action plans in Brazilian cities. J. Nat. Resour. 2020, 245, 118930. [Google Scholar] [CrossRef]
  16. Mark, S. Updated potential soil carbon sequestration rates on U.S. agricultural land based on the 2019 IPCC guidelines. Soil Tillage Res. 2020, 204, 104719. [Google Scholar] [CrossRef]
  17. Liang, X.; Fan, M.; Xiao, Y.; Yao, J. Temporal-spatial characteristics of energy-based carbon dioxide emissions and driving factors during 2004–2019, China. Energy 2022, 261, 124965. [Google Scholar] [CrossRef]
  18. Maurizio, C.; Maria, A.C.; Sonia, L. Energy-related GHG emissions balances: IPCC versus LCA. Sci. Total Environ. 2018, 628, 1328–1339. [Google Scholar]
  19. Ma, Y.; Shang, Y.; Fen, Y. Analysis on influence of spatial factors on carbon emissions of communities in Northern China: Taking Yantai as an example. Urban Dev. Stud. 2022, 29, 118–124. [Google Scholar]
  20. Kong, L.; Shi, Z.; Chu, L.M. Carbon emission and sequestration of urban turfgrass systems in Hong Kong. Sci. Total Environ. 2014, 473, 132–138. [Google Scholar] [CrossRef]
  21. Francisco, E.; Sebastian, V.; Wayne, Z. Analyzing the efficacy of subtropical urban forests in offsetting carbon emissions from cities. Environ. Sci. Policy 2010, 13, 362–372. [Google Scholar]
  22. Li, J.; Huang, G.; Liu, L. Ecological network analysis for urban metabolism and carbon emissions based on input-output tables: A case study of Guangdong province. Ecol. Model. 2018, 383, 118–126. [Google Scholar] [CrossRef]
  23. Breetz, H.L. Regulating carbon emissions from indirect land use change (ILUC): U.S. and California case studies. Environ. Sci. Policy 2017, 77, 25–31. [Google Scholar] [CrossRef]
  24. Xia, C. Multi-Scale Studies on Urban Carbon Metabolism from the Perspective of Land Use and Scenario Analysis of Emission Reduction. Ph.D. Thesis, Zhejiang University, Hangzhou, China, 2019. [Google Scholar]
  25. Xia, L.; Zhang, Y.; Yu, X.; Li, Y.; Zhang, X. Hierarchical structure analysis of urban carbon metabolism: A case study of Beijing, China. Ecol. Indic. 2019, 107, 105602. [Google Scholar] [CrossRef]
  26. Zhang, Y.; Xia, L.; Fath, B.D.; Yang, Z.; Yin, X.; Su, M.; Liu, G.; Li, Y. Development of a spatially explicit network model of urban metabolism and analysis of the distribution of ecological relationships: Case study of Beijing, China. J. Clean. Prod. 2016, 112, 4304–4317. [Google Scholar] [CrossRef]
  27. Zou, K.; Shu, Y.; Li, G.; Yan, Q.; Bao, Y.; Zhang, S.; Zhang, D. Urban Land-carbon Framework Construction Based on Ecological Network Analysis and Its Space-time Evolution Research. J. Ecol. Rural Environ. 2022, 38, 972–982. [Google Scholar]
  28. Lin, G.; Jiang, D.; Fu, J.; Cao, C.; Li, X.; Li, Z.; Huang, S. Carbon flow analysis for production-living-ecological space: A case study of Tangshan, China. Sci. Technol. Rev. 2020, 38, 107–114. [Google Scholar]
  29. Zhang, H.; Xu, E.; Zhu, H. An ecological-living-industrial land classification system and its spatial distribution in China. Resour. Sci. 2015, 37, 1332–1338. [Google Scholar]
  30. Kong, D.; Chen, H.; Wu, K. The evolution of “Production-Living-Ecological” space, eco-environmental effects and its influencing factors in China. J. Nat. Resour. 2021, 36, 1116–1135. [Google Scholar] [CrossRef]
  31. Hu, W.; Wang, L.; Shu, M. Reflections on delimiting the three basic spaces in the compilation of urban and rural plans. City Plan. Rev. 2016, 40, 21–26. [Google Scholar]
  32. Jiang, D.; Lin, G.; Fu, J. Discussion on scientific foundation and approach for the overall optimization of “Production-Living-Ecological” space. J. Nat. Resour. 2021, 36, 1085–1101. [Google Scholar] [CrossRef]
  33. Tian, Y.; Zhang, J. Regional differentiation research on net carbon effect of agricultural production in China. J. Nat. Resour. 2013, 28, 1298–1309. [Google Scholar]
  34. Wang, S.; Tian, S.; Cai, Q.; Wu, Q. Driving factors and carbon transfer of industrial carbon emissions in Guangdong province under the background of industrial transfer. Geogr. Res. 2021, 40, 2606–2622. [Google Scholar]
  35. Fang, J.; Guo, Z.; Pu, S.; Chen, A. Estimation of carbon sinks in China′s terrestrial vegetation from 1981 to 2000. Sci. China Ser. D 2007, 37, 804–812. [Google Scholar]
  36. Lai, L. Research on Carbon Emission Effects of Land Use in China. Ph.D. Thesis, Nanjing University, Nanjing, China, 2010. [Google Scholar]
  37. Duan, X.; Wang, X.; Lu, F.; Ouyang, Z. Carbon sequestration and its potential by wetland ecosystems in China. Acta Ecol. Sin. 2008, 28, 463–469. [Google Scholar]
  38. Wei, J.; Xia, L.; Chen, L.; Zhang, Y.; Yang, Z. A network-based framework for characterizing urban carbon metabolism associated with land use changes: A case of Beijing city, China. J. Nat. Resour. 2022, 371, 133695. [Google Scholar] [CrossRef]
  39. Xia, C.; Li, Y.; Ye, Y.; Shi, Z.; Liu, J.; Li, X. Analyzing urban carbon metabolism based on ecological network utility: A case study of Hangzhou City. Acta Ecol. Sin. 2018, 38, 73–85. [Google Scholar]
Figure 1. Technical diagram to construct a low-carbon land use management framework. Note: F represents woodland; G represents grassland; W represents water; B represents unused land; C represents cultivated land; I represents industrial, mining and transportation land; U represents urban land; R represents rural residential land.
Sustainability 14 13854 g001
Figure 2. Study area.
Sustainability 14 13854 g002
Figure 3. Carbon flow network. Note: Green represents positive carbon flow, red represents negative carbon flow, and the darker the color, the greater the flow.
Sustainability 14 13854 g003
Figure 4. Spatial distribution of net carbon flow in “ecological-production-living” space of Yulin City from 2010 to 2020.
Sustainability 14 13854 g004
Figure 5. Ecological relationships between components of “ecological-production-living” space.
Sustainability 14 13854 g005
Figure 6. Spatial distribution of ecological relationships.
Sustainability 14 13854 g006
Figure 7. Management and control units of “ecological-production-living” space in Yulin.
Sustainability 14 13854 g007
Table 1. The “ecological-production-living” space classification.
“Ecological-Production-Living” SpaceLand Use Type and Code
Ecological spaceWoodland (F)
Grassland (G)
Water (W)
Unused land (B)
Production spaceCultivated land (C)
Industrial, mining and transportation land (I)
Living spaceUrban land (U) 1
Rural residential land (R) 2
1 Urban land refers to the land within the scope of planned city proper. 2 Rural residential land refers to the rural settlements independent of the town. Information source is the remote sensing monitoring data of land use types in China from Resource and Environment Science and Data Center of the Chinese Academy of Sciences (http://www.resdc.cn/Datalist1.aspx?FieldTyepID=1,3, accessed on 5 January 2022).
Table 2. Carbon emissions and carbon sinks of “ecological-production-living” land in Yulin (×104 t).
Land Use Type20102020
Carbon EmissionsCarbon SinksCarbon EmissionsCarbon Sinks
C26.54119.2335.04192.26
F 1349.03 1411.92
G 3.93 4.00
W 1.37 1.18
U12.55 16.11
R15.16 12.92
I8524.81 38,219.30
B 0.02 0.02
Sum8579.071473.5938,283.361609.38
Publisher’s Note: MDPI stays neutral with regard to jurisdictional claims in published maps and institutional affiliations.

