Abstract
The rapid rise of working-from-home practices has led to a paradigm shift in the way many workers interact with cities, with major potential impacts on sustainability, health, and quality of life. Whilst the technology responsible for this shift is not new, the disruptive way that it is now interfacing with workplaces, homes, cities, and society is both novel and profound. To inform an understanding of the implications of this change, this article provides survey data from Sydney, Australia, on drivers, and patterns of behaviour linked with the change. Furthermore, we use of the Theory of Planned Behaviour to successfully interrogate what drives intentions, attitudes, norms, and competencies. We also provide data on the influence of job type and emerging employer attitudes. These data and analyses provide a unique contribution to the growing body of knowledge about working from home and builds potential for prediction of its prevalence across cities. This can inform updates of urban planning, infrastructure investment decisions, and to identify how this practice can be best supported, in a way that promotes sustainability outcomes.
1. Introduction
The practice of working from home (WFH) is not new, with the concept of teleworking dating back to at least as early as 1973 [1] and many studies on the topic having been undertaken over the years, for example [2,3,4,5,6].
The terms WFH, telework, and hybrid work are often used inter-changeably but are not the same. Teleworking is defined as the “work-related substitution of telecommunications and related information technologies for travel” [7] (p. 301). Sometimes telework occurs in the home whilst at other times it may be working remotely in a different location. Hybrid work on the other hand “combines a mix of working from home/remotely at least 25% of the time, with working from a traditional workplace such as an office” [8] (p. 3).
Despite a considerable early expectation, in the 1970s and 1980s, of high rates of adoption of telework, it did not become popular in a major way for a long time. For example, in Australia, the census in 2016 (the last one before the COVID-19 pandemic) found that only 4.6% of the population worked from home on a regular basis [9]. This changed of course with the COVID-19 pandemic, which forced many office workers around the world to start working from home. Therefore, it is perhaps not unsurprising given that the COVID-19 pandemic and associated lockdowns have been called the “world’s biggest WFH experiment” [8]. Many have argued that this experience has entrenched the behaviour and is likely to lead to the practice becoming significantly more common in the future [10,11]. Latest estimates suggest only 22.9% of Australian knowledge workers have returned to the office on a full-time basis, and they are now happier working like this, compared with their pre-pandemic work arrangements [12].
From a sustainability perspective, this scenario offers both opportunities and risks, but if embedded carefully in a holistic manner into the ways cities are built and workplaces are managed, then it may be a pathway towards less private car travel as well as progress towards a range of other Sustainable Development Goals [8,13]. The most reported set of benefits of WFH practices relates to reduced traffic congestion, emissions, and reduced travel times, all associated with reduced private car travel. However, there are also profound impacts on health, equity, quality of life, infrastructure, and workplace relations. It is worth noting here that a reduction of car travel is not always observed, and in many circumstances it can lead to increased car travel due to changes in household travel behaviours [14]. In fact, the largest net benefits are observed in non-sprawling cities with already lower rates of car dependence, and where the WFH practices are generally for at least 2 or 3 days per week [15,16]. This may explain at least in part why during the COVID-19 there was a very significant reduction in travel and air pollution [17], at least some of which could be attributed to WFH practices [18]. What this tells us, is that to achieve positive sustainability outcomes, it will be important that telework is well understood, especially in the current context of how it now interfaces with household and work practices, so that we can adapt cities, workplaces, households, and other infrastructure to support it.
An important and only partially answered question is whether the practice of working from home is likely lead to the practice being entrenched in the future. To start developing knowledge to understand this issue, there are a few papers that have explored the predictors of WFH practices at various times and places. In the context of Sydney during the COVID-19 lockdowns, surveys and regression modelling were used to explore the predictors of whether workers adopted the practice during the lockdowns [19,20], finding that job type, having an appropriate space to WFH, prior positive experience of WFH, perceived benefits of WFH and employer attitudes all contributed to explaining the propensity of behaviour. Several articles have explored the outcomes of WFH practices, for example in relation to health [21,22,23], productivity [24,25], social issues [26,27,28,29], smart cities [30], and the environment [31,32,33].
This level of context-dependence and complex dynamics indicates a need to better understand what it is that drives WFH practices, and in what circumstances WFH practices lead to benefits or risks. Specifically, how does telework affect human-urban-building interaction, personal preferences, employment opportunities, housing stock, utilities, and transport planning to generate a change in outcomes? Perhaps a perfect illustration of this is a statement by Elldér [34] (p. 187) “Telework allows various mobility strategies that together foster more spatially heterogeneous daily travel behaviour, more dependent on personal attributes than on the home location relative to the workplace. Planners and policymakers should monitor whether the number of teleworkers continues to increase. If so, traditional distance-and location-based models and policies for predicting and planning transport may prove less accurate and effective than currently assumed.”
In this article, we explored the relationship between people and WFH practice in the later stages of the COVID-19 pandemic (late 2021) in Sydney, Australia. Specifically, we explored what factors influenced people’s experience of WFH practice, to what extent WFH has impacted on self-reported health, productivity, and wellbeing; and to what extent people thought they were likely to continue the practice after the pandemic. We also recognised that the local context is important when answering such questions and that it is plausible that other jurisdictions would provide different results, especially given the large variety in responses to the COVID-19 pandemic, which has strongly shaped experiences.
1.1. Literature Review of Factors That Drive the Decision to WFH
Several studies have explored the factors that drive the attitudes, intentions, and behaviours relating to WFH. For example, Ton et al. [35] used a model whereby attitudes (towards WFH), socio-demographics, and employer policies determined behaviour and intention to WFH. Previous articles have variously focused on attitudes, intentions, opportunity, norms and/or preferences to WFH.
Baruch and Nicholson [36] argued that to WFH, four factors needed to align: the nature of the work, individual preferences and beliefs, family and home situation, and finally the organisational support and culture.
Jain, et al. [11] used the Theory of Planned Behaviour (TPB), as described by Ajzen [37], to describe the intention to WFH in the future, whereby the intention was determined by a combination of attitudes (what the individual thinks about the behaviour), subjective norms (what others think of the behaviour) and perceived behavioural control (whether the behaviour is perceived as easy or difficult to carry out, based on experience as well as anticipated difficulties).
Barbour et al. [38] utilised a ‘stated preference’ survey to estimate what proportion of the workforce intended to WFH after the pandemic, finding that about half of the surveyed population would continue to WFH even when allowed to return to the workspace. They found that socio-demographic/residential location variables as well as job-sector variables influenced the frequency of intention.
Stefaniec et al. [39] explored data from Ireland in 2021, to find that attitudes to WFH had been positively impacted by the experience to WFH during the COVID-19 pandemic, and that this change in attitudes was correlated with a change in the intent to WFH. The article by Stefaniec et al. also highlighted the propensity of those that WFH to consider relocation.
Rose and Brown [40] also explored attitudes in the manufacturing sector in South Korea, and found that the forced adoption of WFH during the COVID-19 had a statistically significant positive effect on attitudes towards WFH amongst managers.
Nguyen [41], in Vietnam, found that the prior experience with WFH and factors associated with job type and employer attitudes were significantly influences to the perception and attitudes towards WFH.
Kitagawa and colleagues [42] found that the shift towards telework had drastically shifted how people work, and that there were greater productivity losses amongst those who worked from home, but that those changes were associated with poor WFH setups. Furthermore, WFH was associated with better mental health outcomes.
Several studies found that commuting distance, especially a very long commute, has an influence on decisions and attitudes in relation to WFH [39,41,43,44].
1.2. Knowledge Contribution
Drawing on the above studies we adopted a conceptual framing of what drives the intention to WFH based on an extension of TPB, which describes the intention to WFH, but where we also considered the opportunity to WFH based on three factors: job type, support from the employer, and having an enabling home and family situation.
Based on this we explored the following Research Questions (RQs):
- Intention: To what extent has the experience of working from home during the COVID-19 pandemic increased the propensity of intention to work from home in the future? Associated hypothesis, H1: The intention to WFH has increased significantly because of the recent COVID-19 pandemic the associated policy measures.
- Attitude: has the experience of working from home during the COVID-19 pandemic been perceived to be more beneficial than detrimental for individuals? Associated hypothesis, H2: Attitude is positively associated with the intention to WFH.
- Norms: to what extent do norms (i.e., other people’s opinions about the practice) support WFH practices in the future? Associated hypothesis, H3: Subjective norms are positively associated with the intention to WFH.
- Behavioural control: to what extent do workers feel like they can carry out WFH practices in the future in a way that achieves their personal goals? Associated hypothesis, H4: Perceived Behavioural Control is positively associated with the intention to WFH.
- Opportunity: to what extent do workers have the opportunity to adopt WFH practices in the future? Associated hypothesis, H5: Opportunity is positively associated with the intention to WFH.
To explore these topics, this article presents data and analysis, based on a survey of 2539 respondents, in the context of Sydney, Australia, where most workers who could WFH did so during the lockdowns. The timing of the survey was at a critical time, just as restrictions were eased, after a prolonged time of extended WFH practices for a large proportion of the working population. Whilst other studies have also reported on similar data [11,35,38,45,46,47,48,49,50], what stands out about these data are their comprehensiveness in terms of social psychology, which is perhaps only rivalled by the study by Jain et al. [11].
Importantly, this paper provides additional contextual knowledge on this topic, providing a basis for understanding both the local and the systemic patterns of the phenomenon. This will be critically important for planning societies, especially transport systems and cities. These insights also have important sustainability implications [8].
2. Methods
2.1. Data Collection
A survey was administered using Qualtrics and distributed by means of a third-party panel data collection agency (The Online Research Unit, https://www.theoru.com/index.htm), with a points-based system to incentivise and reward participation.
This sampling methodology was chosen because we had no means of recruiting a large enough sample through direct contacts (mail, in-person, etc.), especially in a way that would achieve a representative sample. The benefits of partnering with a professional panel data collection agency, to help with recruitment and survey distribution, was the access to a large set of appropriate participants, and the option to use quotas for different groups.
We targeted participants across the Sydney Metropolitan Region (incl. the Illawarra and Blue Mountains areas) who were over 18 years old, and participants could opt out at any time. There were a set of screening criteria to filter out those that did not meet the criteria. We also included quotas based on education, gender, and age. The research design, questions and recruitment approach were approved by the Research Ethics Office (approval number, 20215905-8292).
A summary of the participant demographics, housing and socio-economic distributions is shown in Table 1. The spatial distribution of respondents is shown in Figure 1. The list of survey questions is available in Supplementary Materials. Overall, 1277 participants completed only the first part of the survey, whilst a further 1262 participants completed both the first and second parts of the survey (making a total of 2539 respondents).

Table 1.
Summary statistics of survey respondents.
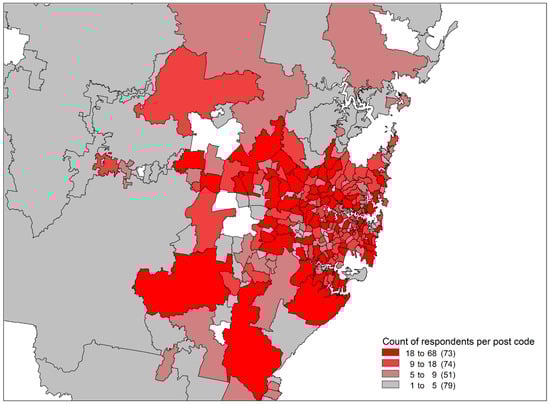
Figure 1.
Distribution of respondents per postcode across the Greater Sydney Region.
The survey was pilot tested on colleagues with various experiences in urban planning and design, logistics and transport, health sciences, as well as personal experience with working from home. The survey could be accessed both on a mobile phone or a computer.
The sample size was chosen on the basis of attempting to achieve a representative sample, using the Taro Yamane equation [51,52], across the region which has a working population of approximately 2,500,000, and a chosen margin of error of 2%. This suggested a sample size of 2500.
The survey took participants between 15–25 min to complete and was open during October and November 2021. This coincided closely with lockdowns and restrictions significantly easing in the Sydney region, and the 11th October was locally dubbed “Freedom Day”, when most restrictions were removed for those who were fully vaccinated at that time. This, however, also coincided with relatively low levels of COVID-19 transmission in the community, although this was followed by another rapid rise in COVID-19 cases from December 2021 onwards. This timing, therefore, signified both the recent experience of working from home, as well as the new-found freedom to return to the workplace, even for those who were previously restricted.
The first part of the survey included questions concerning:
- Socio-demographic characteristics,
- Employment status and job type,
- Commuting patterns to and from work, and
- Working from home.
The second part of the survey focused on:
- experiences of working from home,
- perceptions and satisfaction of working from home,
- home suitability for working from home,
- additional socio-demographic characteristics,
- employer support for working from home,
- change in the water consumption, and
- implications for local areas/neighbourhoods.
2.2. Analytical Approach
The Theory of Planned Behaviour (TPB) was used as a conceptual lens for exploring the data, and we followed these steps in the analysis:
- Exploring the intent to WFH:
- a.
- We cross-tabulated the intent to WFH against experience of WFH prior to COVID-19, as this helped us assess the likely step change in behaviour. Furthermore, we used a hypothesis test to show that the intentions to WFH have changed in a manner that was statistically significant.
- b.
- We also explored the distribution of how much that workers hoped to WFH in the future, to get an idea of the likely future frequency of this behaviour.
- Exploring the psycho-social factors that form the TPB, i.e., the attitude, subjective norms, and perceived behavioural control associated with TPB:
- a.
- We tabulated and summarised the responses for each of the questions in the survey associated with these factors.
- b.
- We calculated a correlation matrix showing the Pearson correlation between each of the variables in each of the factors.
- c.
- We calculated the Cronbach Alpha value, showing the internal consistency of the variables that feed into each factor. Note that a value higher than 0.7 is considered acceptable here.
- d.
- We created a histogram of the factor, to illustrate the empirical distribution as per the data.
- We used Ordinary Least Square Regression to explore the TPB factors as determinants of the intent to WFH. We explored three models here:
- a.
- A model where the three main factors of the TPB explains the intent.
- b.
- A model where the three main factors of the TPB and prior experience explains the intent.
- In acknowledgment that it was not just intention, but also the practical nature of the work that determined the chances of being able to WFH, we cross-tabulated job types against intention, feasibility, subjective norm, perceived behavioural control and attitudes.
Furthermore, all the variables for Attitude, Subjective Norms, and Perceived Behavioural Control explored in this survey were on a simple scale of “Yes”, “Do not know”, “No”; or “Not applicable”. To calculate Cronbach’s Alpha, create constructs, and estimate correlation coefficients, each of the variables were translated into numeric form based on a scale of 0–100. For some questions: Yes = 100, No = 0, Do not know = 50, Not applicable = 50; and for other questions Yes = 0, No = 100, Do not know = 50, Not applicable = 50.
2.3. Statistical Analysis Methods
The statistical analysis was undertaken using the software Scientific Python Development Environment (Spyder) version 4.01 through the Anaconda distribution of the Python languages. Methods were chosen based on the following:
- To test the hypothesis that intentions to WFH had changed because of the experiences during COVID lockdowns, we used a Chi-Square test to explore the association between two ordinal variables.
- We used Cronbach’s Alpha to evaluate the internal consistency of the variables included in each of the three constructs that determine intention. In other words, to assess whether different measures of the same construct provided similar results. A Cronbach’s Alpha of above 0.7 is acceptable.
- To explore the relationship between variables, we used the Pearson correlation coefficient. We had a mix of ordinal, and binary data, and therefore Spearman rank correlations could have also been used, which involves an additional transformation before calculating the Pearson coefficient (our coding is a de-facto ranking system). When the Pearson correlation coefficient is calculated on two binary variables, it is referred to as a Phi coefficient.
- To evaluate the influence of attitudes, perceived behavioural control and subjective norms, on the intention to WFH, we used Ordinary Least Square regression as it provides a simple linear equation to describe the relationship. We had no evidence to suggest a non-linear relationship between variables and we chose the simplest possible explanation.
- To check for issues associated with multi-collinearity between independent variables, we checked for Variance Inflation Factors (VIF), as is standard practice in regression modelling.
- The data from the survey were a mix of ordinal and binary scales, for the most part based on Likert scales. These were in most cases coded to a numeric scale between 0 and 1, with equal spacing based on the ranking for most ordinal scales. Further details on relevant scales are provided in each of the tables.
3. Results
3.1. Intention to WFH in the Future
The intention to WFH in the future was explored through the question “After the COVID-19 crisis, what proportion of your work do you hope to do from home?”, and to put this intention into context, we cross-tabulated it against responses to the question “Prior to the COVID-19 restrictions starting in Australia (March 2020), what proportion of your work did you do at home?”. This helped us answer the research question “Has working from home during the COVID-19 pandemic increased the community’s preferences to work from home?”.
The data in Table 2, shows the responses to the two different survey questions, that used the same Likert scale. This provided ordinal data (a ranked set of options), and change is defined as indication of intention to WFH more than they have in the past (evaluated by comparing the responses on the Likert scale which is the same), and to summarise key insights from Table 2:
Table 2.
Changes in the intention to WFH (n = 1273) among those who can.
- 66% of respondents wanted to do more WFH than they previously had (on the bottom left corner of the table, under the diagonal),
- 29% wanted to do the same amount of WFH as before (along the diagonal, i.e., the numbers in bold),
- 6% wanted to do less WFH than before (the top right corner, above the diagonal).
Using a Chi-Square test, this was statistically significant at the p < 0.00001 level, showing that it was statistically confirmed that the experiences of WFH during the COVID-19 pandemic led to an increase in the intentions to WFH in the future. This confirms hypothesis H1.
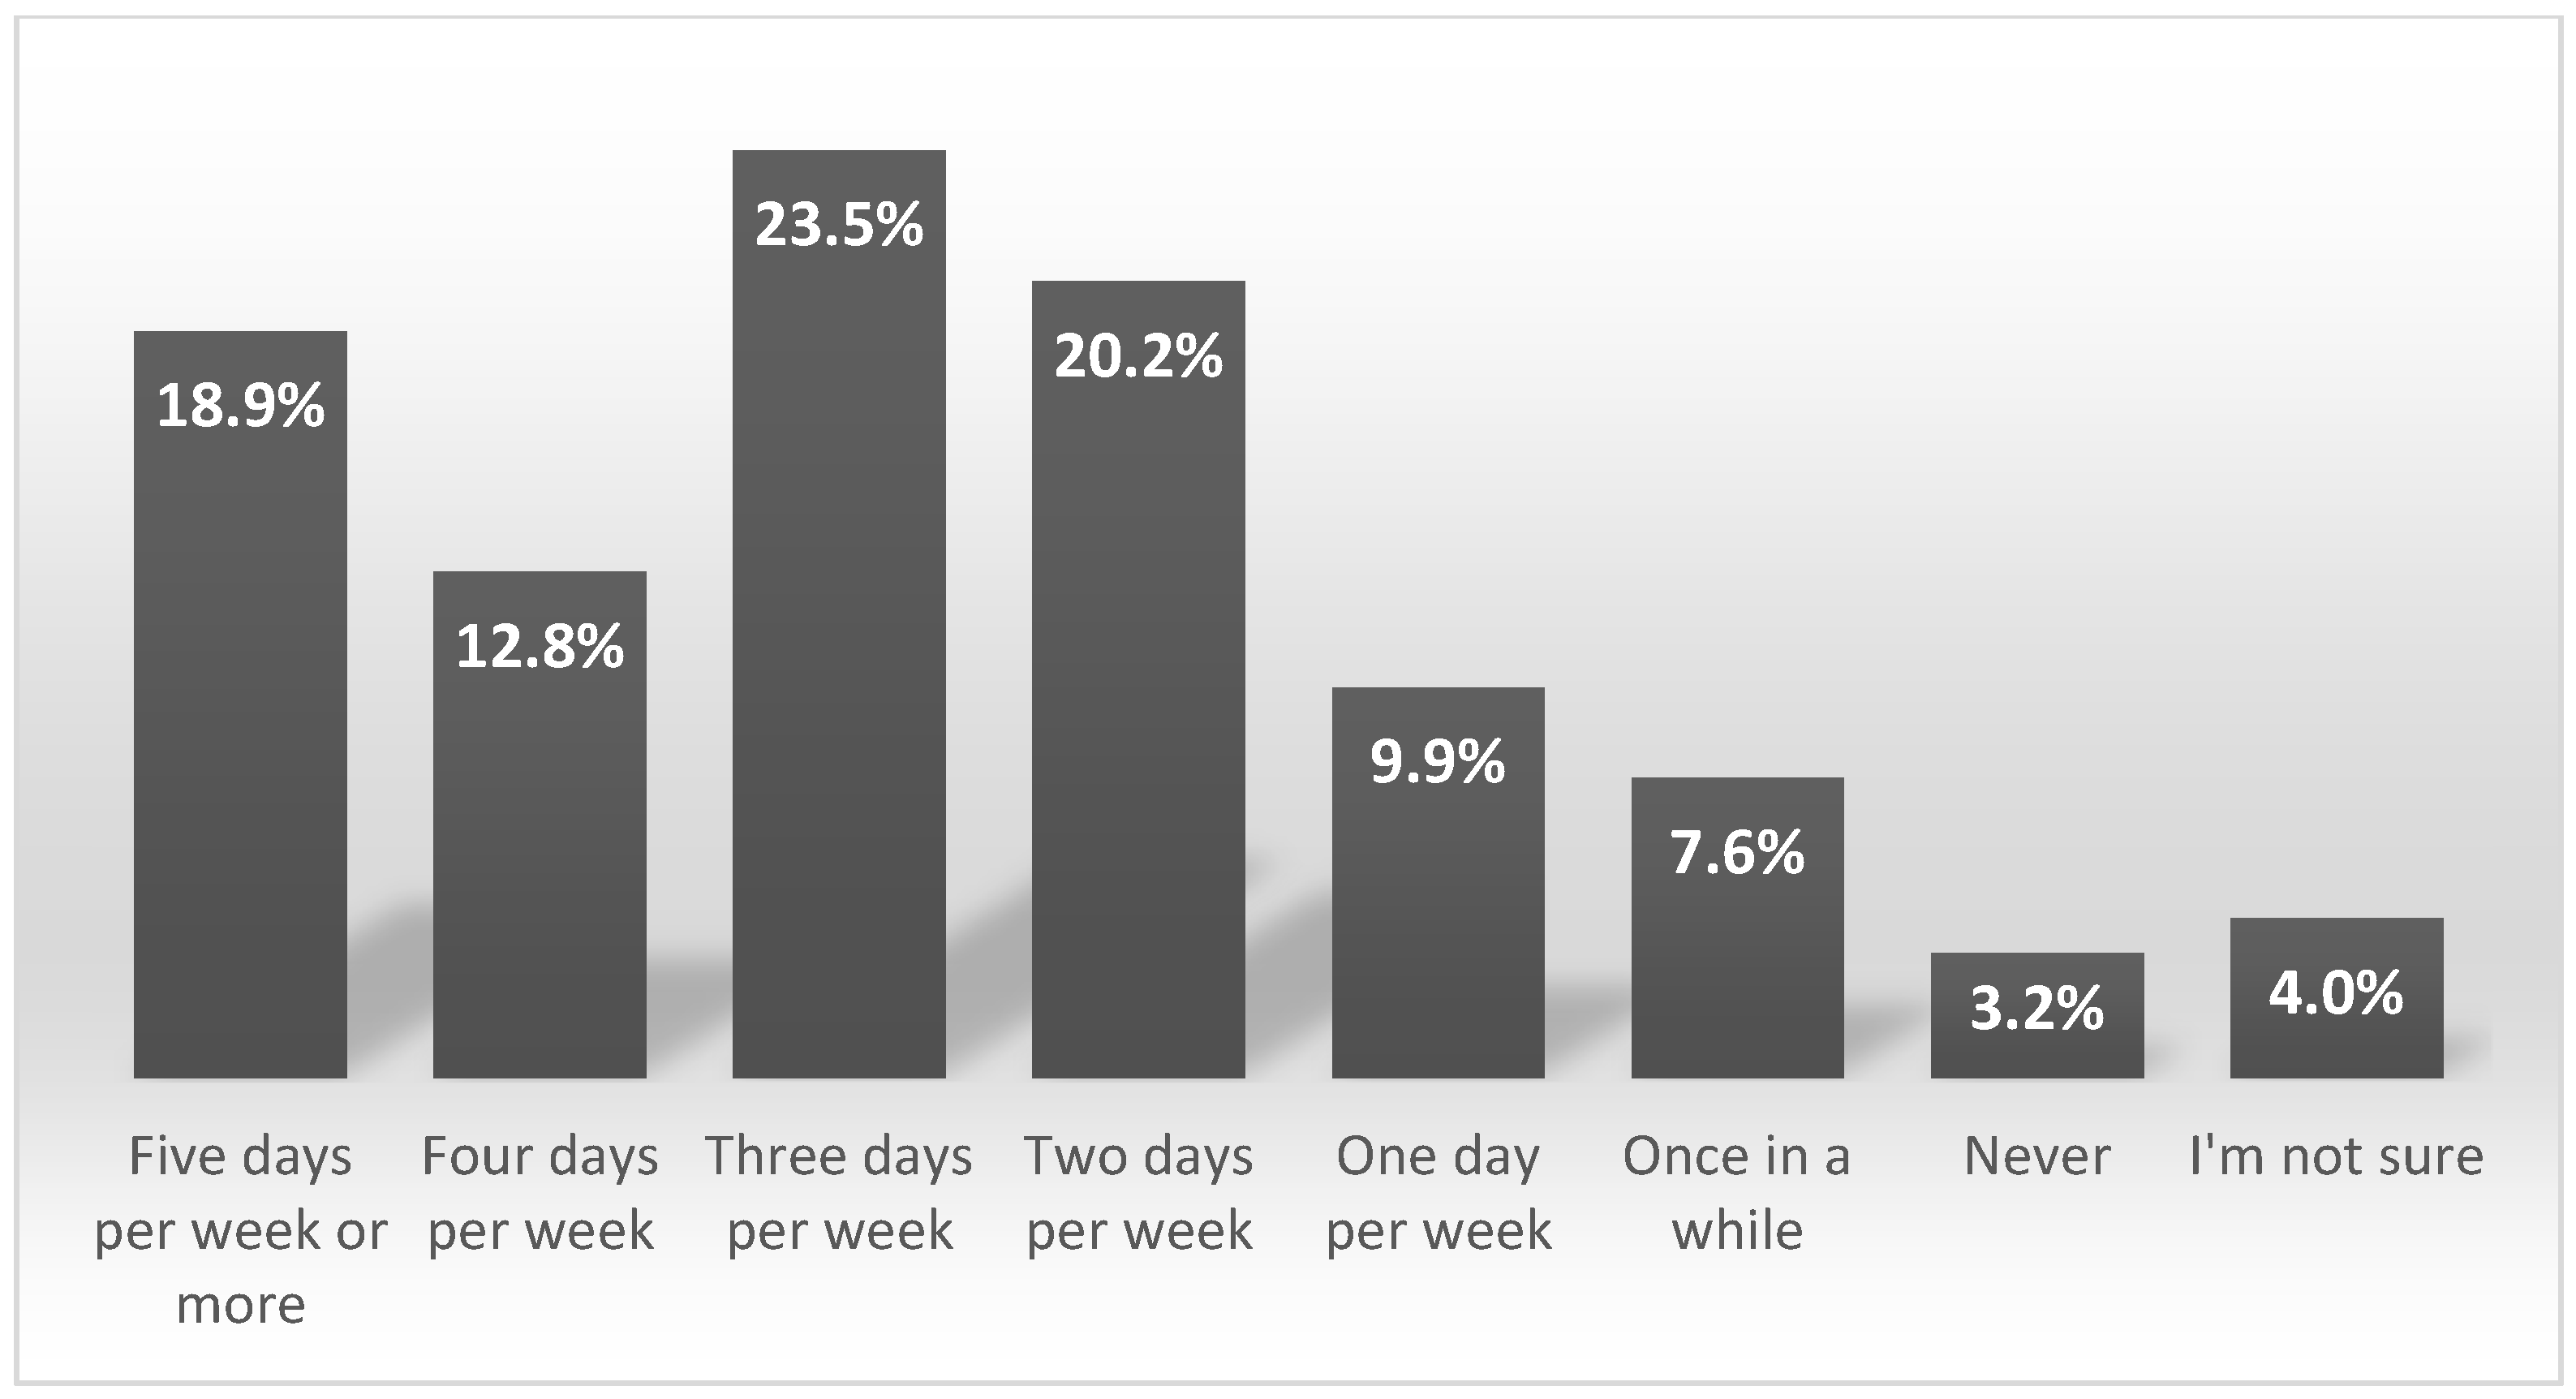
We also noted that 36% of respondents wanted to WFH ‘a great deal’, and only 8% did not want to WFH. Given that only 8% workers who could WFH did not want to do so in the future, the question was how much did workers want to WFH? To answer this question, Figure 2 shows the distribution of number of days per week that these same workers would like to WFH. A total of 85% indicated they wished to WFH at least one day per week in the future, with only 3% expressing a preference to never WFH, although as many as 7.6% indicated they only wanted to WFH once in a while. Using this distribution of preferences, the average number of days that these workers want to WFH was 2.8 days per week (the response “once in a while” was here coded as once every four weeks, although if coded as once a fortnight the average was still rounded to 2.8).

Figure 2.
When we return to COVID-normal, how often would you like to work from home on average? n = 1265 (i.e., among those that worked from home at all during the pandemic lockdowns).
3.2. Attitude
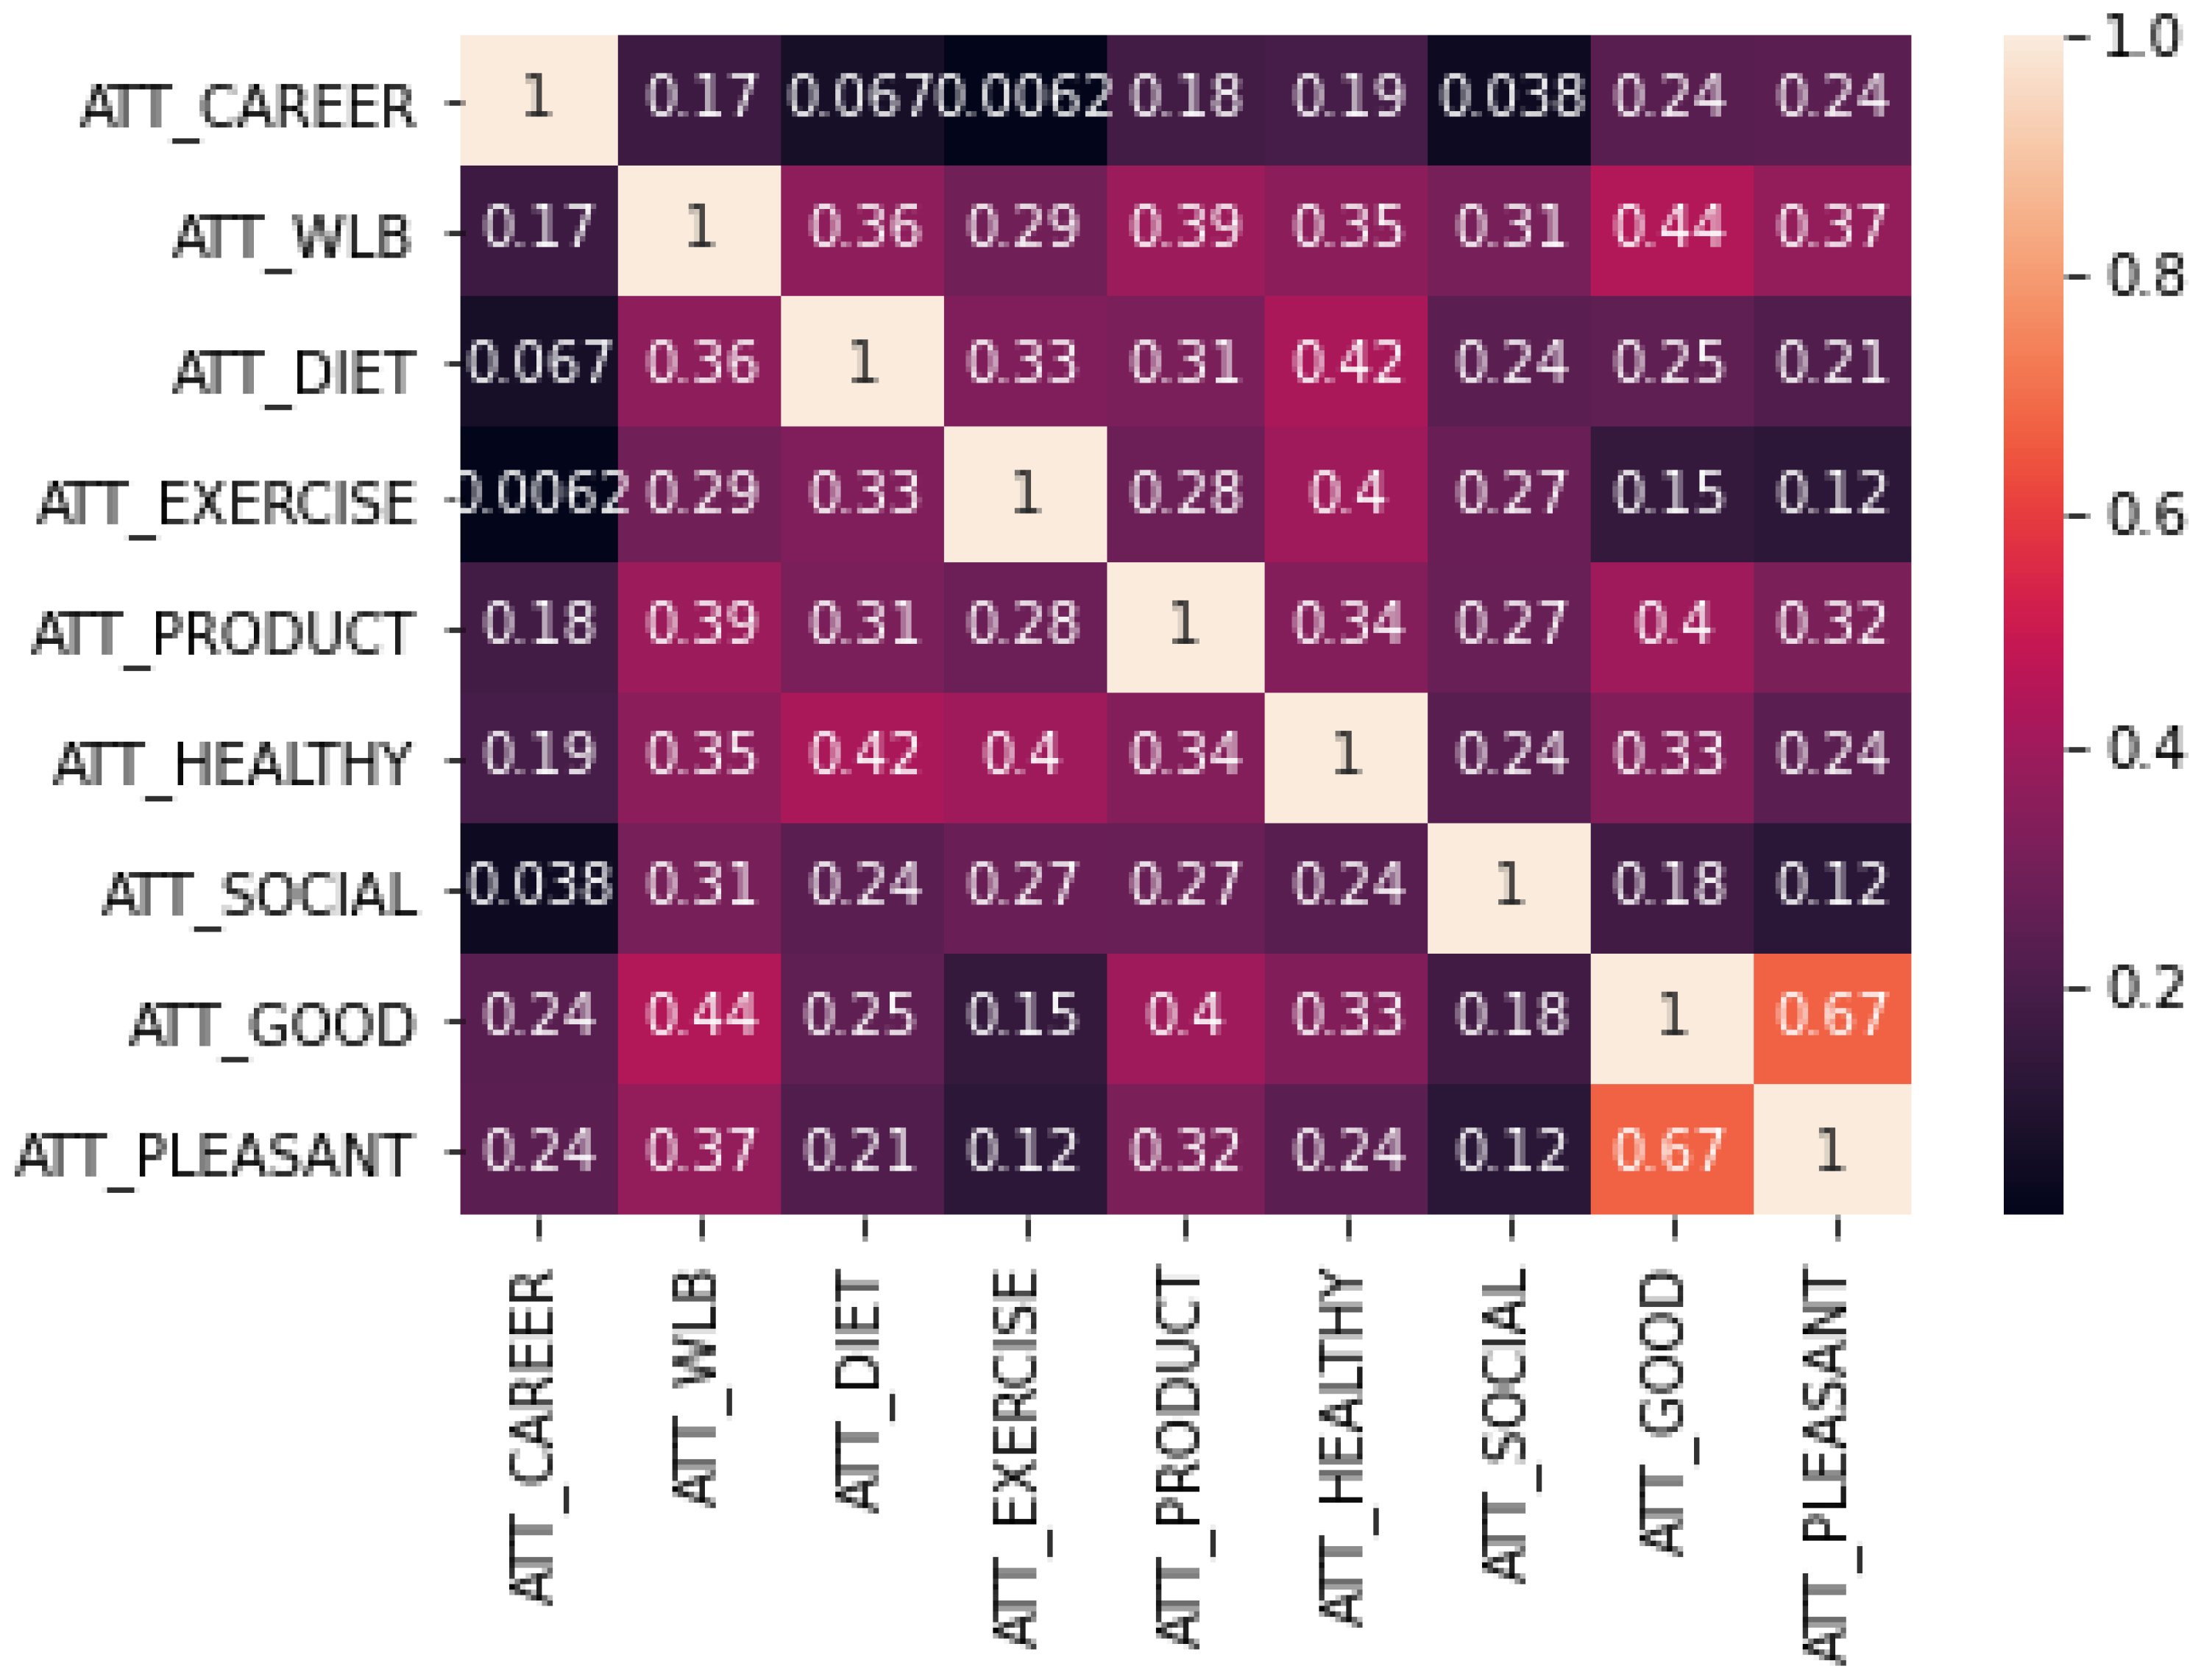
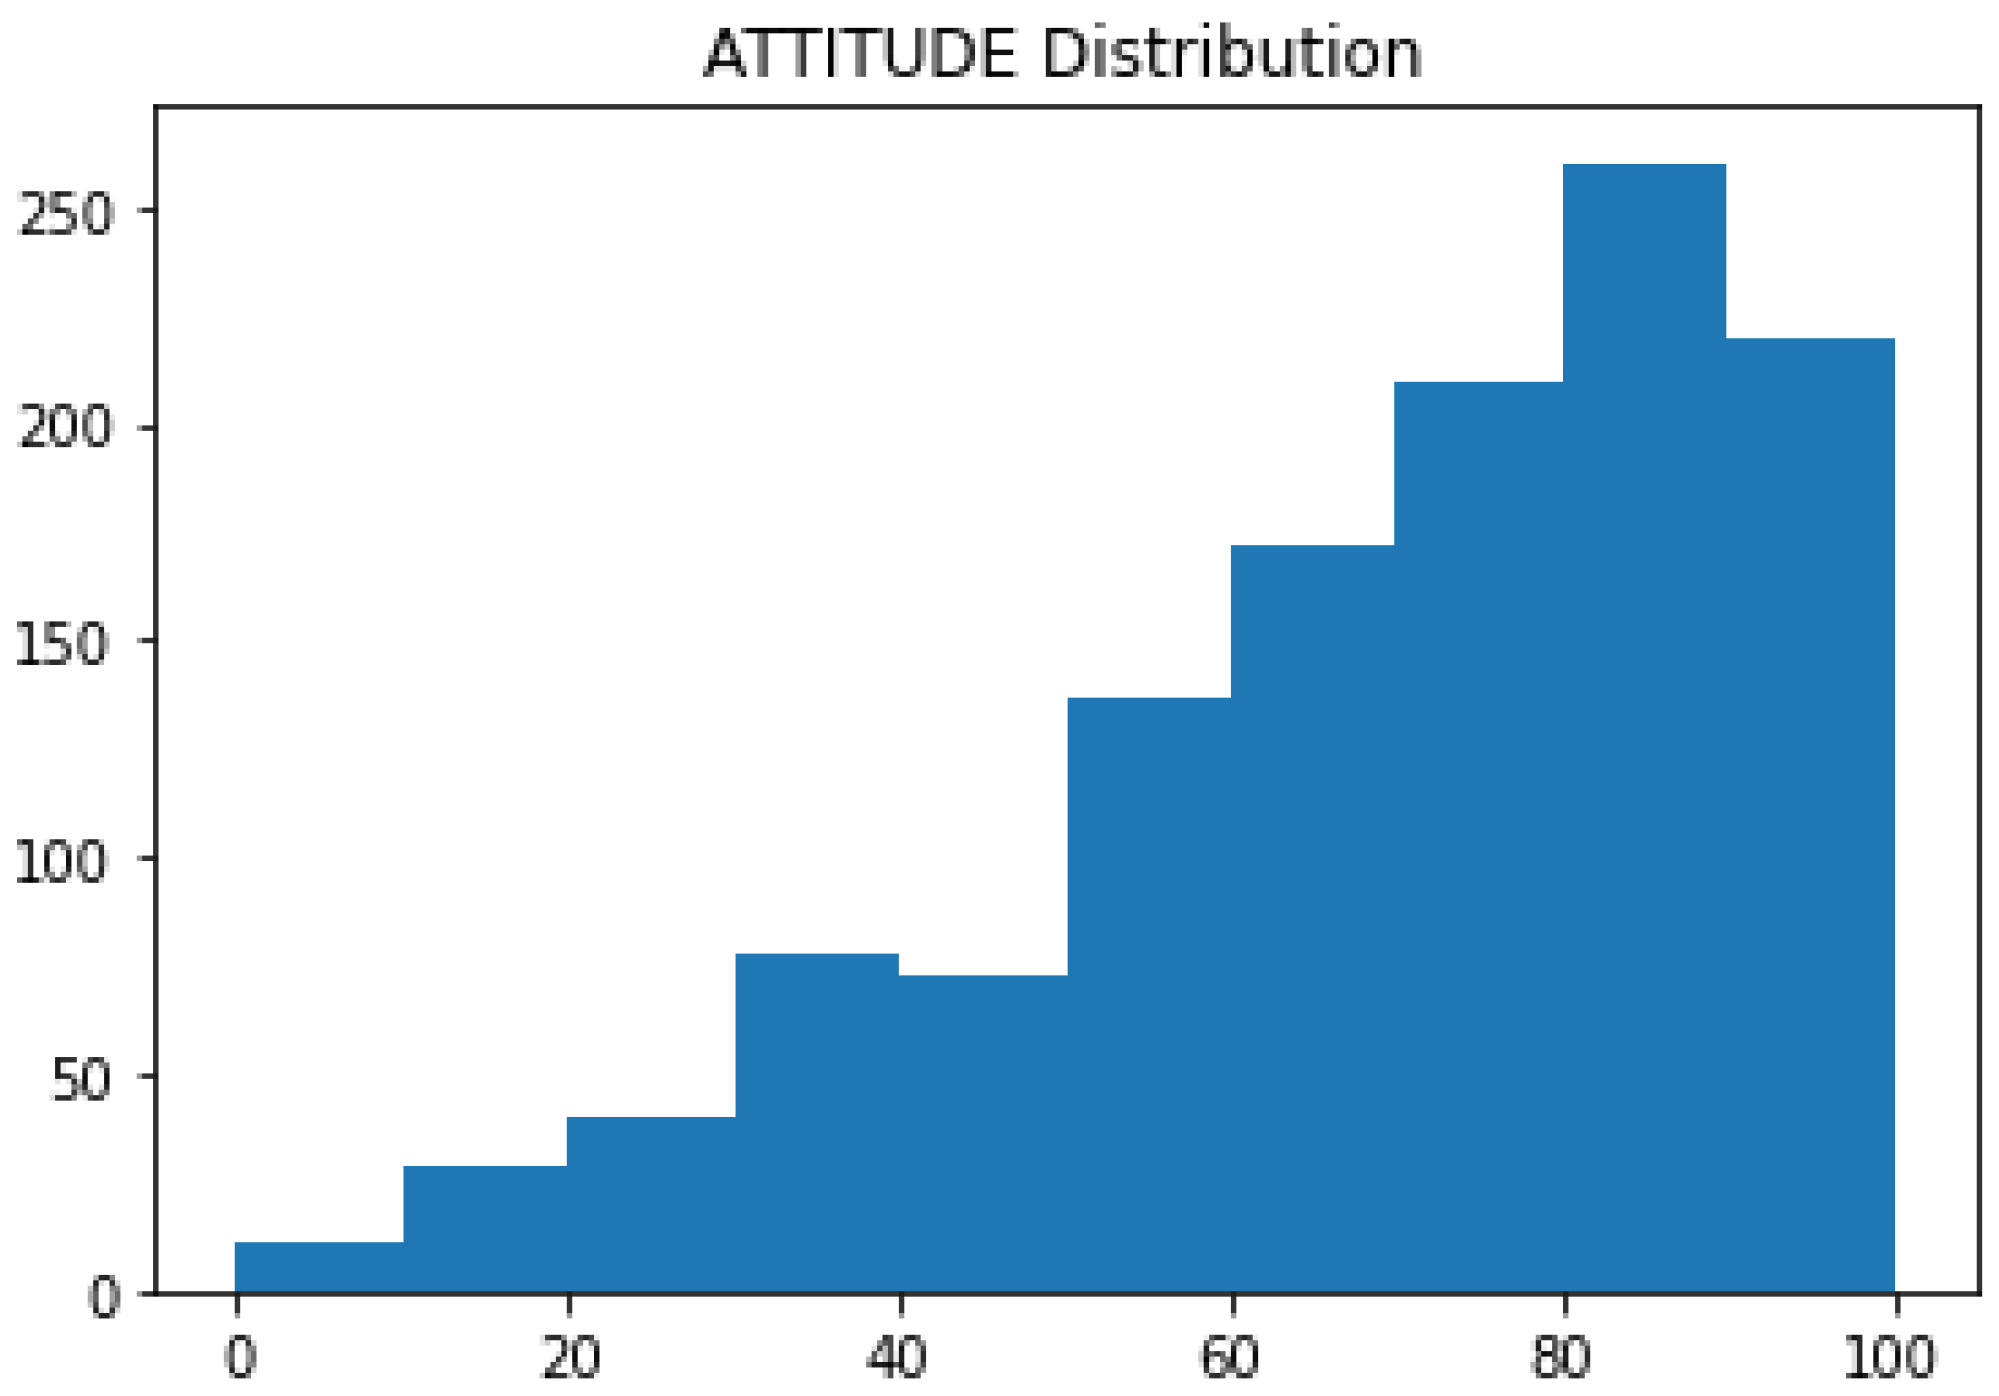
The attitude towards working from home is complex, as it relates to perceptions regarding a variety of different issues. Here, we explored attitudes, according to the basic scale (Yes, No, Do not know, Not applicable) as per Table 3. With a Cronbach Alpha value of only 0.76, these questions add up to an internally consistent construct. The correlation matrix showing the Pearson correlation coefficient between variables is shown in Figure 3. Correlation matrices are symmetric, which identify values across the diagonal (all variables have a 1 correlation with itself) and show the correlation between two variables as determined by the rows and columns. Figure 4 shows the histogram of attitudes amongst participants, showing an asymmetric distribution with most of the participants having a relative positive attitude towards WFH.
Table 3.
Attitudes and perceived benefits and risks from WFH.
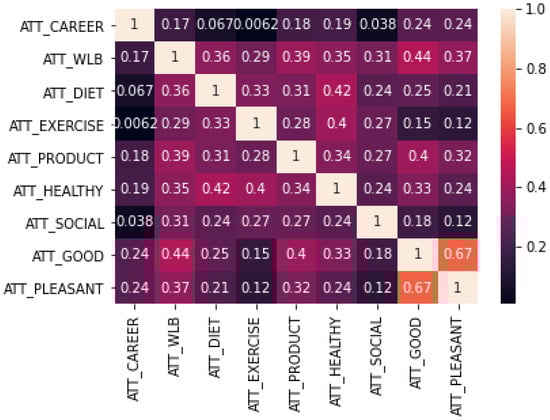
Figure 3.
Correlation matrix for attitude variables.

Figure 4.
Histogram of the Attitude construct calculated as the mean over all the included responses.
3.3. Subjective Norms
As per the TPB, “beliefs about the expectations of important others may facilitate or hinder performance of the behaviour” [37] (p. 145). Here, the important others are thought to be friends, colleagues, immediate managers, and senior leaders in the organisation of the employee. Responses by participants in relation to such beliefs are shown in Table 4. The somewhat lower value of the Cronbach’s alpha values appears to a result of the seemingly disparate perception about the views of friends, immediate managers, and colleagues (FRIENDS, MANAG and COLL1) vs. the perception of views of senior managers and a small number of colleagues (SENIOR and COLL2) which are to a greater extent perceived to be more negative about WFH. After removing SN_CRITICS, and SN_SENIOR, these questions form an internally consistent construct because the Cronbach Alpha is 0.74. The correlation matrix showing the Pearson correlation coefficient between subjective norm variables is shown in Figure 5. The histogram of subjective norms amongst participants is shown in Figure 6, showing a bias towards generally positive subjective norms, but with two clear peaks, seemingly representing two different categories of people.
Table 4.
Questions and summary of responses relating to beliefs about expectations, regarding WFH, by relevant others.
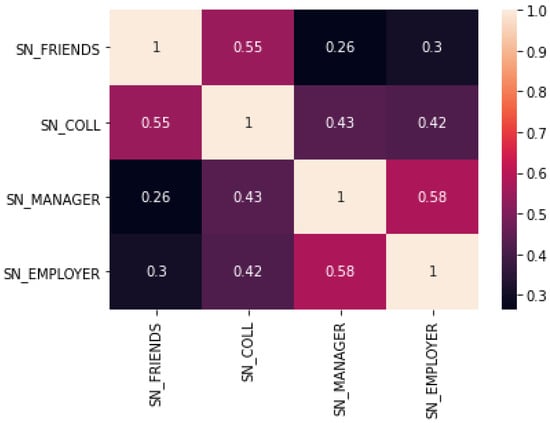
Figure 5.
Correlation matrix for subjective norm variables. Note: The SN_CRITICS and SN_SENIOR variables were removed because of being relatively uncorrelated with other SN variables, and caused the Cronbach Alpha to be at an unacceptable level.
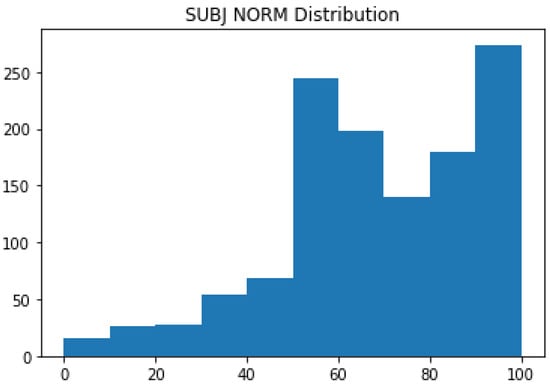
Figure 6.
Histogram of the Subjective Norm construct calculated as the mean over all the included responses.
3.4. Perceived Behavioural Control
One of the key drivers of behaviour, at least according to the TPB, is the Perceived Behavioural Control (PBC), which is associated with the perception of obstacles, including relating to competence, that may hinder the ability of successfully carrying out the behaviour, here WFH. There is variability in how this is conceptualised, but contributions are generally associated with internal factors, i.e., ability, and external factors, i.e., control [53]. In relation to WFH, we incorporated aspects relating to the home workspace, tools, distractions, and perceived ability to carry out work adequately, as per Table 5.
Table 5.
Questions and variables relating to Perceived Behavioural Control for WFH.
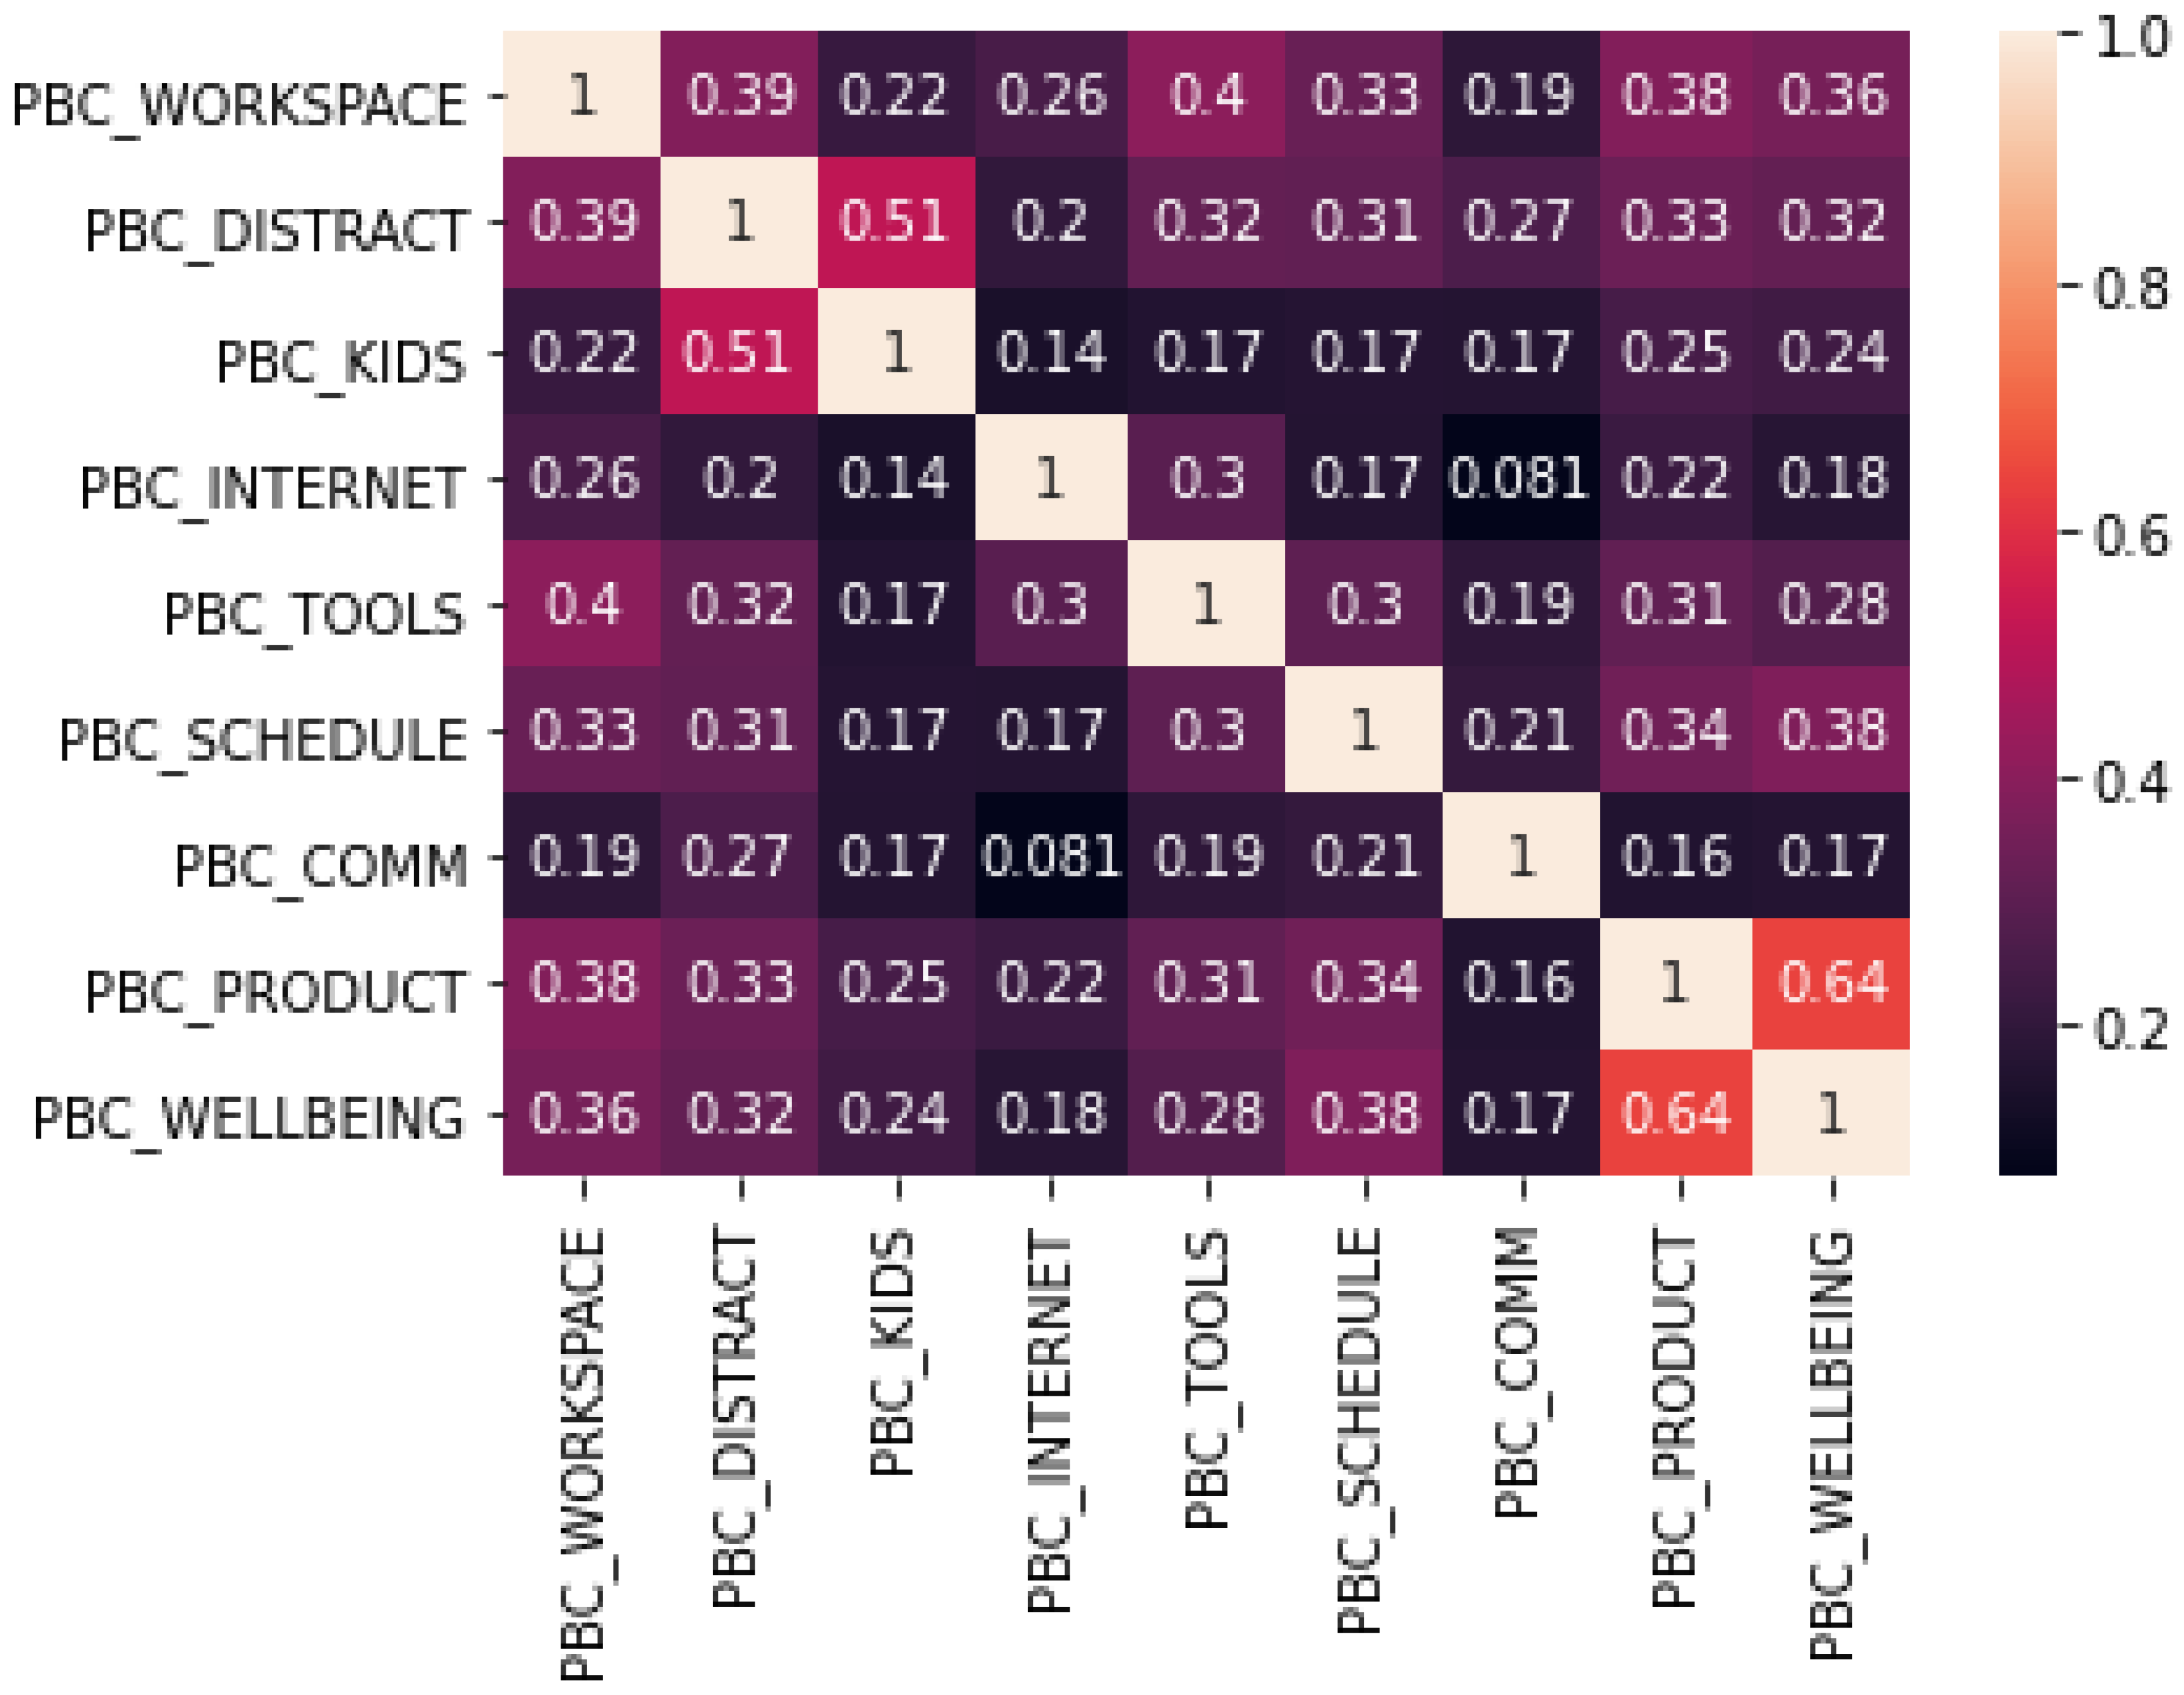
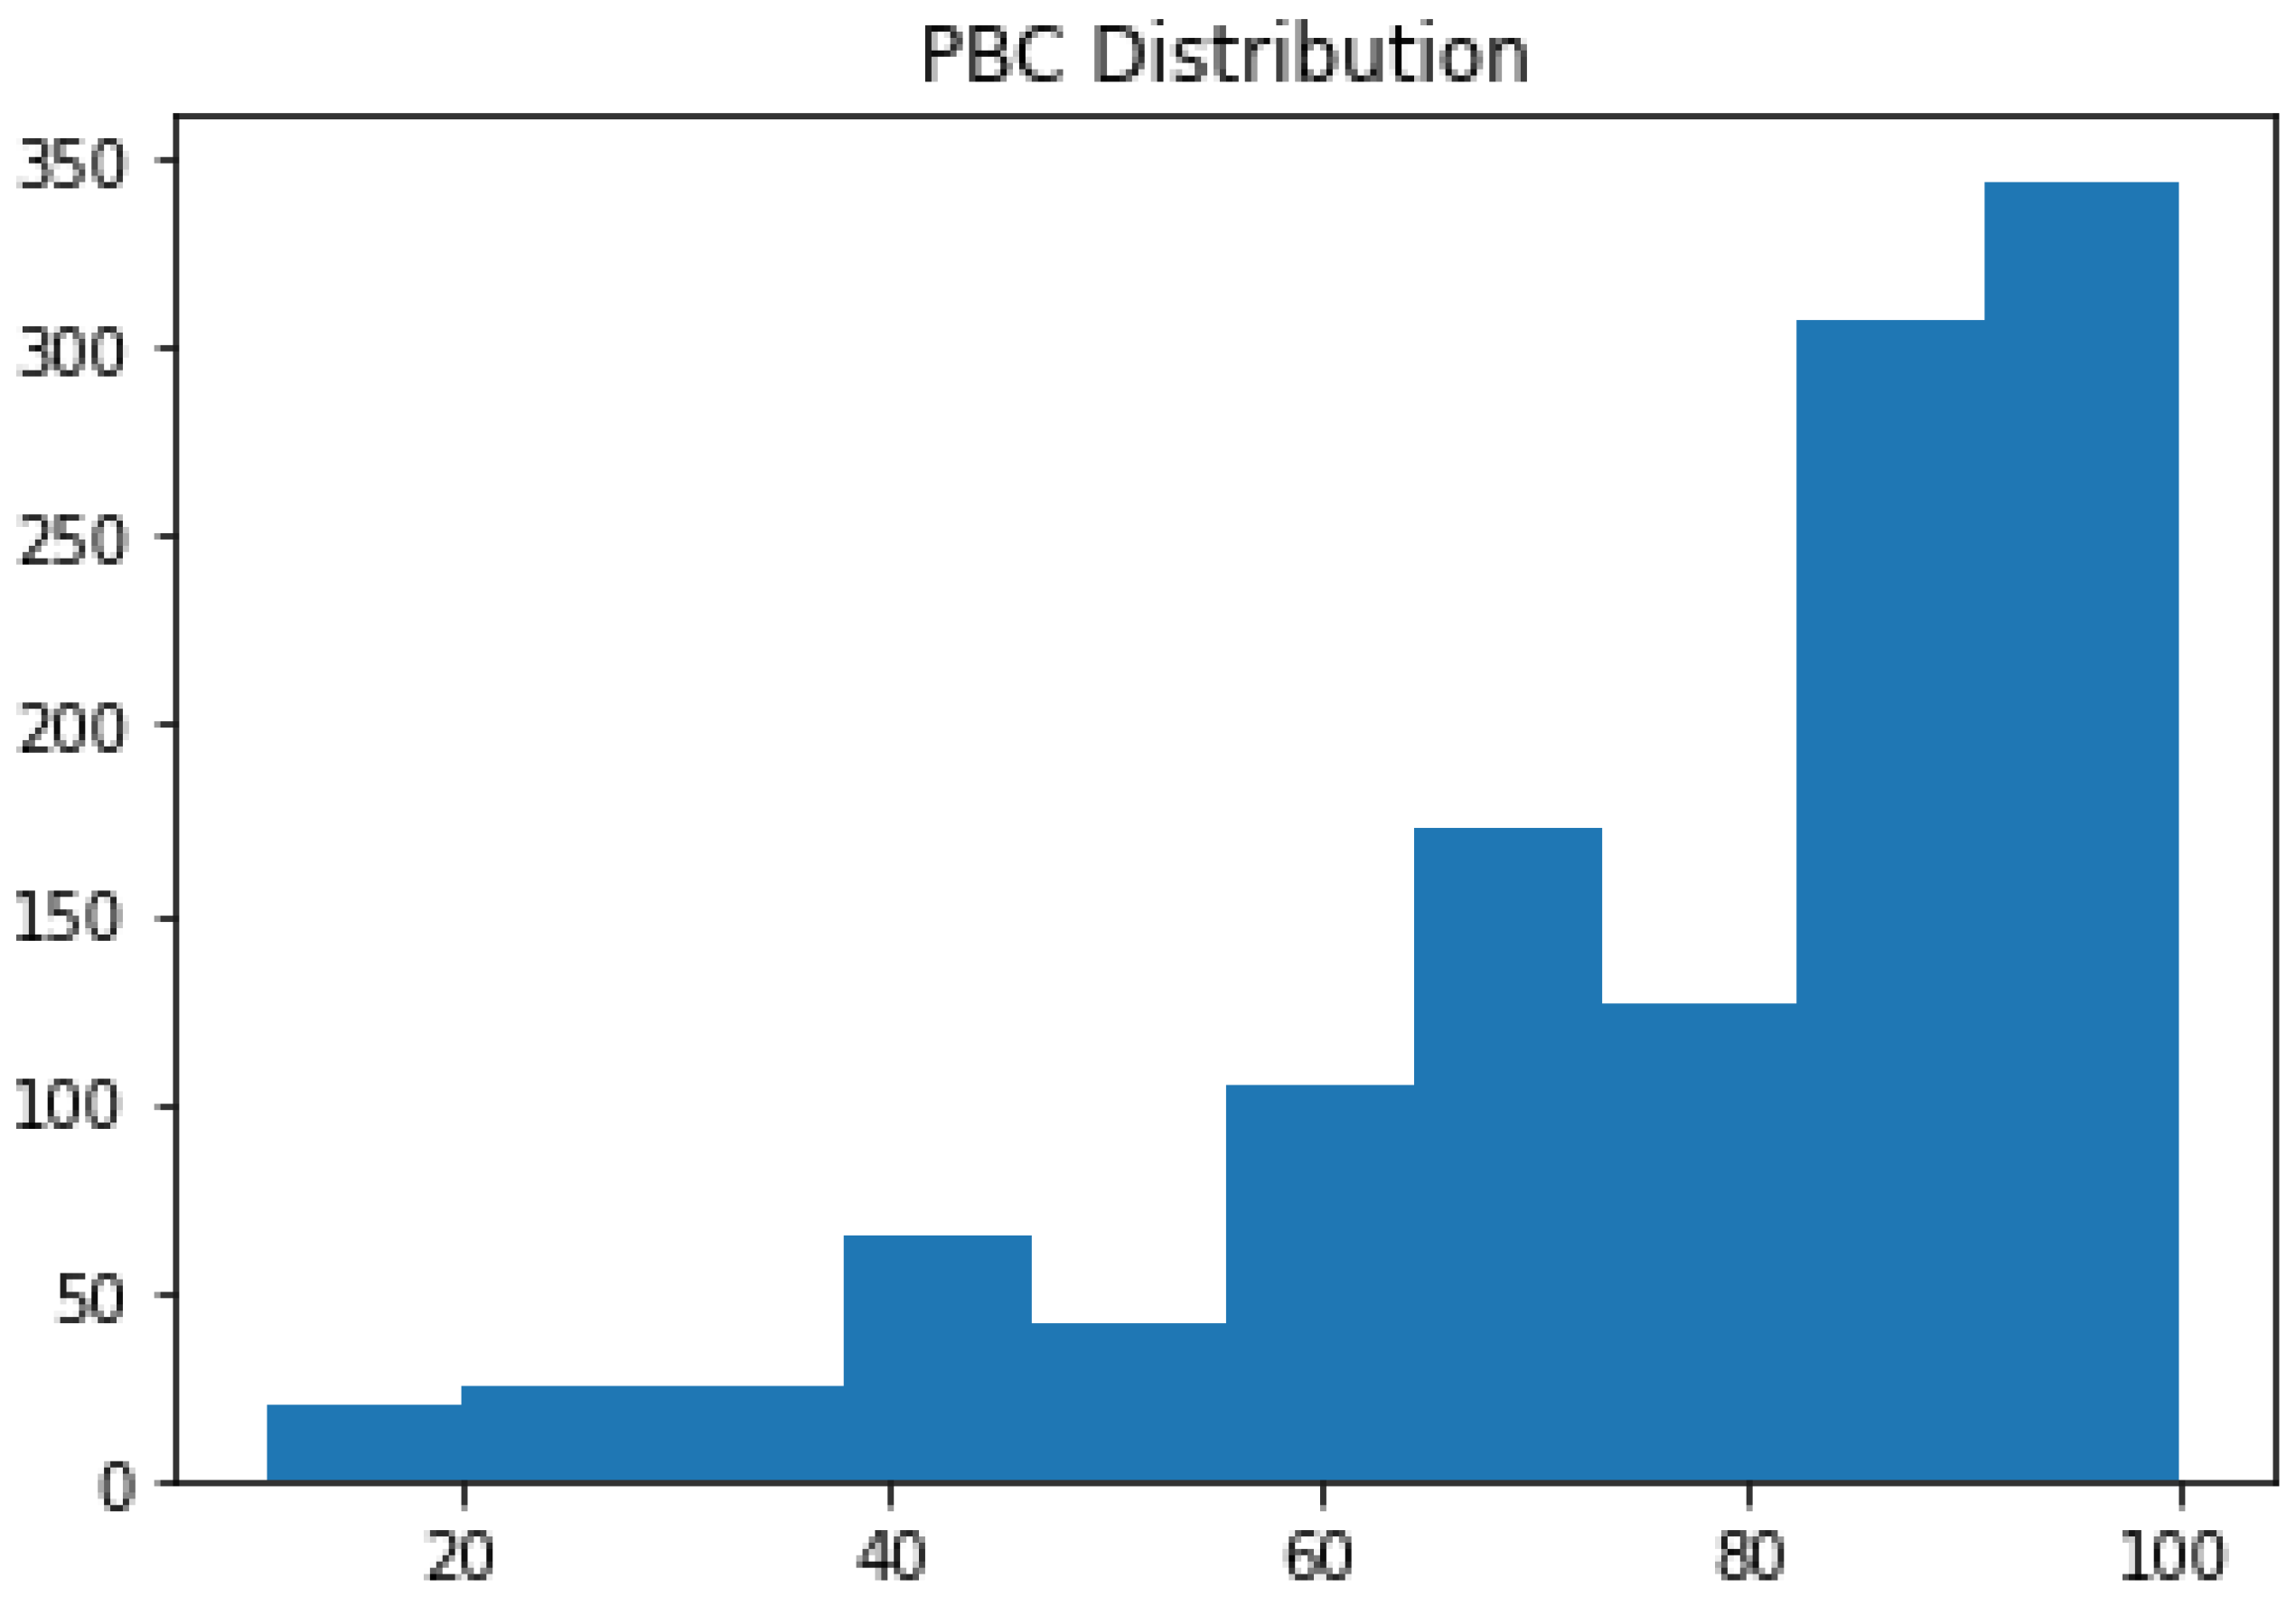
After translation of the answers into numeric form, these variables were combined into a construct for PBC, with a Cronbach’s Alpha of 0.77, which indicates acceptable internal consistency. The correlation matrix for these variables is shown in Figure 7. The histogram of perceived behavioural control amongst participants is shown in Figure 8, showing a clear bias towards generally high levels of control.
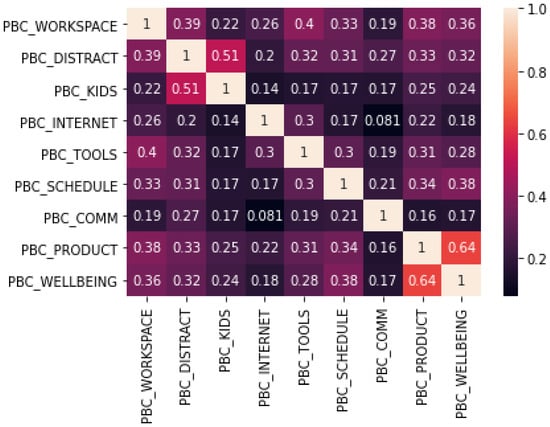
Figure 7.
Correlation matrix heatmap for PBC variables. Note: PBC_STRESS was removed as it was relatively uncorrelated with other PBC variables and caused the Cronbach’s Alpha to be significantly lower, i.e., it was necessary to remove it to ensure this was an internally consistent construct.

Figure 8.
Histogram of the Perceived Behavioural Control construct, calculated as the mean over all the included responses.
3.5. Determinants of Intent
According to our survey, for those that can WFH, the intent to WFH in the future for at least some of the time is near universal. Nevertheless, intent here is more than simply wanting to WFH some of the time, as illustrated in Figure 2, as it may involve working full-time from home, part of the time from home, occasionally from home, or not at all, etc. Therefore, we analysed the factors that determine the extent by which participants intended to WFH after the COVID-19 pandemic. We did this by:
- Using Y as the dependent variable, where Y was the participants’ response to the question Q34, coded to numeric form, based on: None at all = 0; A little = 30; a moderate amount = 50; a lot = 70; a great deal = 100.
- Using explanatory variables translated into numeric form, drawing on TPB as well testing the notion that prior behaviour is often an indicator of future behaviour:
- ○
- PBC = Perceived Behavioural Control
- ○
- SN = Subjective Norm
- ○
- ATT = Attitude
- ○
- MIN = min(PBC, SN, ATT)
- ○
- EXP = Experience of WFH before COVID (Q33)
- Using several possible models, as iterations to learn from:
- ○
- M0: Calculating the Average intent based on the Y as dependent variable, and
- ○
- M1: OLS Multiple Regression model with Y as dependent variable, and X = [PBC, SB, ATT] as explanatory variables.
- ○
- M2: OLS Multiple Regression model with Y as dependent variable, and X = MIN
- ○
- M3: OLS Multiple Regression model with Y as dependent variable, and X1 = [MIN, EXP]
The results of these analyses are shown in Table 6, Table 7, Table 8 and Table 9. The results confirm hypotheses H2, H3, and H4.
Table 6.
Average intent per combination of attitude, perceived behavioural control and subjective norm as discrete bivariate (high vs low) variables, as determined by a score of < and ≥50.
Table 7.
Results from OLS multiple regression. Y = Intent. X = [PBC, ATT, SN]. R-Squared = 0.17.
Table 8.
Results from OLS single regression with Y = Intent. X = min(PBC, ATT, SN). R-Squared = 0.15.
Table 9.
Multiple (OLS) regression model M3. Y = INTENT. X = (MIN, ExP). MIN is the minimum of PBC, SN and ATT. EXP is the pre-COVID experience of WFH. R-Squared = 0.18. Without a constant, the R-Squared = 0.83.
3.6. Influence of Tasks
An obvious driver of whether an employee could WFH is the type of work they do. It goes without saying that a driver, a labourer, or a factor worker, at least for the most part, is not able to WFH; whilst an office worker for the most part should have no problem to WFH for much of the time. Only certain job tasks can be done from home, and therefore, this strongly dictates the possibility of WFH across the population. Our survey, therefore, collected data on this issue, and results in Table 10 show the extent of different types of job types that can be done from home, across different job types.
Table 10.
Opportunity to WFH as a function of job type.
Beyond the nature of the work task, Table 11, provides data that describe other underlying drivers for why certain job types have higher rates of WFH behaviours, as it shows the average rates of intent, average attitudes, average subjective norms, average perceived behavioural control, and average rates of WFH feasibility across the job types.
Table 11.
Average Intent, Attitude, Subjective Norm (SUBJ_NORM), Perceived Behavioural Control (PCB), and % of work that can be done from home (pFeasible), per job type.
The last column in Table 11 shows the results of a Chi-Square hypothesis test (related to H5) based on the distribution of responses for each job type, where the null hypothesis was that the responses were multinomial distributed, and all responses were equally probable. The alternative hypothesis was that the job type impacts on whether a worker had an opportunity to WFH.
The correlation in the last row shows that especially SN and PBC were strongly correlated with pFeasible, which was a measure of the extent by which a job type allows WFH practices.
4. Discussion
Here we provide further commentary on the insights of the WFH experiment in Sydney, and the predictors of WFH behaviour into the future.
4.1. TPB-Related Insights
Insights from our data and analysis are separated into specific issues relating to attitudes, subjective norms, and perceived behavioural control.
4.1.1. Insights on Attitudes
Individuals’ ‘attitude’ to working from home were generally positive, particularly around questions related to overall assessments of it, which show that roughly 80% of respondents thought ongoing WFH will be both good and pleasant. There are some issues to do with career advancement, with 33% of individuals concerned that WFH would have negative career consequences, work-life balance, with 22% of respondents suggesting that they were working more, and productivity, with 21% suggesting they were less productive. These views, however, were in the minority, but do show some issues relating to the institutionalisation of WFH and, should it continue, the need for policies to ensure careers, workloads and output are more effectively managed remotely.
Regarding health, again most respondents had positive responses to exercise, eating and socialising habits whilst WFH, but some had negative responses to WFH diet (28%) and exercise (37%) illustrating that many had issues in this regard. Such negative self-reports were most probably related to a combination of access and (lack of) surveillance, with food being available throughout the day and no office regime to enforce a standardised ‘lunch hour’, which may, for those exercising in this time, further reduce exercise time. Access to gyms and so forth may also be an issue in suburban environments, most likely having lower service accessibility than that of city-based office locations, as may the simple fact that many are just doing less passive physical activity through not commuting.
The social aspect of WFH also scored high on the negative responses with some (37%) indicating that, while most people seem content with WFH socially, this will be a critical area to watch, as there is considerable diversity in individually perceived benefits of not commuting potentially become entangled with a creeping mass social isolation, which gets discounted due to its productivity gains.
4.1.2. Insights on Subjective Norms
The ‘subjective norms’, that is, how respondents feel about the viewpoints of their peers, show a clear distinction between friends, work colleagues/immediate managers and, particularly, compared with senior managers/critics in the organisation, with the approval rate for each group dropping from 77% (friends) to 39% (senior managers). It was also expected that most employers will allow WFH at least some of the time (71%), with only 14% expecting that their employers would not allow them to WFH at all in the future.
There was also relatively common concern that WFH will be viewed as unprofessional and uncommitted (43%) by some. Should these fears prove true, then it will likely be these societal aspects that bring many individuals back to the work site. However, there is also the possibility of WFH normalising within these peer and management groups, particularly if productivity remains high and rent savings from reduced office floorspace requirements become evident.
4.1.3. Insights on Perceived Behavioural Control
When addressing ‘perceived behavioural control’, i.e., the limitations affecting WFH, home environments seem, overall, suitable, with the notable exception of those with children, who see them as a potential distraction, though this only scored 19% and may be offset by schools returning to normal contact hours. Individuals also seemed well able to maintain personal schedules and productivity. More significant were the levels of stress from working too much at home (39%) and, even more significantly, a lack of ability to communicate effectively with co-workers (47%). These figures aligned with those from the ‘attitude’ set of responses, showing, in a minority of cases, but a large minority, negative trends across work-life balance and socialisation. However, socialisation in this section relates more to the communicative aspects of work, be it specification gathering, project work or simply informal ‘water-cooler’ style communication, all of which are socially and/or economically productive. As such, it seems that, while telecommuting can satisfy some aspects of the work environment, face to face interaction is necessary for many functions of business, and, when combined with previous answers, potentially for the social functions that maintain company esprit de corps and individual social connectedness generally.
4.2. Job Type as a Predictor of WFH Practice
Regardless of intention, the biggest predictor of being able to work from home was having a job that physically allows for it. This study used the Australian Bureau of Statistics, Occupation Level 1 categories, which are comparable to WFH probability research categories used internationally. As one would expect, and as also typical of many such studies, managers, professionals, and clerical workers, followed by sales workers, showed the greatest telecommuting propensity, while trades, drivers, services, and labourers showed the least. When the responses were accounted for, including preferences for days worked from home, the outcomes indicated that over 80% of professionals and managers could do at least some of their work from home (87% and 86%), with 76% of clerical and administrative workers able to do some of their work from home. This figure dropped to 45% for trades, 31% for labourers and 23% for the machinists and driver’s category. Especially for these last occupation categories, the amount of the work that they can do from home is relatively small.
The top three categories alone make up 40% of the Australian workforce, at 19% managers, 13% professionals and 8% administrative, totalling 4.6 million workers (from ABS table builder, OCCP1, Place of Usual residence, 2016). Even with just these three categories, the impact of roughly 80% of those workers working from home a significant part of their work week is going to have a very significant impact on our cities, particularly in places with high job density such as CBDs, and doubly so when we consider the multiplier effects of reduced service demand from lower levels of workers.
4.3. On the Application of the TPB Lens
We note several insights from this study regarding the modelling of the intent and behaviour in relation to WFH. First, the TPB provides a solid foundation for understanding WFH behaviours, and all three key factors (SN, ATT and PBC) have a statistically significant influence on the intent to WFH. In future studies, it would be useful to explore how these are associated with socio-economic and demographic attributes. For example, are there gender-based or geographic differences in these factors?
We do note, however, that previous exploration of the intent to WFH, based on TPB, used a slightly different set of variables included and that further research will help to refine the full scope of variables that ought to be considered in the TPB factors.
4.4. A Model to Predict Behaviour: Intention-Tasks-Rules
The TPB description of what drives the intention to WFH looks to be a useful way to understand this important (and first) factor. Beyond intention, what emerges is that there are also two other factors that strongly determine whether someone works from home.
The second factor is the tasks, i.e., only if work tasks can be done from home, will the person be able to WFH. We have reported on the prevalence of tasks that can be done from home for different job types, providing a contextually useful update on this topic.
The third factor is the rules of the employer, i.e., only if the rules of the employer allows, will the worker be able to WFH. This factor has not been described in detail in this study, other than to report on the prevalence of employers allowing their workers to WFH.
The above logic indicates that the prevalence of WFH behaviour can be described by the three factors: Tasks, Rules, and Intent. A predictive model for behaviour should therefore consider the three main drivers of behaviour. Initial explorations (i.e., this is a topic for a forthcoming article) show that even a rudimentary model, using a Bayesian Network framework and drawing on the methodology described by Glackin et al. [54], provides predictions of WFH propensity that has a correlation of 0.89. This method is based on distributions of job type distributions in postcodes with observed changes in residential mobility (using Google mobility data, see here: https://www.google.com/covid19/mobility/, accessed on 14 August 2022) in the same areas. The change in mobility in a postcode is calculated as the quotient between the average mobility just before COVID-19 (February 2020) and the average mobility in a period after associated lockdowns (August 2022). These early results indicate a high potential for predictive capacity, which is to be further explored in other forthcoming publication(s) from the authors.
5. Conclusions
This research was undertaken to better understand the range of factors, besides job type, influencing whether someone is likely to work from home. To better understand this, we collected and analysed a large data set from across the Sydney Metropolitan region in late 2021. Data were analysed in terms of psycho-social factors that drive the intention to work from home, as well as the practical factors, including related to housing, associated with employers and job types that influence whether someone can WFH. Specifically, this study identified internally consistent constructs for Perceived Behavioural Control, Subjective Norms and Attitudes and has shown that these have statistically significant influences on the intention to work from home. We also found that, as did Jain et al. [11], the TPB is a suitable psycho-social model for analysing the WFH practice, but note that beyond intention, tasks and rules of the work, also significantly impact on the likely prevalence of the practice. We recommend that further research is undertaken to refine the TPB survey instruments and measures of WFH practices, to allow standardization and easier comparison of results between jurisdictions.
Specifically, data and analysis show that workers were overwhelmingly supportive of ongoing telecommuting, as is consistent with several studies that have explored this topic post-COVID [11,38,39,40,41]. Homes are generally appropriate, personal schedules and work ethos can be maintained and most workers seem to be able to balance work-life balance, health, diet, and social factors. This is broadly consistent with results by Kitagawa [42] who also identified that WFH setups were the main influence on productivity.
We also found that there is a large minority of individuals who cannot manage health and wellbeing aspects of WFH, suggesting that there are also risks relating to health and mental wellbeing, although we note that Kitagawa [42] found overall improvements in mental wellbeing.
Furthermore, while most respondents stated their friends and associates would be supportive of ongoing working from home, the view of senior managers were sometimes less supportive. This is broadly consistent with results from South Korea, where managers were generally positive to WFH practice, and have also considerably shifted attitudes post-COVID [40].
Similarly, many individuals stated that telecommuting was not a complete panacea for office-based work, with the communicative aspects of jobs being made more difficult. Despite these facts, we found that the volume of work that could be done from home, when social, institutional, and situational aspects were taken into consideration, was very high in some occupations, illustrating that, regardless of any backlash against working from home, it is still poised to have very significant impacts on where people live, where they work, transport and the future use and form of the urban and regional environments.
The inevitable continuation of WFH behaviours in Sydney, has created a paradigm shift in how office workers now interact with their natural and built environments, their mobility and spending behaviours, and where they choose to live etc., as discussed by Glackin et al. [54]. The significance of these findings cannot be understated. At a time when organisations are grappling to establish appropriate rules for effective ‘hybrid’ working, these findings can be used as a starting point for deeper exploration, regarding the necessary considerations, infrastructure, resources, and supports that are needed.
We recommend that further research be undertaken to investigate the presence of demographic trends, gaps, and pressure points, between WFH behaviours and health, wellbeing, comfort, social connection, and security outcomes in specific groups of workers. Specifically, there is an urgent need to understand in more detail how the attitudes, subjective norms, perceived behavioural control and opportunity to WFH vary with socio-economic and contextual attributes, and the implications of this variability, especially in relation to equity and justice.
It is also clear from our study, and others in this field, that the practice and culture of WFH is still evolving. Therefore, we recommend that research is undertaken to explore how the intention to WFH changes over time, i.e., longitudinally. This will require standardization of survey instruments to more easily enable comparisons, both spatially and temporally.
Additionally, we note that the role of commuting distance and the potential for relocation, as two inter-related factors that drive a change in WFH behaviours [39,41,43,44], are important factors that were largely omitted in this article, but which will likely have significant influence on urban dynamics into the future.
Whilst there will certainly be challenges, if these new ways of working are designed and supported appropriately, they have the potential to propel progress towards achieving a range of sustainability goals, in addition to providing a significant catalyst for economic growth, and improvements in health and work-life balance more generally.
Supplementary Materials
The following supporting information can be downloaded at: https://www.mdpi.com/2071-1050/14/21/13997/s1.
Author Contributions
Conceptualisation, M.M.; methodology, M.M.; validation, M.M.; formal analysis, M.M.; data curation, M.M., S.G. and J.L.H.; writing—original draft preparation, M.M. and S.G.; writing—review and editing, M.M., S.G. and J.L.H.; funding acquisition, M.M. All authors have read and agreed to the published version of the manuscript.
Funding
This research was funded by Sydney Water Corporation and Swinburne University of Technology.
Institutional Review Board Statement
The data collection approach was approved by the Australian Human Ethics Review Committee at the Swinburne University of Technology, approval number, 20215905-8292.
Informed Consent Statement
Informed consent was obtained from all subjects involved in the study.
Data Availability Statement
Data used for this study are available, as per cited references, as well as in the available tables.
Acknowledgments
The authors acknowledge advice from Luther Uthayakumaran (Sydney Water), Marcia Dawson (Sydney Water), Jonathan Dixon (Sydney Water), Frank Spaninks (Sydney Water), Piret Veeroja (Swinburne University of Technology), Christian A Nygaard (Swinburne University of Technology).
Conflicts of Interest
The authors declare no conflict of interest.
References
- Nilles, J.M. Telecommunications-Transportation Tradeoff: Options for Tomorrow; John Wiley & Sons: New York, NY, USA, 1973. [Google Scholar]
- Wulff, M.; Newton, P. Working at Home: Emerging Trends and Spatial Implications. In Houses and Jobs in Cities and Regions; The University of Queensland Press: Brisbane, Australia, 1999; pp. 237–246. [Google Scholar]
- Salomon, I.; Salomon, M. Telecommuting: The employee’s perspective. Technol. Forecast. Soc. Change 1984, 25, 15–28. [Google Scholar] [CrossRef]
- Pratt, J.H. Home teleworking: A study of its pioneers. Technol. Forecast. Soc. Change 1984, 25, 1–14. [Google Scholar] [CrossRef]
- Prevost, J. Working from home. Economist 2003, 369, 16. [Google Scholar]
- Verbeke, A.; Schulz, R.; Greidanus, N.; Hambley, L. Growing the Virtual Workplace: The Integrative Value Proposition for Telework; Edward Elgar Publishing: Cheltenham, UK, 2008; pp. 1–261. [Google Scholar] [CrossRef]
- Nilles, J.M. Traffic reduction by telecommuting: A status review and selected bibliography. Transp. Res. Part A Gen. 1988, 22, 301–317. [Google Scholar] [CrossRef]
- Moglia, M.; Hopkins, J.; Bardoel, A. Telework, Hybrid Work and the United Nation’s Sustainable Development Goals: Towards Policy Coherence. Sustainability 2021, 13, 9222. [Google Scholar] [CrossRef]
- Australian Bureau of Statistics. 2016 Census; Australian Bureau of Statistics: Canberra, Australia, 2016. [Google Scholar]
- Hensher, D.A.; Balbontin, C.; Beck, M.J.; Wei, E. The impact of working from home on modal commuting choice response during COVID-19: Implications for two metropolitan areas in Australia. Transp. Res. Part A Policy Pract. 2022, 155, 179–201. [Google Scholar] [CrossRef]
- Jain, T.; Currie, G.; Aston, L. COVID and working from home: Long-term impacts and psycho-social determinants. Transp. Res. Part A Policy Pract. 2022, 156, 52–68. [Google Scholar] [CrossRef]
- Hopkins, J.; Bardoel, A. Flexibility Makes Us Happier, with 3 Clear Trends Emerging in Post-Pandemic Hybrid Work; The Conversation: Melbourne, Australia, 2022. [Google Scholar]
- Moglia, M.; Frantzeskaki, N.; Newton, P.; Pineda-Pinto, M.; Witheridge, J.; Cook, S.; Glackin, S. Accelerating a green recovery of cities: Lessons from a scoping review and a proposal for mission-oriented recovery towards post-pandemic urban resilience. Dev. Built Environ. 2021, 7, 100052. [Google Scholar] [CrossRef]
- Caldarola, B.; Sorrell, S. Do teleworkers travel less? Evidence from the English National Travel Survey. Transp. Res. Part A Policy Pract. 2022, 159, 282–303. [Google Scholar] [CrossRef]
- Lachapelle, U.; Tanguay, G.A.; Neumark-Gaudet, L. Telecommuting and sustainable travel: Reduction of overall travel time, increases in non-motorised travel and congestion relief? Urban Stud. 2018, 55, 2226–2244. [Google Scholar] [CrossRef]
- Rietveld, P. Telework and the transition to lower energy use in transport: On the relevance of rebound effects. Environ. Innov. Soc. Transit. 2011, 1, 146–151. [Google Scholar] [CrossRef]
- Liu, Z.; Ciais, P.; Deng, Z.; Lei, R.; Davis, S.J.; Feng, S.; Zheng, B.; Cui, D.; Dou, X.; Zhu, B.; et al. Near-real-time monitoring of global CO2 emissions reveals the effects of the COVID-19 pandemic. Nat. Commun. 2020, 11, 5172. [Google Scholar] [CrossRef] [PubMed]
- Brown, L.; Barnes, J.; Hayes, E. Traffic-related air pollution reduction at UK schools during the COVID-19 lockdown. Sci. Total Environ. 2021, 780, 146651. [Google Scholar] [CrossRef] [PubMed]
- Hensher, D.A.; Wei, E.; Beck, M.; Balbontin, C. The impact of COVID-19 on cost outlays for car and public transport commuting—The case of the Greater Sydney Metropolitan Area after three months of restrictions. Transp. Policy 2021, 101, 71–80. [Google Scholar] [CrossRef]
- Beck, M.J.; Hensher, D.A. Insights into the impact of COVID-19 on household travel and activities in Australia—The early days of easing restrictions. Transp. Policy 2020, 99, 95–119. [Google Scholar] [CrossRef] [PubMed]
- Koohsari, M.J.; Nakaya, T.; Shibata, A.; Ishii, K.; Oka, K. Working from home after the COVID-19 pandemic: Do company employees sit more and move less? Sustainability 2021, 13, 939. [Google Scholar] [CrossRef]
- Xiao, Y.; Becerik-Gerber, B.; Lucas, G.; Roll, S.C. Impacts ofWorking from Home during COVID-19 Pandemic on Physical and Mental Well-Being of Office Workstation Users. J. Occup. Environ. Med. 2021, 63, 181–190. [Google Scholar] [CrossRef]
- Yu, Y.; Lau, M.M.C.; Lau, J.T.F. Working from home and positive/negative experiences due to social distancing as interacting factors of depressive symptoms during the COVID-19 pandemic in a Chinese general population. Soc. Psychiatry Psychiatr. Epidemiol. 2021, 57, 1235–1246. [Google Scholar] [CrossRef]
- Daraba, D.; Wirawan, H.; Salam, R.; Faisal, M. Working from home during the corona pandemic: Investigating the role of authentic leadership, psychological capital, and gender on employee performance. Cogent Bus. Manag. 2021, 8, 1885573. [Google Scholar] [CrossRef]
- Mihalca, L.; Irimias, T.; Brendea, G. Teleworking During The COVID-19 Pandemic: Determining Factors Of Perceived Work Productivity, Job Performance, And Satisfaction. Amfiteatru Econ. 2021, 23, 620–636. [Google Scholar] [CrossRef]
- Hokke, S.; Bennetts, S.K.; Crawford, S.; Leach, L.; Hackworth, N.J.; Strazdins, L.; Nguyen, C.; Nicholson, J.M.; Cooklin, A.R. Does flexible work ‘work’ in Australia? A survey of employed mothers’ and fathers’ work, family and health. Community Work. Fam. 2021, 24, 488–506. [Google Scholar] [CrossRef]
- Irlacher, M.; Koch, M. Working from Home, Wages, and Regional Inequality in the Light of COVID-19. Jahrb. Fur Natl. Und Stat. 2021, 241, 373–404. [Google Scholar] [CrossRef]
- Schade, H.M.; Digutsch, J.; Kleinsorge, T.; Fan, Y. Having to work from home: Basic needs, well-being, and motivation. Int. J. Environ. Res. Public Health 2021, 18, 5149. [Google Scholar] [CrossRef] [PubMed]
- Schur, L.A.; Ameri, M.; Kruse, D. Telework After COVID: A “Silver Lining” for Workers with Disabilities? J. Occup. Rehabil. 2020, 30, 521–536. [Google Scholar] [CrossRef] [PubMed]
- Hopkins, J.; McKay, J. Investigating ‘Anywhere Working’ as a Mechanism for Alleviating Traffic Congestion in Smart Cities. Technol. Forecast. Soc. Change 2019, 142, 258–272. [Google Scholar] [CrossRef]
- Cerqueira, E.D.V.; Motte-Baumvol, B.; Chevallier, L.B.; Bonin, O. Does working from home reduce CO2 emissions? An analysis of travel patterns as dictated by workplaces. Transp. Res. Part D: Transp. Environ. 2020, 83, 102338. [Google Scholar] [CrossRef]
- Kim, S.N. Is telecommuting sustainable? An alternative approach to estimating the impact of home-based telecommuting on household travel. Int. J. Sustain. Transp. 2017, 11, 72–85. [Google Scholar] [CrossRef]
- Simons, R.A.; Henning, M.; Poeske, A.; Trier, M.; Conrad, K. COVID-19 and its effect on trip mode and destination decisions of transit riders: Experience from Ohio. Transp. Res. Interdiscip. Perspect. 2021, 11, 100417. [Google Scholar] [CrossRef]
- Elldér, E. Does telework weaken urban structure-travel relationships? J. Transp. Land Use 2017, 10, 187–210. [Google Scholar] [CrossRef]
- Ton, D.; Arendsen, K.; de Bruyn, M.; Severens, V.; van Hagen, M.; van Oort, N.; Duives, D. Teleworking during COVID-19 in the Netherlands: Understanding behaviour, attitudes, and future intentions of train travellers. Transp. Res. Part A Policy Pract. 2022, 159, 55–73. [Google Scholar] [CrossRef]
- Baruch, Y.; Nicholson, N. Home, Sweet Work: Requirements for Effective Home Working. J. Gen. Manag. 1997, 23, 15–30. [Google Scholar] [CrossRef]
- Ajzen, A.I. Attitudes, Behaviour, Personality; Dorsey: Chicago, IL, USA, 1988. [Google Scholar]
- Barbour, N.; Menon, N.; Mannering, F. A statistical assessment of work-from-home participation during different stages of the COVID-19 pandemic. Transp. Res. Interdiscip. Perspect. 2021, 11, 100441. [Google Scholar] [CrossRef] [PubMed]
- Stefaniec, A.; Brazil, W.; Whitney, W.; Caulfield, B. Desire to work from home: Results of an Irish study. J. Transp. Geogr. 2022, 104, 103416. [Google Scholar] [CrossRef] [PubMed]
- Rose, P.A.; Brown, S. Reconstructing attitudes towards work from home during COVID-19: A survey of south korean managers. Behav. Sci. 2021, 11, 163. [Google Scholar] [CrossRef] [PubMed]
- Nguyen, M.H. Factors influencing home-based telework in Hanoi (Vietnam) during and after the COVID-19 era. Transportation 2021, 48, 3207–3238. [Google Scholar] [CrossRef]
- Kitagawa, R.; Kuroda, S.; Okudaira, H.; Owan, H. Working from home and productivity under the COVID-19 pandemic: Using survey data of four manufacturing firms. PLoS ONE 2021, 16, e0261761. [Google Scholar] [CrossRef]
- Campbell, J.; Heales, J. Factor analysis of individual outcomes for teleworkers. In Proceedings of ACIS 2008 Proceedings—19th Australasian Conference on Information Systems, Christchurch, New Zealand, 3–5 December 2008; pp. 176–185. [Google Scholar]
- Helminen, V.; Ristimäki, M. Relationships between commuting distance, frequency and telework in Finland. J. Transp. Geogr. 2007, 15, 331–342. [Google Scholar] [CrossRef]
- Beck, M.J.; Hensher, D.A. Working from home in Australia in 2020: Positives, negatives and the potential for future benefits to transport and society. Transp. Res. Part A Policy Pract. 2022, 158, 271–284. [Google Scholar] [CrossRef]
- Chatterjee, K.; Crawford, F. Changing Work and Work-Related Travel and the Impact of COVID-19. Built Environ. 2021, 47, 336–354. [Google Scholar] [CrossRef]
- Costa, C.S.; Pitombo, C.S.; de Souza, F.L.U. Travel Behavior before and during the COVID-19 Pandemic in Brazil: Mobility Changes and Transport Policies for a Sustainable Transportation System in the Post-Pandemic Period. Sustainability 2022, 14, 4573. [Google Scholar] [CrossRef]
- Haider, M.; Anwar, A.I. The prevalence of telework under COVID-19 in Canada. In Information Technology and People; Emerald Publishing: Bingley, UK, 2022. [Google Scholar] [CrossRef]
- Olde Kalter, M.J.; Geurs, K.T.; Wismans, L. Post COVID-19 teleworking and car use intentions. Evidence from large scale GPS-tracking and survey data in the Netherlands. Transp. Res. Interdiscip. Perspect. 2021, 12, 100498. [Google Scholar] [CrossRef] [PubMed]
- Shakibaei, S.; de Jong, G.C.; Alpkökin, P.; Rashidi, T.H. Impact of the COVID-19 pandemic on travel behavior in Istanbul: A panel data analysis. Sustain. Cities Soc. 2021, 65, 102619. [Google Scholar] [CrossRef]
- Yamane, T. Statistics: An Introductory Analysis, 3rd ed.; Harper and Row: New York, NY, USA, 1973. [Google Scholar]
- Krejcie, R.V.; Morgan, D.W. Determining Sample Size for Research Activities. Educ. Psychol. Meas. 1970, 30, 607–610. [Google Scholar] [CrossRef]
- Kiriakidis, S. Perceived Behavioural Control in the Theory of Planned Behaviour: Variability of Conceptualization and Operationalization and Implications for Measurement. In Proceedings of the Springer Proceedings in Business and Economics, Mykonos, Greece, 14–27 September 2015; pp. 197–202. [Google Scholar]
- Glackin, S.; Moglia, M.; Newton, P. Working from Home as a Catalyst for Urban Regeneration. Sustainability 2022, 14, 12584. [Google Scholar] [CrossRef]


Publisher’s Note: MDPI stays neutral with regard to jurisdictional claims in published maps and institutional affiliations. |
© 2022 by the authors. Licensee MDPI, Basel, Switzerland. This article is an open access article distributed under the terms and conditions of the Creative Commons Attribution (CC BY) license (https://creativecommons.org/licenses/by/4.0/).