Abstract
The integrated development of new-type urbanization and tourism is of great significance for social development. Based on panel data of nine provinces in the Yellow River Basin from 2010 to 2019, models such as entropy TOPSIS, the super-SBM model, the coupling coordination degree model, the GM (1,1) model, Tobit regression, and other methods were used to explore the spatiotemporal evolution characteristics and influencing factors of the coupling coordination degree (CCD) between new-type urbanization and tourism resource conversion efficiency (TRCE) in the Yellow River Basin. The results show that, during the research period: (1) The development index of new-type urbanization in the Yellow River Basin showed a steady upwards trend and TRCE was generally stable. (2) The CCD between new-type urbanization and TRCE in the Yellow River Basin fluctuated and rose with an average annual CCD of 0.716, indicating an intermediate coordination stage, and showed an overall spatial distribution pattern of “midstream region > downstream region > upstream region”. The center of gravity of the CCD shifted to the northwest and the type of CCD jumped rapidly to a better stage, especially in the midstream region. From the perspective of future trends, the coupling and coordination relationship between the two major systems will continue to be optimized from 2019 to 2025 and the midstream region will maintain a high growth level. (3) The industrial structure, cultural media investment, science and technology investment, and communication level are important factors that affect the CCD of new-type urbanization and TRCE in the Yellow River Basin. The CCD of new-type urbanization and TRCE in the Yellow River Basin tends to be better as a whole, but the regional differences are obvious. Therefore, in the process of policy implementation, special attention should be given to the understanding of regional differences to avoid policy failure. This is very important to the Yellow River Basin and equally important to other regions.
1. Introduction
Since China’s reform and opening up, its urbanization process has advanced rapidly, with the urbanization rate jumping from 17.9% in 1978 to 64.72% in 2021. Urbanization has become an important factor supporting China’s economic growth in this new era. In the traditional urbanization process, industrialization is the core driving force. However, with the arrival of the postindustrial era, “new-type urbanization” is now the requirement for China’s urbanization [1]. Compared with traditional urbanization, new-type urbanization highlights the concept of people-oriented development; the coordinated development of large, medium, and small cities and small towns; the integration of industries and towns; and the promotion of urbanization by industries [2,3]. Currently, the most dynamic tourism industry is at the industrial scale, which has continued to expand in recent years and has played a strong leading role in the economy, culture, and ecology to become an important force in China’s urbanization development in the new era [4].
Academic research on the relationship between urbanization and tourism can be traced back to the 1990s. Mullins first proposed the concept of tourism urbanization as an urbanization development model dominated by the tourism service industry and constructed seven conceptual frameworks based on both theory and facts using Australia’s Gold Coast and Sunshine Coast as the research objects for empirical analysis [5]. On the basis of this research, a large number of scholars have conducted in-depth examinations of the development characteristics [6,7], modes [8], and driving mechanisms [9,10] of tourism urbanization. With the acceleration of urbanization and intense development of the tourism industry, research on the relationship between urbanization and the tourism industry has gradually grown in popularity. On the one hand, the rapid development of tourism can effectively promote urban economic growth and the urbanization process [11,12,13,14]. On the other hand, the complete urban infrastructure provides strong support for the development of tourism [15,16,17,18,19]. For example, based on panel data from 26 cities in the Yangtze River Delta urban agglomeration from 2008 to 2018, Shen et al. analyzed the spatiotemporal coupling characteristics of tourism and urbanization with a high-quality development mechanism. The results showed that urbanization is foundational for tourism development, which can effectively promote the rapid development of urbanization [20]. In addition, research on the urbanization–tourism–eco-environment relationship, which adds ecological factors to urbanization and the tourism industry, has gradually increased [21,22,23,24]. This research area also employs diverse research methods, including the coupling coordination degree model [25,26], VAR model [27,28], spatial measurement [29], panel regression [30], and other methods of measurement with scales ranging from micro to macro [31,32,33]. Although academic research on the relationship between urbanization and the tourism industry is comprehensive, there are still some shortcomings. First, in tourism industry research, the literature usually selects indicators and delimits weights to obtain a comprehensive development index of the tourism industry. However, the “output capacity” of tourism resources is not clearly quantified and analyzed, so calibrating the effect of tourism is difficult [34]. Second, many studies focus predominantly on descriptions of existing phenomena but lack the foresight of external development trends. Third, related research concentrates on the description of coupling and coordination characteristics but lacks an exploration of its influencing factors. The Yellow River is a massive river spanning the east and west of China with a watershed area of 795,000 km2. It is an important ecological protection barrier and economic development link in China with a dense population, complete urban system, rich natural and cultural landscapes, and a vast tourism market. However, compared with the eastern coastal areas, the overall economic level of the Yellow River Basin is still relatively weak and its urban development lags.
Based on the abovementioned factors, this study selects the Yellow River Basin as the study area and explores the spatiotemporal coupling coordination law and influencing factors of new-type urbanization and TRCE in the Yellow River Basin using entropy TOPSIS, the Super-SBM model, the coupling coordination degree model, the GM (1,1) model, and Tobit regression. The goals are as follows: (1) to explore the development level of new-type urbanization and TRCE in the Yellow River Basin from 2010 to 2019; (2) to investigate the spatial and temporal coupling evolution characteristics and future trends of new-type urbanization and TRCE in the Yellow River Basin using the coupled coordination degree model and the grey prediction model; (3) to use the Tobit regression model to explore the factors affecting the CCD of new-type urbanization and TRCE in the Yellow River Basin; and (4) to provide a scientific basis and decision-making references for the high-quality development of a new-type urbanization construction and tourism industry in the Yellow River Basin.
2. Coupling Mechanism
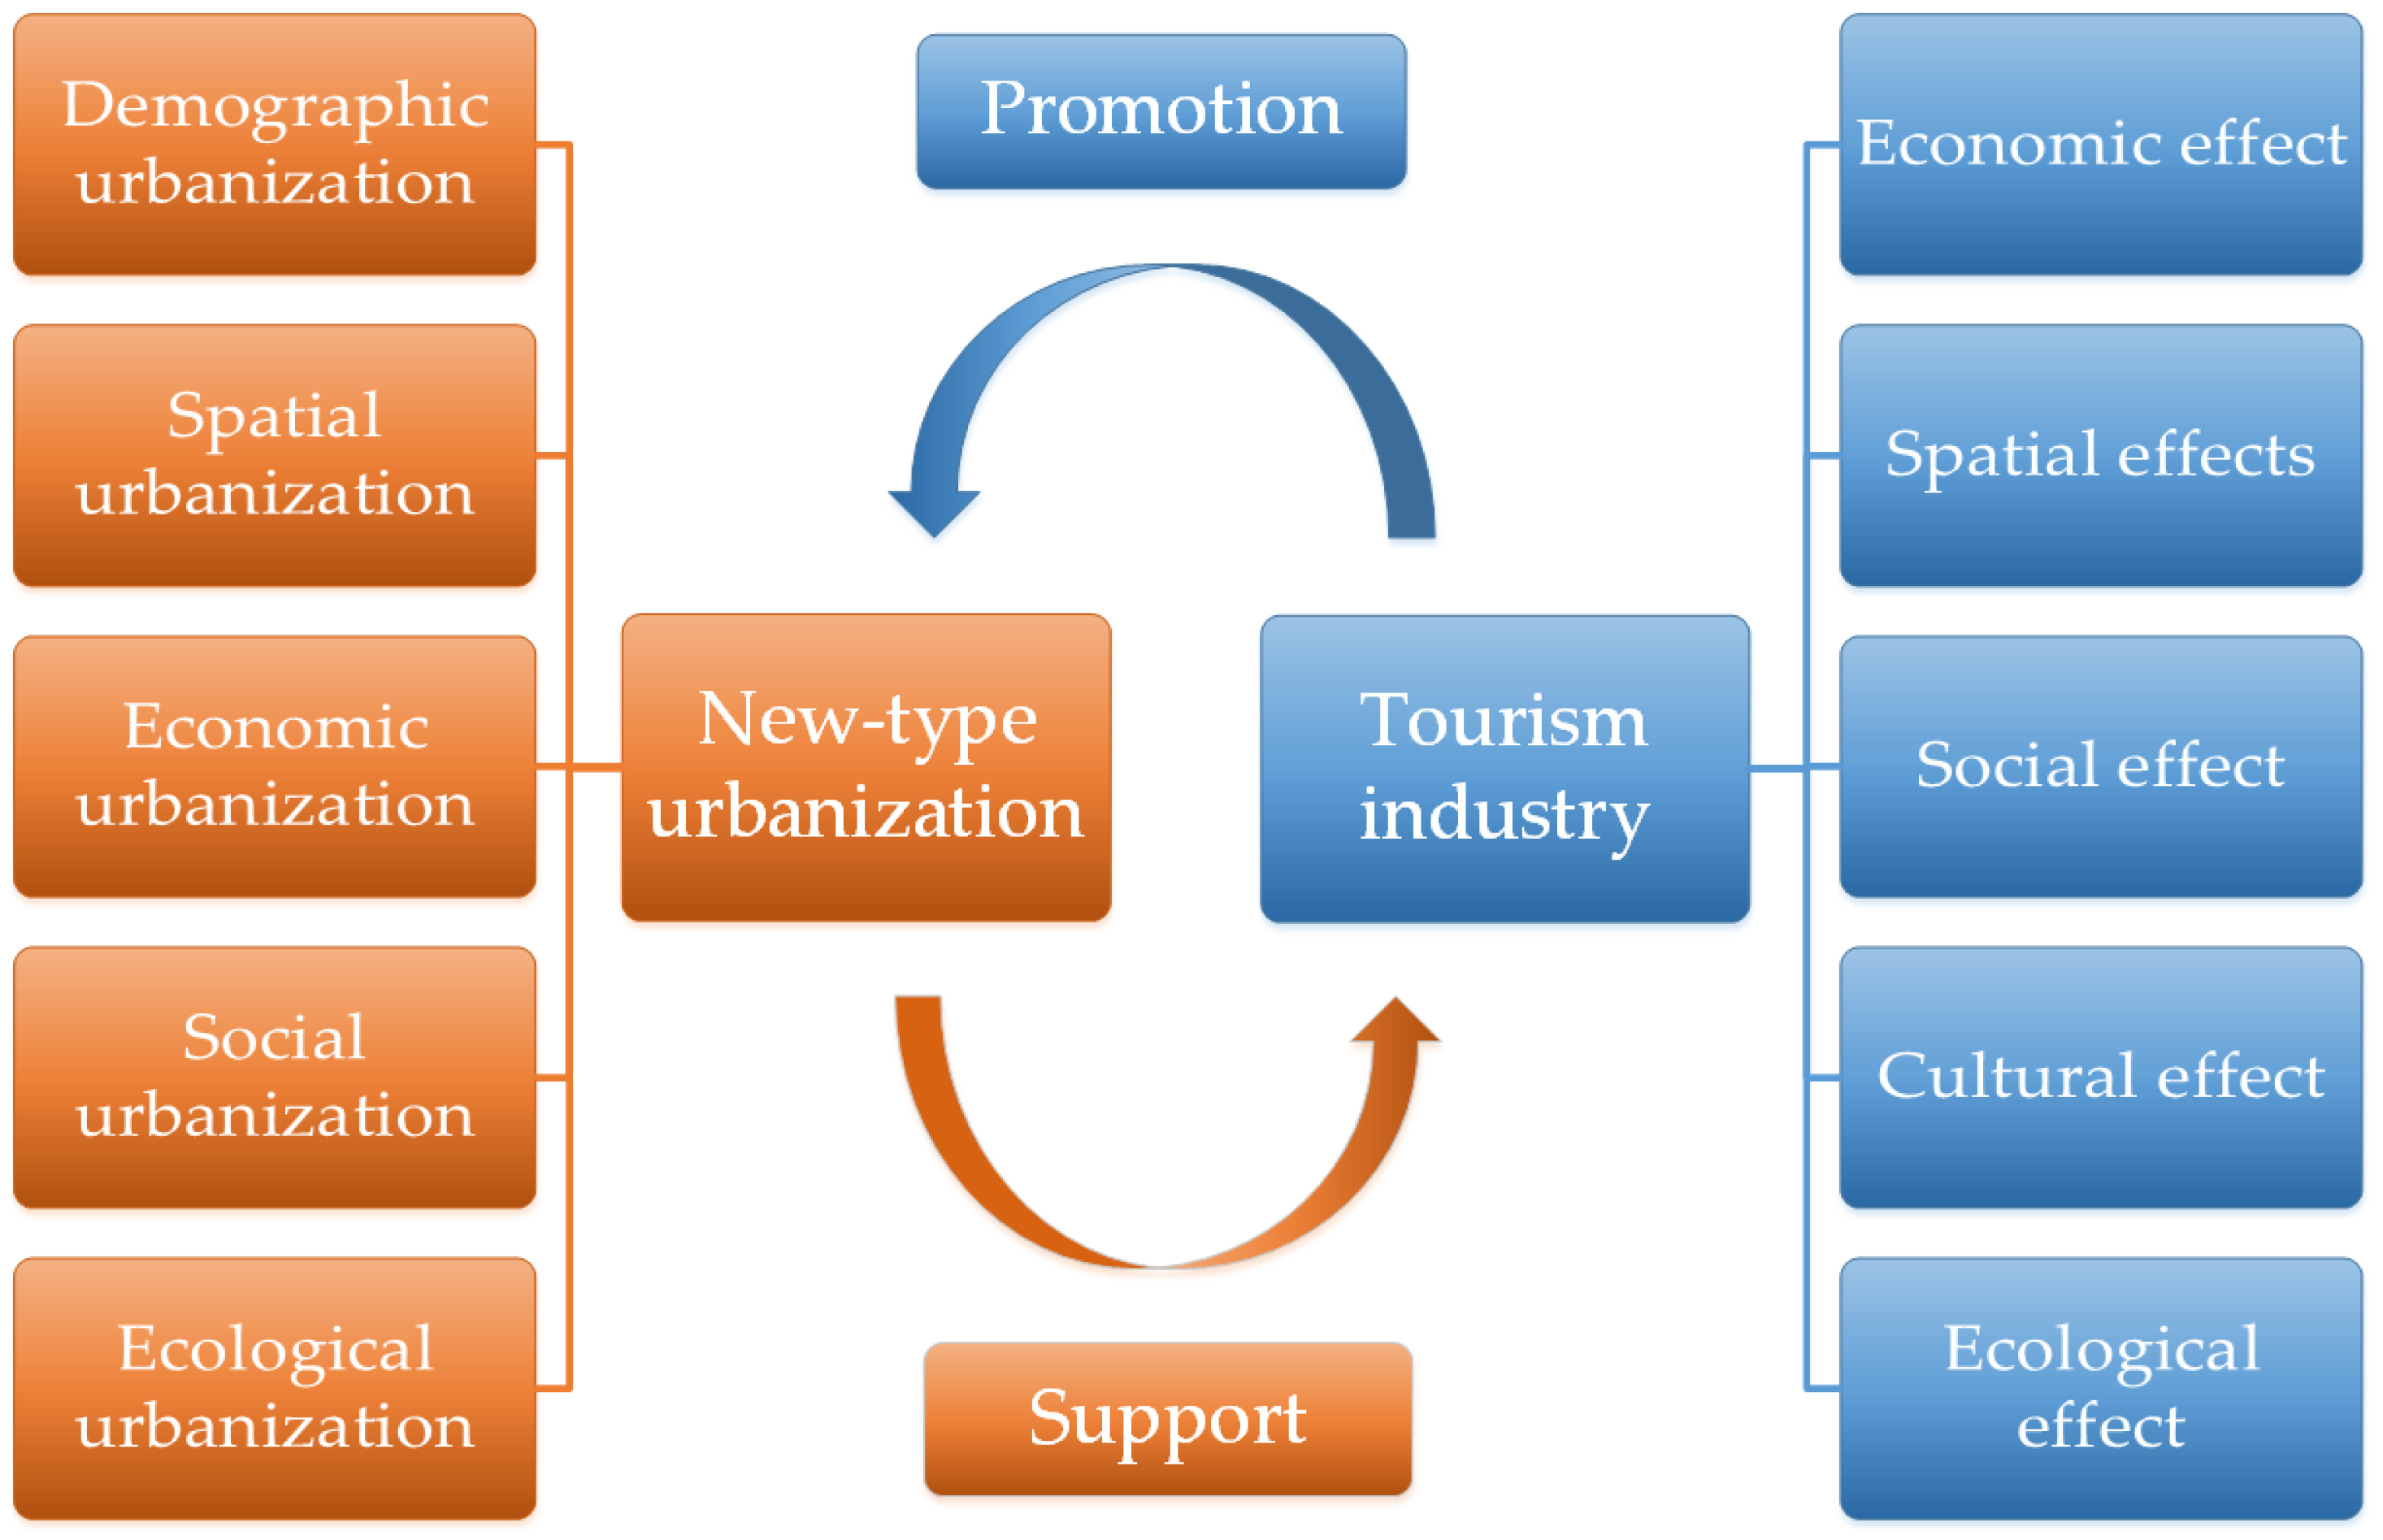
New-type urbanization and the tourism industry interact with each other [35]. On the one hand, new-type urbanization plays an important supporting role in the development of the tourism industry. New-type urbanization involves the gradual advancement of population, space, economy, society, and ecology, thus promoting population transfer and agglomeration and further improving and optimizing the level of economic development, the industrial structure, urban space, social development, and ecological environment. These actions promote the continuous accumulation of tourism production factors, optimize the industrial structure, consumption level, and spatial structure, effectively protect the resources and environment, and gradually expand the market scale, thus driving the development of the tourism industry. The development of the tourism industry also plays an important role in promoting new urbanization processes. The unique development mode of the tourism industry can effectively integrate with other industries to further expand its economic, spatial, social, cultural, and ecological effects. The economic effect leads to economic agglomeration, thereby expanding economic benefits and industrial scales and improving the quality of industrial development. The urban spatial layout and traffic network can be optimized and improved through the spatial effect. The social effect promotes employment and improves the level of urban public services. The ecological environment effect enhances environmental protection consciousness. The cultural effect promotes the growth of cultural places, supports traditional cultures, and promotes the development of new-type urbanization (Figure 1).
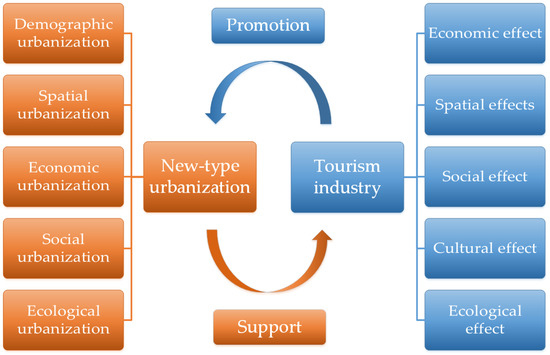
Figure 1.
Coupling mechanism between new-type urbanization and TRCE.
3. Materials and Methods
3.1. Study Area
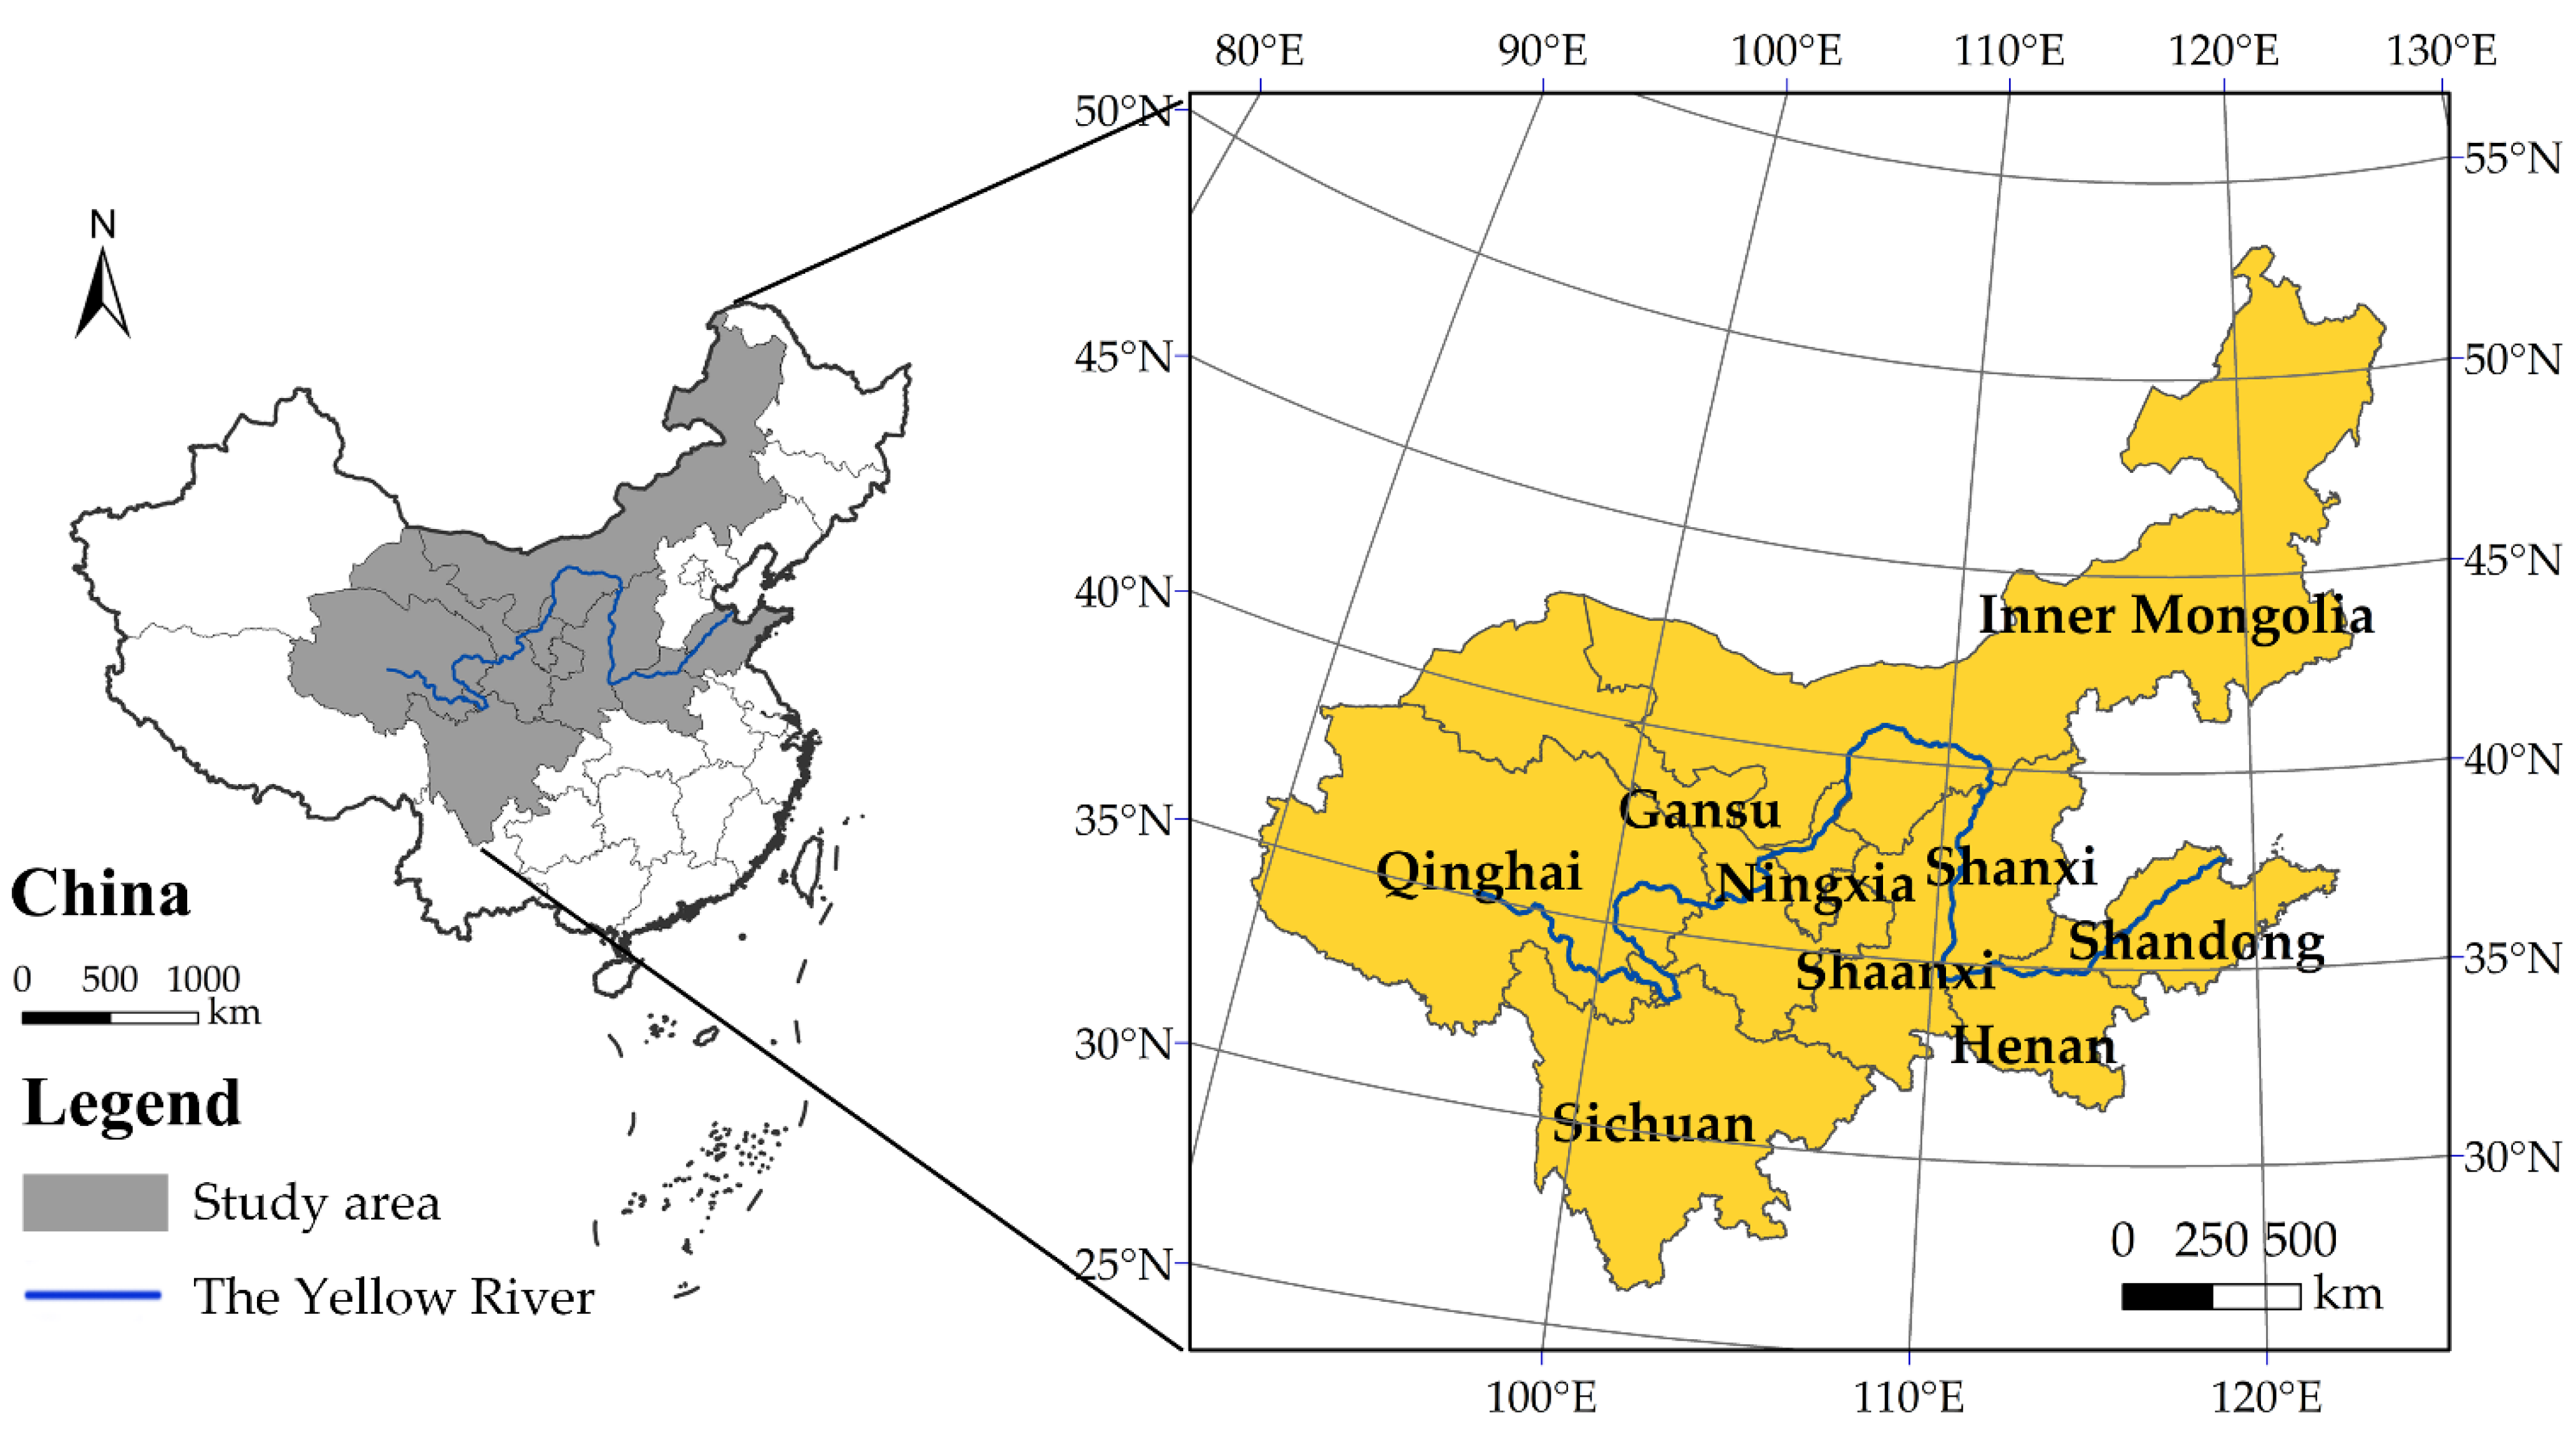
The Yellow River is a large river traversing eastern and western China. Its flow boundary is 32° N–42° N and 96° E–119° E. It covers Qinghai, Sichuan, Gansu, Ningxia, Inner Mongolia, Shanxi, Shaanxi, Henan, and Shandong provinces from west to east (Figure 2).According to statistics, at the end of 2019, the urbanization rate of the Yellow River Basin reached 57.19%. The number of scenic spots above grade 3A reached 3097, accounting for 30.37% of the national total. It is an important ecological security barrier and an important area for economic development in China.
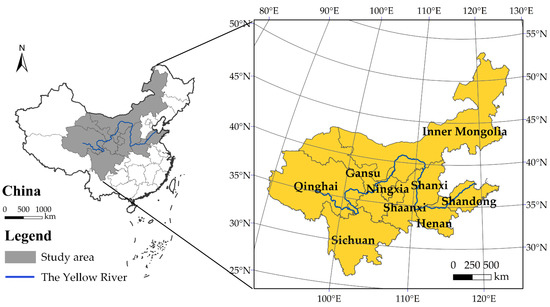
Figure 2.
Location of the study area.
3.2. Index System
3.2.1. Evaluation System of the New-Type Urbanization Development Index and TRCE Index
According to previous studies [36,37,38,39,40,41], the evaluation system of the new-type urbanization development index and TRCE is constructed by comprehensively considering the principles of scientificity and representativeness and the availability of indicators. The new-type urbanization development index primarily uses five evaluation dimensions: population, land, economy, society, and ecology. Fifteen indicators are used to represent the development level of new-type urbanization. TRCE selects the number of tourist attractions, the total investment of tourism assets, the number of employees in the tourism industry, the number of travel agencies, and the number of hotels with more than 3 stars as input indicators; it then selects the total tourism revenue and the total number of tourists as output indicators to represent TRCE, as shown in Table 1.

Table 1.
Evaluation system of the new-type urbanization development index and TRCE index.
3.2.2. Influencing Factors of CCD between New-Type Urbanization and TRCE
Because many factors affect the CCD of urbanization and TRCE, this study selects six variables according to previous research: industrial structure, post and telecommunications business, communication level, cultural and media investment, education investment, and science and technology investment [42,43]. It should be noted that the sources of variables are strictly consistent with the construction of new-type urbanization and TRCE, as shown in Table 2.

Table 2.
Influencing factors of CCD between new-type urbanization and TRCE.
3.3. Methods
3.3.1. Technical Route
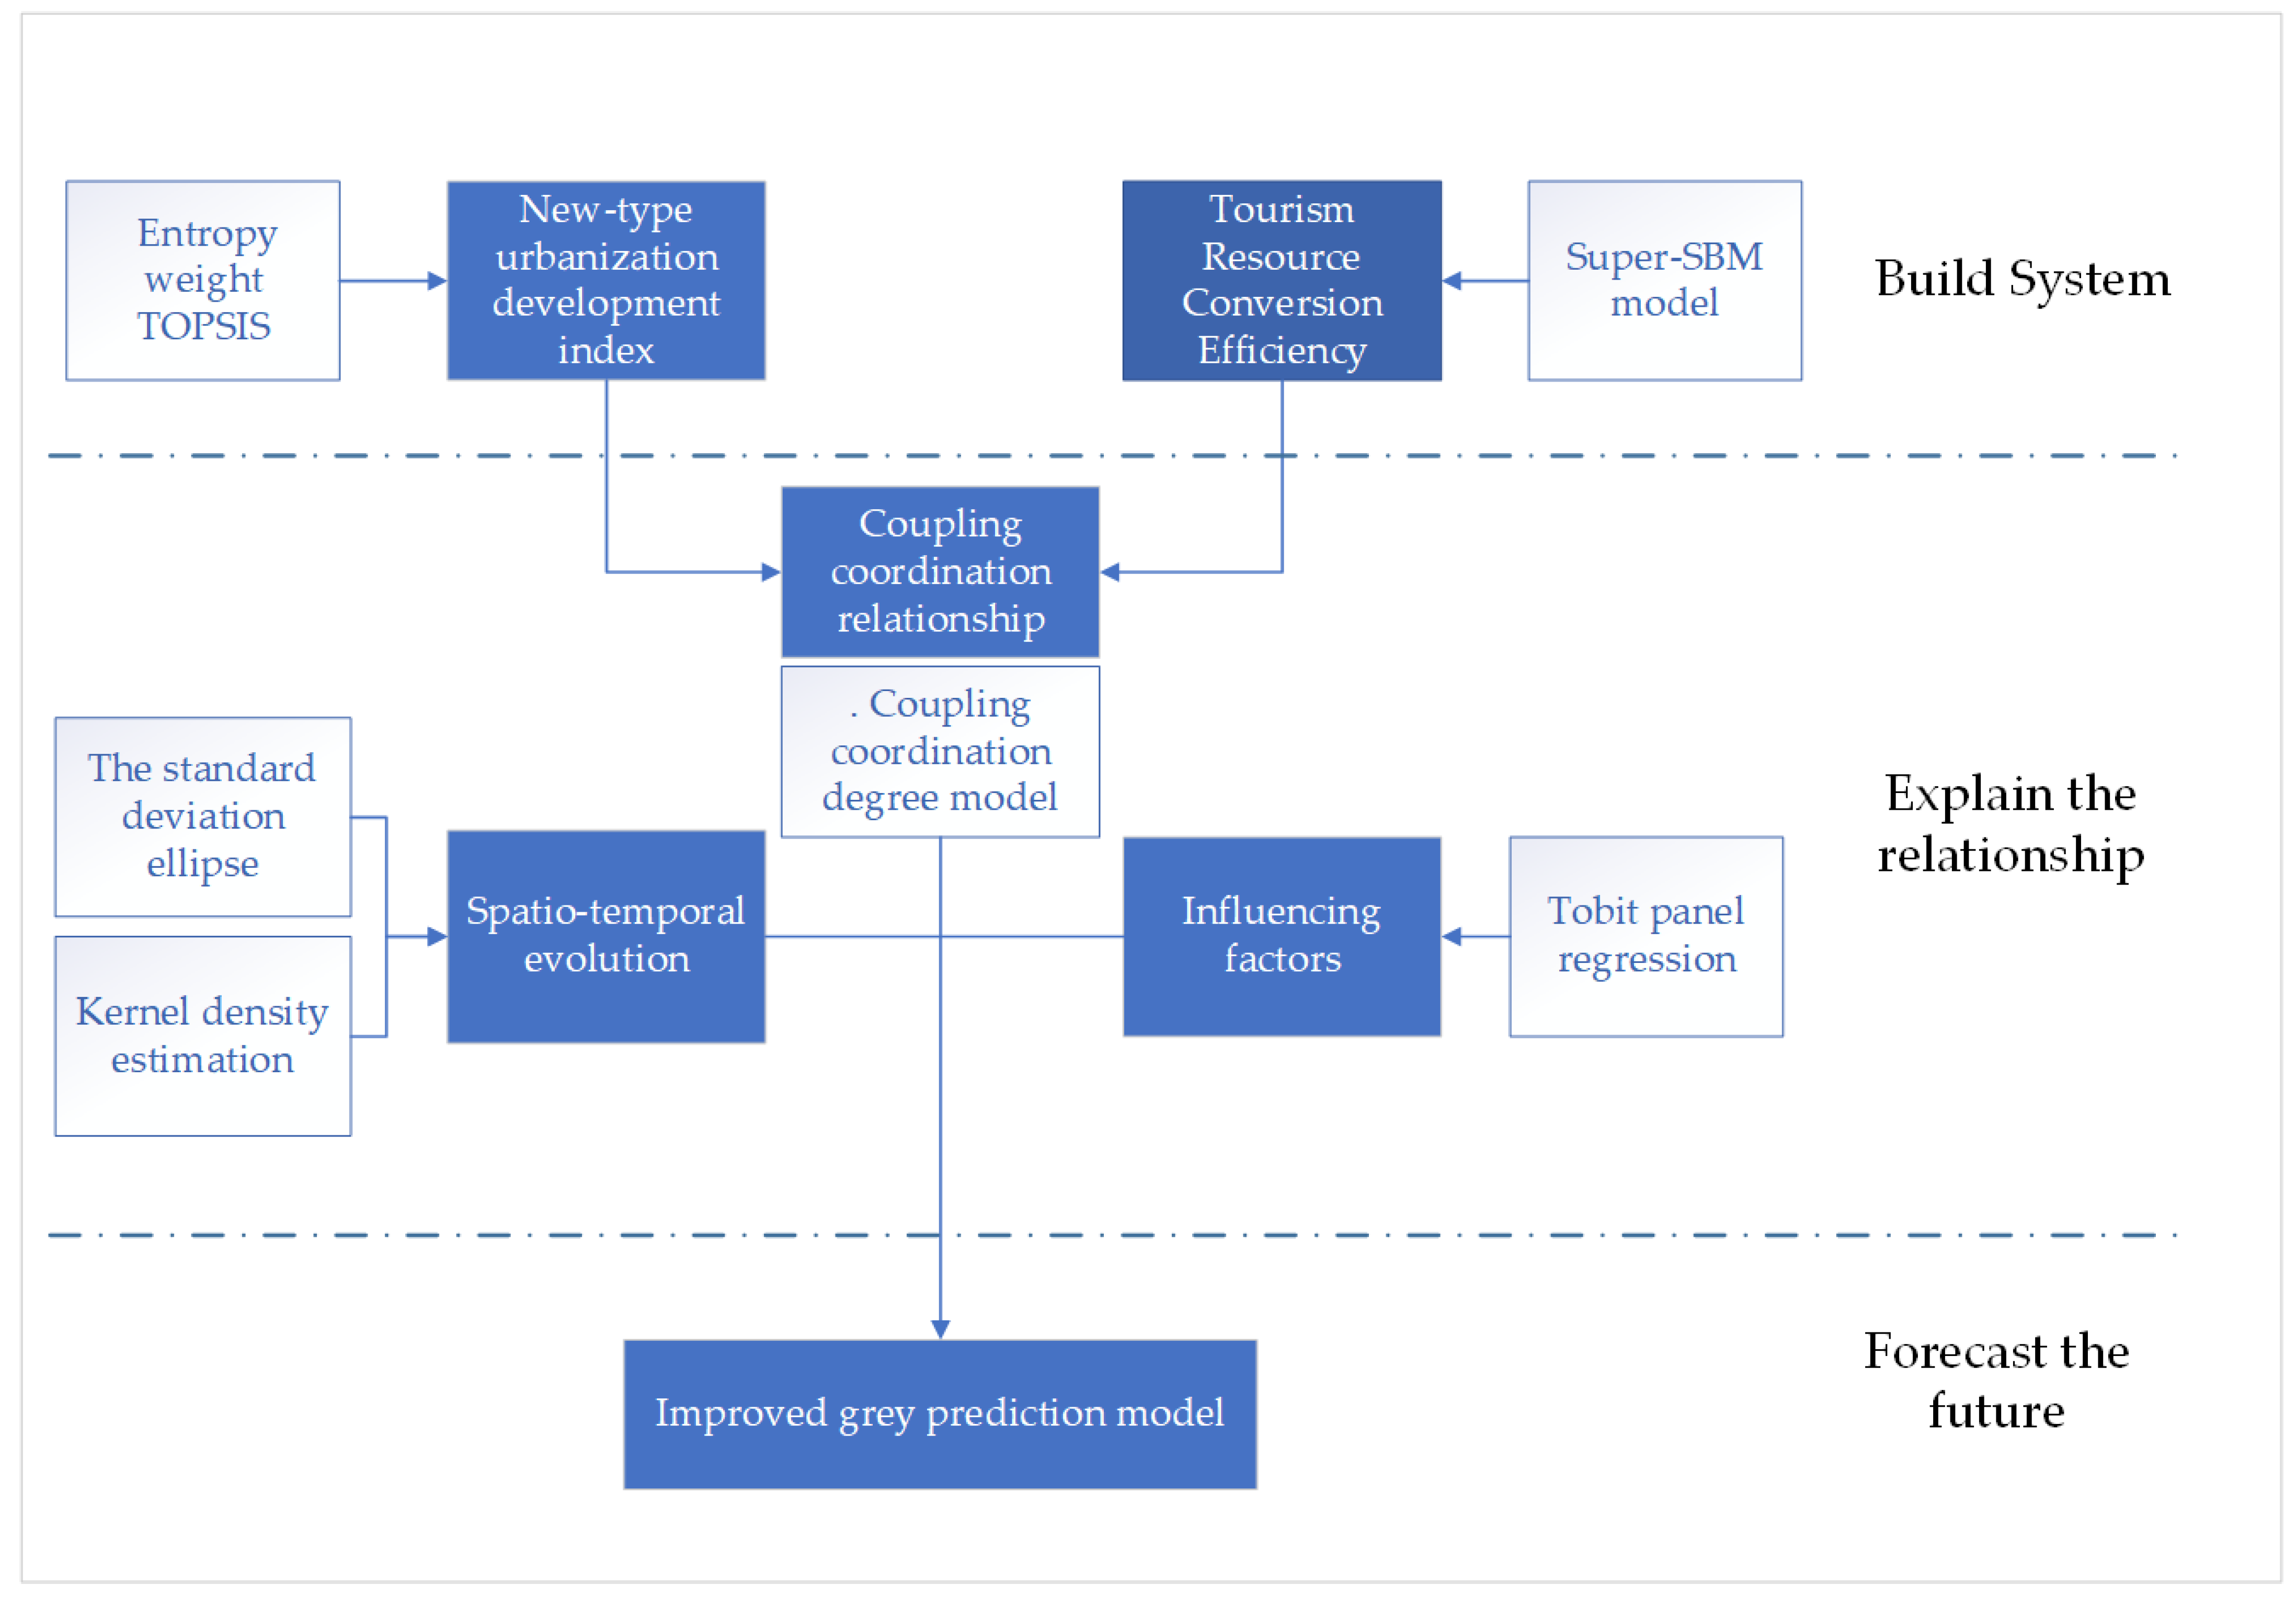
As shown in Figure 3. The methodology of this paper is mainly composed of three parts: building a system, explaining relationships and predicting the future. In the part of system construction, the entropy weight TOPSIS and Super-SBM model are mainly used to build the evaluation system. In the part of relationship interpretation, the coupling coordination model is mainly used to construct the relationship, the standard deviation ellipse and kernel density estimation are used to conduct spatio-temporal analysis, and tobit regression is used to detect the influencing factors. Finally, the improved grey prediction model is used for future prediction.
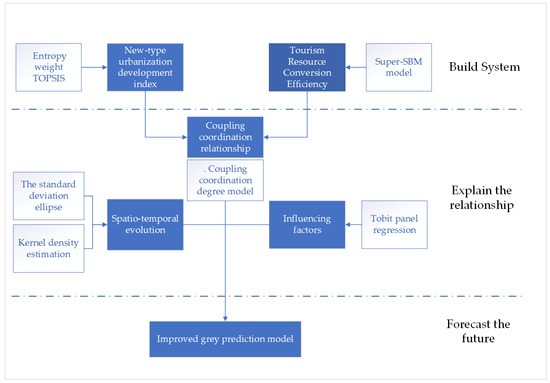
Figure 3.
Technical route.
3.3.2. Entropy Weight TOPSIS
The TOPSIS model is a common multiobjective decision-making method used to determine the advantages and disadvantages of each evaluation object according to the distance between different evaluation objects and positive and negative ideal solutions. It has the advantages of simple calculation, small sample size, and reasonable results. However, the deficiency of the TOPSIS method is that it is easily affected by the subjective consciousness of evaluators when determining the weight, so it has a certain subjectivity. The entropy weight method is an objective weighting method that uses the original data and the degree of index difference to determine weight. Therefore, the combination of the TOPSIS method and the entropy method can effectively avoid the subjective influence of TOPSIS and reflect the dynamic changes in the new-type urbanization level in the Yellow River Basin more objectively and comprehensively. The specific steps are as follows [44]:
- (1)
- Data standardization.
- (2)
- Calculate the weight of each index.
Calculate the proportion of indicators:
Calculate the information entropy of the index:
Calculate information entropy redundancy:
is the evaluation year and the index weight is calculated:
- (3)
- According to the standardized data and index weights, a weighting matrix is constructed.
- (4)
- According to the weighting matrix , determine the optimal and the worst scheme :
- (5)
- Determine the distance between each measurement object and the optimal and worst schemes.
- (6)
- Calculate the proximity between the measure object and the ideal scheme:
is the score of the new-type urbanization development level, ranging from 0 to 1. The larger the is, the higher the development level, and vice versa.
3.3.3. Super-SBM Model
Data envelopment analysis (DEA) is a nonparametric efficiency evaluation method that is based on multiple inputs and outputs and can evaluate the relative efficiency of multiple decision-making units. However, the traditional DEA model is based on the angle and radial direction of use and therefore ignores the relaxation variables and is unable to further distinguish the effective decision-making units. For this reason, Tone proposed a nonradial and nonangular Super-SBM model that not only brings the relaxation variables directly into the objective function and eliminates the influence of the relaxation variables on the results but also effectively distinguishes multiple effective decision-making units with efficiency values of 1 and improves the accuracy of the measures [45]. This model assumes that there is a decision-making unit (DMU). Each DMU has inputs and outputs. represents the input and output variables of the decision-making unit, and represent the relaxation variables of input and output, is the constraint condition, and is the efficiency value. The model is as follows:
3.3.4. Coupling Coordination Degree Model
CCD is an index used to measure the coordination between systems and describe the synergy between two or more systems. Based on related research [46], this paper constructs a new type of urbanization (U1) and TRCE (U2) coupling coordination degree model. The specific model is as follows:
where U1 and U2 are the new urban development index and TRCE, respectively; C is the coupling degree of the two systems; and α and β are undetermined coefficients. In this paper, α and β are assigned to 0.4 and 0.6 according to previous studies [47]; T is the comprehensive development index of the two systems; and D is the degree of coordination, which represents the overall degree of coordination between new-type urbanization and TRCE. CCD is divided into seven grades, as shown in Table 3.

Table 3.
CCD type.
3.3.5. Improved Grey Prediction Model
Grey system theory is a scientific method that takes the “small sample” and “poor information” uncertainty systems with partial information known and partial information unknown as the research object, obtains the change law of system operation and makes fuzzy judgements on the unknown information through the generation, development, and extraction of “partial” known information. Its advantages include a small workload and high prediction accuracy. The traditional GM (1,1) model is widely used and suitable for the prediction of a small amount of short-term data, but it lacks self-learning and adaptive ability. To further improve the accuracy of the model, the new information grey model and metabolism grey model were subsequently proposed [48]. Based on the existing data, this paper verifies the above three grey models and selects the model with the smallest error to determine the final prediction result. The specific model is as follows:
Let be the original sequence of GM (1,1) model modeling:
One-time cumulative sequence:
Definition 1.
is the grey differential equation of the GM model.
In the formula,is the development coefficient, and
is the ash dosage.
The parameters are determined by the least square method:
In the formula:
The whitening equation of the GM (1, 1) model is as follows:
The time response formula of the GM (1, 1) model is as follows:
Reduction value:
Grey model of metabolism:
- Raw data: .
- Place new information: , eliminate the oldest information .
- Obtain .
The remainder should be established according to the above steps.
Grey model of new information:
- Raw data: .
- Let be the latest information. Put into .
- Obtain .
The remainder should be established according to the above steps.
3.3.6. Kernel Density Estimation
The kernel density estimation is a nonparametric estimation method that has the advantages that the function form can be set at will, the distribution form of explanatory variables and explained variables is less limited, and it has strong adaptability. The data produced by the coupling coordination degree often cannot match some established distribution forms [49]. Therefore, it is more appropriate to estimate the overall distribution characteristics by using the kernel density function, which can better reflect the time trend of the coupling coordination degree.
In the formula, is the bandwidth, is the kernel density function, is the number of observations, is the observation, and is the mean value of observations.
3.3.7. Tobit Panel Regression
The Tobit regression model is also called the limited dependent variable model [50]. Because the value range of the coupling coordination degree is between 0 and 1, the data are truncated; if the least square method (OLS) is used for regression, the data cannot be fully presented, which will cause the deviation of the regression results. Therefore, the Tobit regression model is selected for analysis. Its principle is as follows:
In the formula, is a dependent variable, is an independent variable, is a parameter to be estimated, and is a random error.
3.4. Data Sources
This study uses 2010–2019 as the research period and nine provinces and cities in the Yellow River Basin as the research areas. The administrative division boundary comes from the National Geographic Information Resources Directory Service System (https://www.webmap.cn/, accessed on 1 April 2022). Social statistical data come from the China Statistical Yearbook (2011–2020), China Tourism Statistical Yearbook (2011–2020), China Cultural Relics and Tourism Statistical Yearbook (2019–2020), and statistical yearbooks and bulletins of various provinces (https://data.cnki.net/Yearbook/, accessed on 1 April 2022).
4. Results
4.1. Spatiotemporal Characteristics of the New-Type Urbanization Development Index and TRCE
4.1.1. New-Type Urbanization Development Index
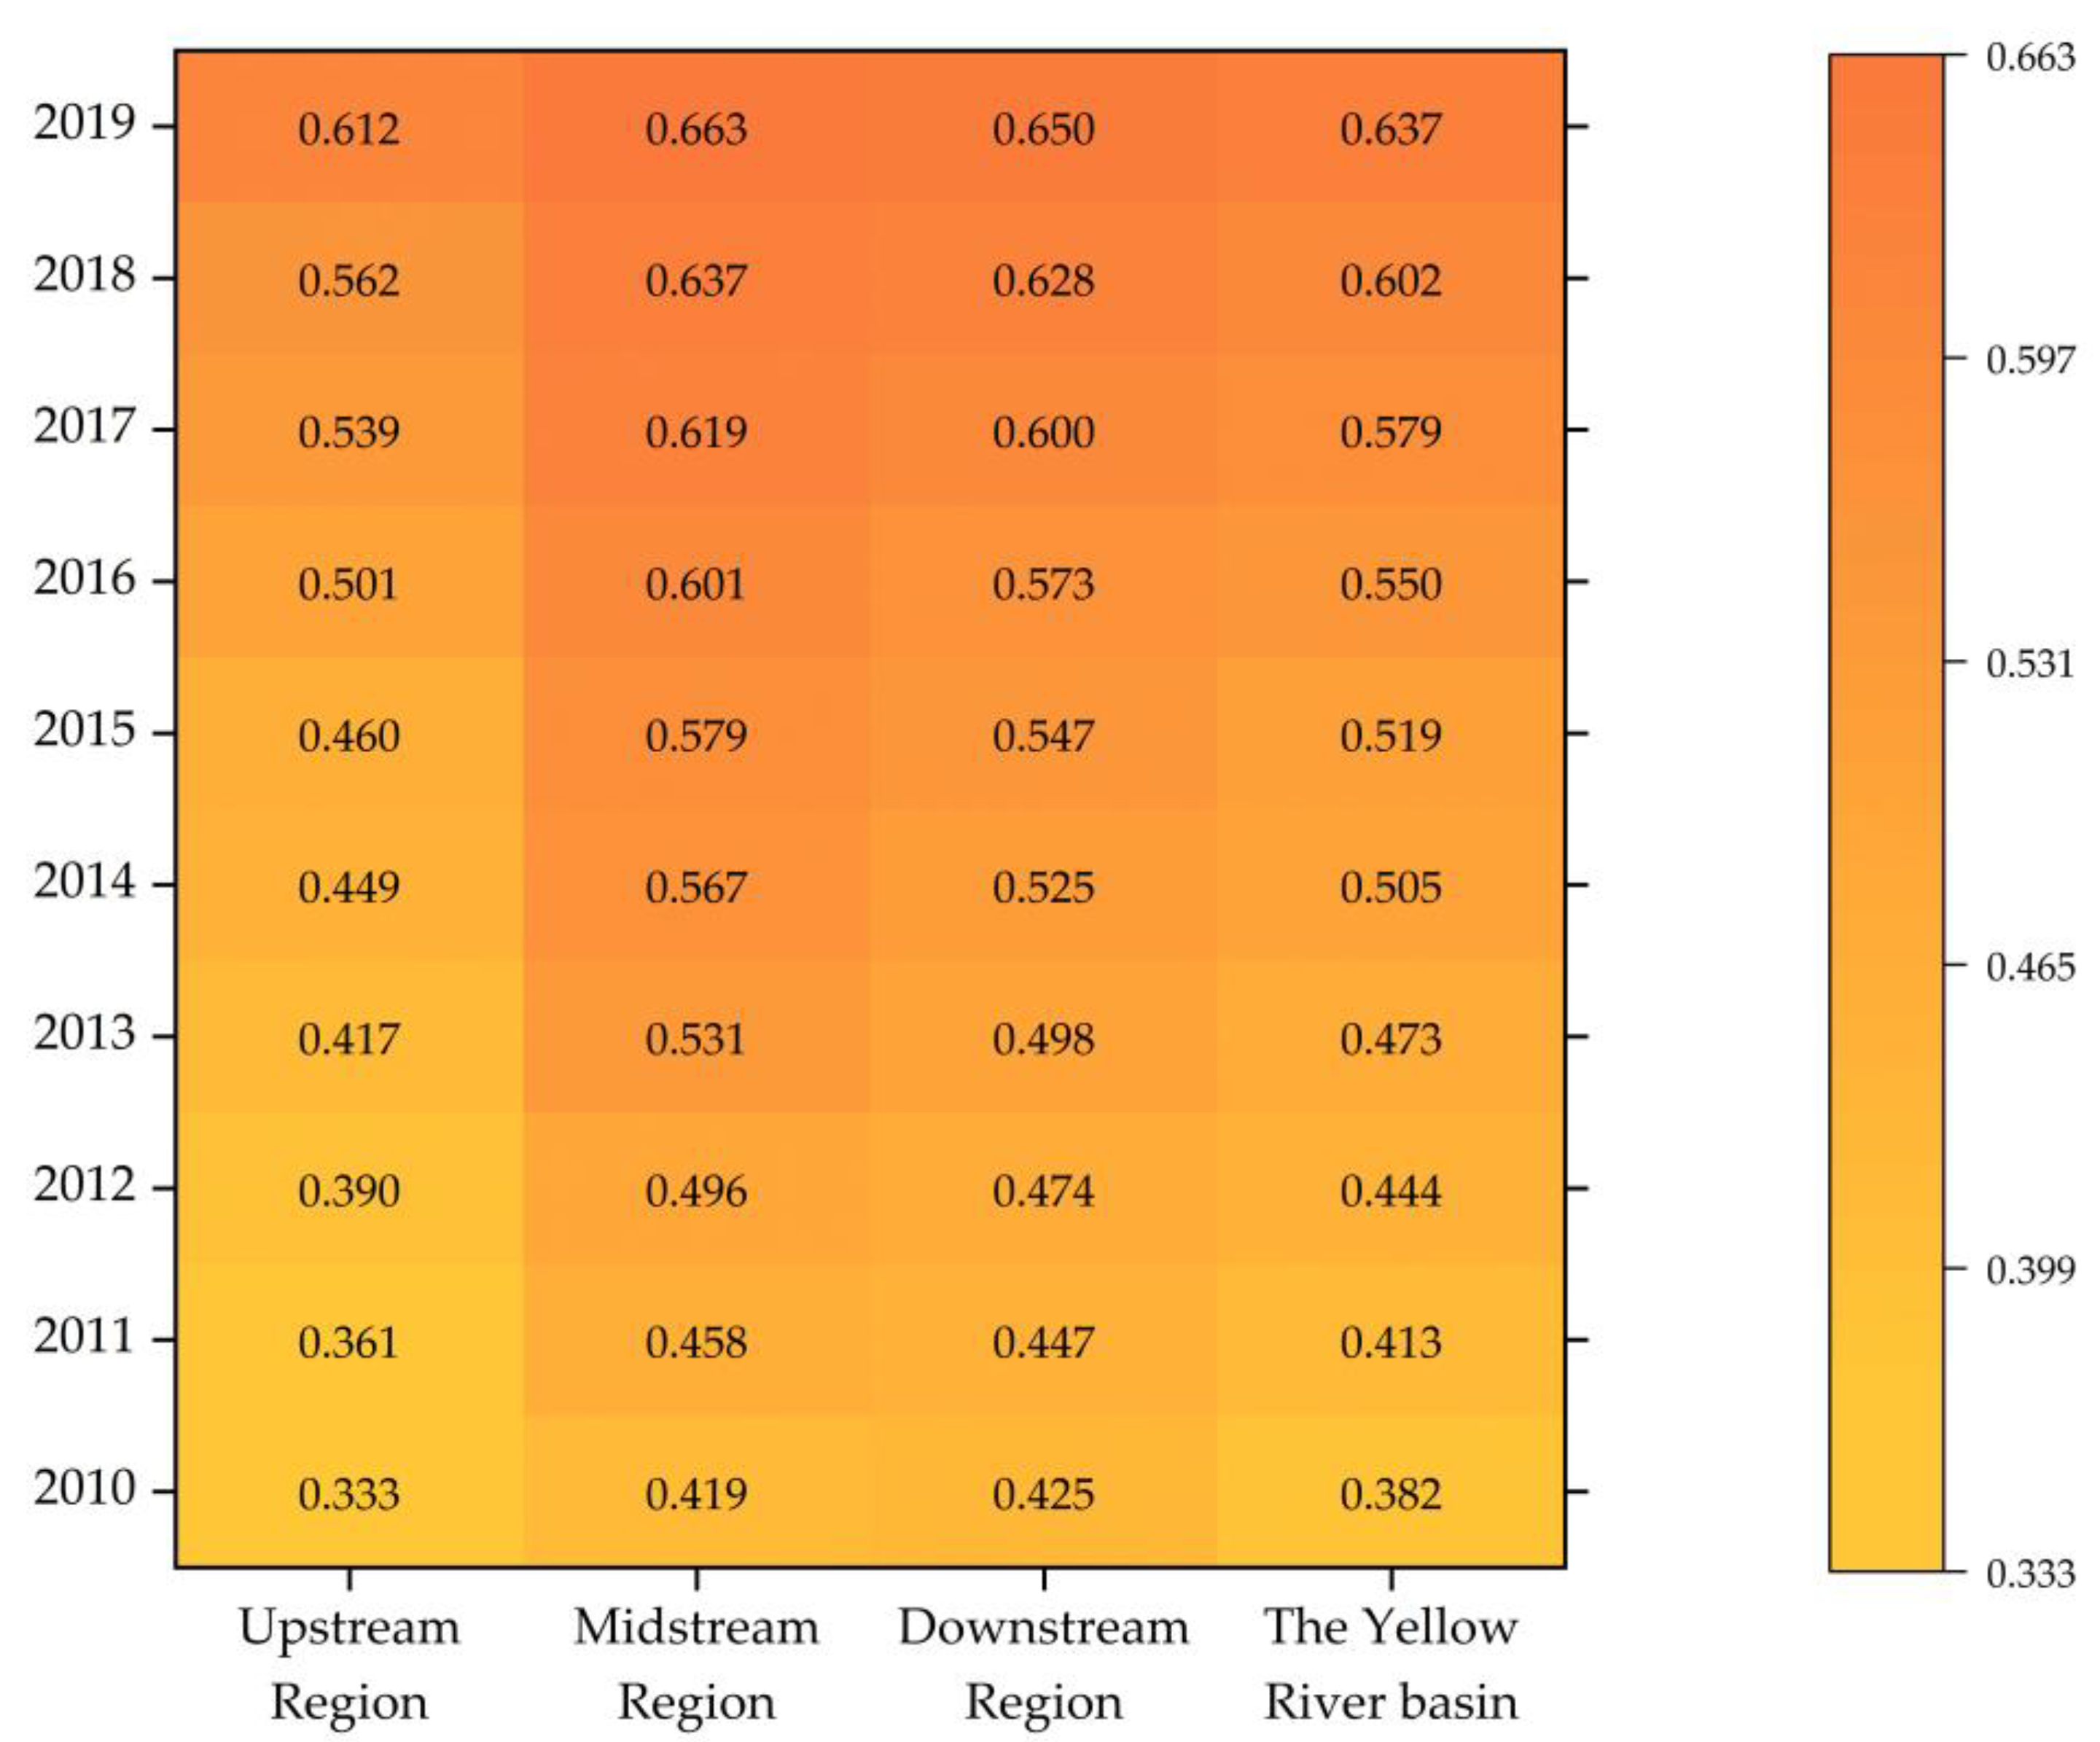
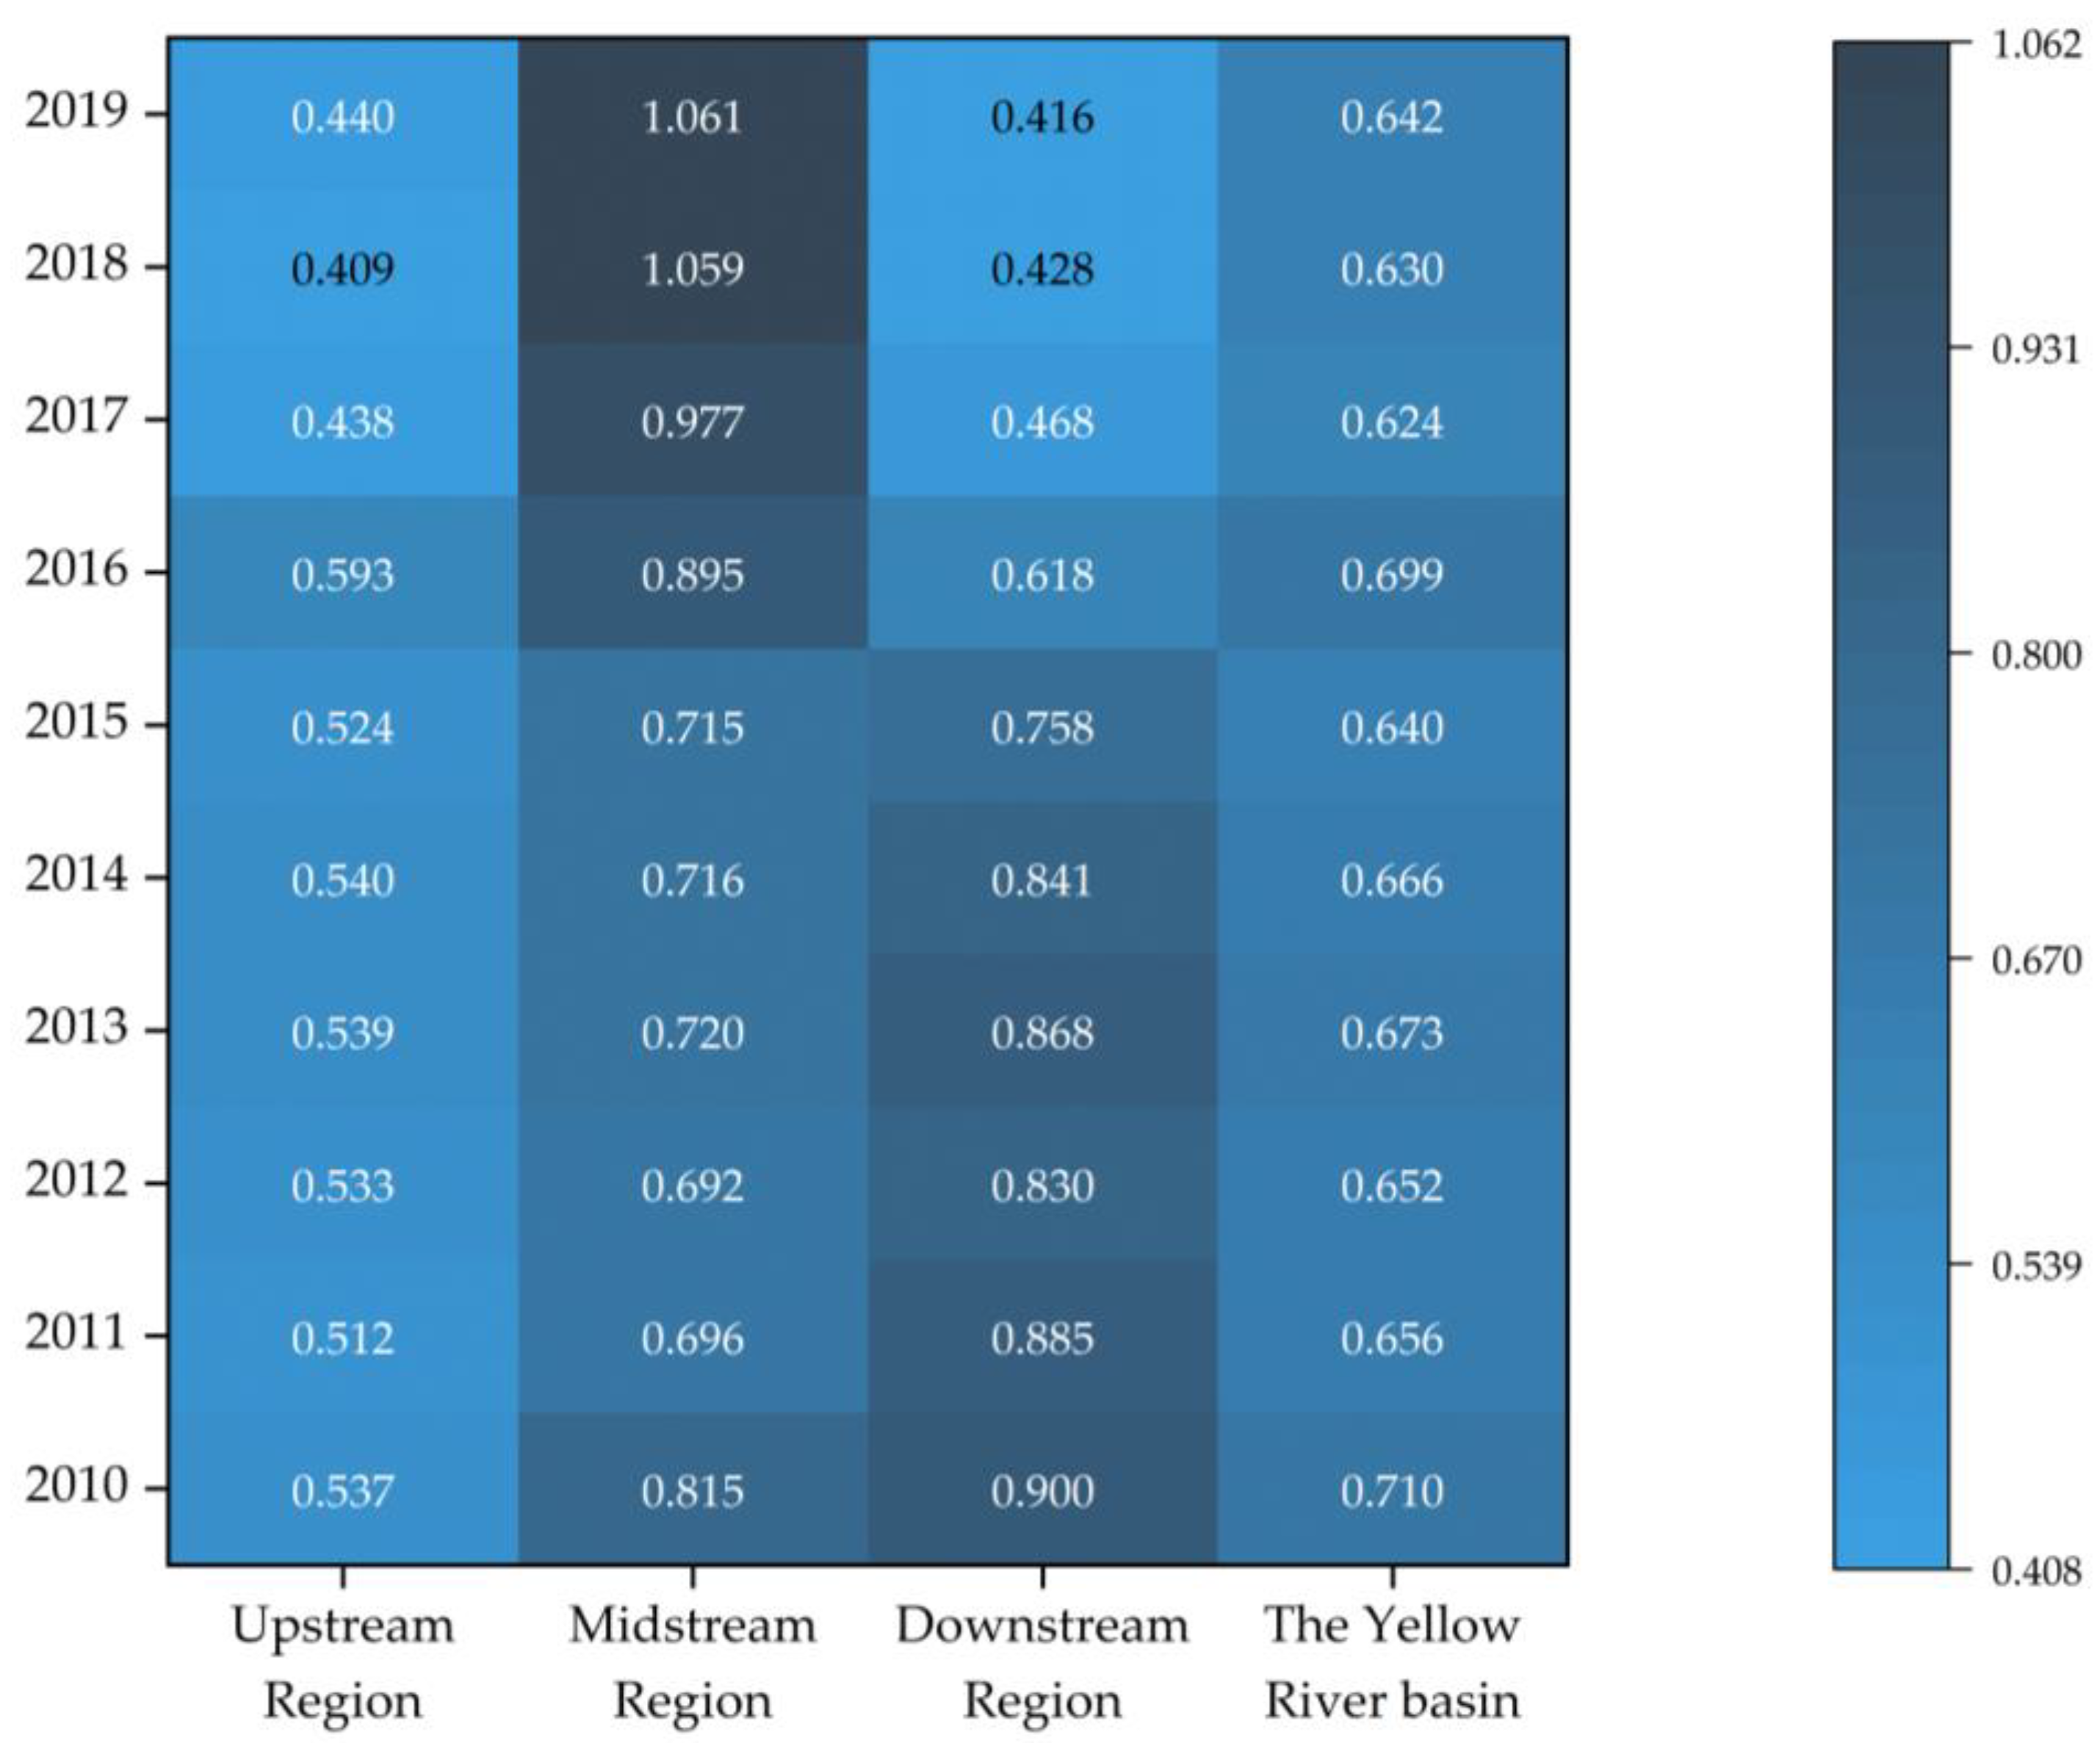
As seen from Figure 4, from 2010 to 2019, the development index of new-type urbanization in the Yellow River Basin showed a steady upwards trend. From 2010 to 2014, the new-type urbanization development index increased rapidly from 0.382 in 2010 to 0.505 in 2014, with an increase rate of 32.20%. The growth rate slowed in 2014–2015 and then showed a rapid growth trend after 2015, increasing from 0.519 in 2015 to 0.637 in 2019, with an increase rate of 22.74%. The Yellow River Basin is divided into three sections: the upstream region includes Qinghai, Sichuan, Gansu, and Ningxia; the midstream region includes Inner Mongolia, Shanxi, and Shaanxi, and the downstream region includes Henan and Shandong [51]. From a spatial point of view, with the exception of 2010, when the downstream region was slightly higher than the midstream region, the new-type urbanization development in the Yellow River Basin had a distribution pattern of midstream region > downstream region > upstream region. The development level of the middle and downstream regions is similar, but the upstream region is consistently last, indicating that a large gap remains between the urbanization development level of the upstream region and that of the middle and downstream regions. This situation is attributed to the fact that most of the upstream region is located in northwest China, which has a relatively weak economic foundation and a low urban agglomeration effect, while the middle and downstream regions are close to east China, which has a relatively superior geographical position, good economic development, and remarkable urban agglomeration effect. Despite this, the gap between the upstream region and the middle and downstream regions has clearly narrowed as the difference between it and second place has decreased from 0.086 in 2010 to 0.038 in 2019, indicating rapid growth.
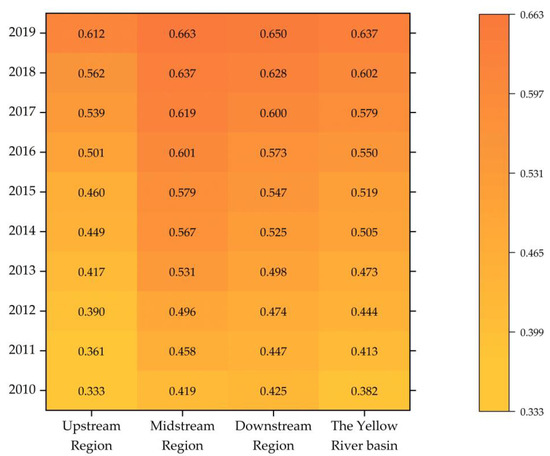
Figure 4.
Development index of new-type urbanization in the Yellow River Basin from 2010 to 2019.
4.1.2. Tourism Resource Conversion Efficiency (TRCE)
As seen in Figure 5, from a temporal point of view, the TRCE in the Yellow River Basin showed a steady development trend from 2010 to 2019 and the efficiency values remained above 0.62. Although it fluctuated slightly in each year, the fluctuation range was small. From 2010 to 2011, the TRCE in the Yellow River Basin declined slightly and the change in the efficiency values in the subsequent period slowed as a whole. By 2016, there was a significant increase. In 2017, there was a slight decline, and the subsequent period remained stable. From a spatial point of view, from 2010 to 2015, the TRCE in the Yellow River Basin showed a distribution pattern of downstream > midstream > upstream. Since 2015, the growth momentum in the midstream region has been strong, with a growth ratio of 48.39% in 2015–2019, ranking the highest of the three regions. In the downstream region, the downwards trend is obvious and, in 2019, it was overtaken by the upstream region by 5.77%. There has always been a large gap between the upstream region and the middle and downstream regions, but, since 2016, the gap between the upstream region and the downstream region has gradually narrowed and the upstream region jumped to second place in 2019. This shows that the catch-up effect in the middle and upstream regions of the river is remarkable and that the tourism industry reform is quite effective. However, although the resources in the downstream region of the river are abundant and the infrastructure is complete, the rapid expansion of the tourism industry has caused the consumption capacity to not fully match, resulting in oversupply and leading to a decline in efficiency.
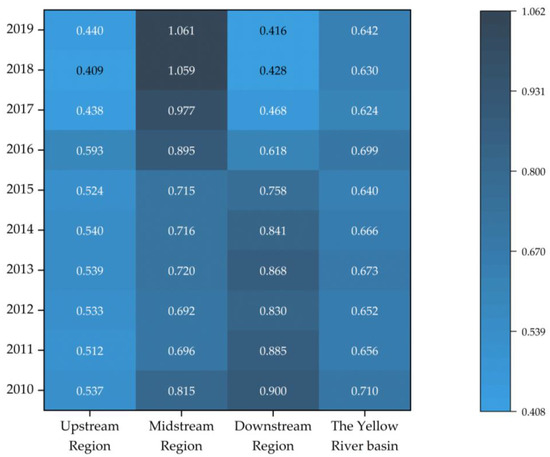
Figure 5.
TRCE in the Yellow River Basin from 2010 to 2019.
4.2. Spatiotemporal Characteristics of CCD between New-Type Urbanization and TRCE
4.2.1. Time Series Characteristics
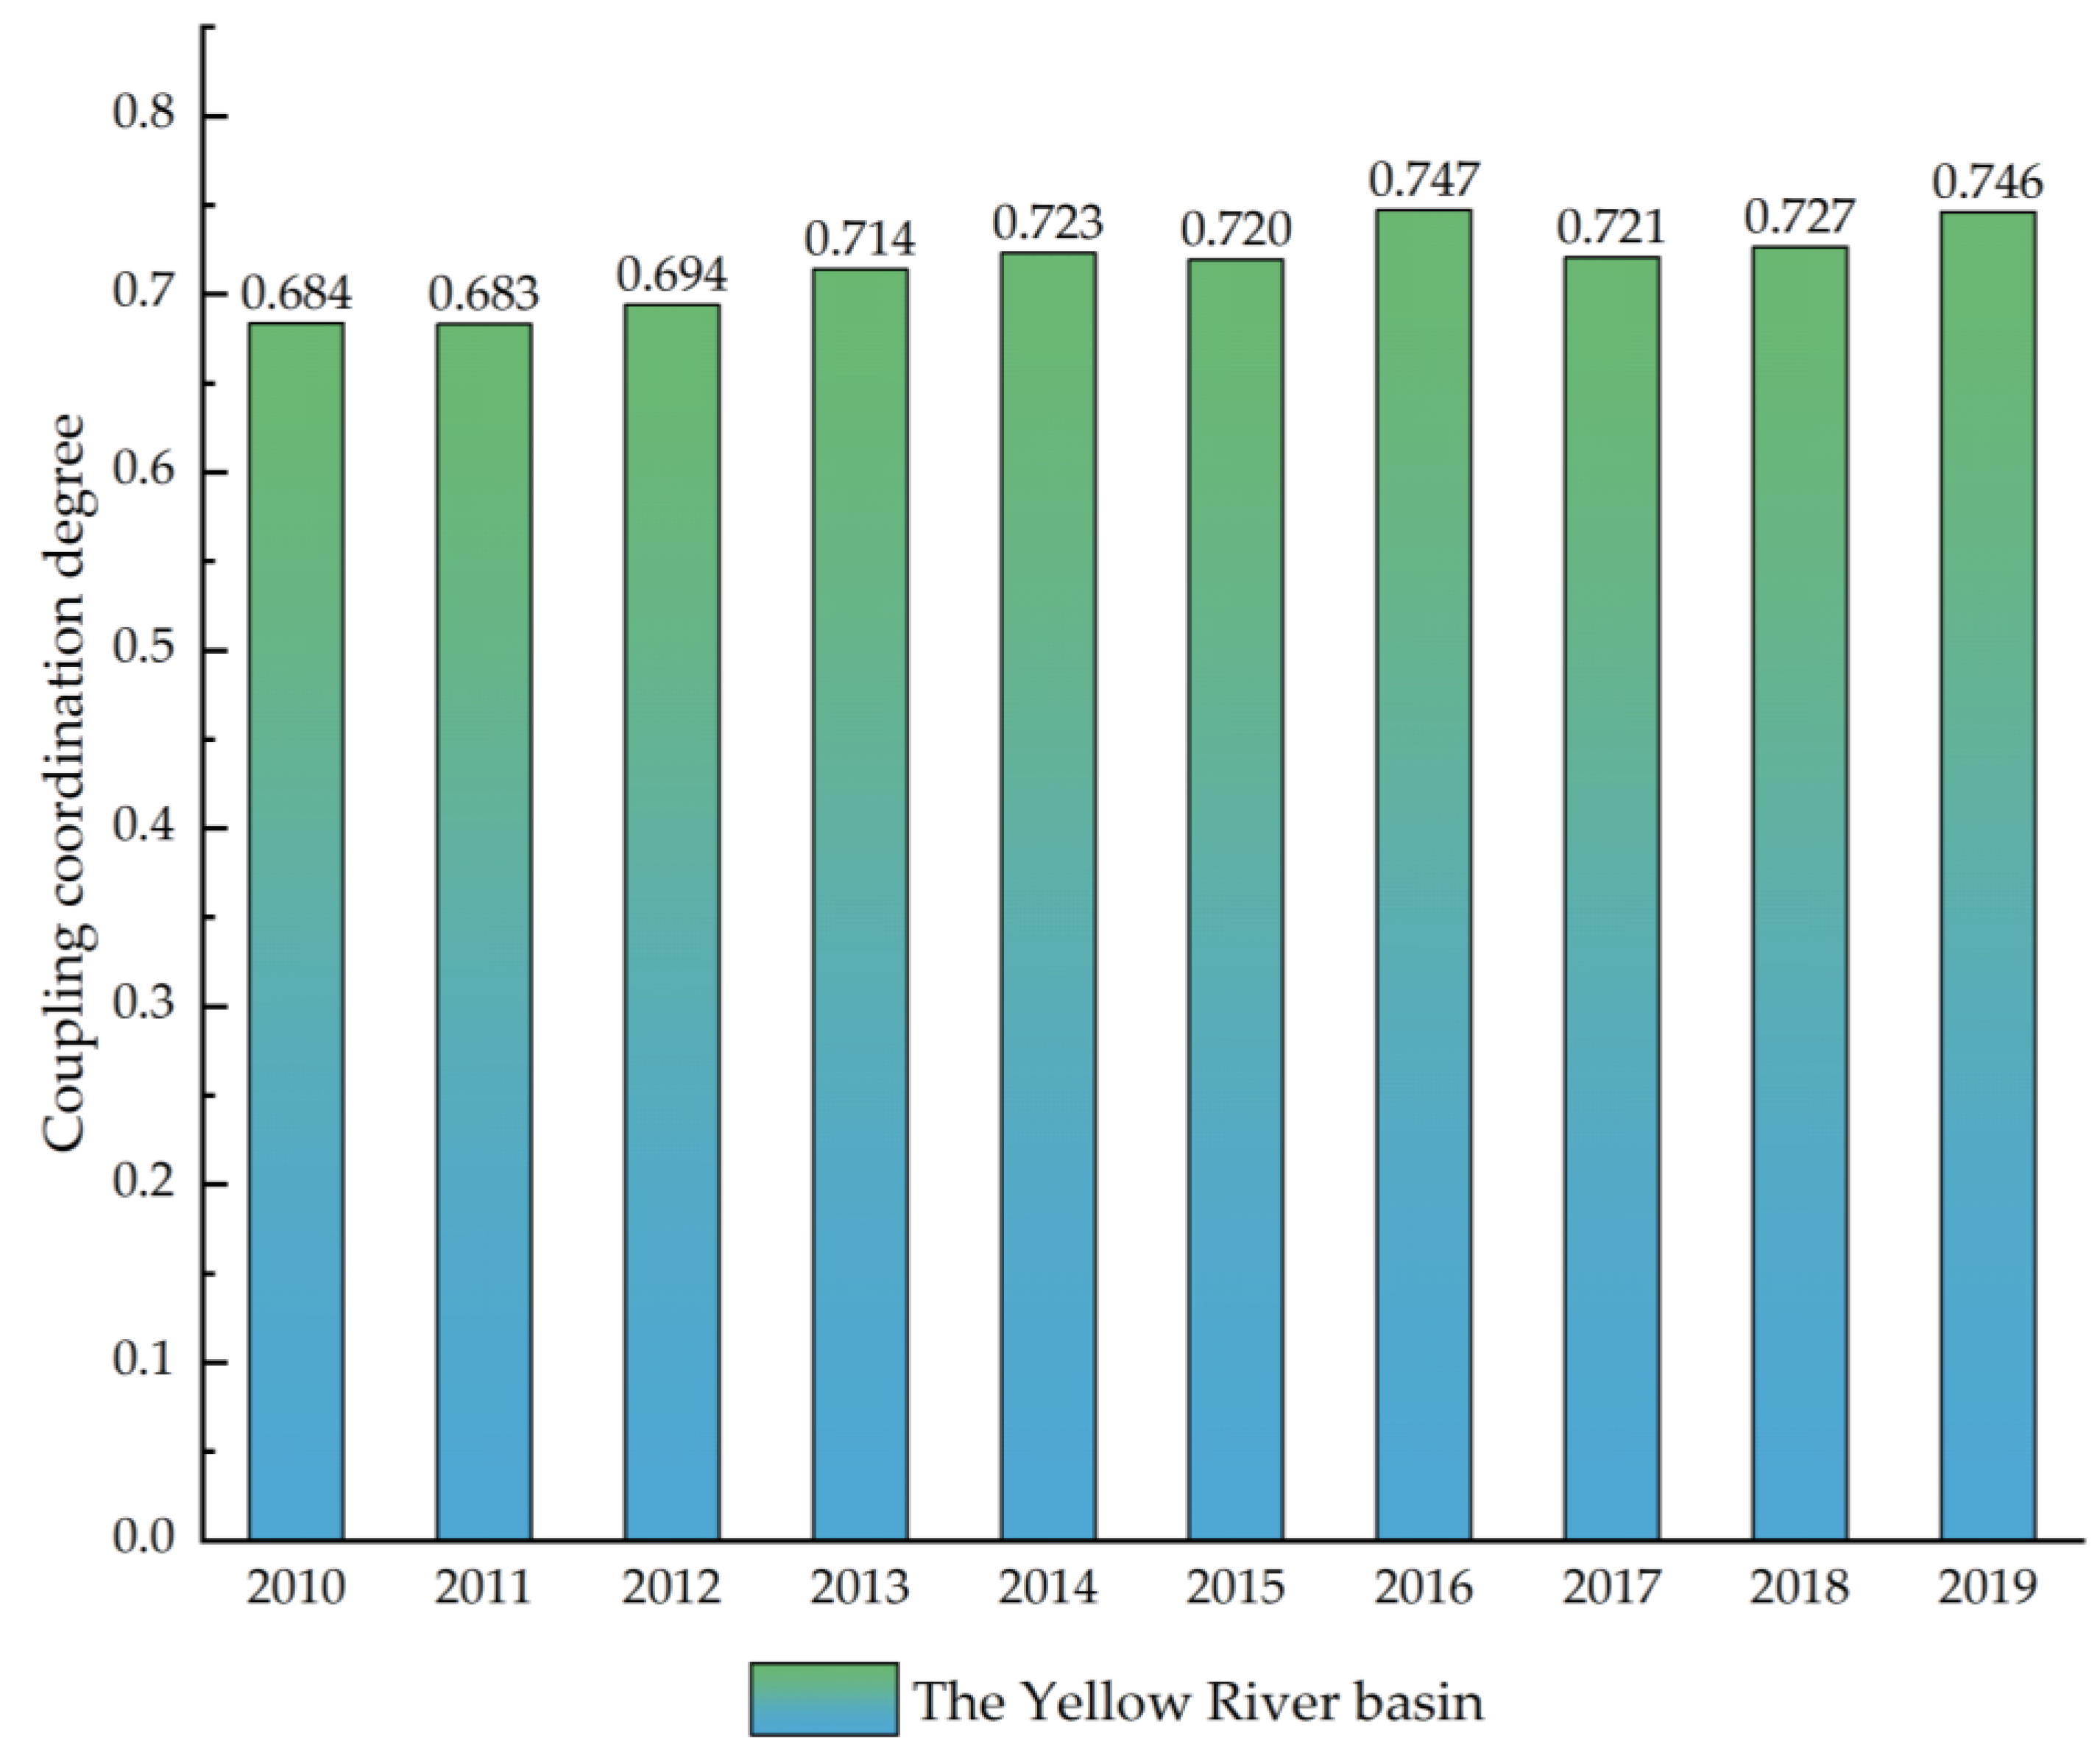
As seen from Figure 6, from 2010 to 2019, the average annual index of the CCD between new-type urbanization and TRCE in the Yellow River Basin was 0.716, which falls within the intermediate coordination stage. The CCD has progressed steadily each year and the overall coordination level between new-type urbanization and TRCE has continuously improved. From 2010 to 2016, the CCD showed a fluctuating growth trend, reaching its highest point in 2016 with a value of 0.747. There was a slight decline in 2016–2017 and continued growth again in 2017–2019. In February 2016, the State Council issued “Several Opinions on Deepening the Construction of New-type urbanization”, which emphasized people as the core and quality improvement as the key and also highlighted point-to-point integration, overall promotion, and overall improvement in urbanization quality. Hence, since 2016, China’s new-type urbanization has entered a new stage, and the tourism industry has ushered in new development opportunities. In 2016, “Mass Tourism” was written into the government work report for the first time and the tourism industry was upgraded to a national strategic pillar industry, emphasizing the role of the tourism industry and promoting the transformation of the development model of “global tourism”. Under the guidance of relevant policies, China’s new-type urbanization construction and tourism industry development have also ushered in a new growth peak, which is clear from the level of coupling coordination between new-type urbanization and TRCE in the Yellow River Basin.
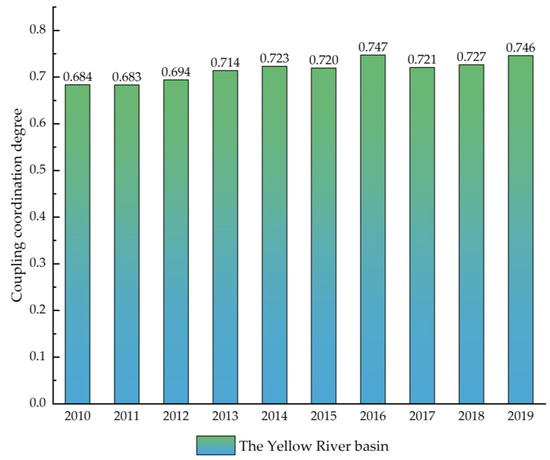
Figure 6.
Time series characteristics of CCD between new-type urbanization and TRCE in the Yellow River Basin from 2010 to 2019.
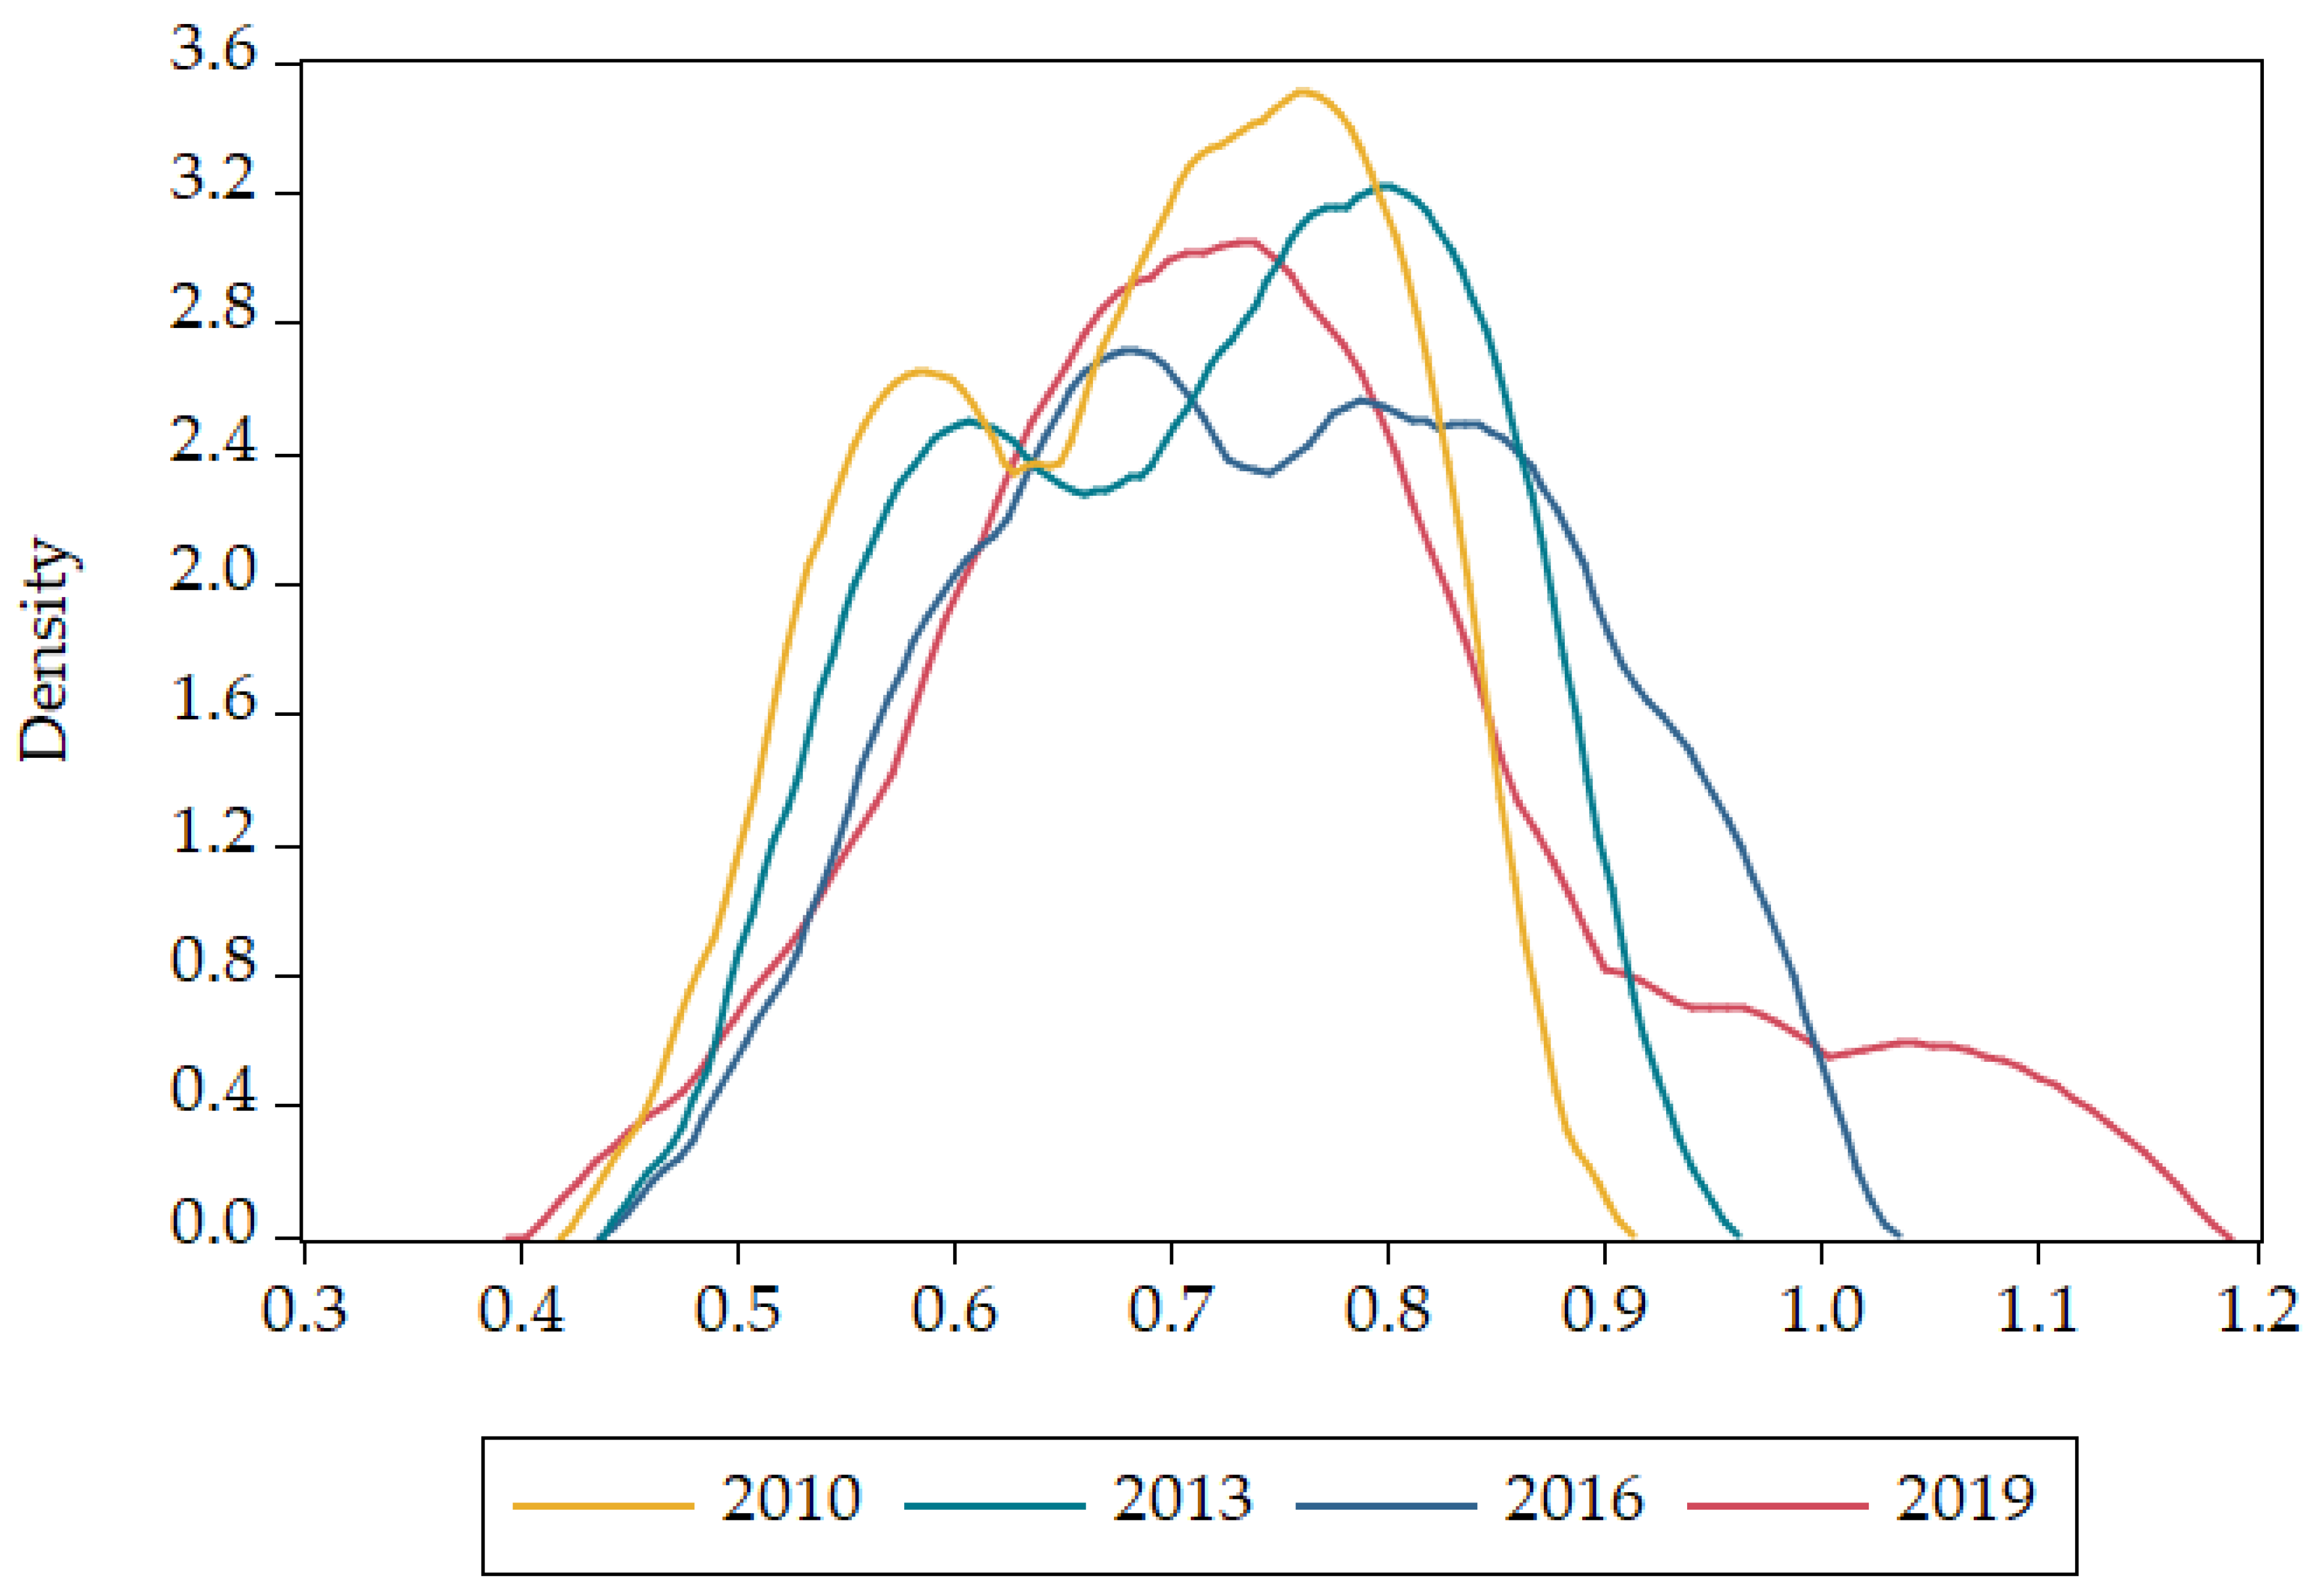
This paper uses the kernel density curve to represent the further analysis of the CCD dynamic evolution trend between new-type urbanization and TRCE in the Yellow River Basin (Figure 7). The kernel density curve from 2010 to 2019 gradually evolved from multipeak to single-peak and showed a balanced development trend, which indicates that the polarization phenomenon of CCD is weakening day by day. The kurtosis of each curve fluctuates and decreases by year, which indicates that the regional difference degree of CCD between new-type urbanization and TRCE in the Yellow River Basin is gradually decreasing. The extension length of the two tails of the kernel density curve shows an overall growth trend and the extension of the left tail is lower than that of the right tail, which indicates that the fluctuation of the CCD is weaker in the low-value area than in the high-value area. The overall level of the CCD maintains an increasing trend. This shows that the new-type urbanization construction and the development level of the tourism industry in the Yellow River Basin have been greatly improved, and the CCD of the two has been continuously optimized.
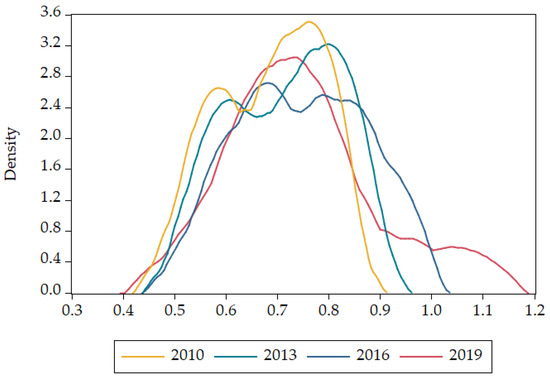
Figure 7.
Kernel density distribution of CCD between new-type urbanization and TRCE in the Yellow River Basin from 2010 to 2019.
4.2.2. Spatial Evolution Characteristics
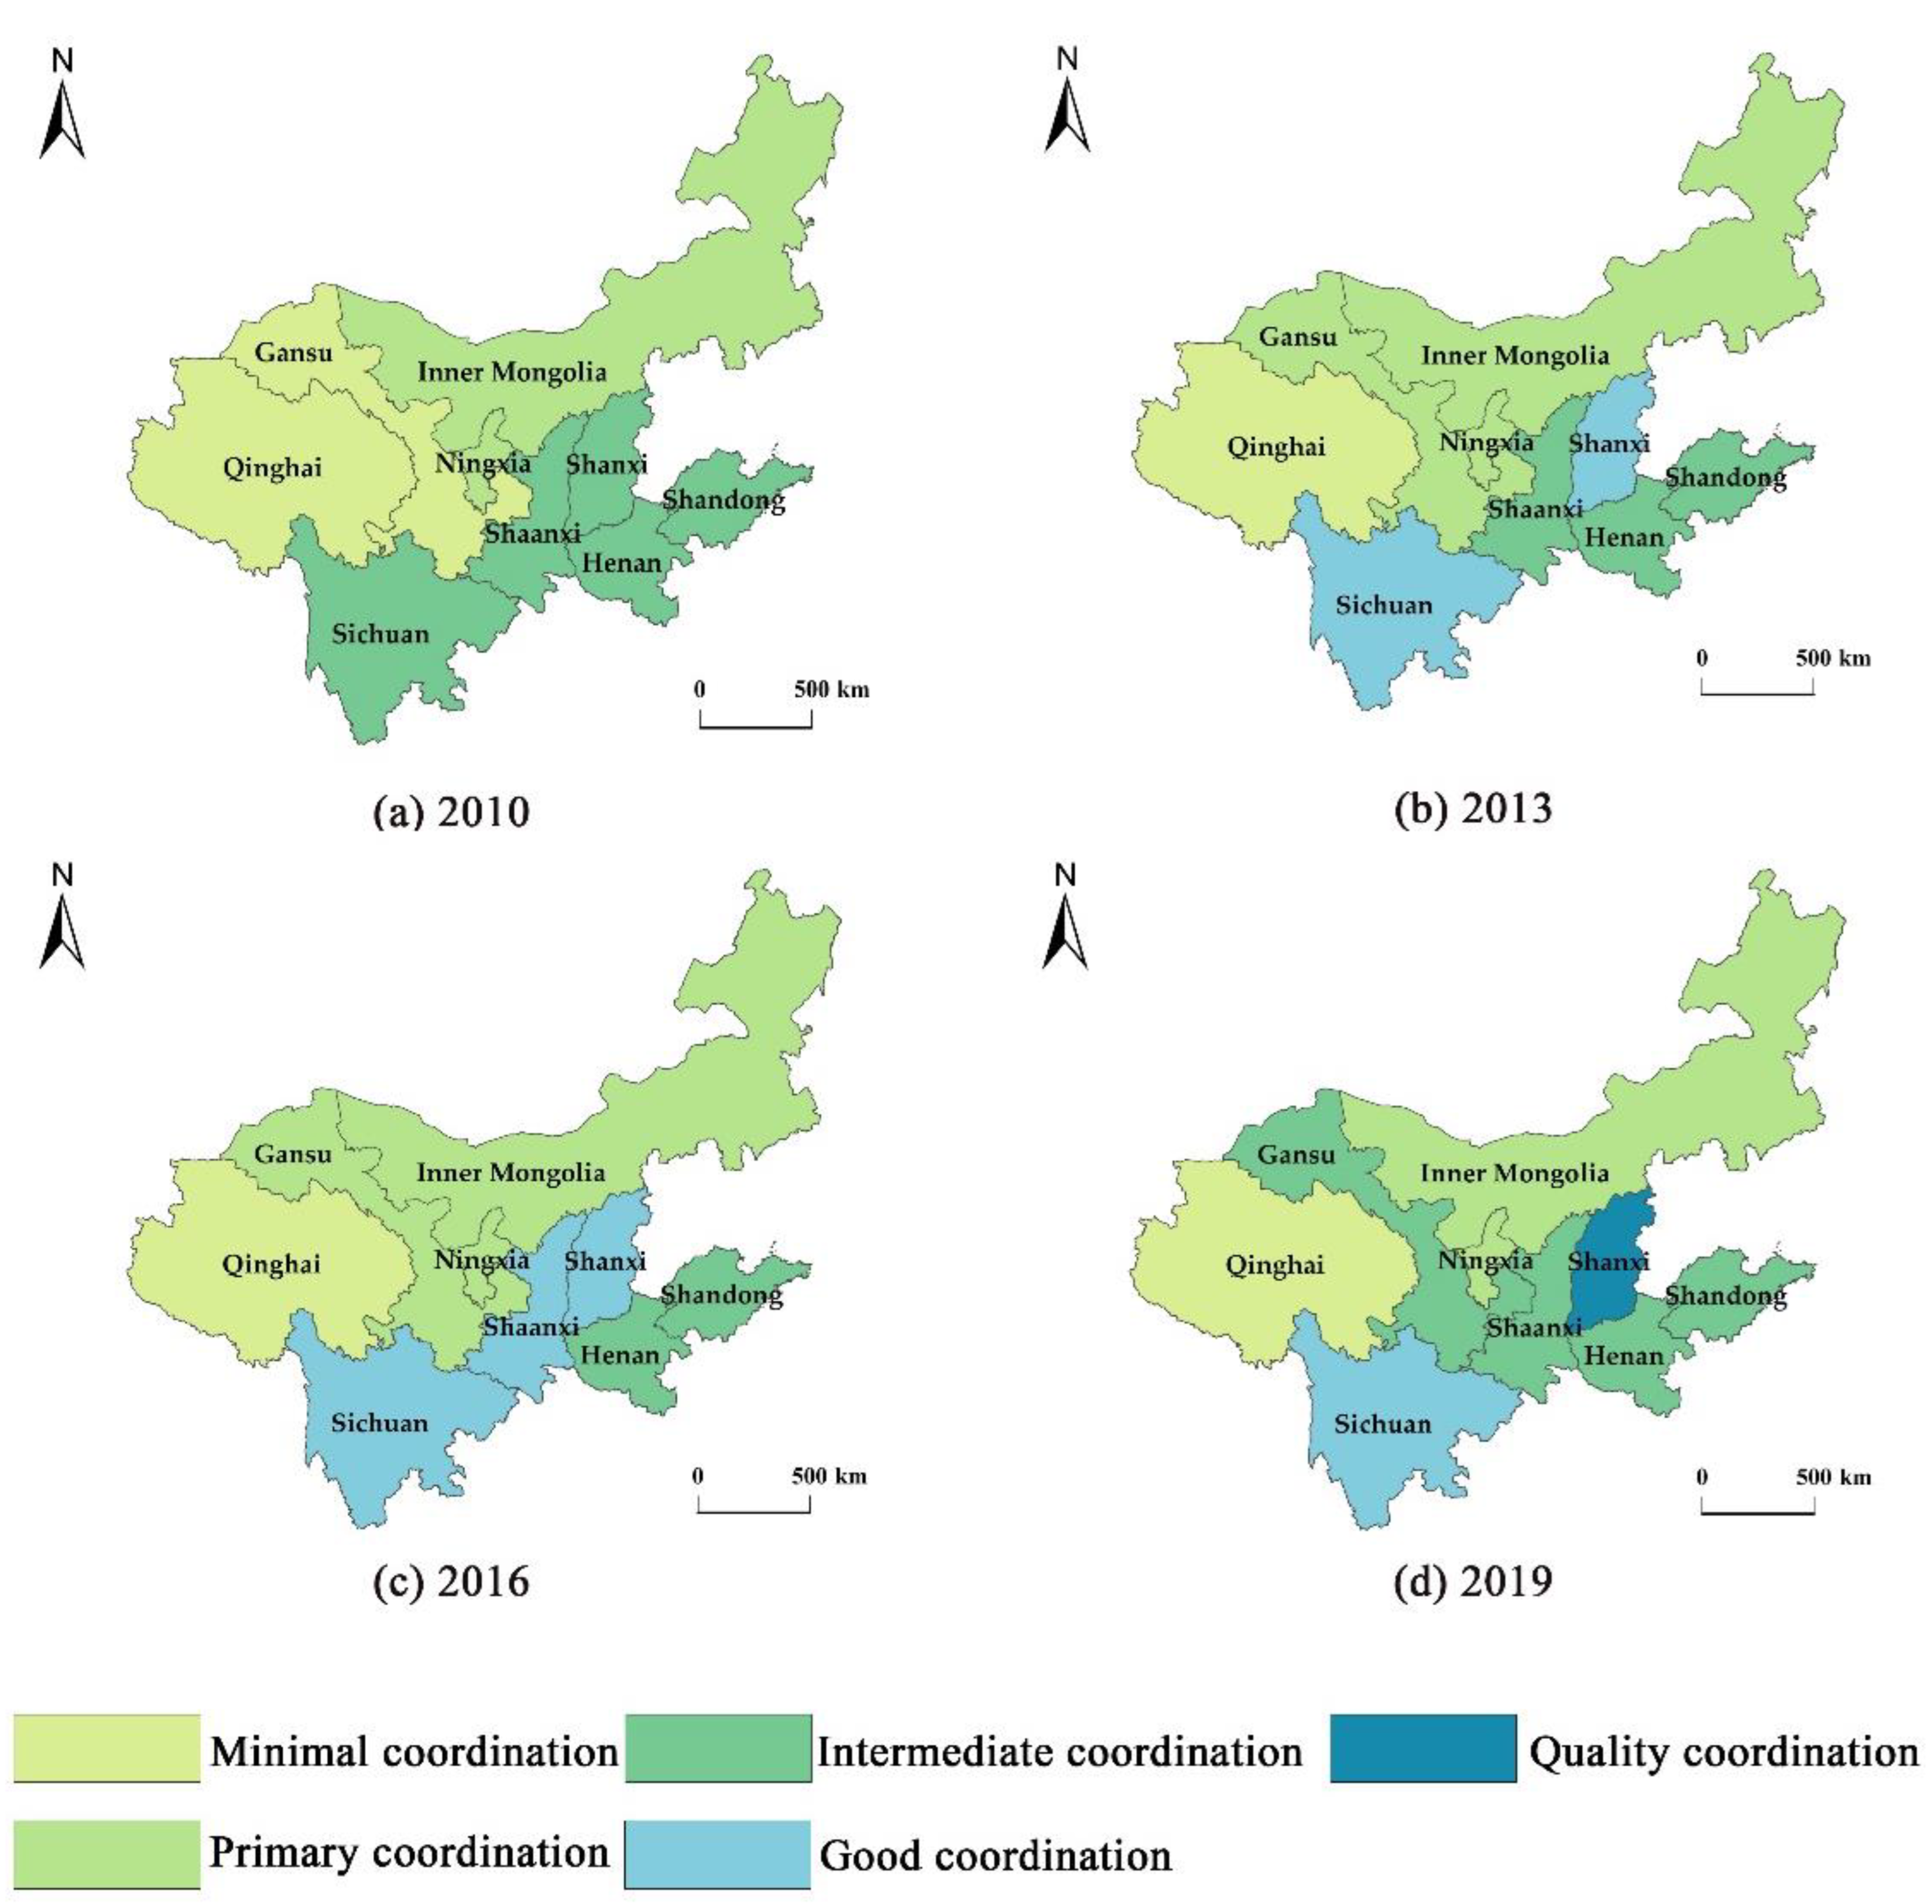
Figure 8 shows that, generally, the CCD between TRCE and the development of new-type urbanization in the Yellow River Basin from 2010 to 2019 shows a distribution pattern of “midstream region > downstream region > upstream region”. Specifically, in 2010, the number of provinces with good coordination and quality coordination in the CCD was zero and the number of intermediate coordination areas (5) was relatively large at 55.56% and mainly concentrated in the middle and downstream regions with better economies, showing a trend of agglomeration distribution. The number of primary coordination areas (2) was consistent with that of minimal coordination areas (2) at 22.22%, the areas were mainly distributed in the north and west of the Yellow River Basin, including Inner Mongolia, Ningxia, Gansu, Qinghai, and other places. In 2013, the good coordination areas (2) were scattered and embedded among other types distributed in Sichuan in the upstream region and Shanxi in the midstream region, while the intermediate coordination areas (3) were distributed in Shaanxi, Henan, and Shandong. The primary coordination areas (3) were distributed in Inner Mongolia, Gansu, and Ningxia, and the minimal coordination areas (1) were located in Qinghai. In 2016, although the number of quality coordination areas was still zero, compared with 2013 the distribution was more regular, with a gradually decreasing distribution pattern from southeast to northwest. Shaanxi became a good coordination area; the other types were consistent with 2013. In 2019, the Shanxi Province made remarkable progress, realizing a quality coordination area (1). Sichuan had a good coordination area (1) and the intermediate coordination areas (4) were widely distributed in the three major upper, middle, and lower areas, showing a centralized distribution trend. Gansu, Shaanxi, Henan, Shandong, and other places accounted for 44.44%, of which primary coordination areas (2) were distributed in Inner Mongolia and Ningxia. The number of minimal coordination areas (1) was still the same as in 2016, and the areas were in Qinghai.
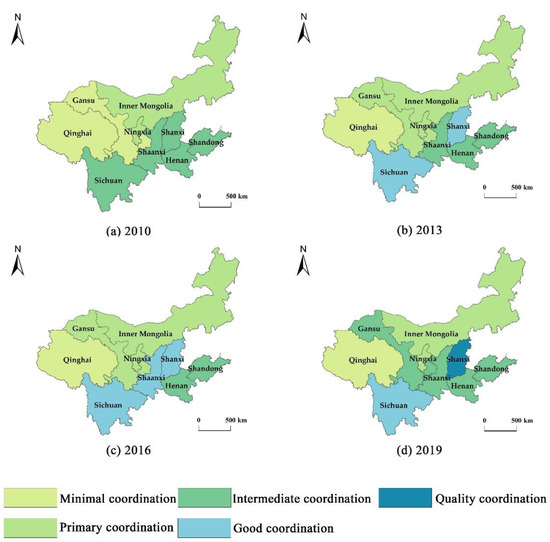
Figure 8.
Spatial distribution of CCD between new-type urbanization and TRCE in the Yellow River Basin from 2010 to 2019.
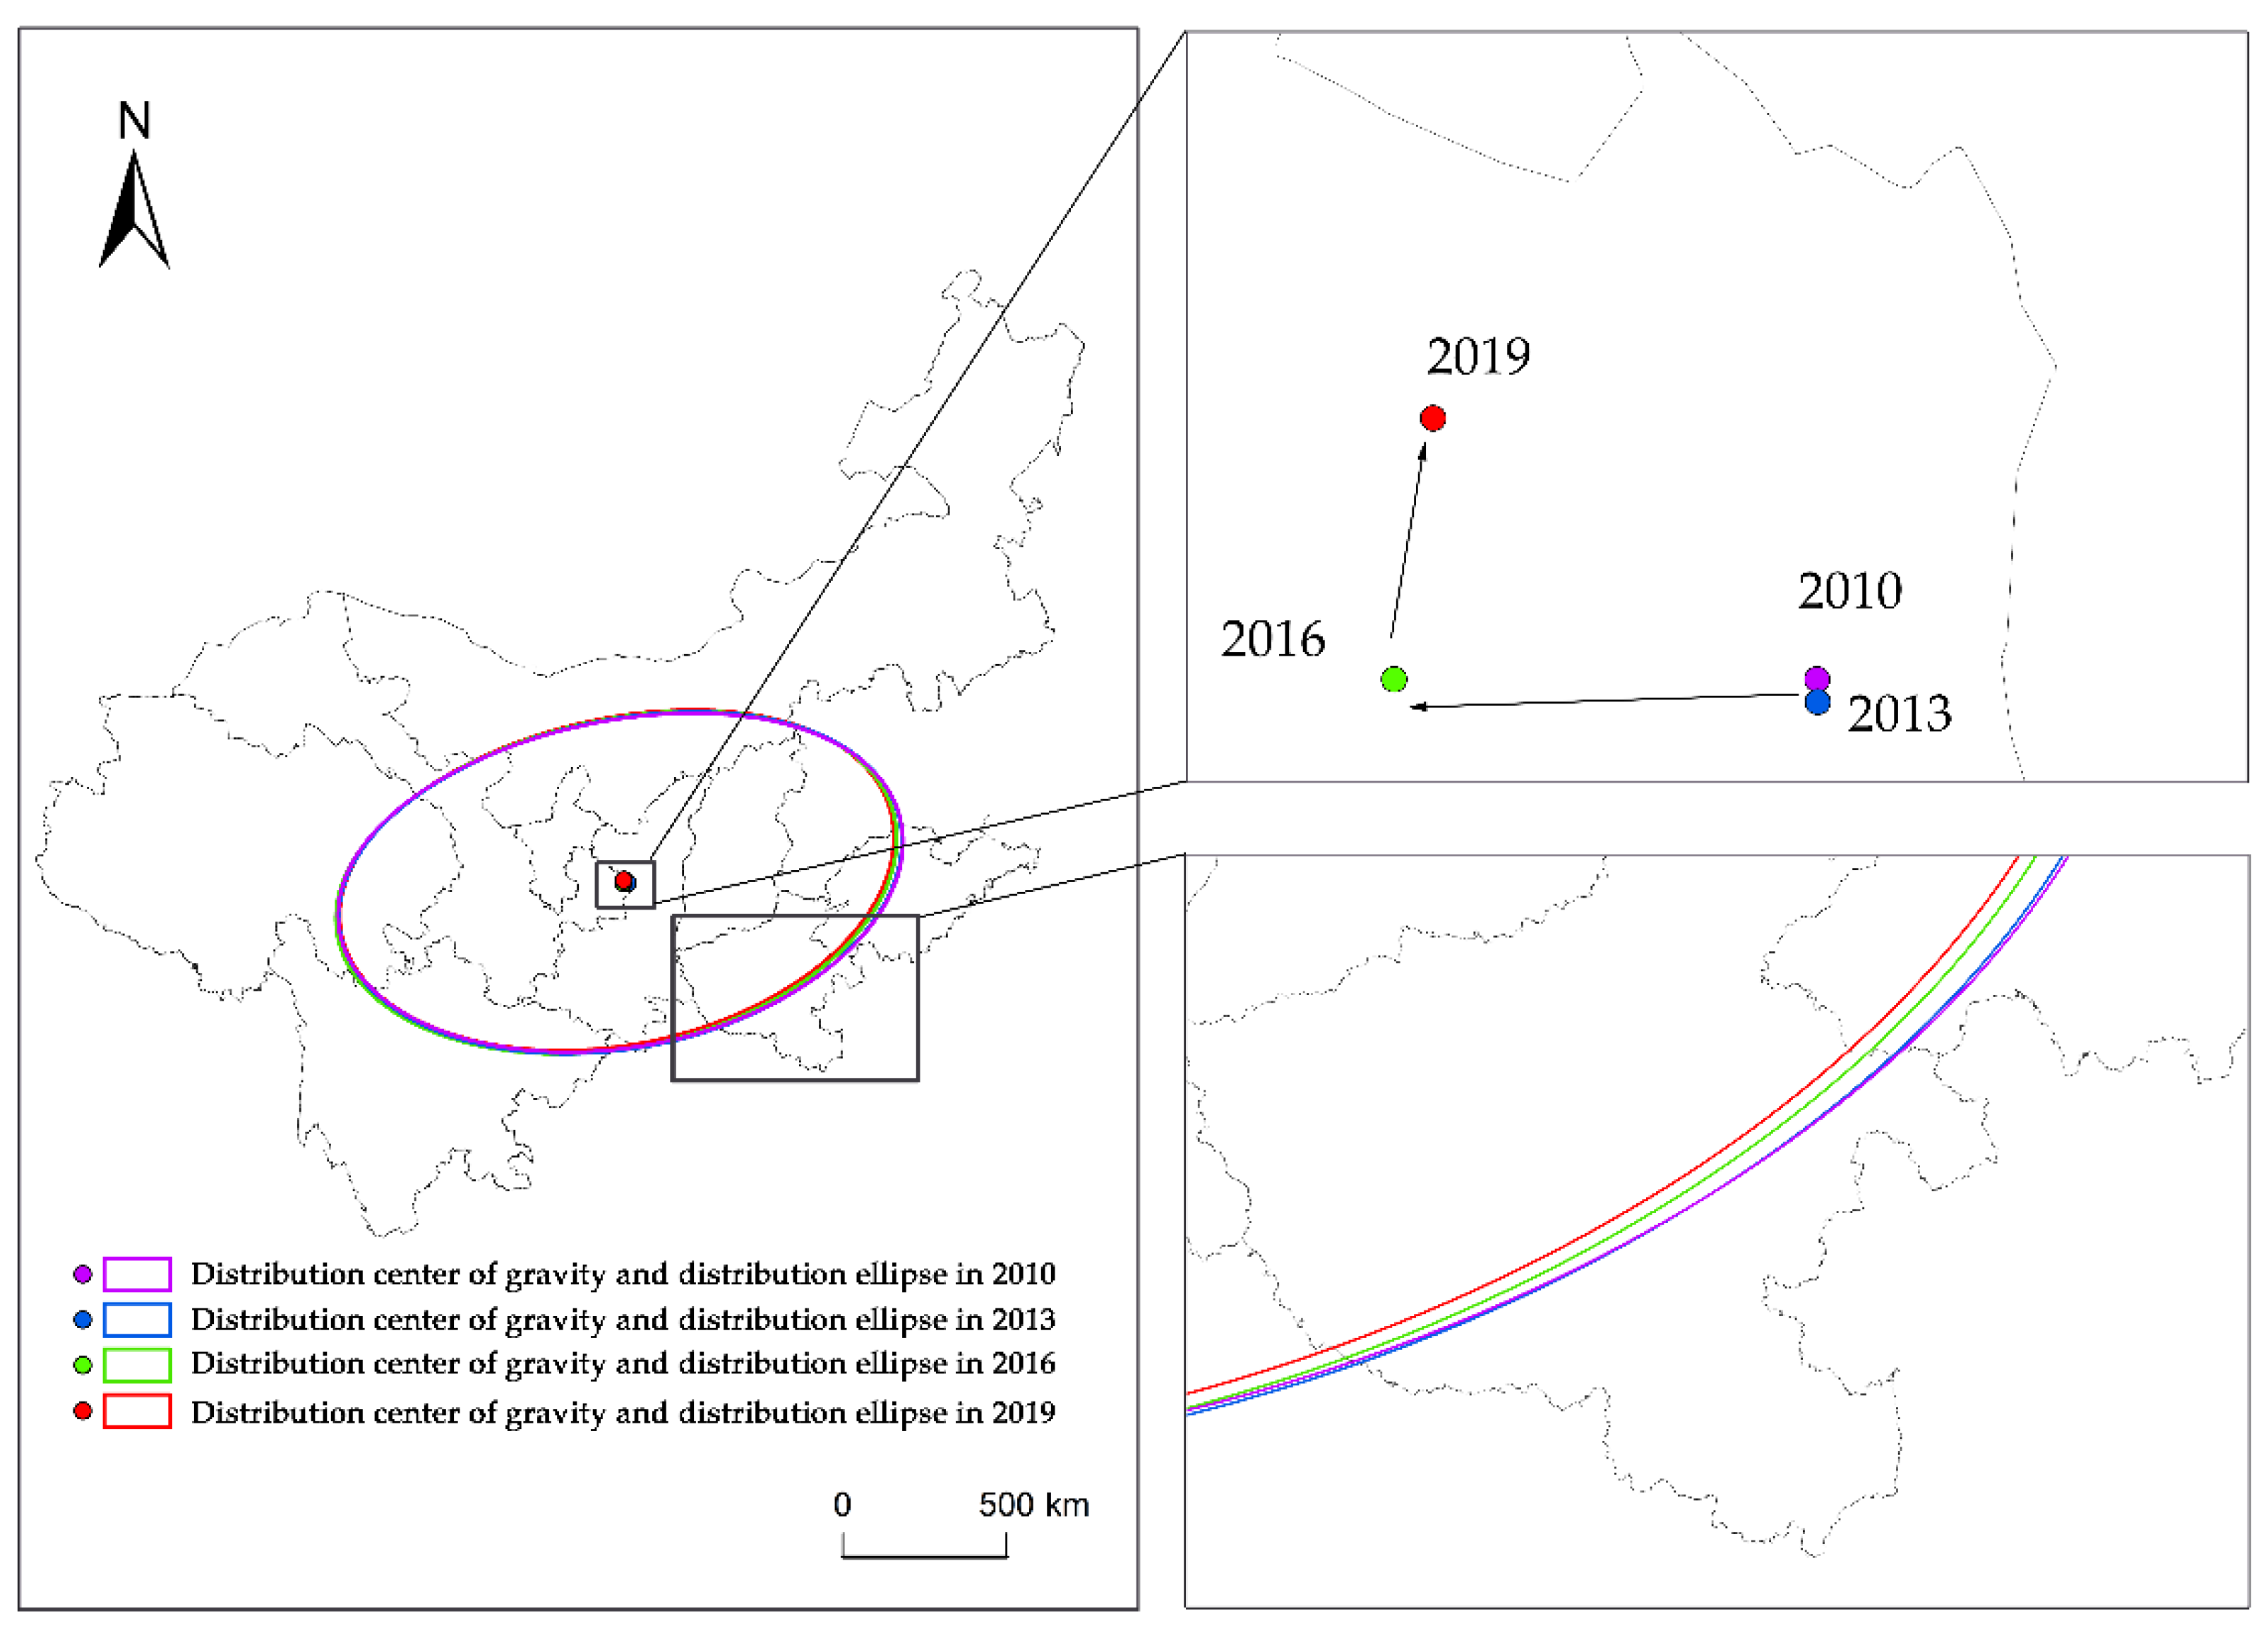
To further explore the spatial evolution trend of the CCD between new-type urbanization and TRCE in the Yellow River Basin, this paper uses the standard deviation ellipse tool in ArgGIS10.8 for measurement. The results are shown in Figure 9.
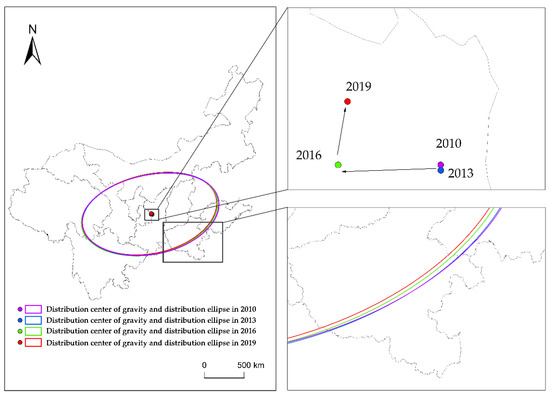
Figure 9.
Spatial evolution of CCD between new-type urbanization and TRCE in the Yellow River Basin from 2010 to 2019.
It can be seen from the above charts (Figure 9, Table 4 and Table 5) that from the distribution shape of the standard deviation ellipse, the long axis is always larger than the short axis from 2010 to 2019, showing a “northeast–southwest” distribution pattern. The shape index is expanding yearly, the ellipse shape is gradually becoming rounder, and the ellipse area and the long and short semiaxes are also decreasing, indicating that the polarization and agglomeration characteristics of the CCD between new-type urbanization and TRCE in the Yellow River Basin are becoming increasingly obvious. From the trajectory and direction of the gravity center shift, the center of gravity moved slowly to the southeast in 2010–2013 and covered only a short distance at a slow speed with an average annual moving speed of only 0.19 km/a. From 2013 to 2016, the center of gravity moved rapidly to the southwest with an average annual moving speed of 4.38 km/a, the highest in the research period. From 2016 to 2019, the speed gradually slowed with an average annual moving speed of 2.21 km/a, which is also consistent with the abovementioned views. Generally, from 2010 to 2019, the center of gravity of the CCD between new-type urbanization and TRCE in the Yellow River Basin evolved from southeast to southwest to northeast and the center of gravity gradually shifted to the west and north, indicating that with the continuous growth of the economic strength of the upstream region of the Yellow River and the rapid development of urbanization and the tourism industry, the differences between regions were shrinking and, overall, the area showed increasingly balanced development.

Table 4.
The center of gravity shift of the CCD between new-type urbanization and TRCE in the Yellow River Basin from 2010 to 2019.

Table 5.
Standard deviation ellipse of CCD between new-type urbanization and TRCE in the Yellow River Basin from 2010 to 2019.
4.3. CCD-Type Transfer Characteristics
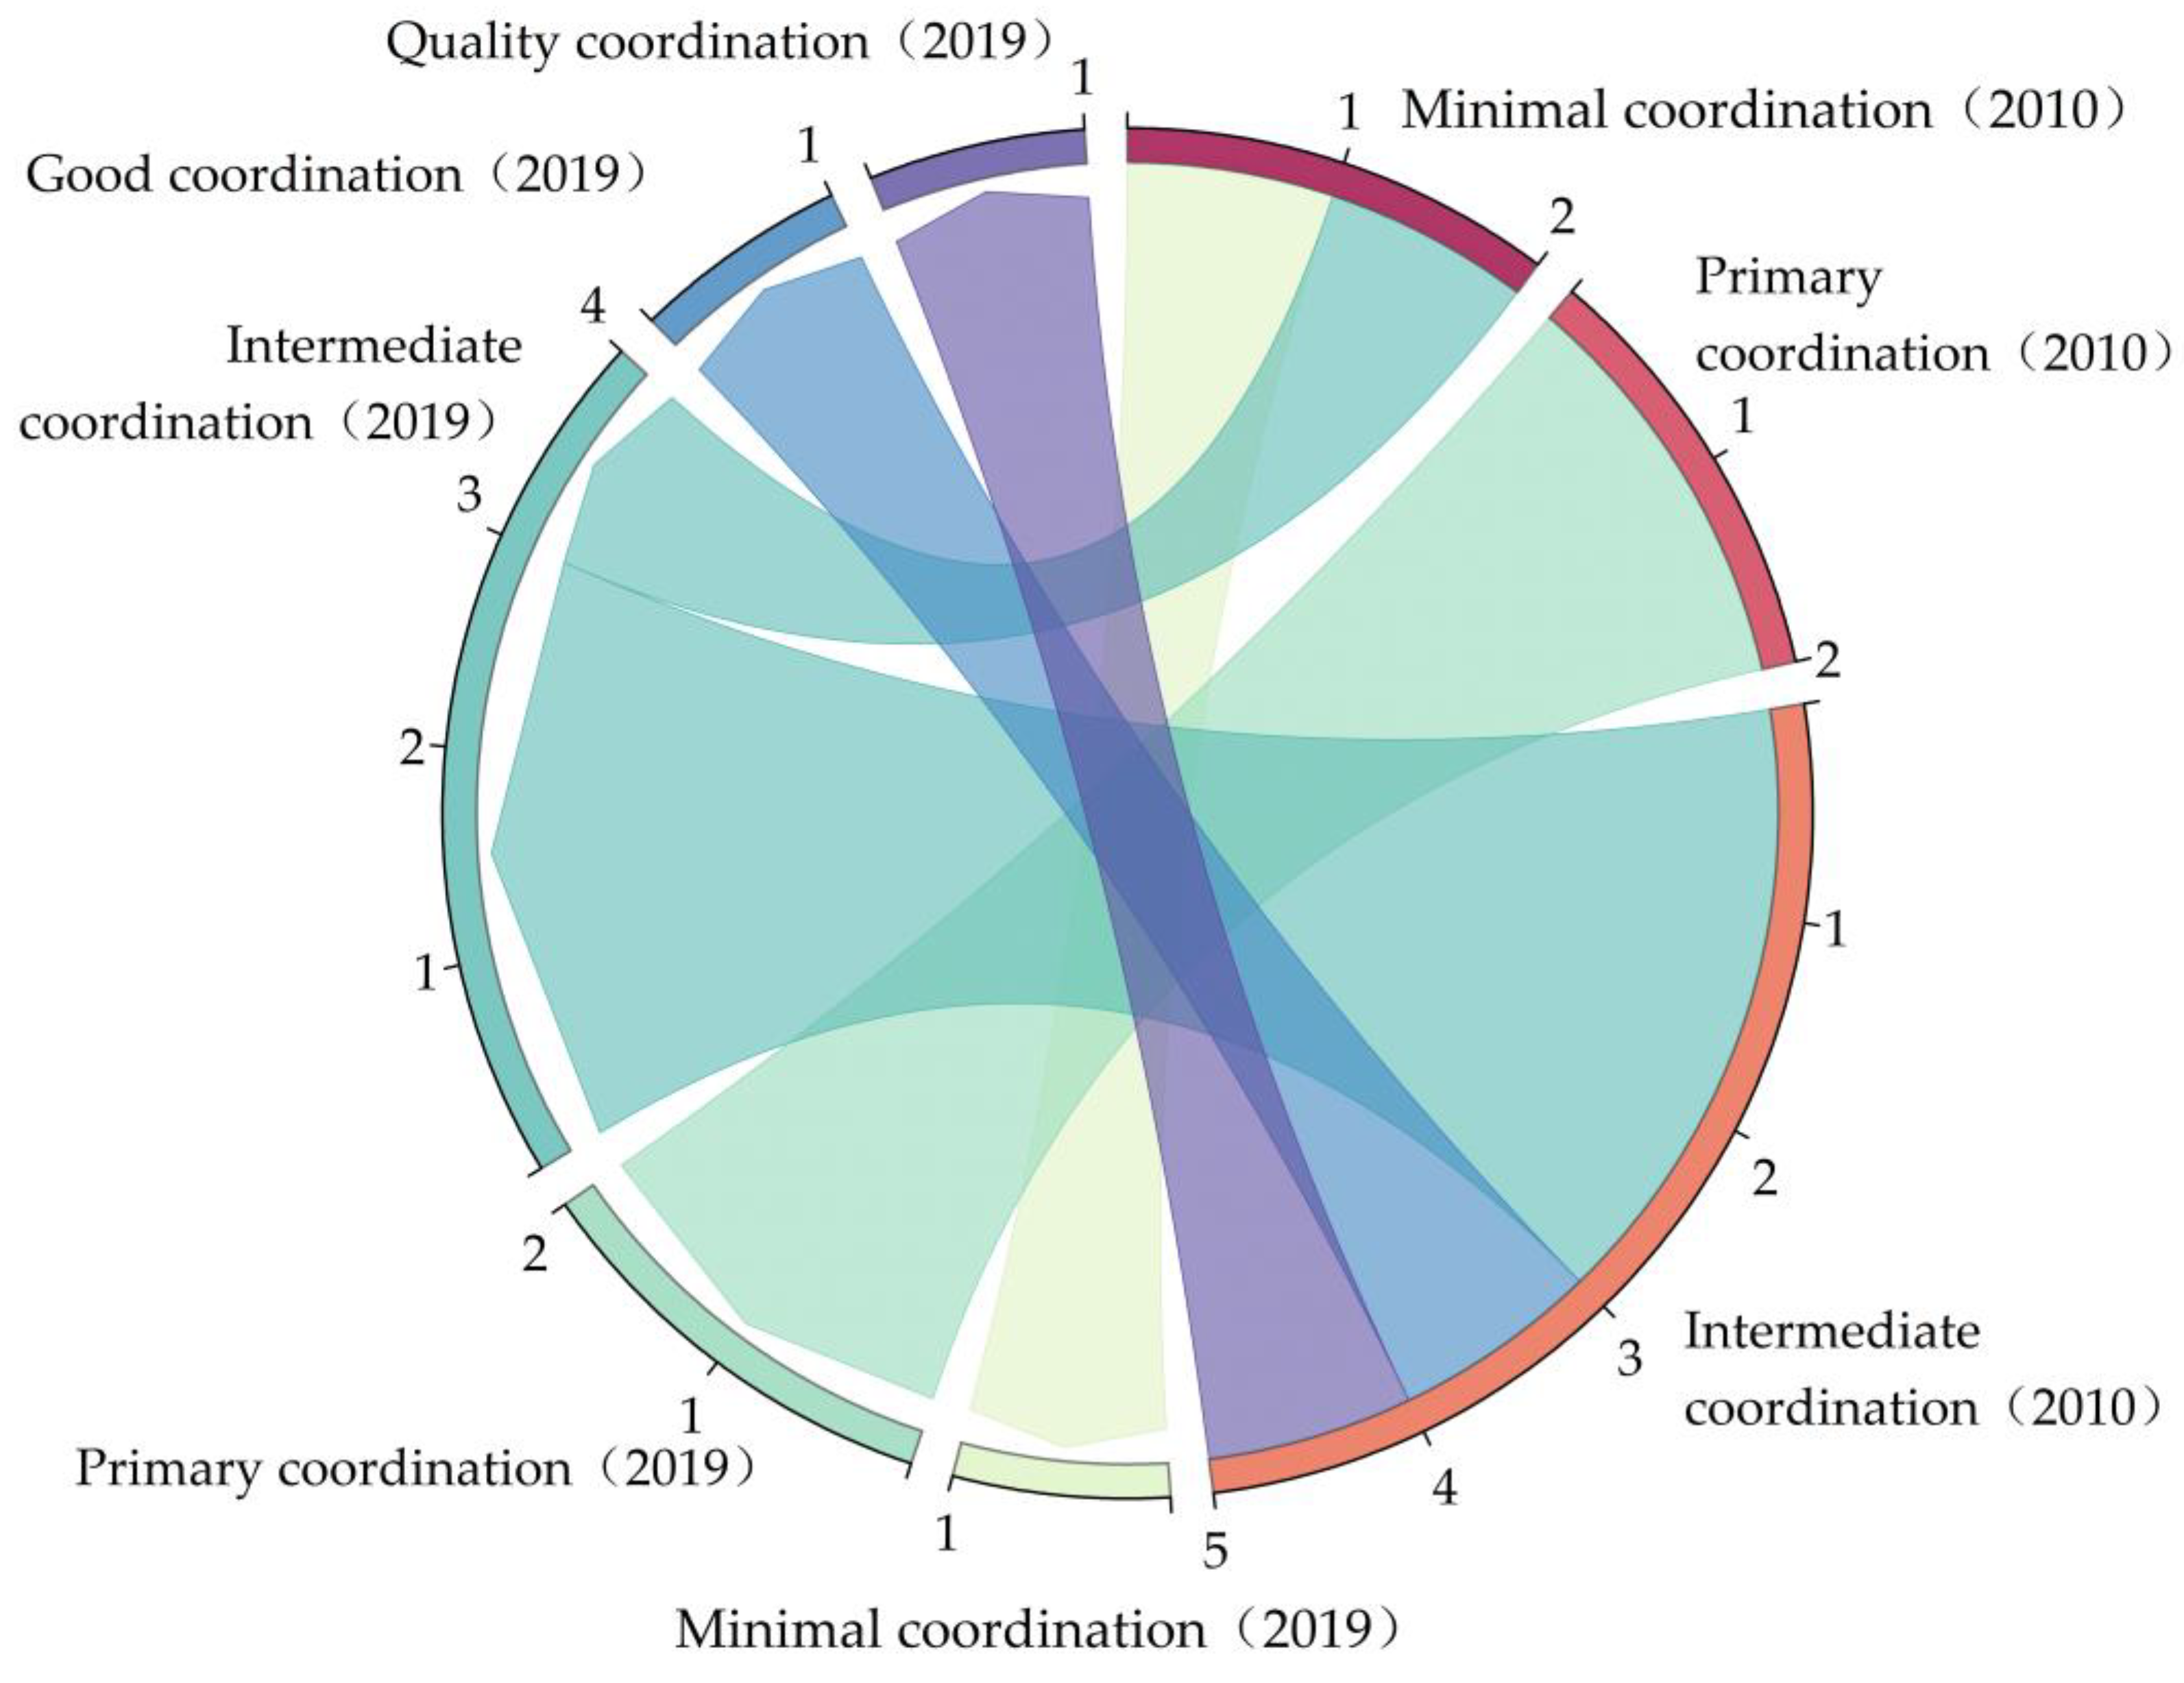
As seen from Figure 10, from 2010 to 2019, the CCD-type of new-type urbanization and TRCE in the Yellow River Basin increased rapidly into a better stage as a whole. In 2010, two places involved minimal coordination. By 2019, one place remained unchanged and the other changed to intermediate coordination. These two provinces were Qinghai and Gansu, and in 2010 they were primary coordinators. By 2019, two places remained unchanged: Inner Mongolia and Ningxia. This shows that there are still some difficulties in the development of the coupling and coordination relationship between new-type urbanization and TRCE in the middle and upstream regions of the Yellow River, and follow-up basic promotion work has a long way to go. In 2010, there were five places for intermediate coordination, which accounted for the largest proportion of coordination types. By 2019, three places were transformed into the primary type, namely, Shaanxi, Henan, and Shandong; the remaining two places, Sichuan and Shanxi, were transferred to the good coordination type and the quality coordination type, respectively. Gansu and Shanxi had the largest increase of two levels, which shows that the two provinces made significant achievements in promoting the development of new-type urbanization and improving the quality and efficiency of the tourism industry.
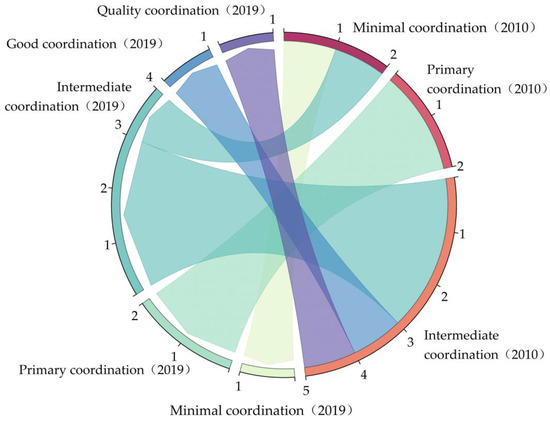
Figure 10.
Type transfer of CCD between new-type urbanization and TRCE in the Yellow River Basin from 2010 to 2019.
4.4. Trend Forecast of CCD
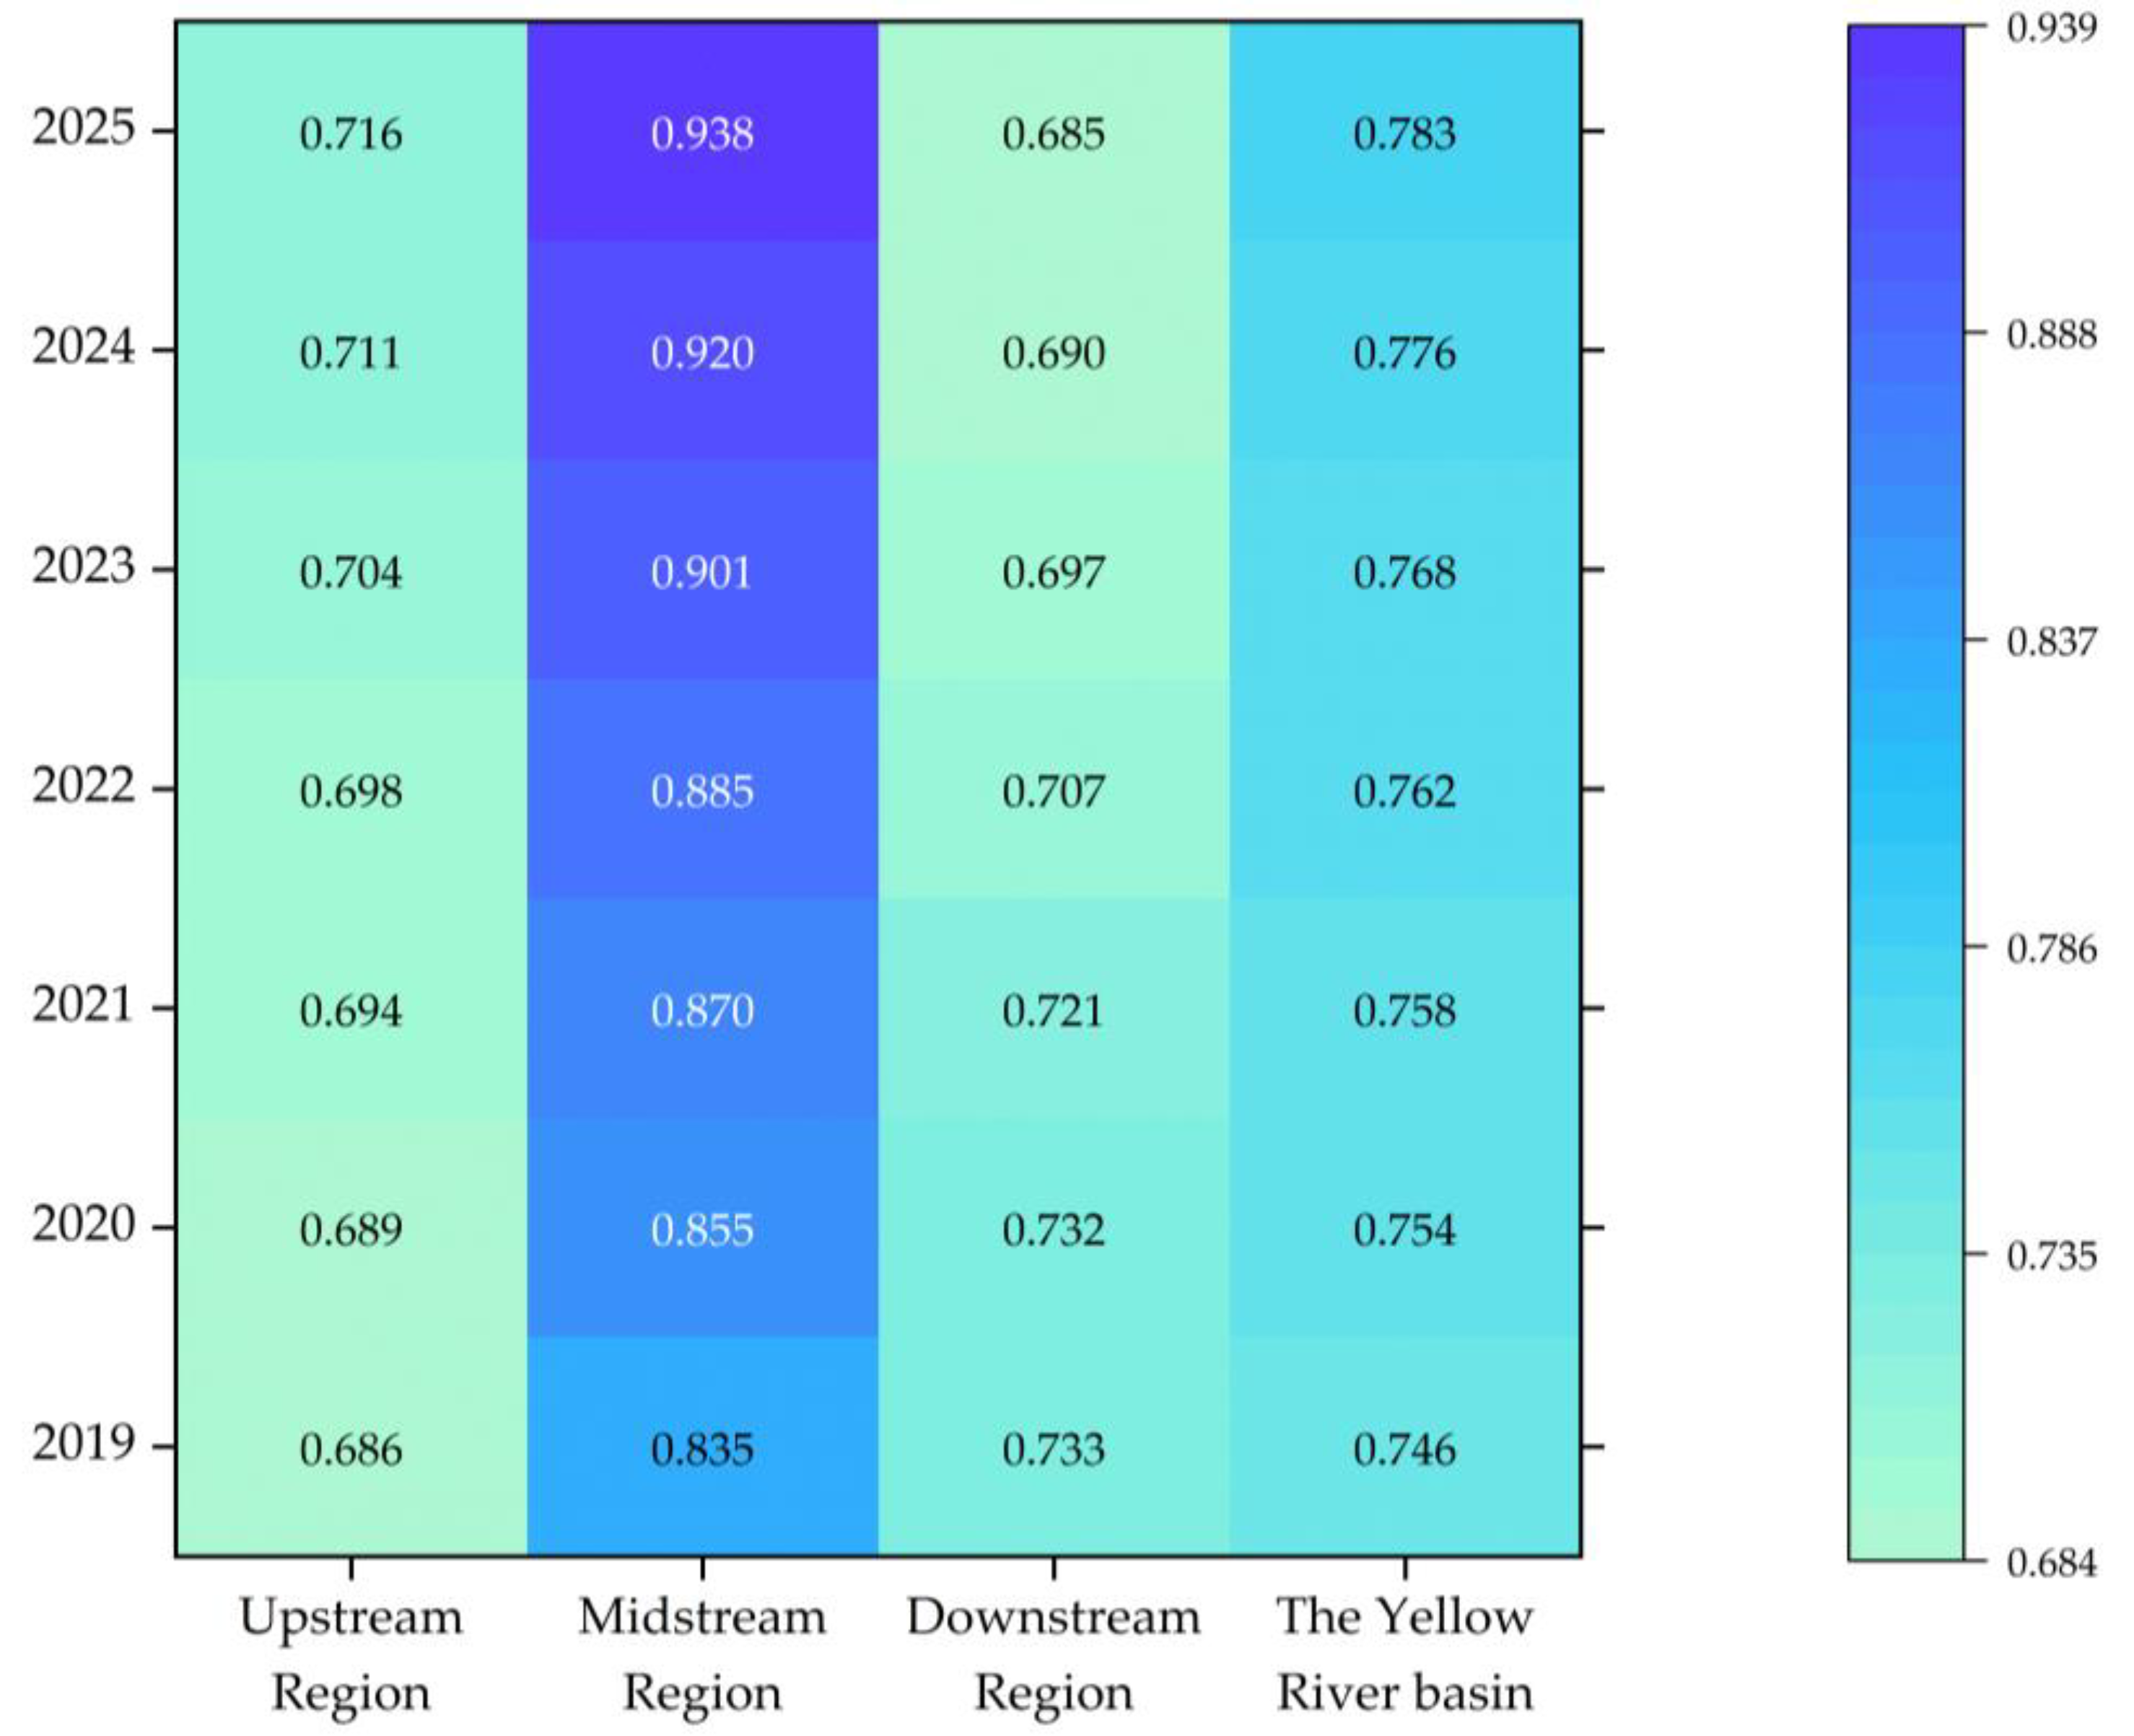
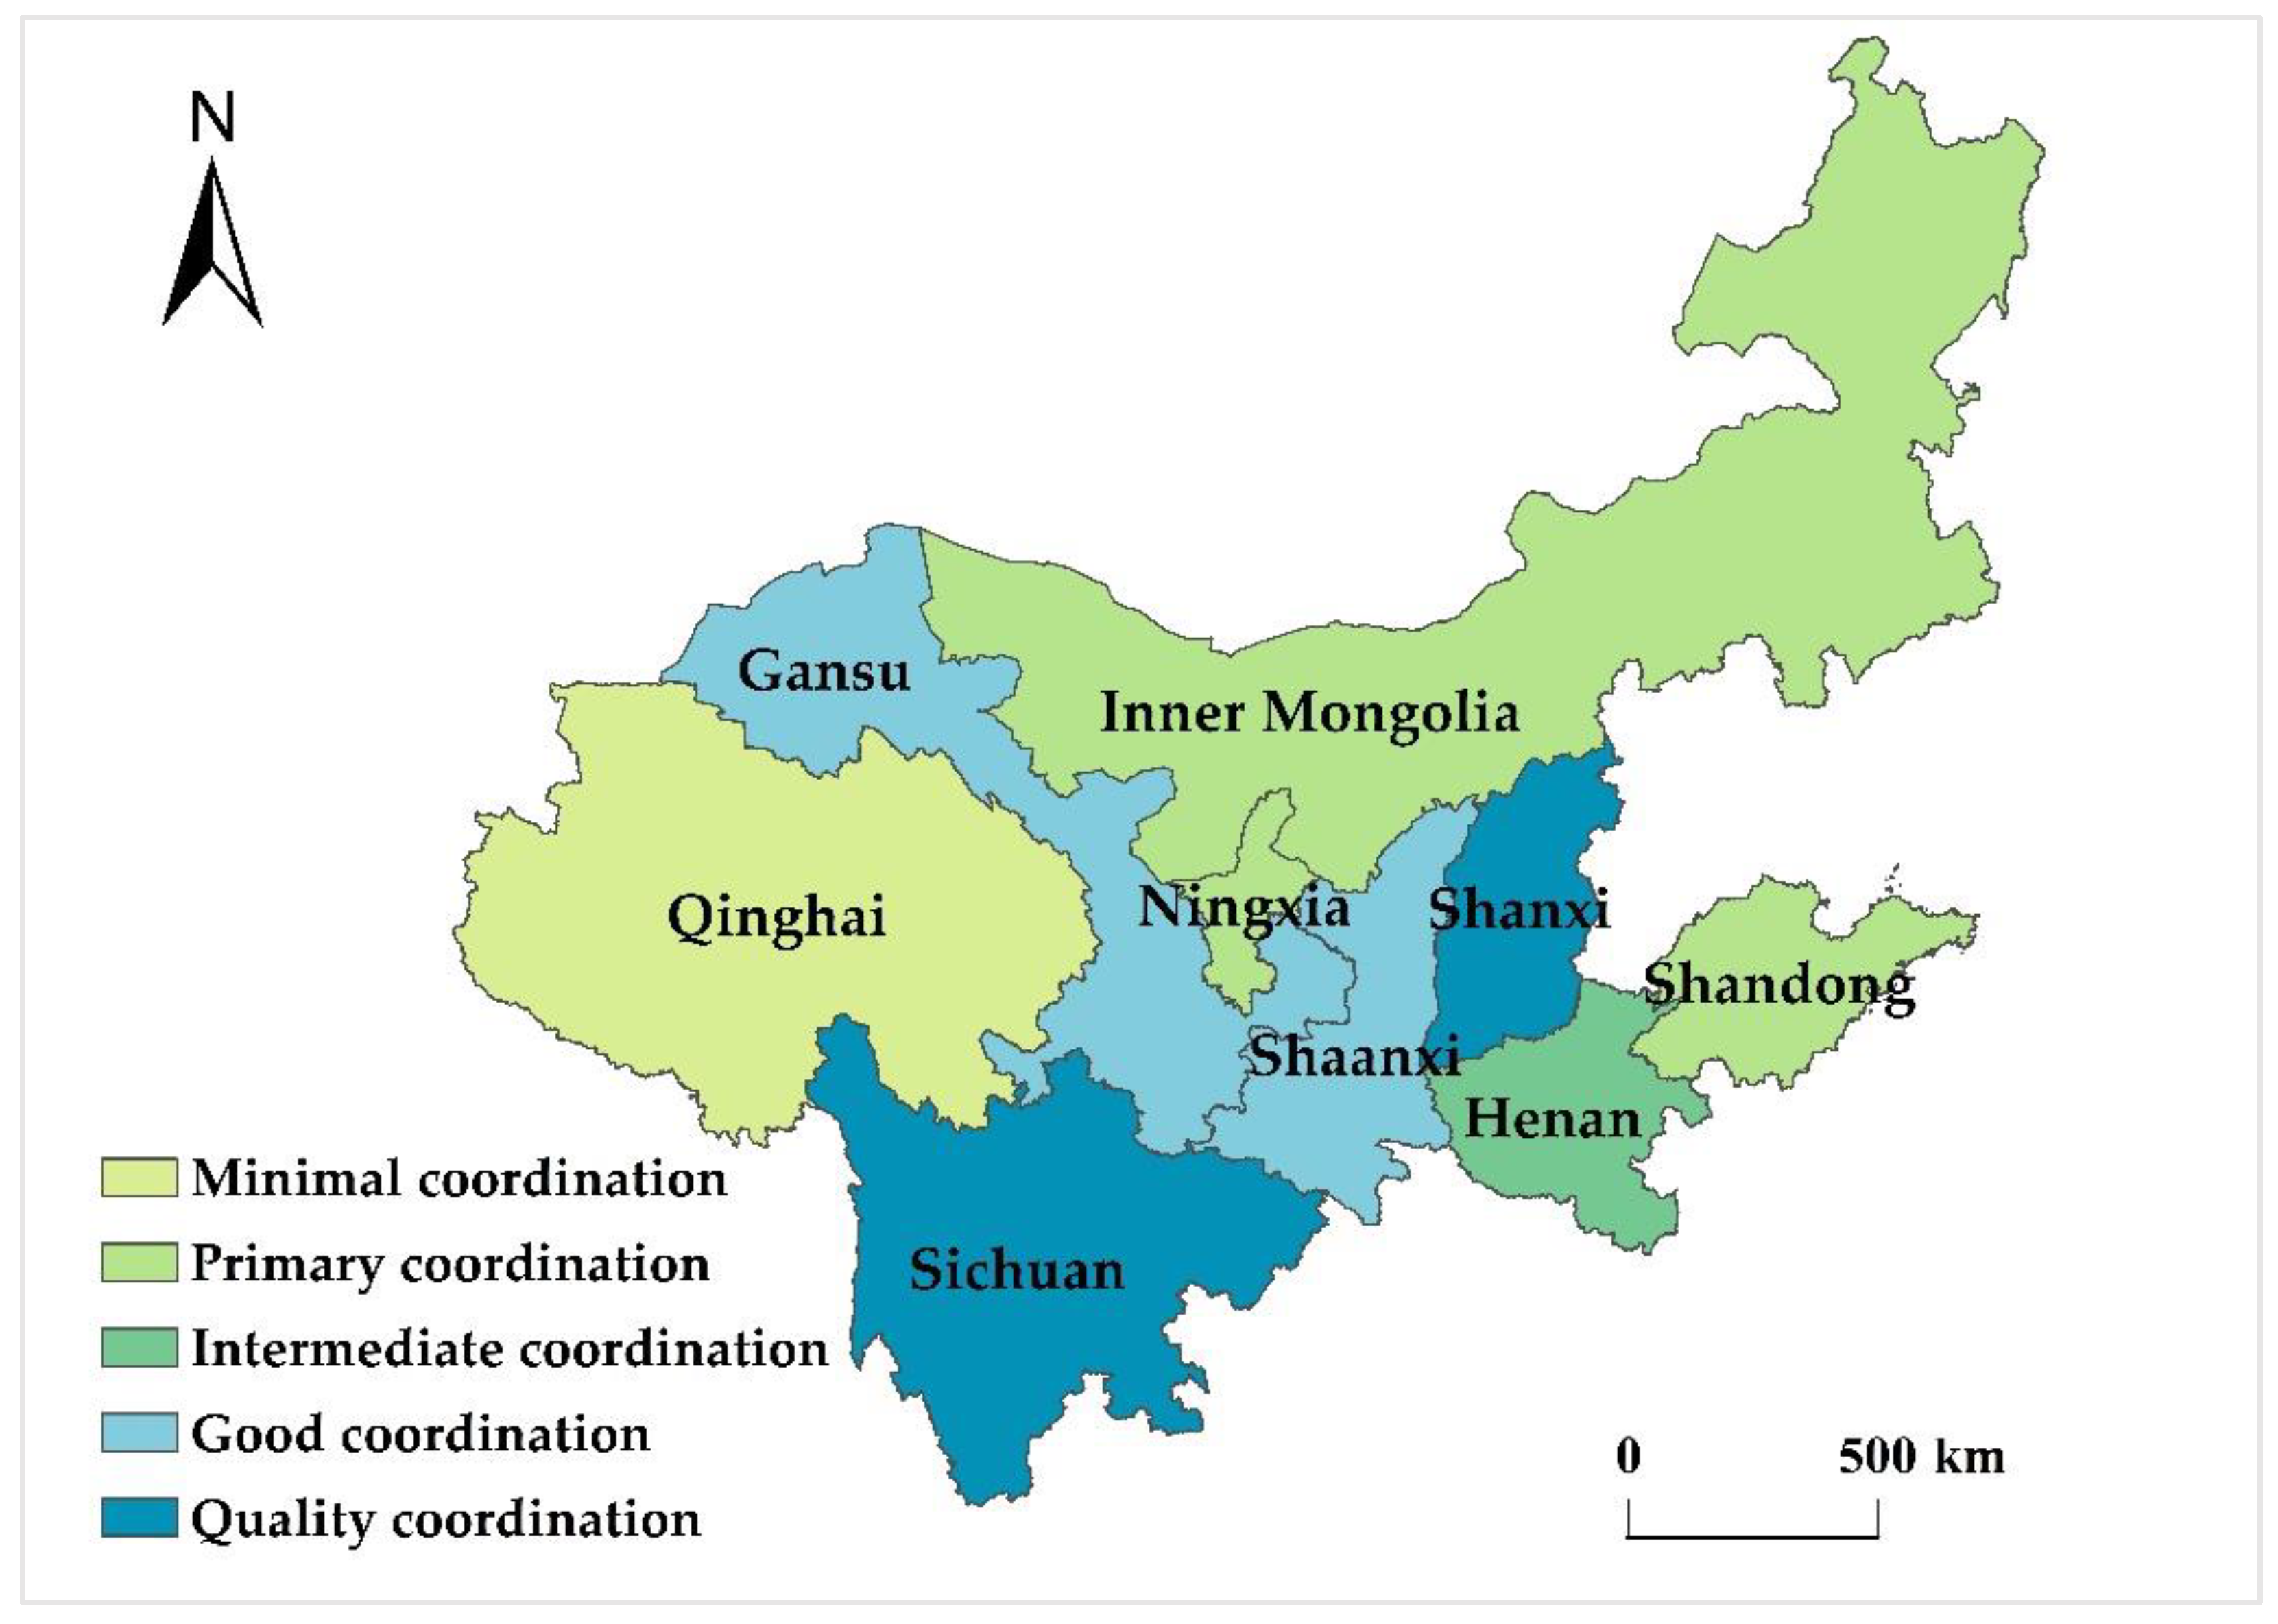
As seen from Figure 11 and Figure 12, the CCD of new-type urbanization and TRCE in the Yellow River Basin will steadily increase from 0.746 in 2019 to 0.783 in 2025 with an increase rate of 4.96%, which indicates that the coupling coordination relationship will be continuously optimized in the future with good growth momentum. Spatially, the midstream region maintains a relatively strong growth momentum, ranking first among the three regions with an increase rate of 12.34% in 2019–2025. By province, compared with 2019, Shanxi will continue to maintain a high level of coupling coordination in 2025, which is a quality coordination type. Shaanxi also jumps to a good coordination type, and Inner Mongolia maintains its primary coordination. Downstream areas show a slight downwards trend. In terms of provinces, compared with 2019, by 2025 Shandong will be transformed into primary coordination and Henan will keep the intermediate coordination unchanged. The upstream region shows a slight growth trend, with an increase ratio of 4.37% from 2019 to 2025. In terms of provinces, compared with 2019, by 2025 Gansu will turn into a well-coordinated type, while Sichuan, Qinghai, and Ningxia will maintain their primary type. Generally, by 2025, the spatial pattern of various types of CCD zoning will gradually disperse, the middle and upstream regions of the region will clearly increase, and the downstream region will gradually decline. This shows that in the future, due to policy inclinations and infrastructure improvements, the urbanization development and tourism industry in the middle and upstream regions will become increasingly closer and tourism will gradually become an important force to support regional development. For the downstream region, due to its relatively superior geographical location and economic development conditions, the dependence of urbanization on the tourism industry will gradually decrease, the related high-tech industries and real economy will gradually become important supports for urbanization development, and the closeness with the tourism industry will gradually decrease.
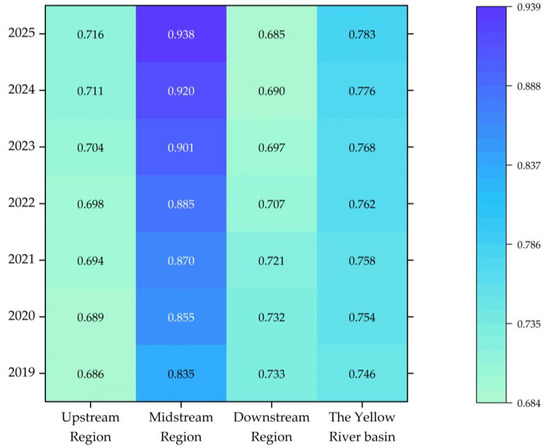
Figure 11.
CCD of new-type urbanization and TRCE in the Yellow River Basin from 2019 to 2025.
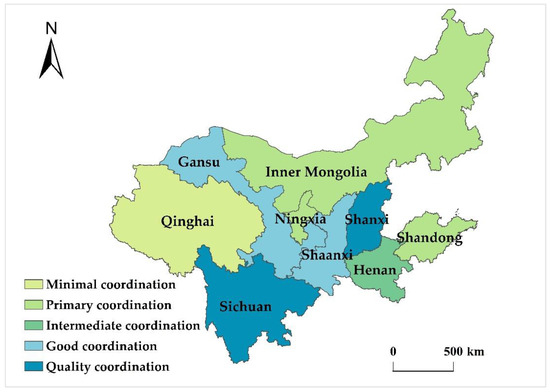
Figure 12.
Spatial distribution of CCD between new-type urbanization and TRCE in the Yellow River Basin in 2025.
4.5. Probe into Influencing Factors
To further explore the driving factors of the CCD between new-type urbanization and TRCE in the Yellow River Basin and provide guidance for decision-makers to formulate accurate policies, this paper uses STATA16.0 and Tobit regression model for regression. The regression results are shown in Table 6.

Table 6.
Tobit regression result.
4.5.1. Industrial Structure
The influence of industrial upgrading on the CCD of new-type urbanization and TRCE in the Yellow River Basin is positive with a coefficient value of 0.0492, which passes the test at the 5% significance level. This shows that the continuous optimization of the industrial structure not only brings new development opportunities and economic vitality but also further strengthens the inclusive and supportive functions of cities. At the same time, it strengthens the relationship between tourism and industry. The coupling relationship between new-type urbanization and TRCE tends to be more harmonious.
4.5.2. Post and Telecommunications and Communication Level
In this study, two dimensions of post and telecommunications business volume and telecommunications business volume are characterized. From the regression results, it can be seen that the post and telecommunications business volume failed the test, which has no significant impact on the coupling and coordination of new-type urbanization and TRCE. However, the telecom business volume passed the test at the significance of 1%, which had a positive impact on the CCD of new-type urbanization and TRCE in the Yellow River Basin with a coefficient value of 0.0948. This shows that improvement in the information level, especially telecommunication service ability, is also extremely important for promoting the integration of new city development and the tourism industry.
4.5.3. Investment Level of Cultural Media
The investment level of cultural media refers to the proportion of expenditure on cultural media to general public budget expenditure. According to the regression results, the significance of this factor at 1% passes the test, and its influence on the CCD of new-type urbanization and TRCE in the Yellow River Basin is positive with a coefficient value of 2.082. Tourism, as an important representative of the open economy, is greatly influenced by external factors. Especially in the current era of big data and mobile internet, cultural media cannot be ignored for industrial and urban development. Therefore, increasing cultural media investment is key for improving the efficiency of tourism resource conversion and the integration of new-type urbanization and tourism.
4.5.4. Education and Science and Technology Factors
From the above regression results, it can be seen that the proportion of education investment failed the test and thus has no significant impact on the coupling and coordination of new-type urbanization and TRCE. However, the proportion of investment in science and technology passed the test at the significance level of 10% and a coefficient value was 0.827, which had a negative impact on the coordination degree. An increase in science and technology investment can have an impact on the integration of new-type city development and the tourism industry to a certain extent, but its impact is negative. The direction of science and technology investment of local governments deviates from coordinated development, thereby increasing the separation between the two. Therefore, increasing the investment in science and technology and changing the investment direction in a timely manner are key to promoting integration and development between the two systems.
5. Discussion
As mentioned in the introduction, this paper aimed to reveal the coupling and coordination relationship between new-type urbanization and the TRCE in the Yellow River Basin. In contrast to existing research, this paper does not use the conventional comprehensive index method to construct the evaluation index system of the tourism industry; instead, it uses the data envelopment analysis dominated by input and output for evaluations that highlight the economic and social effects brought by the tourism industry, which can better match the construction of new-type urbanization.
- (1)
- From the perspective of the development level of each subsystem, the development index of new-type urbanization in the Yellow River Basin shows a steady upwards trend, with the middle and upstream regions growing rapidly. The efficiency of tourism resource conversion is generally stable, with a clear catch-up trend in the middle and upstream regions of the river and a slightly declining trend in the downstream region.
- (2)
- From the overall consideration of the two systems, the CCD of new-type urbanization and TRCE in the Yellow River Basin fluctuated and rose; it leaped significantly in 2016 and then dropped slightly, but it still maintained high growth momentum with a CCD between 0.6 and 0.8, which is an intermediate coordination stage. In terms of spatial distribution, the CCD of new-type urbanization and TRCE in the Yellow River Basin is generally in the distribution pattern of “midstream region > downstream region > upstream region”, and its center of gravity is evolving from southeast to southwest to northeast with a significant deviation trend to the northwest. For overall growth, the CCD type of new-type urbanization and TRCE in the Yellow River Basin increased to a better stage, especially in the midstream region. For future trends, the CCD of new-type urbanization and TRCE in the Yellow River Basin displays continuous growth, and the coupling coordination relationship is constantly optimized. By 2025, the CCD index will reach 0.783 with an increase ratio of 3.85% compared with 2019 and strong growth momentum and the midstream region will continue to maintain a high growth level.
- (3)
- From the perspective of influencing factors, cultural media investment, communication level, and advanced industrial structure have significant positive impacts on the CCD of new-type urbanization and TRCE in the Yellow River Basin. The investment in science and technology is negative and the proportion of investment in post and telecommunications business and education is not significant.
Urbanization and the tourism industry have been hot topics in current urban studies. The development strategy of integrating urbanization and the tourism industry has been recognized and adopted by most countries and regions in the world, and it is used as a crucial approach to stimulate regional economic development. Nonetheless, it is not uncommon for local governments to adopt a one-size-fits-all approach regardless of the real local situation. As a result, governments not only fail to effectively improve the local economy but also cause varying degrees of negative impact and even damage to local industry and the ecological environment [52,53]. Therefore, the effectiveness of policy depends not only on resource input but also on whether it adapts to the actual situation and local conditions. The above analysis suggests that the CCD of new-type urbanization and TRCE in the Yellow River Basin are generally improving and will maintain an uptrend in the future. However, from a microscopic point of view, there have been great differences among regions in the Yellow River Basin. The midstream region shows a high degree of integration between new-type urbanization and TRCE with the fastest growth rate, while the downstream region tends to grow gradually and the upstream region grows relatively slowly, showing obvious spatial heterogeneity. If a universal promotion strategy is adopted, it is bound to have a negative impact on several regions. Therefore, it is necessary to fully understand the different development situations of different regions to implement a proper strategy, which is also the purpose and significance of this study. This paper comprehensively uses a variety of methods to fully demonstrate the temporal and spatial patterns and evolution of new-type urbanization and TRCE in regions in the Yellow River Basin, providing a reference for the precise formulation and implementation of related policies.
Specifically, for regions in the upstream region with poor coupling coordination, priority should be given to their local ecological vulnerability, and new tourism resources and products should be considered carefully under the premise of suitable development to improve urban infrastructure and services. If the comprehensive driving effect of the tourism industry is barely satisfactory, the strategy should be resolutely abandoned. For regions in the midstream region, the two-way advantages of new urbanization and the tourism industry should continue to be utilized, and the investment in capital, technology, and personnel should be increased to promote integration to a higher level. For downstream regions with relatively better economic development, the structure and focus of industrial development should be considered as a whole to determine whether tourism should be developed as a leading industry. For regions with fewer tourism resources and a higher level of urbanization, the development focus should be shifted to other industries.
In addition, it is crucial to adopt measures to promote the integration of new urbanization and the tourism industry. First, it is necessary to strengthen the basic role of new urbanization, which means accelerating the construction of urban transportation, accommodation and catering, leisure and entertainment, medical and health facilities, improving the tourism service system, reception quality and tourist satisfaction, promoting the transformation and upgrading of the tourism industry, and building a more solid development platform to promote the development of the tourism industry. Second, it is necessary to consider the comprehensive driving advantages of tourism, which means promoting the integration and connection between tourism and catering, accommodation, leisure, entertainment and other related industries, enhancing economic vitality, and improving population concentration as well as the contribution rate of the tourism economy to promote the upgrading of the urban industrial structure to accelerate the pace of urbanization. According to the above regression analysis, it can be deduced that the optimization of industrial structure, the improvement of media and technology investment, and the enhancement of telecommunication services can exert a positive impact on promoting the integration of urbanization and the tourism industry. Therefore, relevant policies should be adjusted to prioritise to supporting these four aspects.
6. Conclusions
In this paper, nine provinces in the Yellow River Basin are taken as research areas with the research period ranging from 2010 to 2019. The entropy TOPSIS method and Super-SBM model are used to measure the development level of new-type urbanization and TRCE in the Yellow River Basin, respectively. On this basis, the spatial–temporal characteristics and future trends of the CCD of new-type urbanization and TRCE in the Yellow River Basin are explored using the coupling coordination degree model, grey prediction model, kernel density estimation, and standard deviation ellipse. The study further verifies the importance of the coupling development of new-type urbanization and the tourism industry, reveals the spatiotemporal coupling law and influencing factors of the efficiency of new-type urbanization and tourism resource conversion in the Yellow River Basin, and provides data support and a theoretical reference for future urban planning and policy implementation of the Yellow River Basin. At the same time, this study provides an application model for the integrated development of urbanization and the tourism industry in other regions. To avoid policy failure, it is crucial to explore the characteristics of spatiotemporal evolution before the implementation of the policy. The Yellow River Basin is vast and the development of the tourism industry and urban construction varies from place to place. However, a relatively macro region is selected in this paper, and the construction of the coupling coordination system of new-type urbanization and TRCE in the Yellow River Basin is relatively general, which makes it difficult to accurately reflect the coupling coordination laws of various places and produces certain limitations. Further improvement is needed in future research. With regard to the construction of the urbanization development index, on the basis of available data, this study selects the green coverage rate of built-up areas, the per capita park green space area and the harmless treatment rate of domestic garbage as ecological variables. However, compared with fossil fuel combustion and traffic congestion, the three indicators are less stable and tend to show positive trends over time, which affects the accuracy of the final results. Therefore, it is necessary to increase the stability of ecological indicators in future studies.
Author Contributions
Project administration, C.C.; writing—original draft preparation, M.H.; writing—review and editing, C.C. and L.L.; visualization, M.H. and G.L. All authors have read and agreed to the published version of the manuscript.
Funding
This research received no external funding.
Data Availability Statement
Not applicable.
Conflicts of Interest
The authors declare no conflict of interest.
References
- Wang, X.-R.; Hui, E.C.-M.; Choguill, C.; Jia, S.-H. The new urbanization policy in China: Which way forward? Habitat Int. 2015, 47, 279–284. [Google Scholar] [CrossRef]
- Gan, L.; Wei, L.; Huang, S.; Lev, B.; Jiang, W. Evaluation of City–Industry Integration Development and Regional Differences under the New Urbanization: A Case Study of Sichuan. Appl. Sci. 2022, 12, 4698. [Google Scholar] [CrossRef]
- Xu, H.; Jiao, M. City size, industrial structure and urbanization quality—A case study of the Yangtze River Delta urban agglomeration in China. Land Use Policy 2021, 111, 105735. [Google Scholar] [CrossRef]
- Tang, H.; Liu, Y.; Ma, X. Effect Evaluation of Coordinated Development between Tourism Industry and New Urbanization—A Case Study of Zhangjiajie. Econ. Geogr. 2017, 37, 216–223. (In Chinese) [Google Scholar] [CrossRef]
- Mullins, P. Tourism urbanization. Int. J. Urban Reg. Res. 1991, 15, 326–342. [Google Scholar] [CrossRef]
- Gladstone, D.L. Tourism urbanization in the United States. Urban Aff. Rev. 1998, 34, 3–27. [Google Scholar] [CrossRef]
- Edwards, D.; Griffin, T.; Hayllar, B. Urban tourism research: Developing an agenda. Ann. Tour. Res. 2008, 35, 1032–1052. [Google Scholar] [CrossRef]
- Chang, T.C.; Milne, S.; Fallon, D.; Pohlmann, C. Urban heritage tourism: The global-local nexus. Ann. Tour. Res. 1996, 23, 284–305. [Google Scholar] [CrossRef]
- Qian, J.; Feng, D.; Zhu, H. Tourism-driven urbanization in China’s small town development: A case study of Zhapo Town, 1986–2003. Habitat Int. 2012, 36, 152–160. [Google Scholar] [CrossRef]
- González-Pérez, J.M.; Remond-Roa, R.; Rullan-Salamanca, O.; Vives-Miró, S. Urban growth and dual tourist city in the Caribbean. Urbanization in the hinterlands of the tourist destinations of Varadero (Cuba) and Bávaro-Punta Cana (Dominican Republic). Habitat Int. 2016, 58, 59–74. [Google Scholar] [CrossRef]
- Ohlan, R. The relationship between tourism, financial development and economic growth in India. Future Bus. J. 2017, 3, 9–22. [Google Scholar] [CrossRef]
- Bilen, M.; Yilanci, V.; Eryüzlü, H. Tourism development and economic growth: A panel Granger causality analysis in the frequency domain. Curr. Issues Tour. 2017, 20, 27–32. [Google Scholar] [CrossRef]
- Sutheeshna, B.S. Tourism, urbanization and spatial reorganization: Some reflections on tourism development in Goa, India. In Reflections on 21st Century Human Habitats in India; Springer: Berlin, Germany, 2021; pp. 219–242. [Google Scholar] [CrossRef]
- Li, J. Culture and tourism-led peri-urban transformation in China–The case of Shanghai. Cities 2020, 99, 102628. [Google Scholar] [CrossRef]
- Shinde, K.A. Planning for urbanization in religious tourism destinations: Insights from Shirdi, India. Plan. Pract. Res. 2017, 32, 132–151. [Google Scholar] [CrossRef]
- Luo, J.M.; Qiu, H.; Lam, C.F. Urbanization impacts on regional tourism development: A case study in China. Curr. Issues Tour. 2016, 19, 282–295. [Google Scholar] [CrossRef]
- Purnomo, A.M. Urbanization and Tourism Development in Bogor City. Society 2021, 9, 393–409. [Google Scholar] [CrossRef]
- Musavengane, R.; Siakwah, P.; Leonard, L. The nexus between tourism and urban risk: Towards inclusive, safe, resilient and sustainable outdoor tourism in African cities. J. Outdoor Recreat. Tour. 2020, 29, 100254. [Google Scholar] [CrossRef]
- Łapko, A. Urban tourism in Szczecin and its impact on the functioning of the urban transport system. Procedia-Soc. Behav. Sci. 2014, 151, 207–214. [Google Scholar] [CrossRef]
- Shen, W.; Huang, Z.; Yin, S.; Hsu, W.-L. Temporal and Spatial Coupling Characteristics of Tourism and Urbanization with Mechanism of High-Quality Development in the Yangtze River Delta Urban Agglomeration, China. Appl. Sci. 2022, 12, 3403. [Google Scholar] [CrossRef]
- Xie, X.; Sun, H.; Gao, J.; Chen, F.; Zhou, C. Spatiotemporal differentiation of coupling and coordination relationship of tourism–urbanization–ecological environment system in China’s major tourist cities. Sustainability 2021, 13, 5867. [Google Scholar] [CrossRef]
- Li, L.; Yang, Q.; Xie, X. Coupling coordinated evolution and forecast of tourism-urbanization-ecological environment: The case study of Chongqing, China. Math. Probl. Eng. 2021, 2021, 7271637. [Google Scholar] [CrossRef]
- Zhang, T.; Li, L. Research on temporal and spatial variations in the degree of coupling coordination of tourism–urbanization–ecological environment: A case study of Heilongjiang, China. Environ. Dev. Sustain. 2021, 23, 8474–8491. [Google Scholar] [CrossRef]
- Liu, J.; Li, C.; Tao, J.; Ma, Y.; Wen, X. Spatiotemporal coupling factors and mode of tourism industry, urbanization and ecological environment: A case study of Shaanxi, China. Sustainability 2019, 11, 4923. [Google Scholar] [CrossRef]
- Zhang, F.; Sarker, M.N.I.; Lv, Y. Coupling Coordination of the Regional Economy, Tourism Industry, and the Ecological Environment: Evidence from Western China. Sustainability 2022, 14, 1654. [Google Scholar] [CrossRef]
- Guan, H.; Guo, X. Coupling Coordination Analysis of Urban Tourism Environment Quality and the Tourism Economy: A Case Study of Nanjing City. Math. Probl. Eng. 2022, 2022, 9518122. [Google Scholar] [CrossRef]
- Huang, C.; Lin, F.; Chu, D.; Wang, L.; Liao, J.; Wu, J. Coupling relationship and interactive response between intensive land use and tourism industry development in China’s major tourist cities. Land 2021, 10, 697. [Google Scholar] [CrossRef]
- Adedoyin, F.F.; Bekun, F.V. Modelling the interaction between tourism, energy consumption, pollutant emissions and urbanization: Renewed evidence from panel VAR. Environ. Sci. Pollut. Res. 2020, 27, 38881–38900. [Google Scholar] [CrossRef]
- Wang, Z.; Chen, Q. Comprehensive partitions and optimisation strategies based on tourism urbanisation and resources environment carrying capacity in the Yellow River Basin, China. Environ. Sci. Pollut. Res. 2022, 29, 23180–23193. [Google Scholar] [CrossRef]
- Luo, J.M.; Qiu, H.; Goh, C.; Wang, D. An analysis of tourism development in China from urbanization perspective. J. Qual. Assur. Hosp. Tour. 2016, 17, 24–44. [Google Scholar] [CrossRef]
- Xie, N. Coupling of Urbanization and the Development of the Marine Tourism Industry: An Exploratory Study. J. Coast. Res. 2020, 106, 213–216. [Google Scholar] [CrossRef]
- Xie, Y.-F.; Li, L.; Guo, Y.-D.; Sun, X.-P.; Zhang, Y.-J. Sustainable Tourism-Oriented Conservation and Improvement of Historical Villages in the Urbanization Process: A Case Study of Nan’anyang Village, Shanxi Province, China. In Urbanization and Locality; Springer: Berlin, Germany, 2016; pp. 187–203. [Google Scholar] [CrossRef]
- Rogerson, C.M.; Rogerson, J.M. The Other Half of Urban Tourism: Research Directions in the Global South. In Urban Tourism in the Global South: South African Perspectives; Rogerson, C.M., Rogerson, J.M., Eds.; Springer International Publishing: Cham, Switzerland, 2021; pp. 1–37. [Google Scholar] [CrossRef]
- Wang, S.; Chu, Y.; Guo, A.; Guo, Y. Study on high quality development of tourism economy in 18 key provinces along the One Belt and One Road Initiative: Based on the measurement of tourism resource conversion efficiency. Sci. Geogr. Sin. 2020, 40, 1505–1512. (In Chinese) [Google Scholar] [CrossRef]
- Zhao, L.; Dong, Y. Tourism agglomeration and urbanization: Empirical evidence from China. Asia Pac. J. Tour. Res. 2017, 22, 512–523. [Google Scholar] [CrossRef]
- Yu, B. Ecological effects of new-type urbanization in China. Renew. Sustain. Energy Rev. 2021, 135, 110239. [Google Scholar] [CrossRef]
- Ren, F.; Yu, X. Coupling analysis of urbanization and ecological total factor energy efficiency—A case study from Hebei province in China. Sustain. Cities Soc. 2021, 74, 103183. [Google Scholar] [CrossRef]
- Zhang, Y.; Dai, Y.; Chen, Y.; Ke, X. Coupling Coordination Development of New-Type Urbanization and Cultivated Land Low-Carbon Utilization in the Yangtze River Delta, China. Land 2022, 11, 919. [Google Scholar] [CrossRef]
- Ren, Y.; Bai, Y.; Liu, Y.; Wang, J.; Zhang, F.; Wang, Z. Conflict or Coordination? Analysis of Spatio-Temporal Coupling Relationship between Urbanization and Eco-Efficiency: A Case Study of Urban Agglomerations in the Yellow River Basin, China. Land 2022, 11, 882. [Google Scholar] [CrossRef]
- Wang, Y.; Wang, M.; Li, K.; Zhao, J. Analysis of the relationships between tourism efficiency and transport accessibility—A case study in Hubei province, China. Sustainability 2021, 13, 8649. [Google Scholar] [CrossRef]
- Liu, Z.; Lu, C.; Mao, J.; Sun, D.; Li, H.; Lu, C. Spatial–temporal heterogeneity and the related influencing factors of tourism efficiency in China. Sustainability 2021, 13, 5825. [Google Scholar] [CrossRef]
- Zhou, X.; Chen, W. The impact of informatization on the relationship between the tourism industry and regional economic development. Sustainability 2021, 13, 9399. [Google Scholar] [CrossRef]
- Pan, Y.; Weng, G.; Li, C.; Li, J. Coupling coordination and influencing factors among tourism carbon emission, tourism economic and tourism innovation. Int. J. Environ. Res. Public Health 2021, 18, 1601. [Google Scholar] [CrossRef]
- Zhao, D.; Li, C.; Wang, Q.; Yuan, J. Comprehensive evaluation of national electric power development based on cloud model and entropy method and TOPSIS: A case study in 11 countries. J. Clean. Prod. 2020, 277, 123190. [Google Scholar] [CrossRef]
- Tone, K. A slacks-based measure of super-efficiency in data envelopment analysis. Eur. J. Oper. Res. 2002, 143, 32–41. [Google Scholar] [CrossRef]
- Tang, Z. An integrated approach to evaluating the coupling coordination between tourism and the environment. Tour. Manag. 2015, 46, 11–19. [Google Scholar] [CrossRef]
- Shao, H.; Wu, W.; Wang, Z. Temporal and Spatial Coupling Coordination of Green Utilization Efficiency of Tourism Resources and New Urbanization in the Yangtze River Economic Belt. Econ. Geogr. 2021, 41, 204–213. (In Chinese) [Google Scholar] [CrossRef]
- Liu, S.; Lin, Y. Grey Information: Theory and Practical Applications; Kybernetes, Ed.; Springer: Berlin, Germany, 2008; Volume 37, p. 189. [Google Scholar] [CrossRef]
- Wang, S.; Hua, G.; Li, C. Urbanization, air quality, and the panel threshold effect in China based on kernel density estimation. Emerg. Mark. Financ. Trade 2019, 55, 3575–3590. [Google Scholar] [CrossRef]
- McDonald, J.F.; Moffitt, R.A. The uses of Tobit analysis. Rev. Econ. Stat. 1980, 62, 318–321. [Google Scholar] [CrossRef]
- Ren, B.; Gong, Y. Study on the Coupling of Urbanization and High-quality Development in the Yellow River Basin. Econ. Probl. 2022, 3, 1–12. (In Chinese) [Google Scholar] [CrossRef]
- Kranjčević, J.; Hajdinjak, S. Tourism Urbanization in Croatia. The Cases of Poreč in Istria and Makarska in Dalmatia. Comp. Southeast Eur. Stud. 2019, 67, 393–420. [Google Scholar] [CrossRef]
- Al Haija, A.A. Jordan: Tourism and conflict with local communities. Habitat Int. 2011, 35, 93–100. [Google Scholar] [CrossRef]
Publisher’s Note: MDPI stays neutral with regard to jurisdictional claims in published maps and institutional affiliations. |
© 2022 by the authors. Licensee MDPI, Basel, Switzerland. This article is an open access article distributed under the terms and conditions of the Creative Commons Attribution (CC BY) license (https://creativecommons.org/licenses/by/4.0/).

