1. Introduction
Extreme hydrological conditions can lead to major natural disasters at global, regional, and catchment scales, resulting in the loss of property, infrastructure, and life, as well as causing poverty. The Sultanate of Oman suffers annual flood events, particularly along coastal areas where the main cities and buildings are located. On the other hand, the country is also suffering a significant regional drought [
1]. It is important to provide policy-makers with drought estimates, in terms of severity and duration [
2].
Unlike flood frequency, drought only becomes obvious when it causes significant damage [
3,
4,
5]. However, droughts may have long-term adverse effects on the environment, including social and economic aspects [
6]. Undoubtedly, the recognition of hydrological extremes in arid climate catchments, as a part of the integrated water resources system, is not well understood and will depend on the level of research, development, and national awareness of the problem’s significance. Furthermore, drought phenomena can be seen in some other indicators, such as rainfall, streamflow, soil moisture content, and ground water level [
7].
Based on Kleist (1993), the time scale, duration, frequency, and intensity of droughts become important themes in any drought analysis [
7]. Many researchers have studied extreme hydrological conditions in arid regions, particularly during drought events. Recently, a regional study was conducted by El Kenawy et al. (2020), to assess drought in Oman using the Standard Precipitation Index (SPI) and Standardized Precipitation Evapotranspiration Index (SPEI) [
1]. The results showed a significant increase of drought severity for the last four decades, at the country level. Ali et al. (2019) achieved accurate drought forecasts at a small scale on three agricultural plots, using a new multi-stage separation model for estimating Standard Precipitation Index (SPI), at 1, 3, 6, and 12 monthly intervals [
8]. Similarly, Zhao et al. (2021) indicated that the SPI could better reflect annual and seasonal dry weather and flood changes in the field of study based on long-term grade measurements [
9]. Tsesmelis et al. (2022) implemented the SPI to provide accurate results of drought, at a spatiotemporal regional scale, for Greece [
10]. To better perceive and characterise agricultural droughts, Łabędzki (2007) used the 1–3 month SPI which greatly assists the drought detection achieved by the 6-month SPI [
11]. He recommended the use of more than one index to evaluate drought risk levels. Kourgialas (2021) assessed hydrological events in the north-western part of Crete (Greece) based on the SPI method, between 1960 and 2019 [
5]. Interesting correlations were found between groundwater capacity levels and several interrelated factors, such as rainfall, evapotranspiration, soil, available water capacity, and runoff accumulation. Zhai et al. (2010) used the Rainfall Anomaly Index (RAI), Bhalme–Mooley Index (BMI), the Standard Anomaly Index (SAI), and the Palmer Drought Index (PDSI) to highlight local variations in climatic drought and wet conditions in ten catchments, during the period 1961–2005 [
12]. Tufaner and Özbeyaz (2020) applied Machine Learning Algorithms to evaluate the Z index of drought phenomena in Palmer, based on observed rainfall and soil moisture data [
13].
The Soil Conservation Service (SCS) was used to effectively assess flooding for arid catchments. Abushandi and Merkel (2011) and Abushandi (2016) applied the SCS method to different arid regions in the Middle East [
14,
15]. However, there are always problems with assessing hydrological behaviour in arid catchments due to hydrological complexities or data acquisition accuracy. In addition, Shadeed and Almasri (2010) applied a GIS-based SCS-CN approach to develop an estimate of four storm surface runoff events in Palestine [
16]. The analysis by Alzghoul and Al-husban (2021) indicated that there is a strong correlation between the curve number used in the SCS method and the values obtained from measured runoff and the rainfall depth [
17]. El-Hames (2012) applied an empirical method for runoff prediction in arid and semi-arid catchments based on morphological data and SCS-curve number [
18]. The results were validated and calibrated from six different countries using a significant number of rainfall events. Al-Ghobari et al. (2020) studied spatial runoff behaviour due to different land cover types, slopes, and maximum retention, as they are the major parameters for SCS [
19]. Braud et al. (2016) tried to explain these phenomena by presenting European and international flood warning systems [
20]. The rainfall depth is calculated by the reverse implementation of the hydrological model, based on iterative rainfall inputs to obtain flood peaks. Furthermore, anthropogenic influences were studied by Karagiorgos et al. (2016). They analysed the vulnerability components, including physical and social factors, due to unexpected flooding [
21]. The analysis was based on a review of the disability assessment and focused on weaknesses as a framework for outlining and evaluating the negative impact. Mahmood et al. (2017) used daily hydrological data for the years 2013 and 2014, to understand the characteristic distribution of storm rainfall [
22].
An estimation of flash flooding in the Wadi Al Jizzi catchment by Abushandi and Al Sarihi (2022), using two different lumped models, showed that a statistical readjustment was needed to avoid underestimation of the small flood values [
23]. On the other side of Oman, Al Ruheili et al. (2019) estimated flood damage in the floodplain in the southern part of Oman under current and future conditions [
24]. They also determined the flood extent and amount of flood damage using the 3Di model for the year 2002 cyclone (ARB01). While the study gives an overview of the political decisions contributing to the sustainable development of resources, future assessment of the flood damage at catchment scales was also performed.
Further research was based on the integrated implementation of lumped and distributed hydrologic models. Recently, Niyazi et al. (2020) evaluated the runoff compensation equivalent using two models dealing with morphological parameters and hydrological properties [
25]. In addition, these models include the Watershed Modelling System (WMS) and the Hydrological Modelling System (HEC-HMS). In addition, Saber et al. (2015) developed physics-based hydrological models adapted to flash floods, to help understand hydrological processes and cope with water-related issues, such as the scarcity of water and data [
26]. An ecological assessment for a suggested distributed model of a river basin, in which the wadi system (Hydro-BEAM-WaS) is coupled with remote sensing data, performed well in the absence of high-quality ground observations. However, El Alfy (2016) used a comprehensive approach to assess the effects of floods in urban areas, integrating distributed models and forecast precipitation [
27]. The flow model was developed as an activity for capturing objects with daily precipitation measurements. The study showed that rapid urbanisation has a negative impact on the hydrological process, as the sprawl of alluvial channels is important. Jodar-Abellan et al. (2019) evaluated hydrological responses using geographic information system tools (SWAT) in five basins of the Mediterranean (south-eastern Spain) with pixel units from 10.2 to 200.9 km
2 [
28]. Furthermore, Aghabeigi et al. (2020) compared the IHACRES model (Identification of unit Hydrographs And Component flows from Rainfall, Evaporation, and Streamflow data) to the Complex SWAT model for three watersheds: one dry and two semi-dry [
29]. The SWAT model performed better than the IHACRES model for some climate zones. Moreover, Abushandi and Merkel (2013) simulated a single flood event in the northern part of Jordan, that occurred in the year 2008, using two models: HEC-HMS and IHACRES, at an hourly scale [
30]. An integrating satellite reconnaissance to generate rainfall data (GSMaP_MVK +) was used. The performance of the IHACRES lumped model had some errors, while the calibrated runoff results had a good level of performance in the distributed HEC-HMS.
The Wadi Al Jizzi arid catchment in the northern part of Oman experiences extreme rainfall storms and irregular flash floods due to topographical, climatological, and hydrological complexities. This, however, destroys the infrastructure of the city at the outlet of the catchment, arousing the need for an improved understanding of flood behaviour at a catchment scale. Although the water is limited, the Wadi Al Jizzi catchment is particularly sensitive to flash flooding due to the following field survey findings:
A series of basaltic mountains surrounding the catchment from the western part, known as Al Hajar Al Gharbi.
Hyper arid catchment characteristics, including a limited number of high-intensity, annual storm rainfall events in a short time.
The catchment is dominated by bare soil and very limited vegetation cover.
For the better planning, operation, and development of water, energy, and food production, an understanding of extreme hydrologic conditions at a regional scale is an important step. The shortage of both surface and ground water resources controls the difficulties of present and future agricultural activities. Changing the negative impact of flash floods into a fruitful source of water has not been achieved in many areas of Oman. In fact, the main portion of flood water flows into the sea, after destroying the infrastructure. The SPI and RAI methods were successfully applied to arid areas where the observed hydrologic dataset is limited. While both methods are characterised by uncomplicated generic structures, the SCS-CN requires more inputs to simulate wet seasons. Substantial storm rainfall occurred in the upper part of Wadi Al Jizzi, causing serious damage to the infrastructure of Sohar City, located at the catchment outlet. Furthermore, the frequency of flash flooding has dramatically increased over the last 20 years and requires urgent action. However, only a few studies have been conducted to investigate hydrologic wet and drought severities in Oman. The aim of this research is to assess the behaviour of the extreme drought and wet conditions in Wadi Al Jizzi, using the SPI and RAI for drought evaluation and the SCS-CN model for wet seasons.
2. Study Area
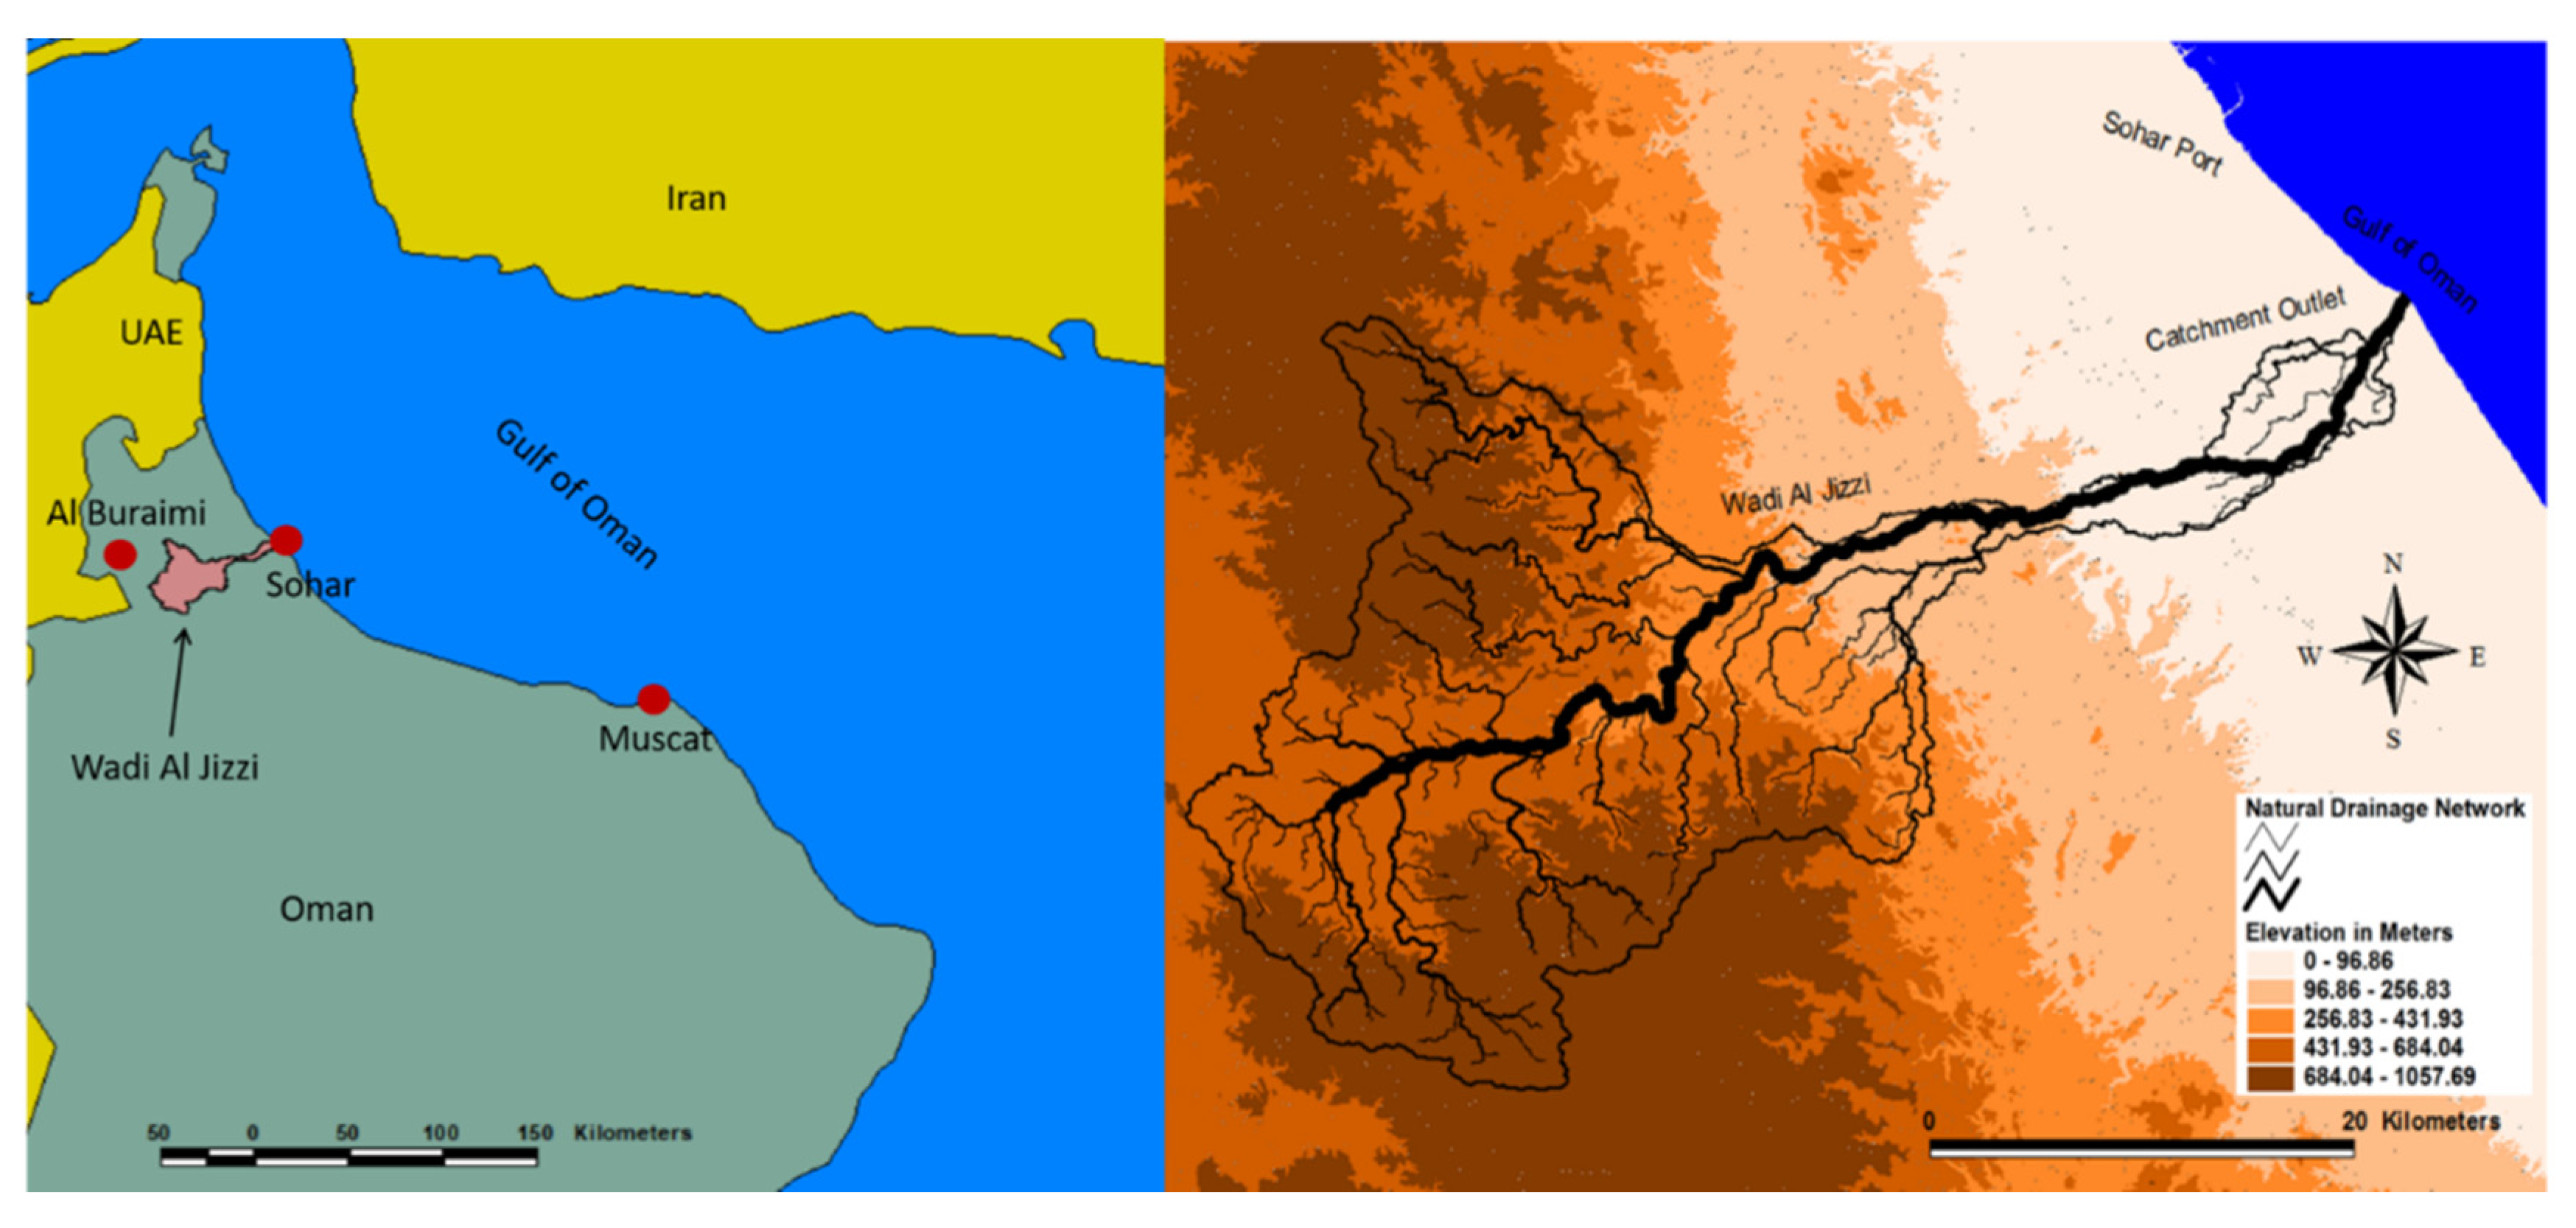
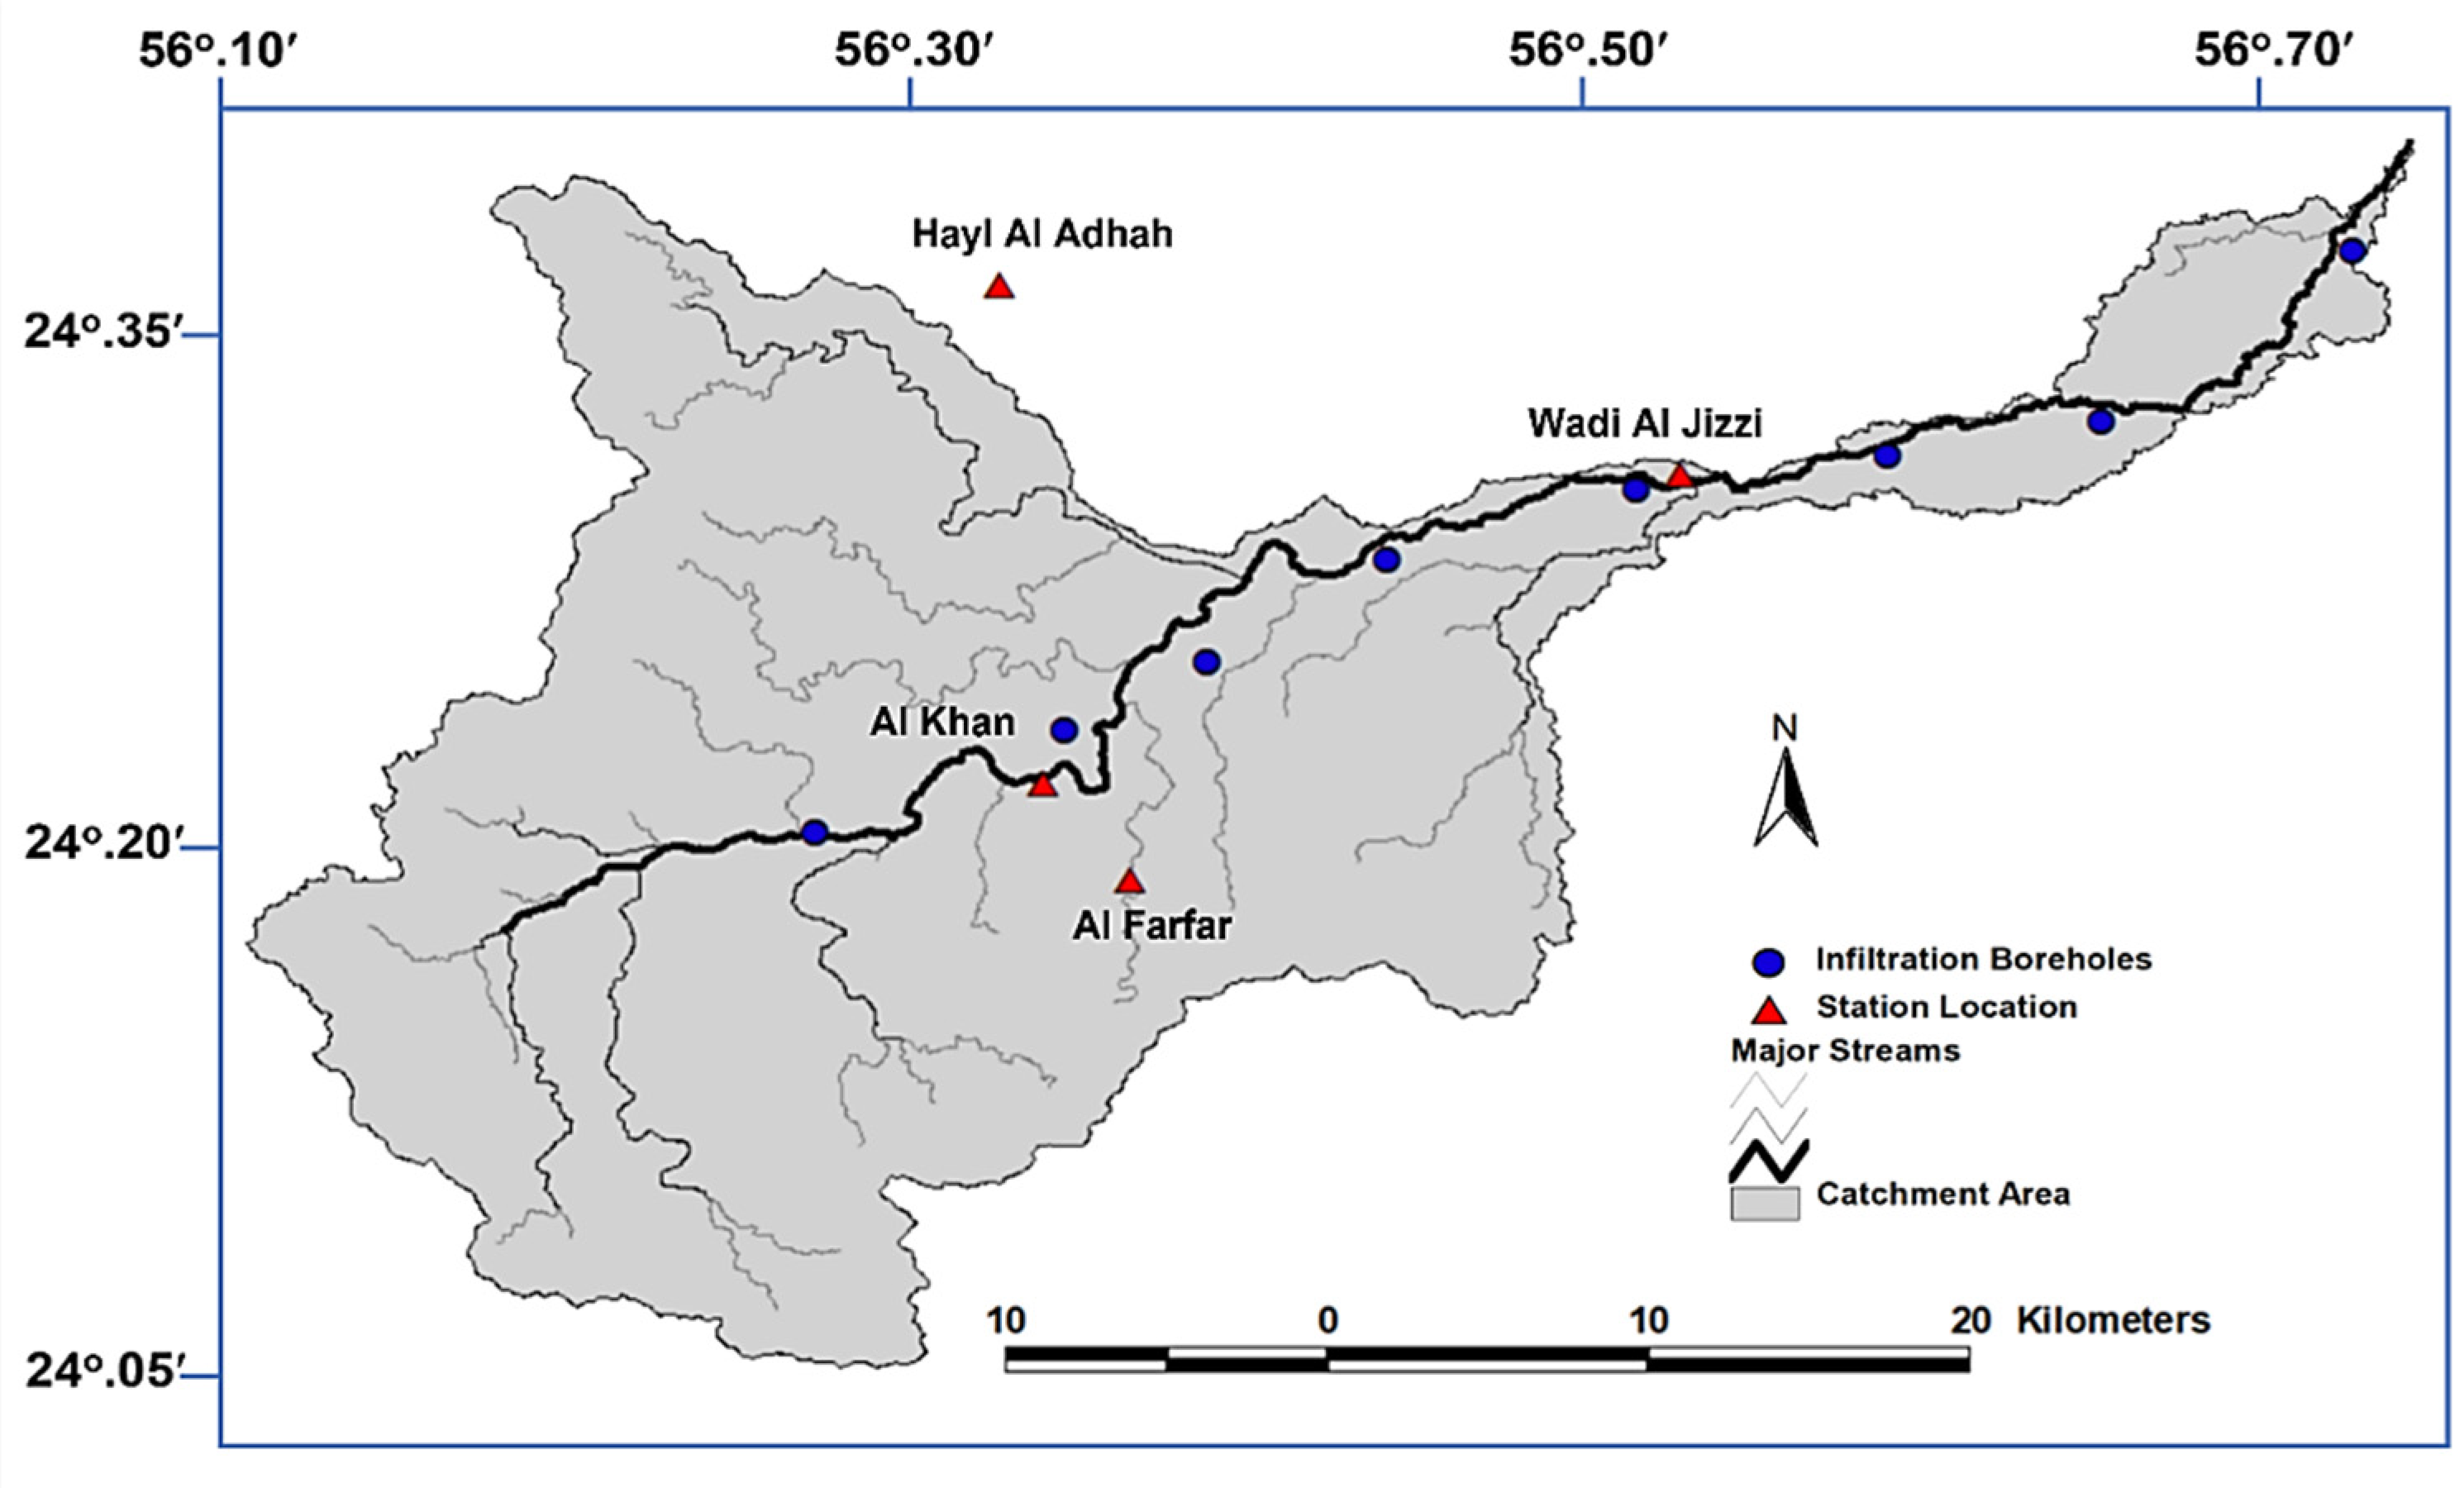
The catchment considered in this study is the Wadi Al Jizzi in the North Al Batina Governorate in Oman, alongside the Sohar–Al Buraimi city highway and with a length of 77.8 km. Wadi Al Jizzi represents a major valley in the region and ends in the Sohar coastal outlet. The catchment area is around 870.5 km
2, with an average slope of 0.56%. The highest mountain around the catchment is more than 1000 m above sea level (
Figure 1).
Sohar is the major city located at the outlet of the Wadi Al Jizzi catchment, an area of important crop production. Since the introduction of mechanical pumps, the development of agricultural land has increased since the early 1970s.
There are many villages near Wadi Al Jizzi: some of them belong to Sohar City, and some to Al Buraimi City. The villages belonging to Sohar are Al-Jahili, Al-Huwailat, Sahban, Al-Farfar, Al-Khan, Al-Suhaila, Dhahran, Al-Arja, and others. The state of Buraimi includes the villages of Al-Swadif, Al-Hail, Al-Rabi, Al-Wasit, Katana, Al-Daqiq, and others. The major activity in these villages is agriculture and the water resource is groundwater [
31].
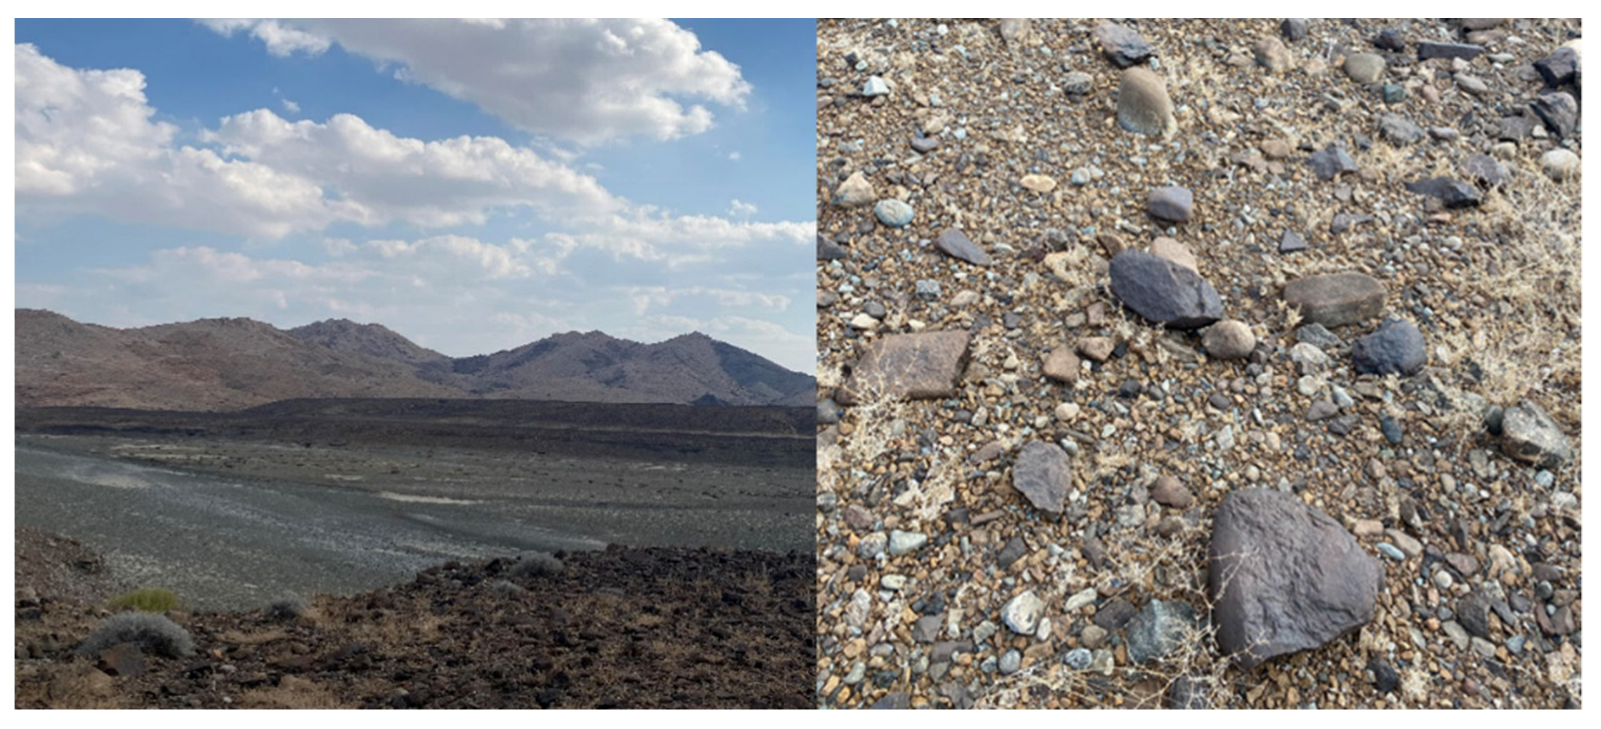
The Wadi Al Jizzi catchment is characterised by the presence of many types of impermeable basaltic rocks (
Figure 2), the most important of which are igneous rocks, which were formed between 800 million years ago until the present [
32]. Sedimentary and metamorphic rocks are present in the region, as sediments of different ages were deposited and then experienced several folding and cracking periods [
33]. The soil type is mainly loamy soil with small portions of sandy soil and clay, based on the physical tests conducted. The catchment has only one dam, with an area of 2.7 km
2, a length of 1350 m, a height of 14 m, and a maximum volume of 5.4 × 10⁶ m
3 [
34]. There were two purposes for constructing this dam:
To recharge the ground water which has a water table level of 172 m underground, and
To protect Sohar City from flash floods during wet seasons.
Generally, the area is considered as being a hyper arid, coastal area: hot and humid during the summer, with an average temperature of 37 °C, and moderate in winter, with an average temperature of 18.5 °C, except for highly elevated land, where the climate remains mild throughout the entire year [
35].
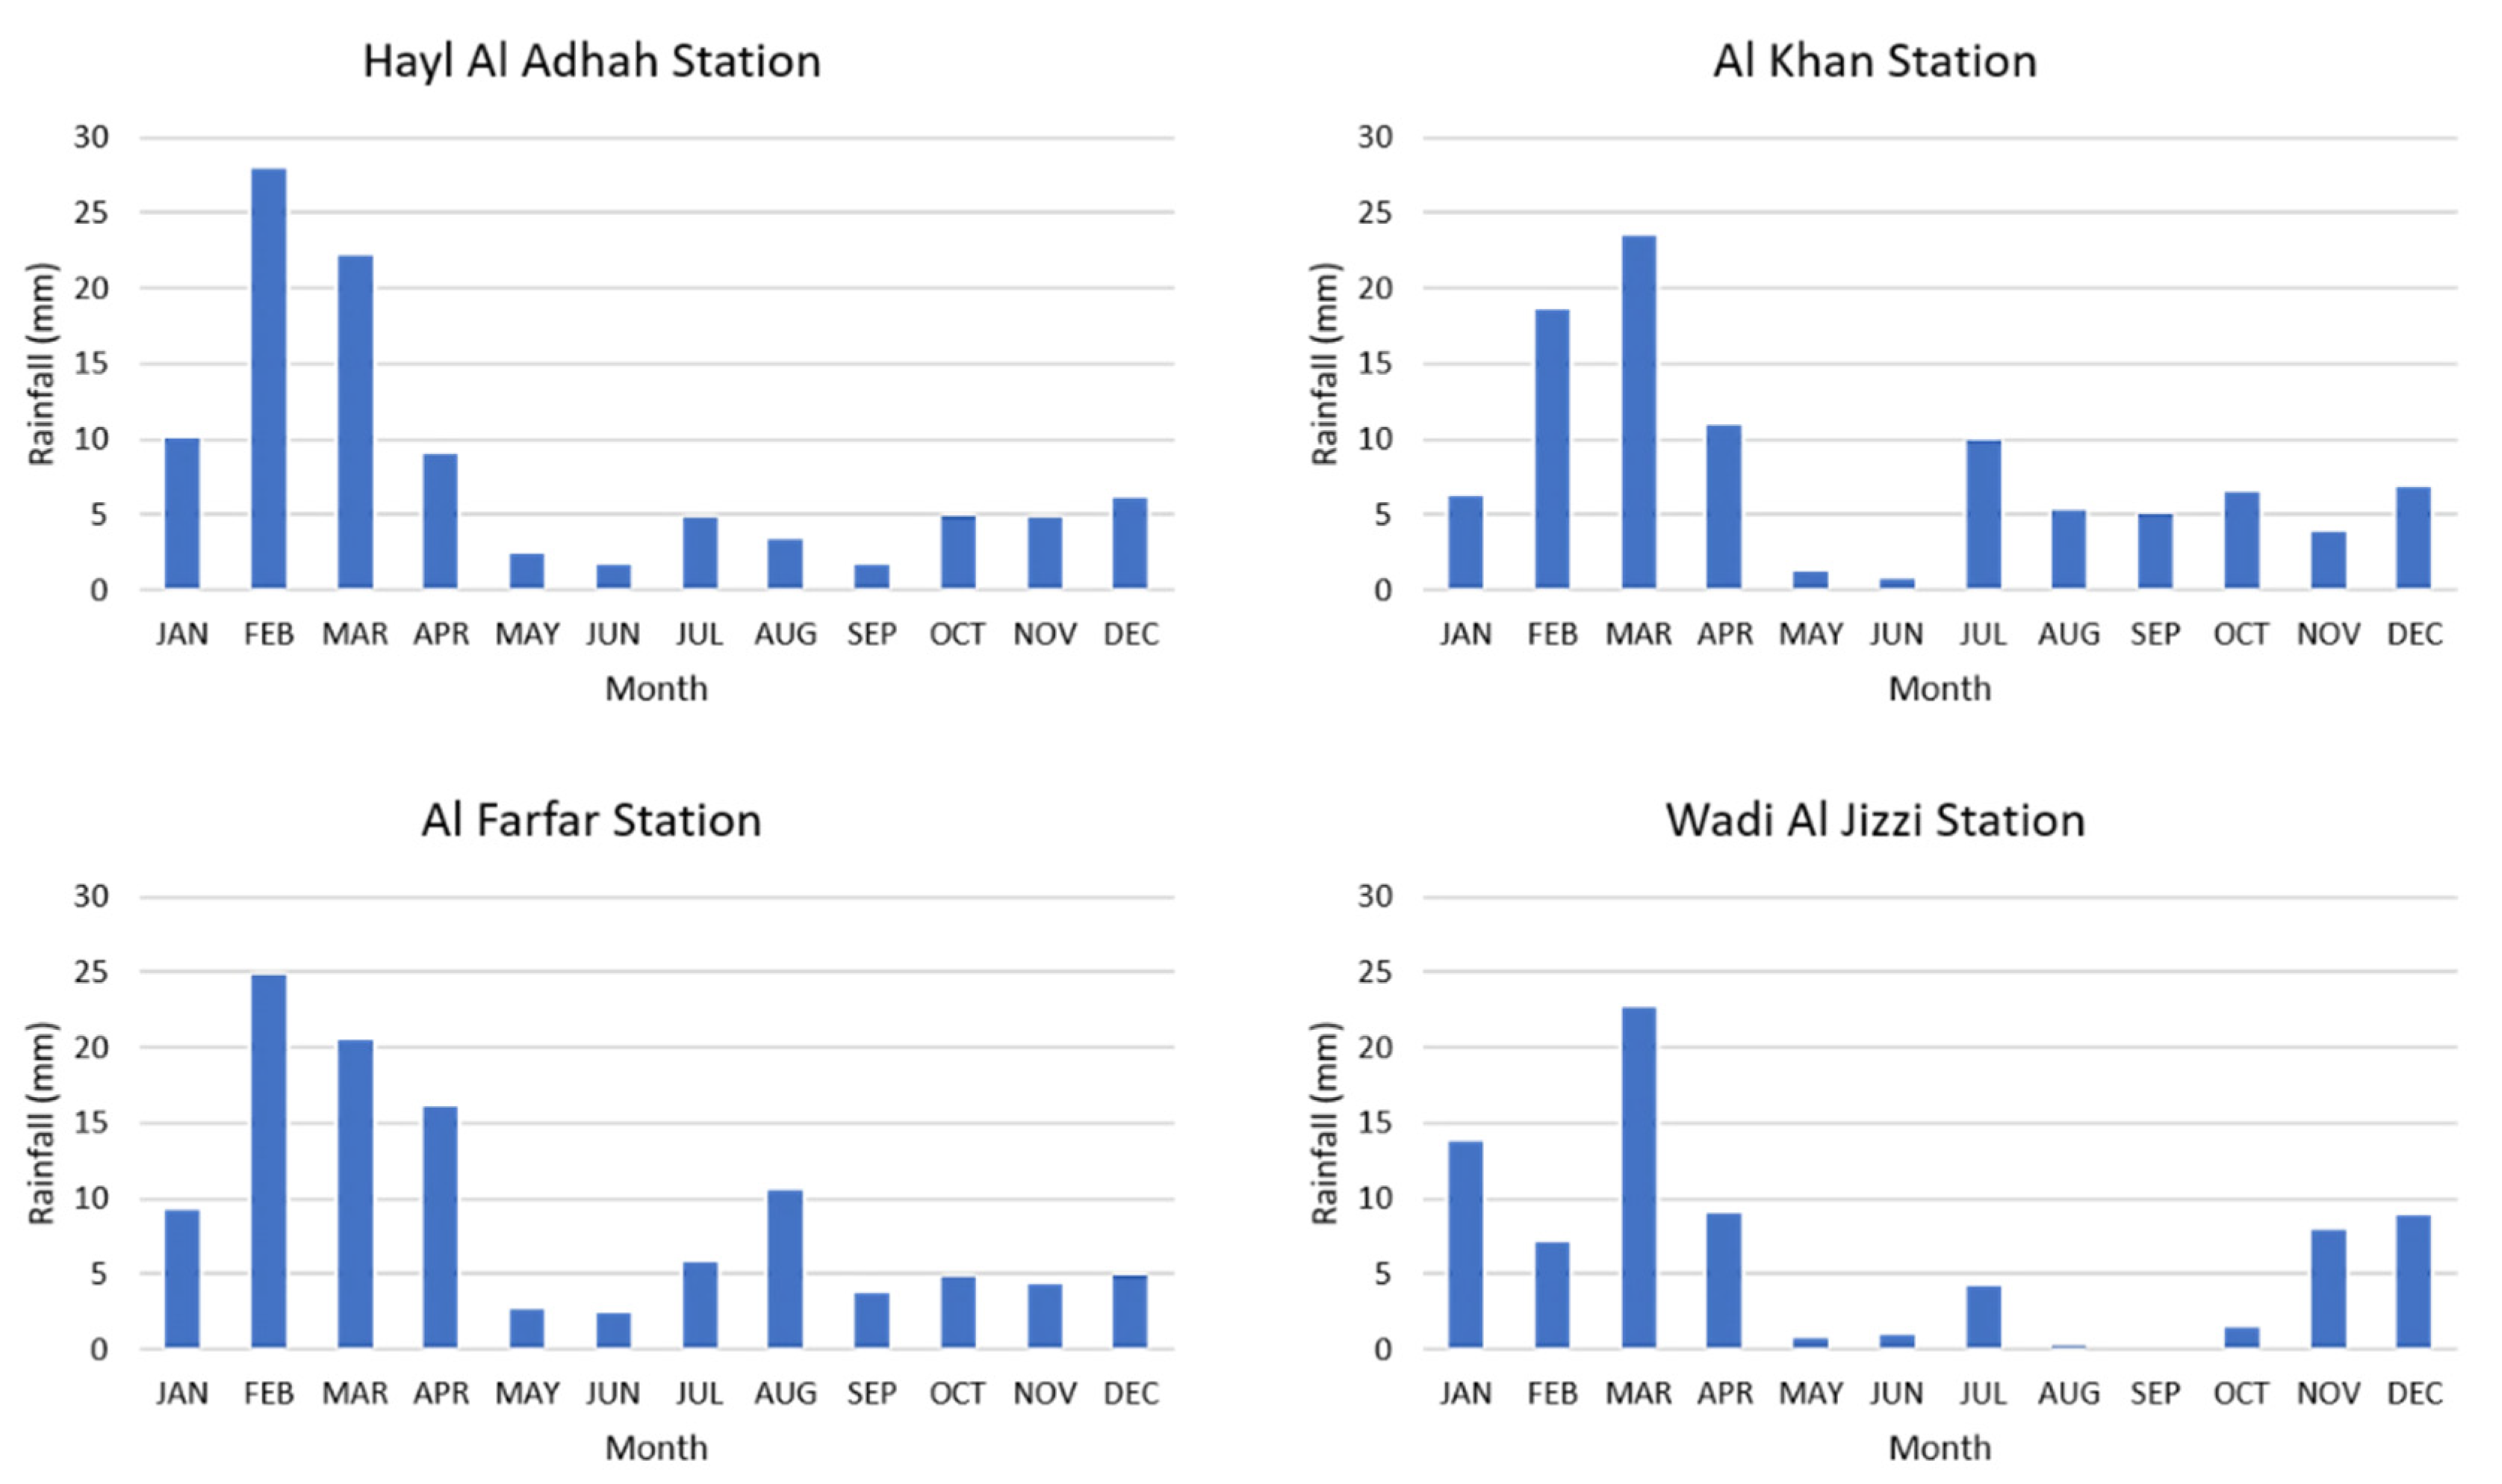
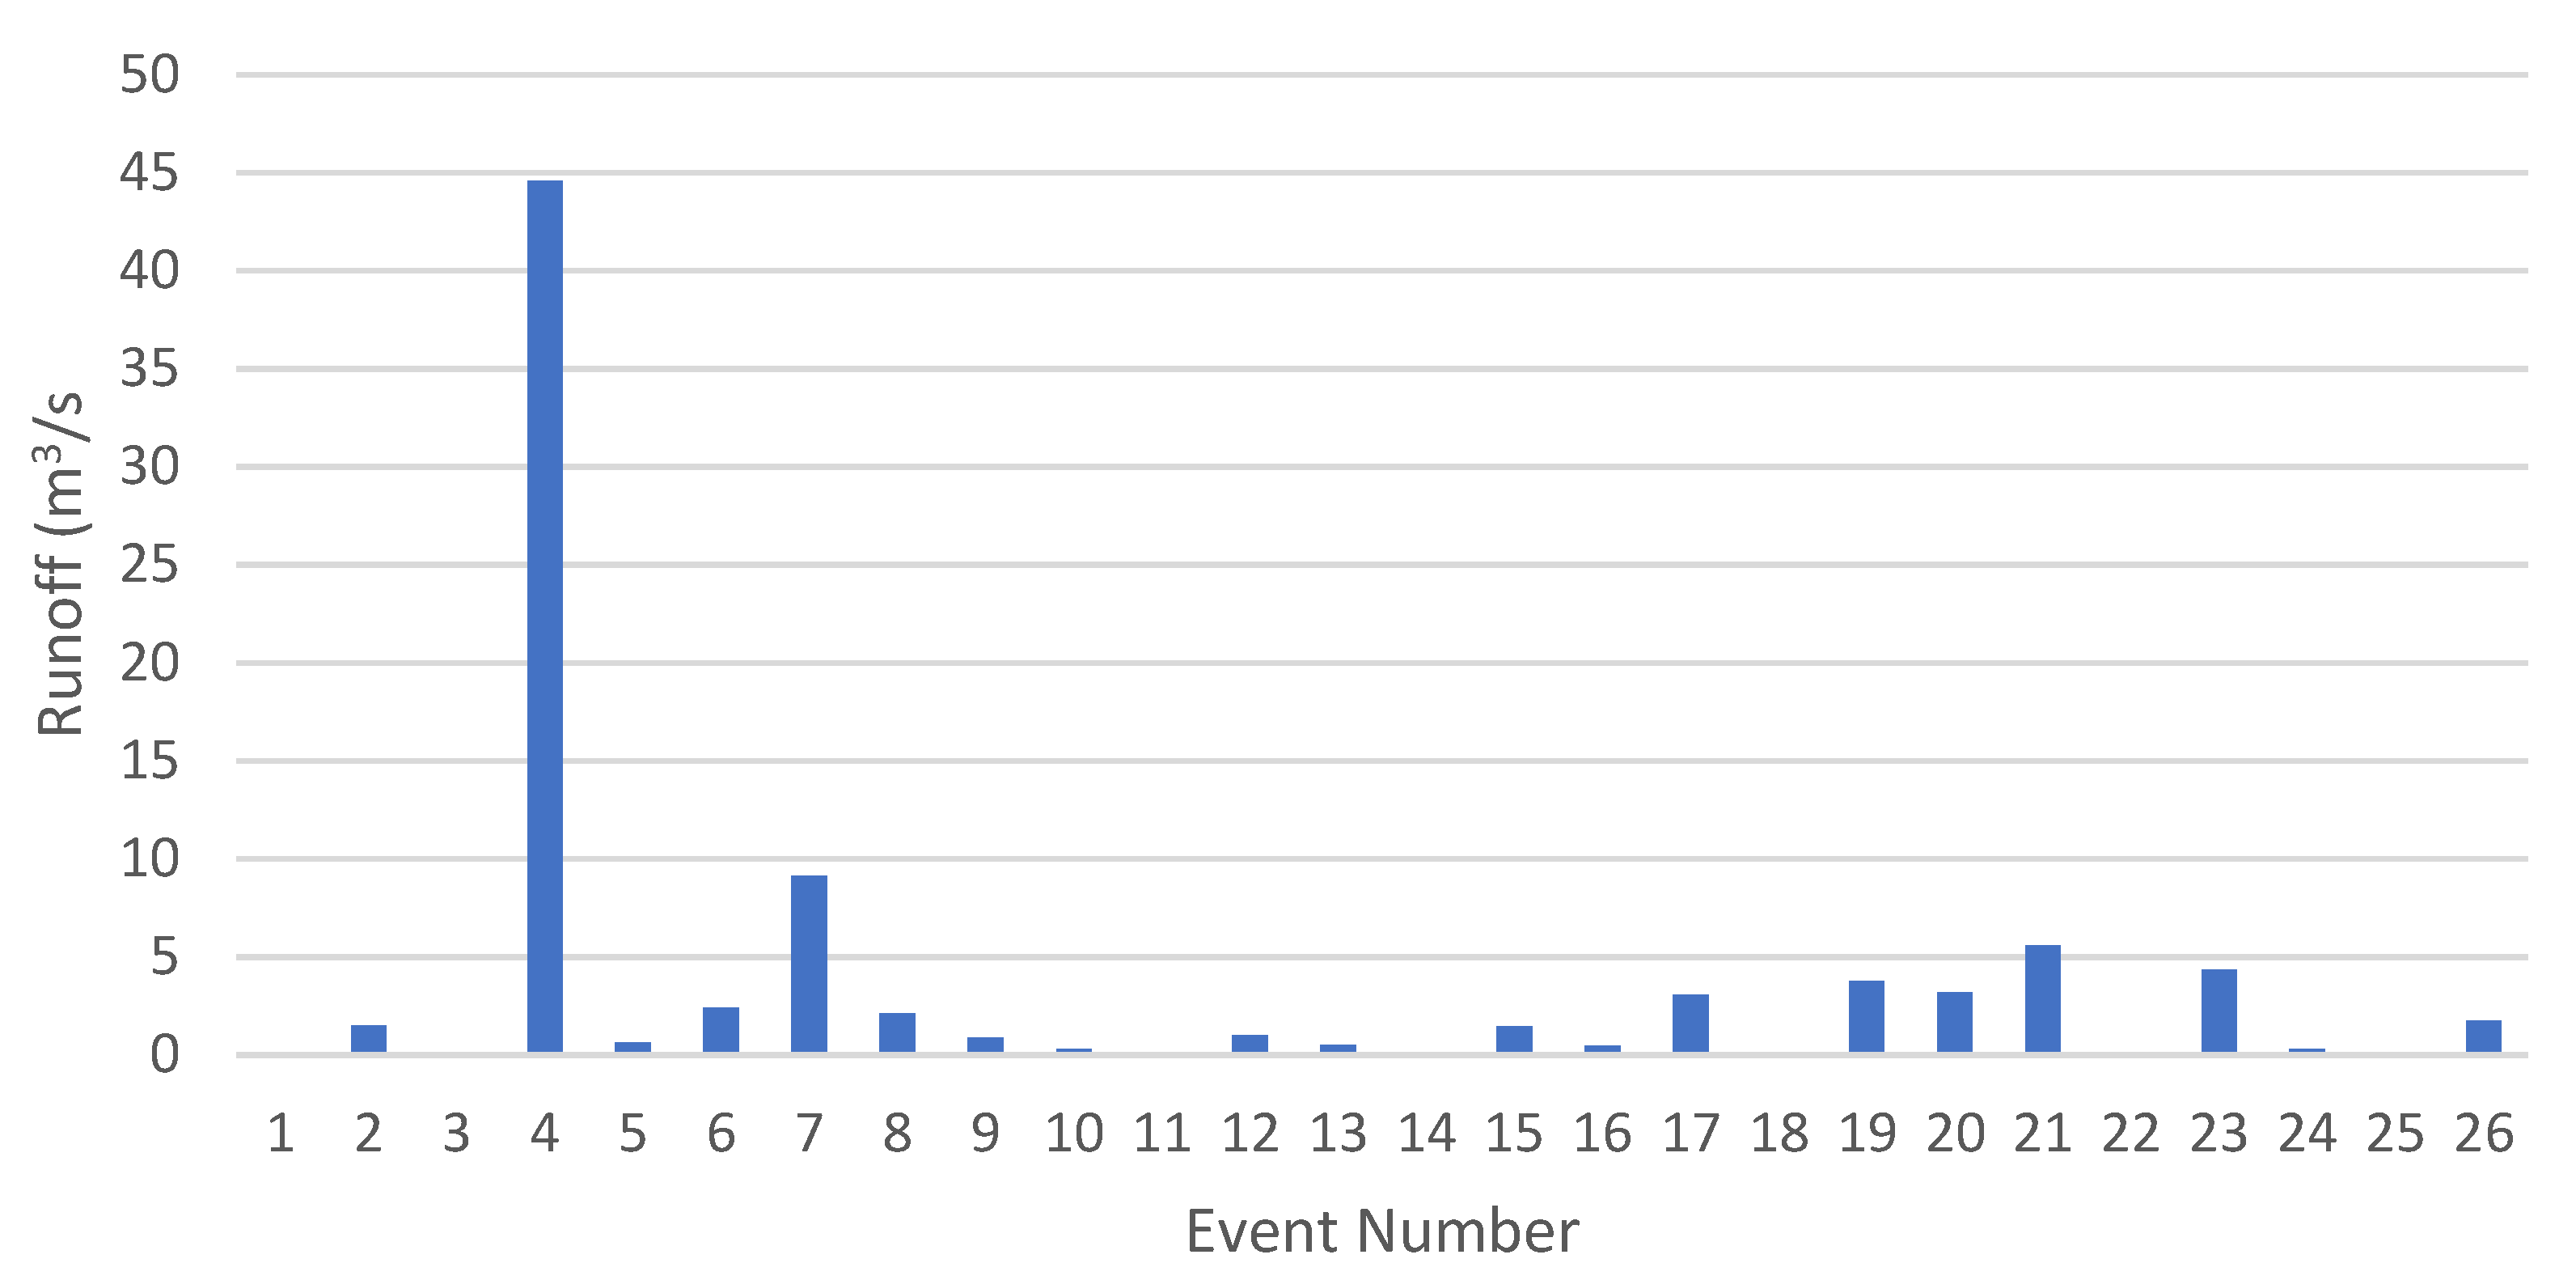
Localised thunderstorms occur high over the Al Hajar Al Gharbi Mountain range, in the north of Oman, during the summer months and irregular droughts sweep across the Arabian Peninsula. Rain occurs inland and on the coastal regions in the winter. Rainfall is highly variable from one location to another and from one year to another. Orographic impacts are sometimes affected by local patterns. The amount of surface runoff depends on rainfall intensity and frequency. Apart from some short periods of data loss, records of the wadi runoff since 1984 are both efficient and complete. The runoff of surface water mostly happens between January and April, which are the wet months. Such records are relevant and could be used in statistical predictions. The catchment under study is classified as an ephemeral stream where any water flow within the major wadi catchment is considered as being in flood. The magnitudes of the flooding have been categorised as low, medium, and high.


