Article

Hydrogen Purification by Pressure Swing Adsorption: High-Pressure PSA Performance in Recovery from Seasonal Storage

Thermal Process Engineering, Institute of Chemical, Environmental and Bioscience Engineering, Technische Universität Wien, Getreidemarkt 9/166, 1060 Vienna, Austria
*
Author to whom correspondence should be addressed.
Sustainability 2022, 14(21), 14037; https://doi.org/10.3390/su142114037
Submission received: 30 September 2022 / Revised: 17 October 2022 / Accepted: 19 October 2022 / Published: 28 October 2022
(This article belongs to the Special Issue Advances in Gas Separation Technologies for Green Process Engineering)

Abstract

:
Hydrogen storage in a depleted gas field is a promising solution to the seasonal storage of renewable energy, a key question in Europe’s green transition. The gas composition and pressure in the month-long storage and recovery phase can vary substantially; meanwhile, the recovered H2 has to be pure, especially for fuel cell applications. Pressure swing adsorption can be used for the purification of the recovered gas. A lab-scale, four-bed PSA unit was built to investigate its applicability by separating different H2-CH4 mixtures. The feed parameters in the experiments are based on a depleted gas reservoir with a pressure range of 25–60 bar and methane contamination between 0 and 35%. The change in the feed properties is modeled by four distinct stages and the twelve-step cycle is tailored to each stage. The high pressure did not have any irreversible effects on the process. A hydrogen purity of 99.95% was achieved in all stages with the average hydrogen recovery ranging from 60 to 80%. The experiments revealed the challenges of a cycle design when the feed parameters are not constant, but an adequate separation performance was shown, which supports the applicability of the PSA in seasonal storage and confirms the need for further investigation with multicomponent contaminants and large-scale projects.

1. Introduction

Annual global greenhouse gas (GHG) emissions have been increasing steadily since 1998 [1]. This has contributed to the rise in global temperatures and sea levels. Climate change is a global threat to our way of life, and it changed our perspective on our role in the ecosystem. To keep up with increasing global energy demands and reduce our impact on the climate, a shift toward renewable sources is required. After signing the Paris Agreement, the European Union (EU) is “striving to be the first climate-neutral continent” with the European Green Deal package. First published in 2019, it is a comprehensive strategy with an ambitious set of initiatives to achieve net-zero GHG emissions by 2050 and to “improve the well-being and health of citizens and future generations”. In line with the goals of the Green Deal, the EU’s Hydrogen Strategy was published in 2020 [2,3]. Hydrogen is versatile in its applicability in many sectors, such as mobility, transport, power or heavy industry; it can be used as a fuel, an energy carrier or a feedstock. It is not a one-size-fits-all solution, but as part of an integrated energy system, it can have a significant role in the decarbonization of those sectors. On 18th of May 2022, the European Commission published the REPowerEU program to “reduce our dependence on Russian fossil fuels by fast-forwarding the clean transition...” [4]. Scaling up the transition to renewable energy is key to accelerating the EU’s phasing out of Russian fossil fuels and achieving “...a more resilient energy system and a true Energy Union”. The report reemphasizes the role of hydrogen as a key component to replace natural gas, coal and oil in hard-to-decarbonize industries and transport. The target by 2030 is to produce 10 million tonnes of hydrogen domestically and import another 10 on top of that. For a hydrogen-ready infrastructure and the regulatory framework, standards have to be rolled out in an accelerated manner for a successful energy system transition. Hydrogen will have a crucial role in balancing a renewables-based electricity system and in seasonal storage, enhancing decarbonization and the security of supply. One example of the use of seasonal storage in the green hydrogen supply chain is shown in Figure 1. When green electricity is cheap and abundant (e.g., in summer), the surplus energy can be used to produce hydrogen, i.e., transforming electrical to chemical energy. In winter, when solar power generation is low and heat demand is high, hydrogen can be recovered and used in heating appliances or fuel cells. This type of storage is preferential because energy-specific storage costs are much lower and significantly more energy can be stored, transported and distributed than in the form of electricity [5]. As an energy carrier, hydrogen has the advantage that a portion of the existing gas grid could be repurposed for its transport.
Hydrogen could provide up to 24% of the total energy demand in the world by 2050, and large-scale underground storage (UGS) is essential to meet demands in the 2030–2050 period [3]. There are three main options for UGS in natural formations: salt caverns, depleted gas fields and aquifers [6]. Storage in salt caverns is a proven concept with in-operation sites for nearly 50 years in the USA (3) and UK (1), listed in Table 1 [7,8,9,10]. In spite of only four active sites worldwide, the technology can be considered mature, but all these facilities serve as feedstock for the chemical industry with constant annual demand profiles. Seasonal balancing requires higher injection/withdrawal rates and a fast-paced, flexible and cyclic operation with its unique challenges to be addressed.
Although salt caverns are regarded as the ideal solution because of their natural tightness, suitable formations in Europe are mainly located in Northern Germany, Poland, Denmark and the UK, as illustrated in Figure 2 from Caglayan et al. [11]. Porous structures (depleted gas fields and aquifers) are more widely available across Europe. According to a report from 2021, there are 63 salt cavern sites with a total working capacity of 206 TWh, and there are 80 depleted gas reservoirs with a total working capacity of 792 TWh, showing the potential in depleted gas fields for underground hydrogen storage [12,13,14].
Currently, there are no known projects where pure hydrogen is stored in a porous structure. Pilot and demonstration projects, as well as potential sites, were collected by Sambo et al. [10]. Recent projects in Austria and Argentina showed that the injection and storage in natural gas reservoirs of up to 20% of hydrogen could be safely performed; meanwhile, the storage of pure hydrogen is currently being investigated in Austria [15,16,17]. A storage facility does not consist only of the reservoir. It also needs wells for the injection/withdrawal, pipelines and gas processing equipment, including compression, drying and cleaning. In depleted gas fields, residual natural gas (a mixture of methane, hydrocarbons, carbon dioxide, nitrogen and more) contaminates the hydrogen. Quality requirements in the chemical industry or fuel cells are very strict and cannot be met without separation from contaminants. The most common technology for hydrogen purification is pressure swing adsorption (PSA).
Adsorption is the phenomenon when gas molecules attach to a solid to form bonds with the surface molecules having unbalanced forces, because they do not experience the same attraction from each side [18]. Different gases have different affinities to adsorb on given solids, called adsorbents. In a pressure swing system, the fact that this affinity increases with increasing pressure is used. The process is reversible, i.e., the adsorbed species can be recovered and the adsorbent regenerated by pressure reduction. The first patented use of pressure swing adsorption on a commercial scale was for the separation of air by Skarstrom (1958) and Montgareuil and Dargan (1964) [19,20]. These two patents became the foundation for PSA separation technique commercialization in the following decades. Further details on adsorbents, processes, equilibria and kinetics can be found in the literature [18,21,22,23]. Key applications of PSA are the separation of air, CO2 removal from steel mill reduction gas and hydrogen purification [24]. Feed gas can be from various sources, including methanol plants, ethylene offgas, ammonia plants or cryogenic purification, but the most common use of PSA is the hydrogen recovery from steam methane reforming (SMR) offgas ([23,25,26,27,28,29,30,31]). The technology can be considered mature, but new challenges arise with seasonal storage in depleted natural gas fields. Namely, the decreasing pressure and hydrogen content throughout the operation, contrary to the state-of-the-art systems, where the feed parameters are constant. In this work, we designed a laboratory-scale PSA unit to measure the separation performance with a wide range of feed conditions to represent the recovery phase over the winter months.

2. Materials and Methods

As described in the introduction, the varying composition and pressure of the withdrawn gas is a significant challenge for purification and conditioning. The properties of the gas mixture can range in a wide interval when stored in a natural gas reservoir. A certain amount of cushion gas is required in the gas field, even after it is “emptied”, to prevent the crumbling of the porous structure. This limits the lowest achievable pressure in the extraction phase; meanwhile, the cap rock sealing integrity limits the maximum pressure. Both are specific to the storage site and require extensive testing before operation. There are currently two depleted gas fields in operation for hydrogen storage and a few potential sites where investigation has started. Sambo et al. collected and reviewed in-operation and potential sites, including salt caverns, depleted oil and gas fields and aquifers [10]. This work focuses on the post-storage purification of the gas with a high-pressure PSA and transient feed conditions. As a result, a generalized underground natural gas field was investigated, with a pressure range of 25–60 bar and a composition of 98–65% hydrogen content. There are no data available for storing pure hydrogen in porous rock formations, so the range of feed parameters was approximated. The lower pressure limit was selected as a typical cushion gas pressure. The upper limit was selected to be close to the pipeline pressure of the gas grid system. The main component of natural gas is methane, so a binary mixture of methane and hydrogen was used in this work. Continuous operation and linear progression were assumed, and four distinct stages were selected to represent the month-long withdrawal process, as shown in Figure 3. The first stage is at the start of withdrawal, where pressure is high, and only traces of natural gas (represented by methane in this work) are present. In the second stage, the pressure is still high, but the natural gas content is significantly larger. The third stage is moderately high pressure with moderate natural gas content. This is the closest feed gas composition to current state-of-the-art industrial processes. The final stage is at the end of withdrawal, with moderate pressures and high contaminant content. Numerical values for each stage are listed in Table 2. In a real-world application, many more pressure–composition pairs occur, and the separation unit must work effectively through the whole range. As an early-stage, laboratory-scale investigation, the four defined stages are sufficient to distinguish between qualitative behaviours of mixtures and provide data to validate a process simulation model.
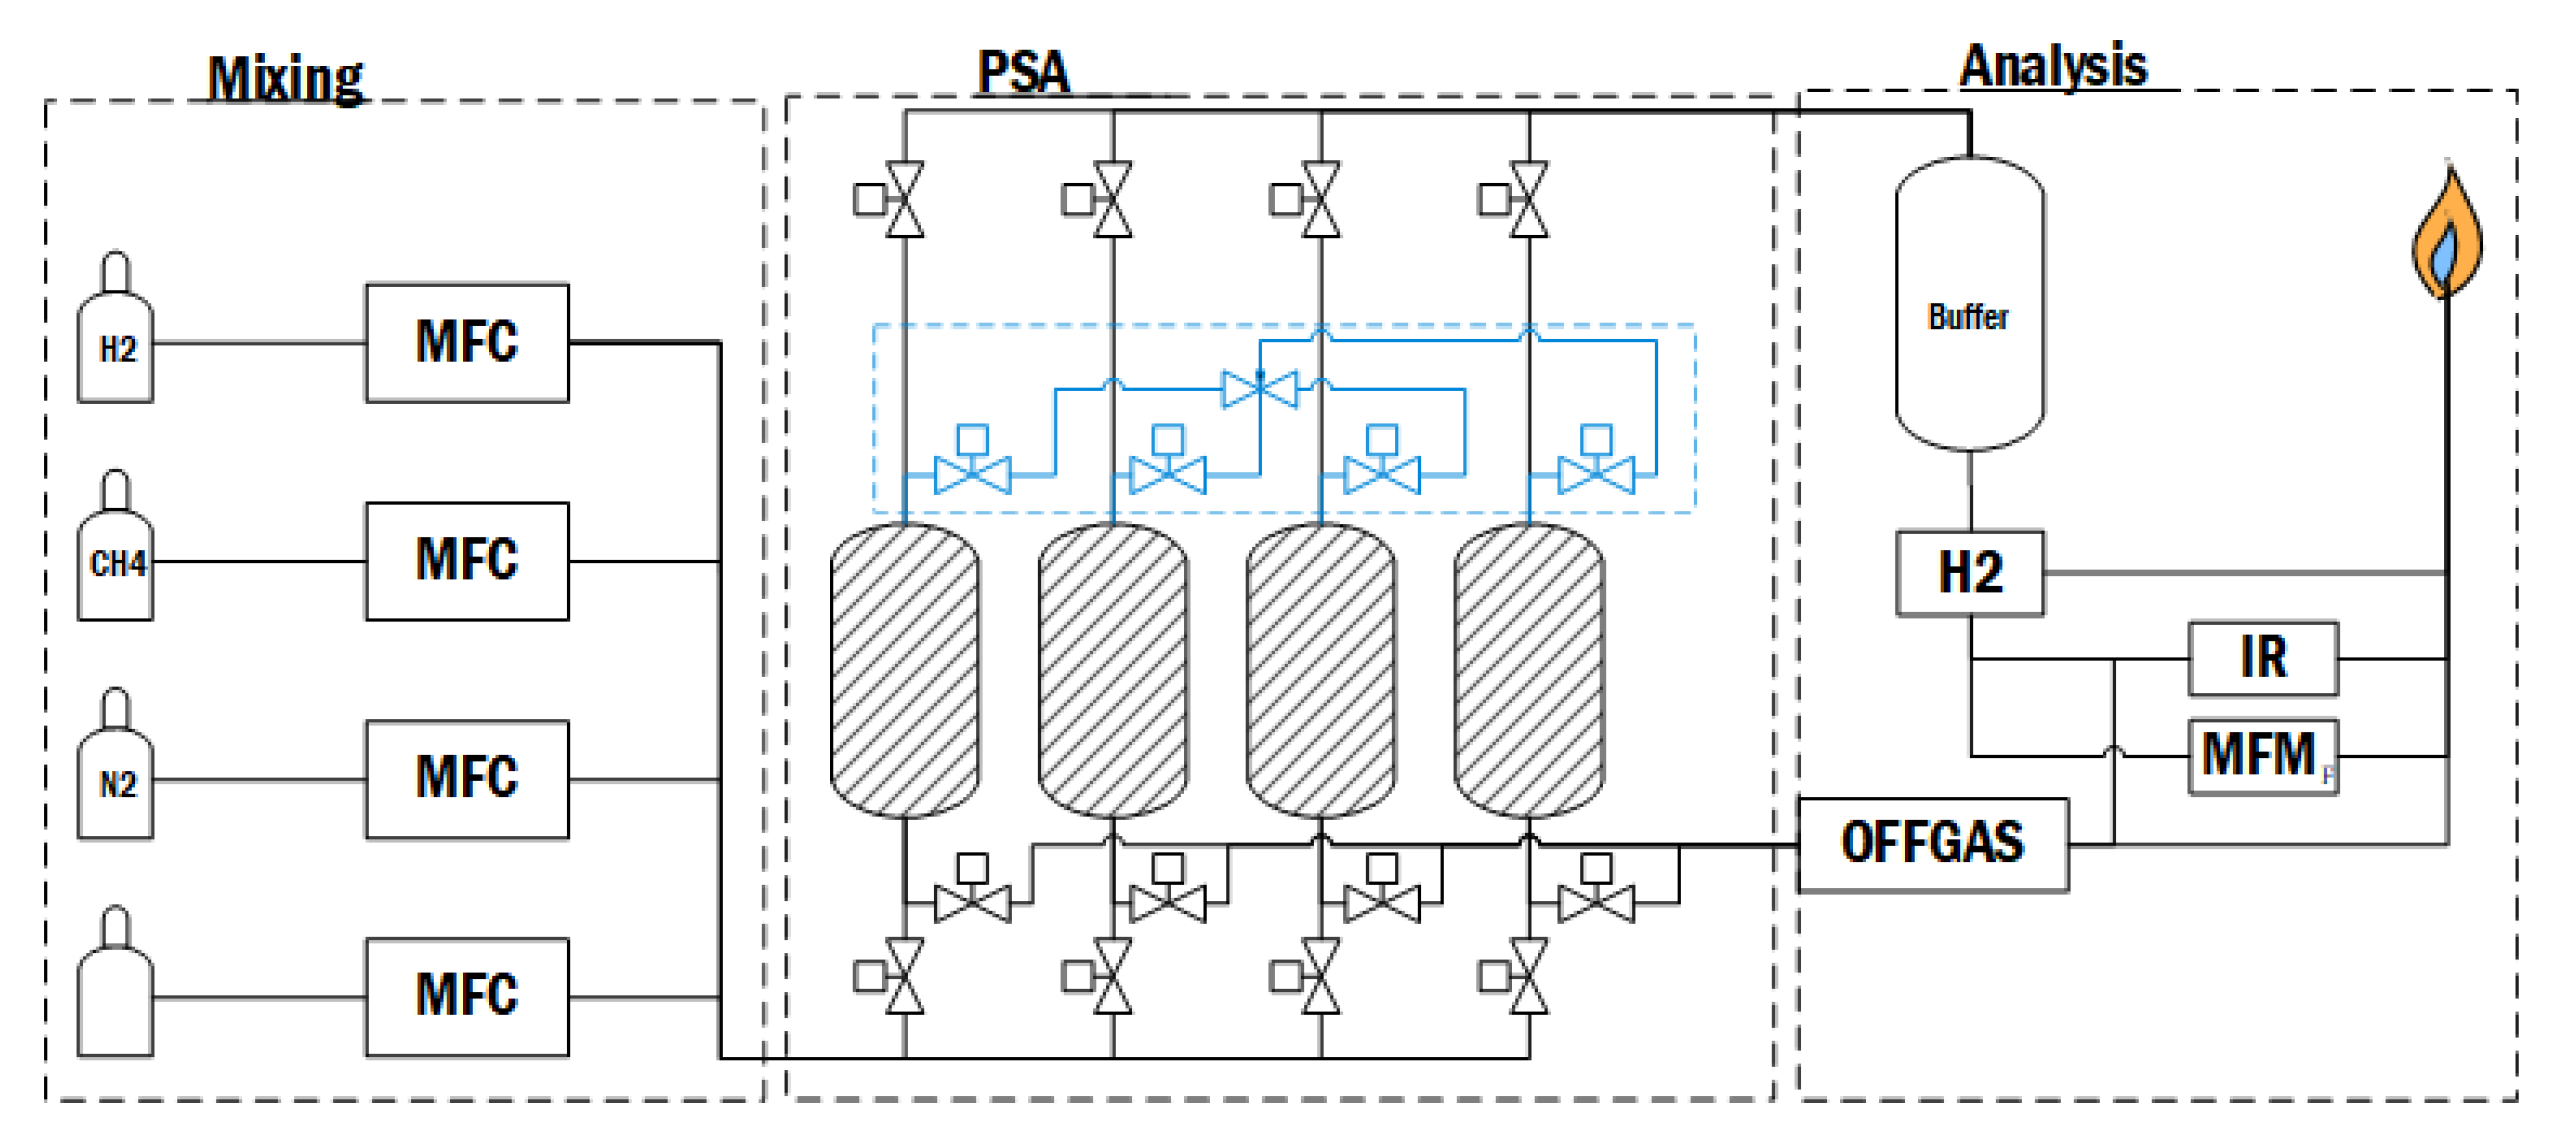
A laboratory-scale pressure swing adsorption unit with 4 (+1) beds was built for this purpose. Four beds were filled with Desorex 33C activated carbon, a 3 mm diameter cylindrical, commercial adsorbent from coconut shells, provided by DonauChem. The fifth column serves as a reserve to protect the analysis equipment from the pressure of flow surges. The unit has three main components, illustrated in Figure 4. A detailed P&ID of the experimental setup is available on request, but the description of the build, components used and testing are out of the scope of this work, rather an overview is provided:
  • The mixing station includes the gas cylinders inside a ventilated cabinet, the feed lines and a set of mass flow controllers (MFCs). Here, the gas mixture can be tailored to the experiment. Hydrogen and methane were used, and nitrogen was connected on the third line for flushing and inertization of the system.
  • The pressure swing adsorption unit consists of four carbon-filled pressure vessels, each with a set of valves for feed, offgas and product. All columns are connected to the crossflow panel for the interconnection of adsorbers in the depressurization, purging and pressurization steps. The central point of this panel is the manual needle valve, which allows for gradual pressure equalization. Each adsorber is equipped with a pressure sensor, filter and safety valves. This subunit of the system was scaled up to a pilot-sized plant, the correlation and scaling property being interstitial velocity.
  • The analysis section starts with an empty adsorber column on the product line, which serves as a buffer to protect the sensitive equipment from surges of flow or pressure. The product and offgas lines are equipped with pressure sensors and PID-controlled control valves to limit the flowrate. Then, both lines are routed to the flare under a closed fume hood to neutralize dangerous gases on atmospheric pressures. There are three routes for the gases to take to the flare: direct route, through the mass flow meter or the gas analyzer unit with gas sensors. An infrared sensor measures the methane, and the hydrogen is measured through temperature conductive capacity in the same unit.

2.1. Experimental Work

Numerous experiments were conducted for each stage while modifying the most important parameters. A complete list is shown in Table 3. Experiments with the most stable pressure and flow control and lowest methane appearance in the product stream were selected as the best runs. These are highlighted in the table and evaluated in the next section.
Feed composition and adsorption pressure are linked to the stages defined previously. The cycle times and purge-to-feed ratios were varied slightly; meanwhile, the step times were changed and modified significantly. The step sequence is listed in Table 4. This work focuses on the applicability of PSA for hydrogen purification with transient feed conditions from underground storage; the detailed steps of process design are not provided.

2.2. Product Purity

The purity of the product hydrogen is a crucial parameter when describing the quality of the purification process. Many applications, especially recently built or upgraded gas powerplants and residential appliances, are prepared to operate with blends (natural gas–hydrogen mixtures). On the other hand, many applications require high-purity hydrogen, most notably fuel cells. International standards from 2019 and 2020 (ISO 14687:2019, SAE J2719-202003) regulate the concentration of 14 impurities specifically, not just the mole fraction of the hydrogen product. These limits are listed in Table 5 [32].
There are several methods to assess purity, depending on what data are available. In this work, the momentary molar fraction is equated to purity. The same definition is used throughout literature, and it is calculated through the following equation [33]:
P H 2 = C P , H 2 Q P , H 2 j = 0 n C P , j Q P , j ,
where C is the volume fraction and Q is the volume flow of hydrogen in the numerator and all components, noted as j, in the denominator. The subscript P notes the product side of the columns.

2.3. Hydrogen Recovery

The recovery factor of hydrogen is a critical parameter in gas separation. In this process, the absolute quantity of recovered hydrogen can be converted into energy. This energy has to be greater than the energy put in the storage and withdrawal to make it economically feasible for seasonal balancing. It is not worth operating a plant that requires net energy input. On the other hand, as long as the net energy is positive, the recovery factor does not matter because the energy used for the production, compression and storage was surplus renewable energy. We estimated that a recovery factor of 0.8 should result in net energy positive and set as a target in long-term operations. The recovery factor in this study is only based on material balancing, which is not an accurate form of definition. However, it gives an indication and allows the comparison of different stages.
R H 2 = C P , H 2 Q P , H 2 d t C F , H 2 Q F , H 2 ,
where C is the volume fraction and Q is the volume flow of hydrogen. The subscript P notes the product side of the columns and subscript F the feed values.

3. Results

3.1. Stage One

At the start of the withdrawal, the pressure is the highest, while the methane concentration is the lowest. This combination of properties results in long breakthrough times because a high bed capacity is paired with a low influx of adsorptive gases. It is less of a challenge to reach the target values for the purity and recovery at this stage because the columns are oversized, and the breakthrough of contaminants can be easily avoided. The main challenge is to recover as much pressure as possible without damaging the equipment or adsorbent. In the pressure equalization and purge steps, the pressure difference between the columns is high, which can cause a choked flow that could displace the adsorbents or the rapid depressurization of a bed could lead to the cracking of pores as high amounts of methane desorb from the activated carbon.
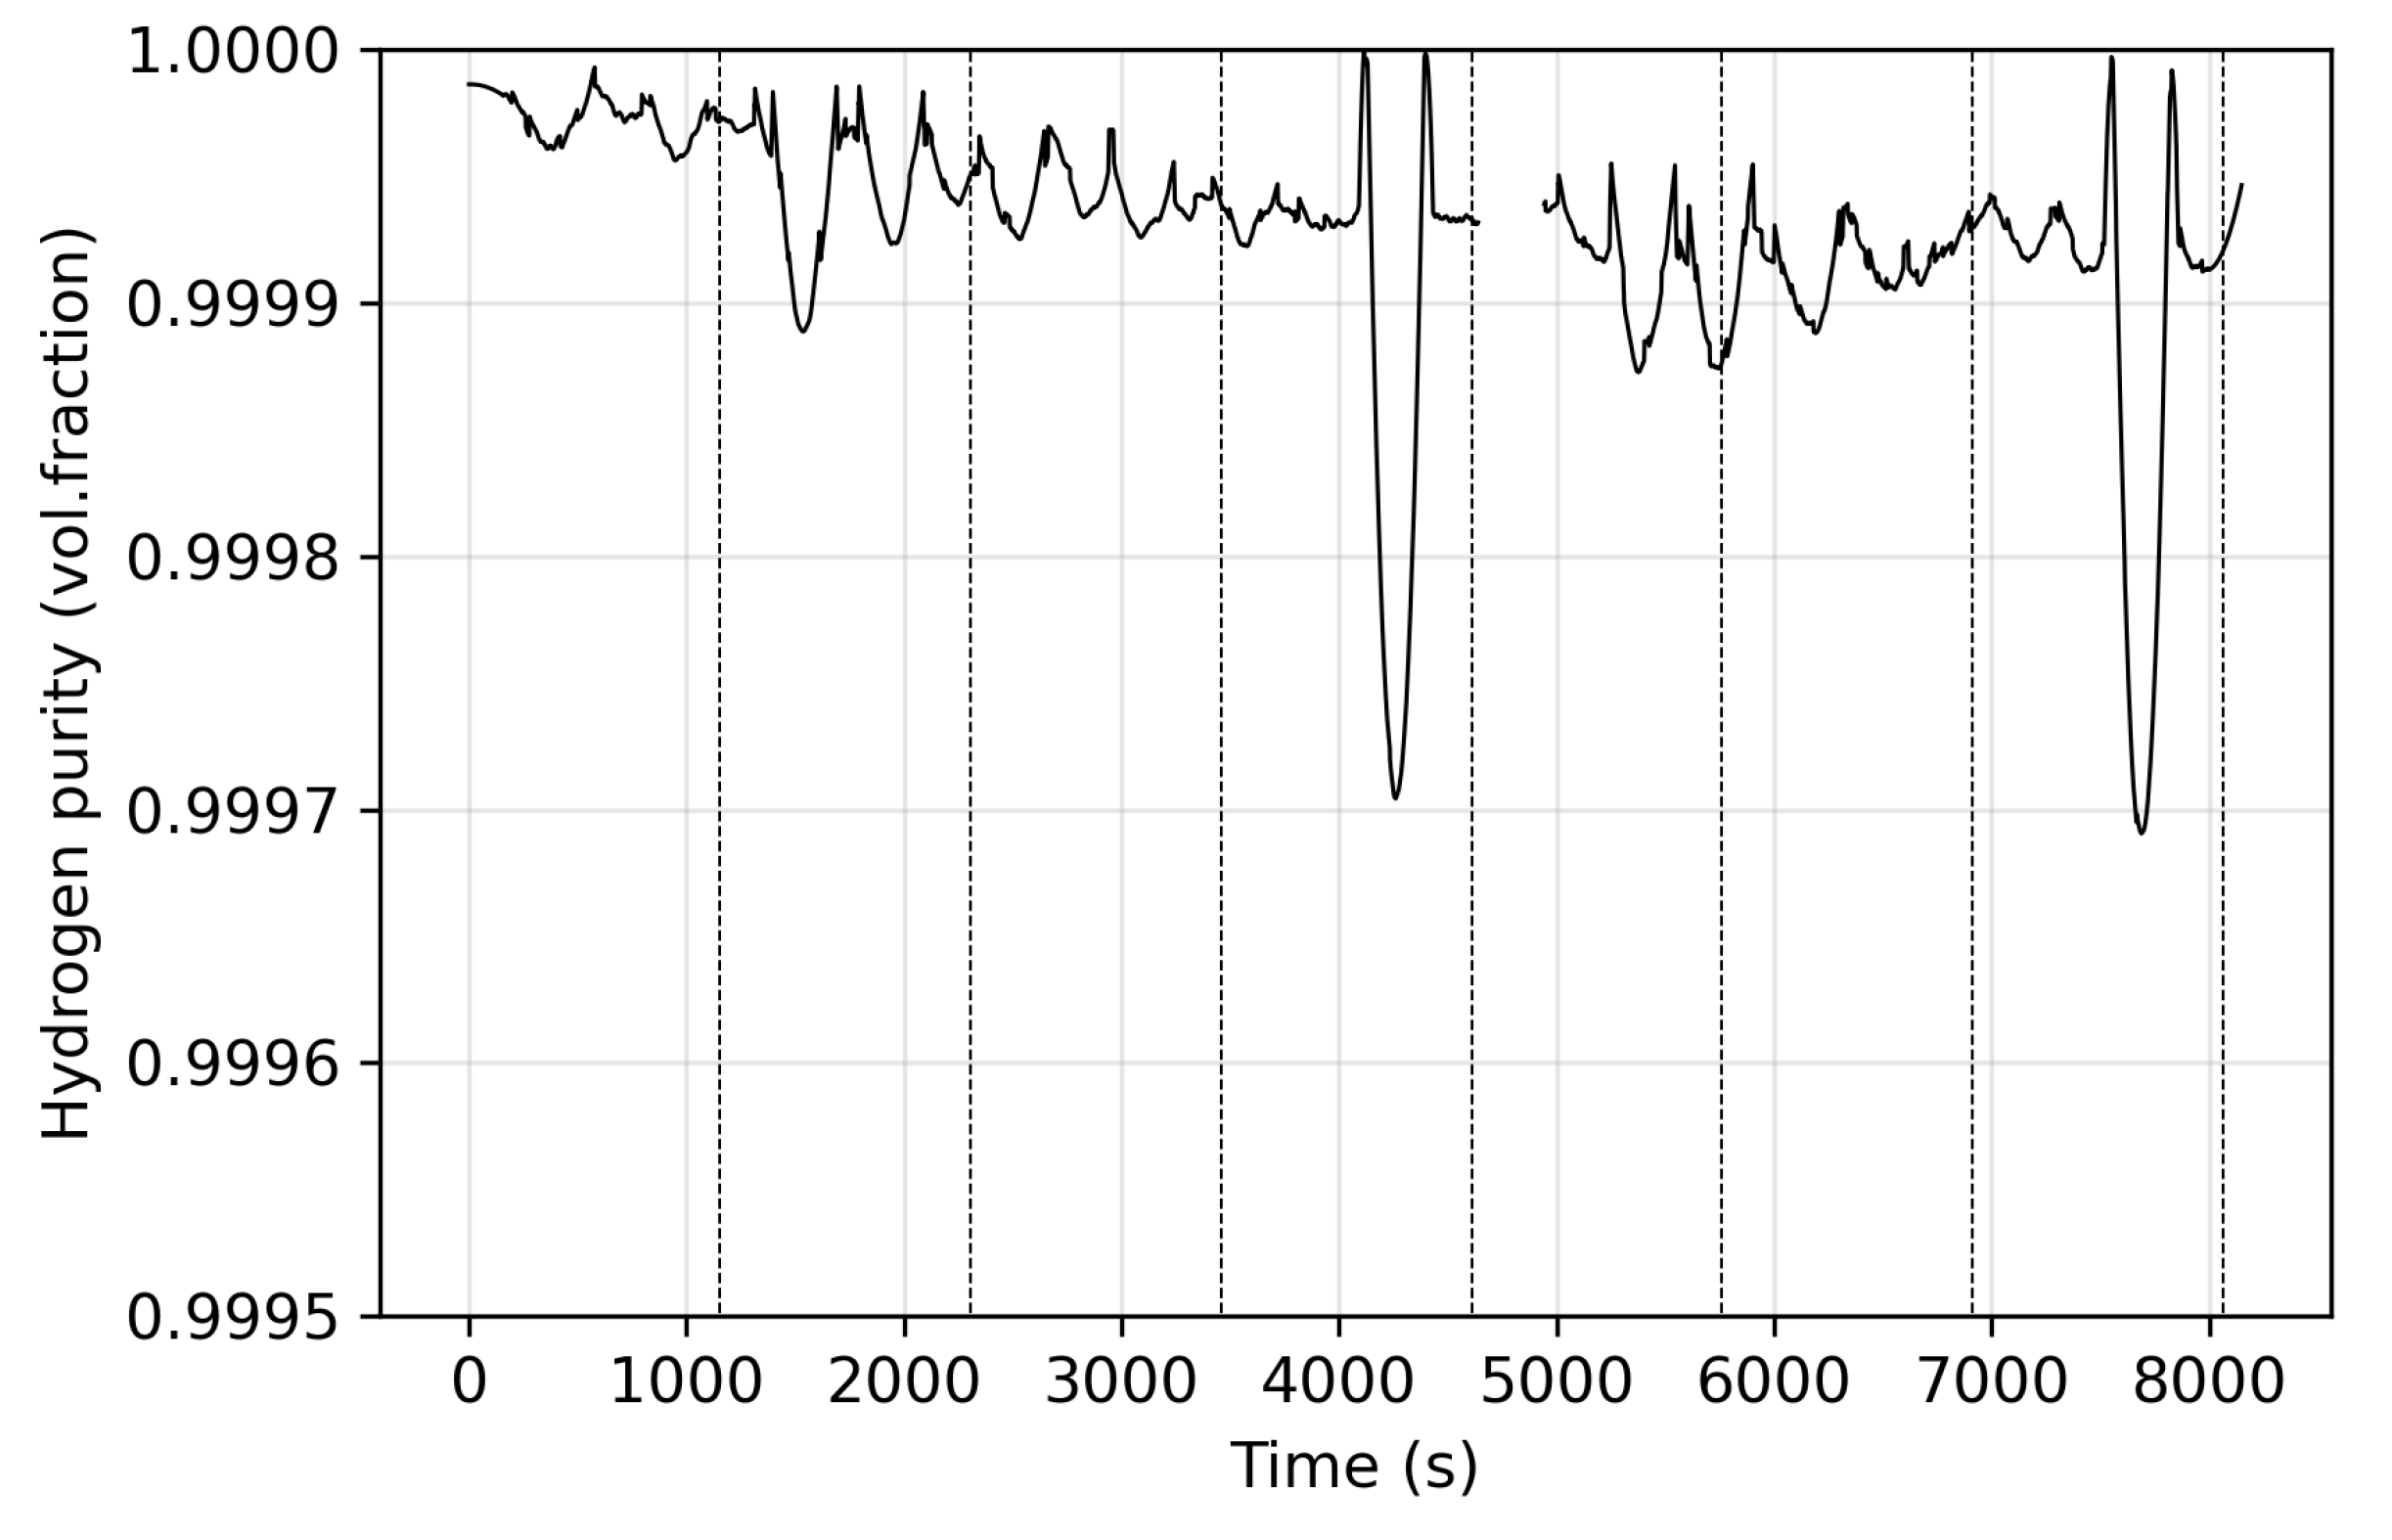
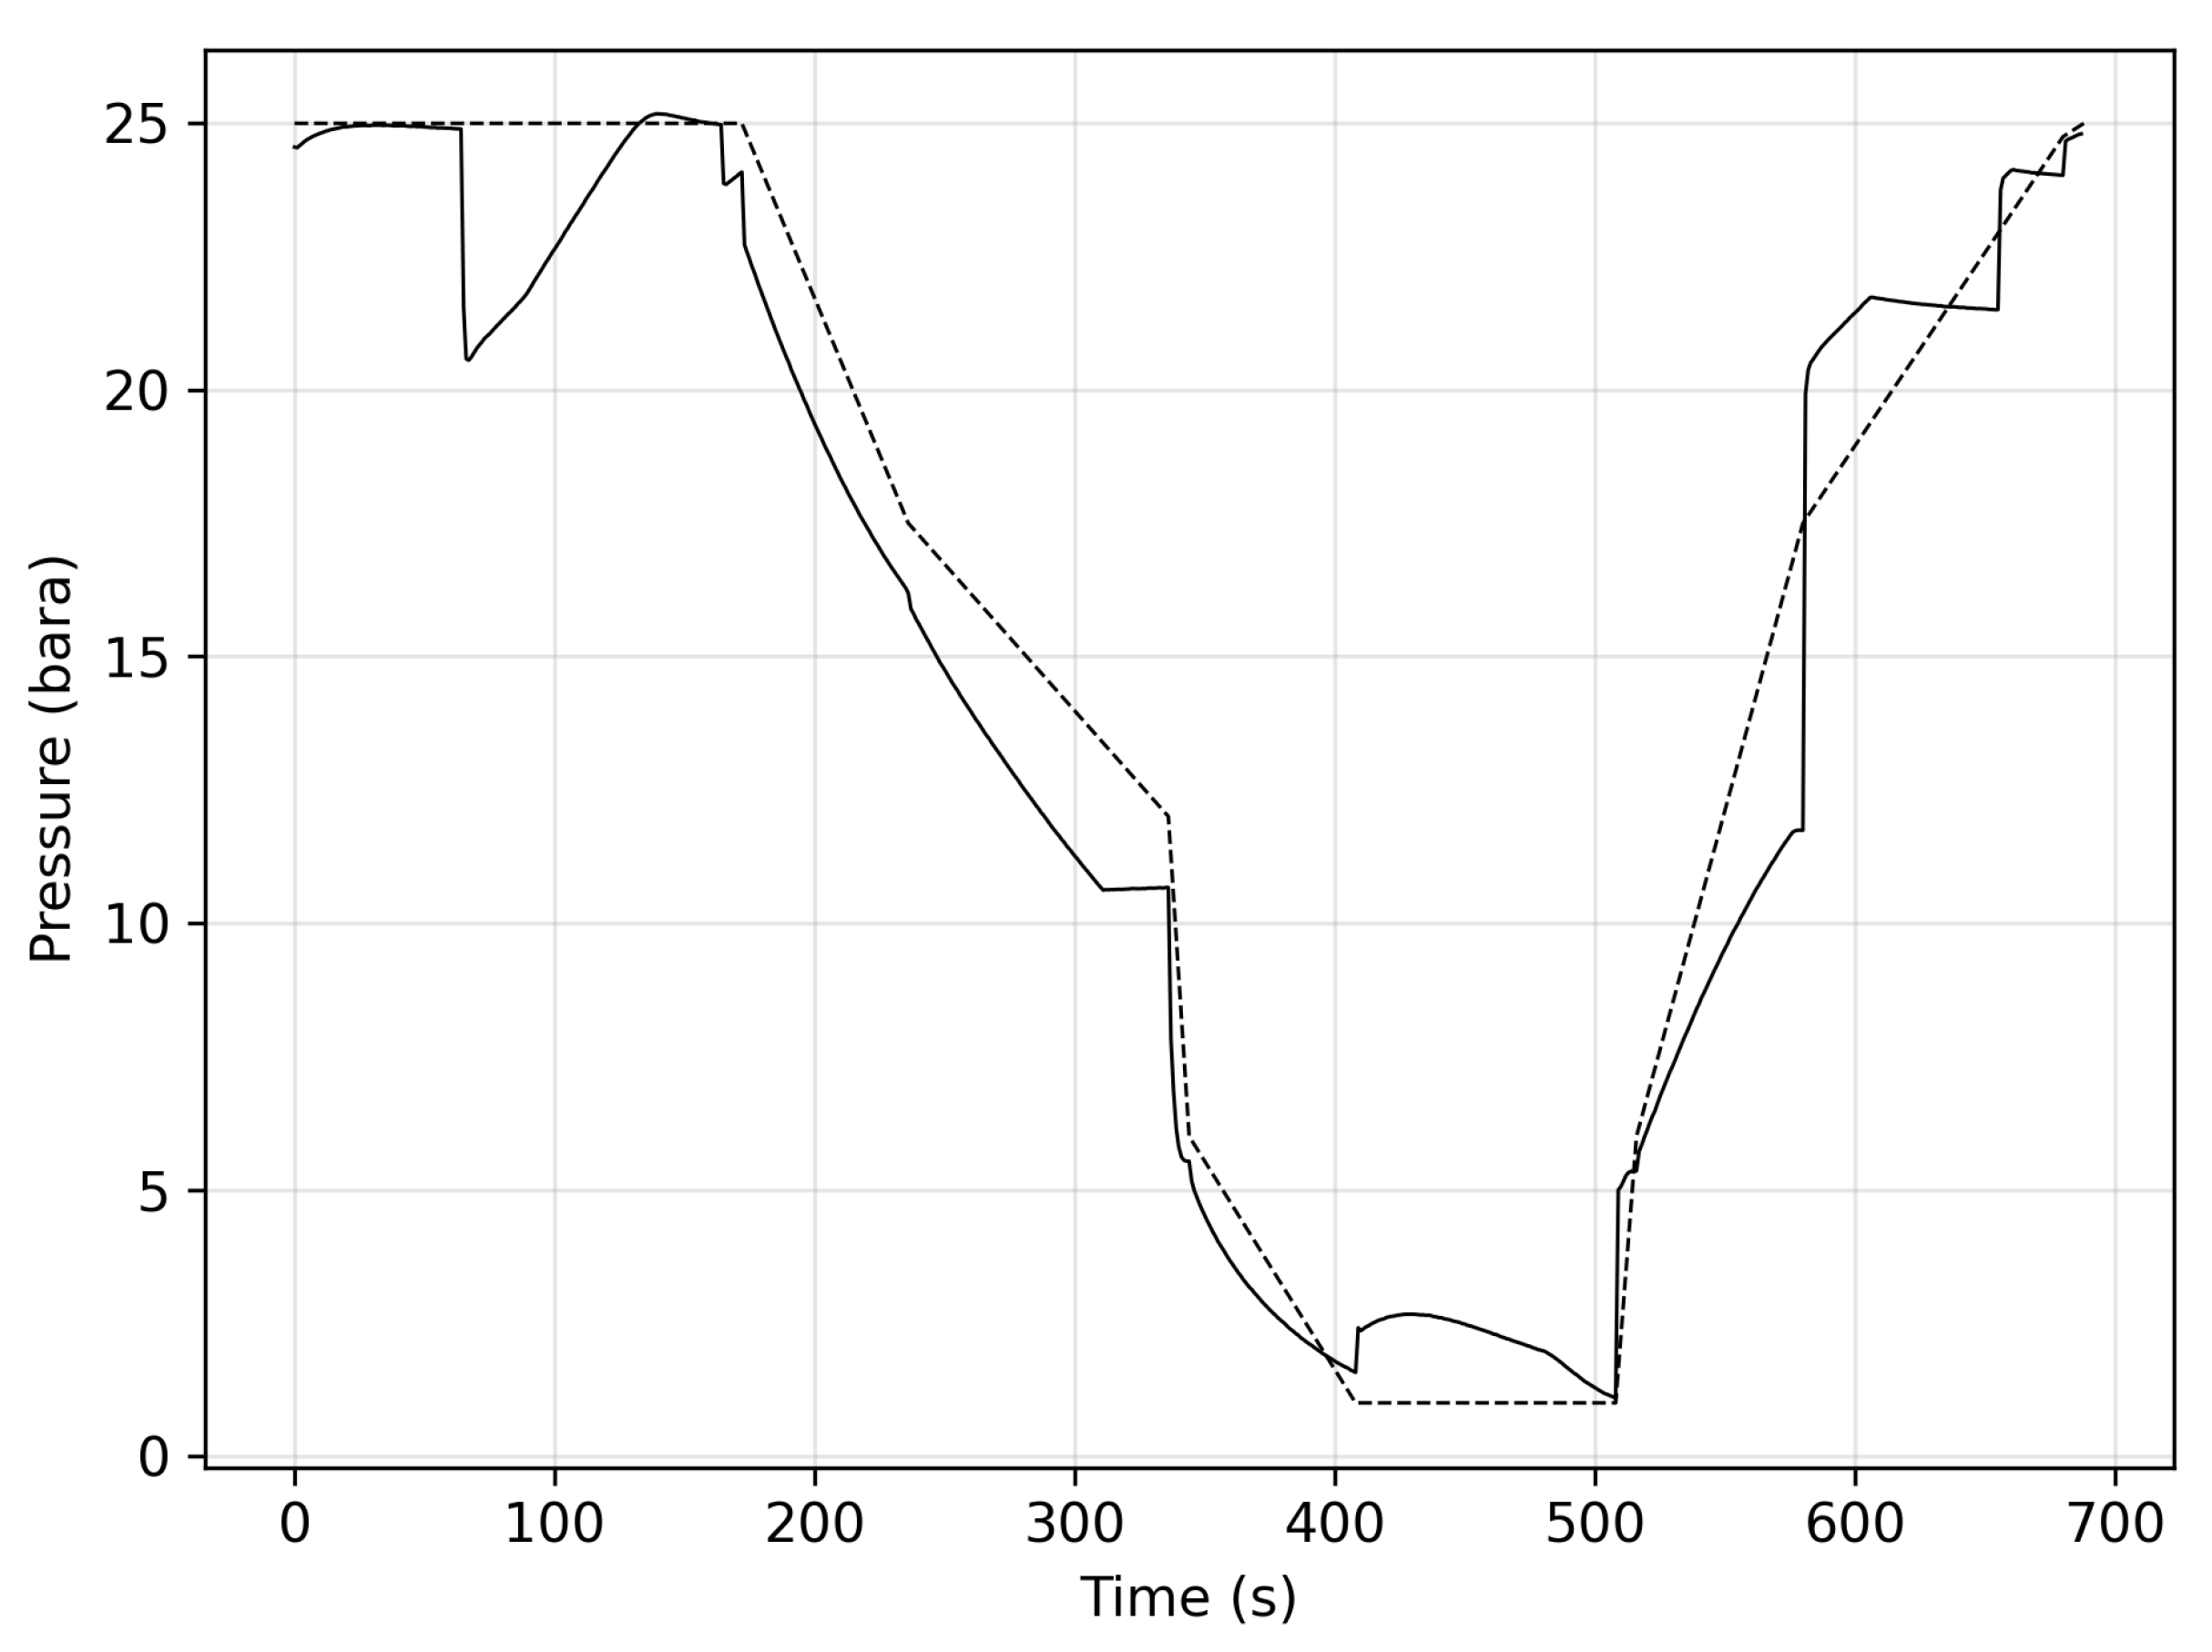
The first evaluation of the process quality is performed by analyzing the pressure profile of experiment Run#13, which can be seen in Figure 5. The adsorption pressure is kept constant through most of the step. There is a significant pressure drop in the adsorbing column when the product pressurizes another adsorber. This causes methane to desorb and move further up in the column where it readsorbs. Then, the recovered pressure increases the capacity again, resulting in a wider mass transfer zone. In our system, the pressurization by-product is conducted through the same valves as the crossflow pressurization. This behavior can be easily avoided if the two columns are not directly connected, but a separate line is used for the pressurization. Continuing forward, the transition to the downward pressure equalization (at 580 s) is not smooth, but a small instant pressure drop followed by a rapid recovery can be seen. This might be caused by having a tube section between the two closed valves where the low-pressure gas was cut off previously. The first pressure equalization ends at 830 s, where a nice and smooth transition to providing purge gas can be seen; switching from one receiving adsorber to another is performed without issue. By the end of the provide purge step, the adsorber reaches the ideal 20 bar. The pressure reduction is not linear but very close, showing a good process design and manual needle valve setting. The next step is the second pressure equalization, a short and quick gas release down to 11 bar, where the blowdown starts. The blowdown at 1160 s starts at 11 bar as per the design, but the pressure in the adsorber reaches the atmospheric pressure before the design point. In principle, the column is idle for the most part, but processes on other columns necessitate the length of the step. Furthermore, the desorption of gas molecules is not instantaneous, so desorption is ongoing at this “idle” stage. Next, at 1410 s, the purging of the column starts. The pressure surges momentarily as the interconnection to a 36-bar column is opened. Another pressure increase can be seen at the end of the purging when the offgas valve is closed and the inlet flow is still high. Next, the pressure-increasing steps start. The first rapid equalization step does not increase the pressure to the target 11 bar, only 9.6 bar, 13% below the target. This pressure loss can be inherent to the piping and valves. The following long equalization starts ideally linear and flattens as it reaches equilibrium with the other adsorber. The last step is the pressurization by-product from 1990 s to the end of the cycle. Here, the deviation from the ideal is significant as the pressure skyrockets first, then the increase stops for a moment and reaches the targeted pressure stepwise. The initial rapid (almost instantaneous) increase causes the pressure drop on another adsorber in the adsorption step. The pressure increase stops because the PLC controller tries to recover the pressure in the adsorbing column. This behavior is detrimental to the process quality because, as mentioned before, it widens the mass transfer zone in the adsorption. From 2100 to 2310 s, a pure high-pressure product is wasted through the interconnection lines, reducing the recovery factor. Using a separate line or employing control valves on the product side would prevent this pressure surge, eliminating this issue.
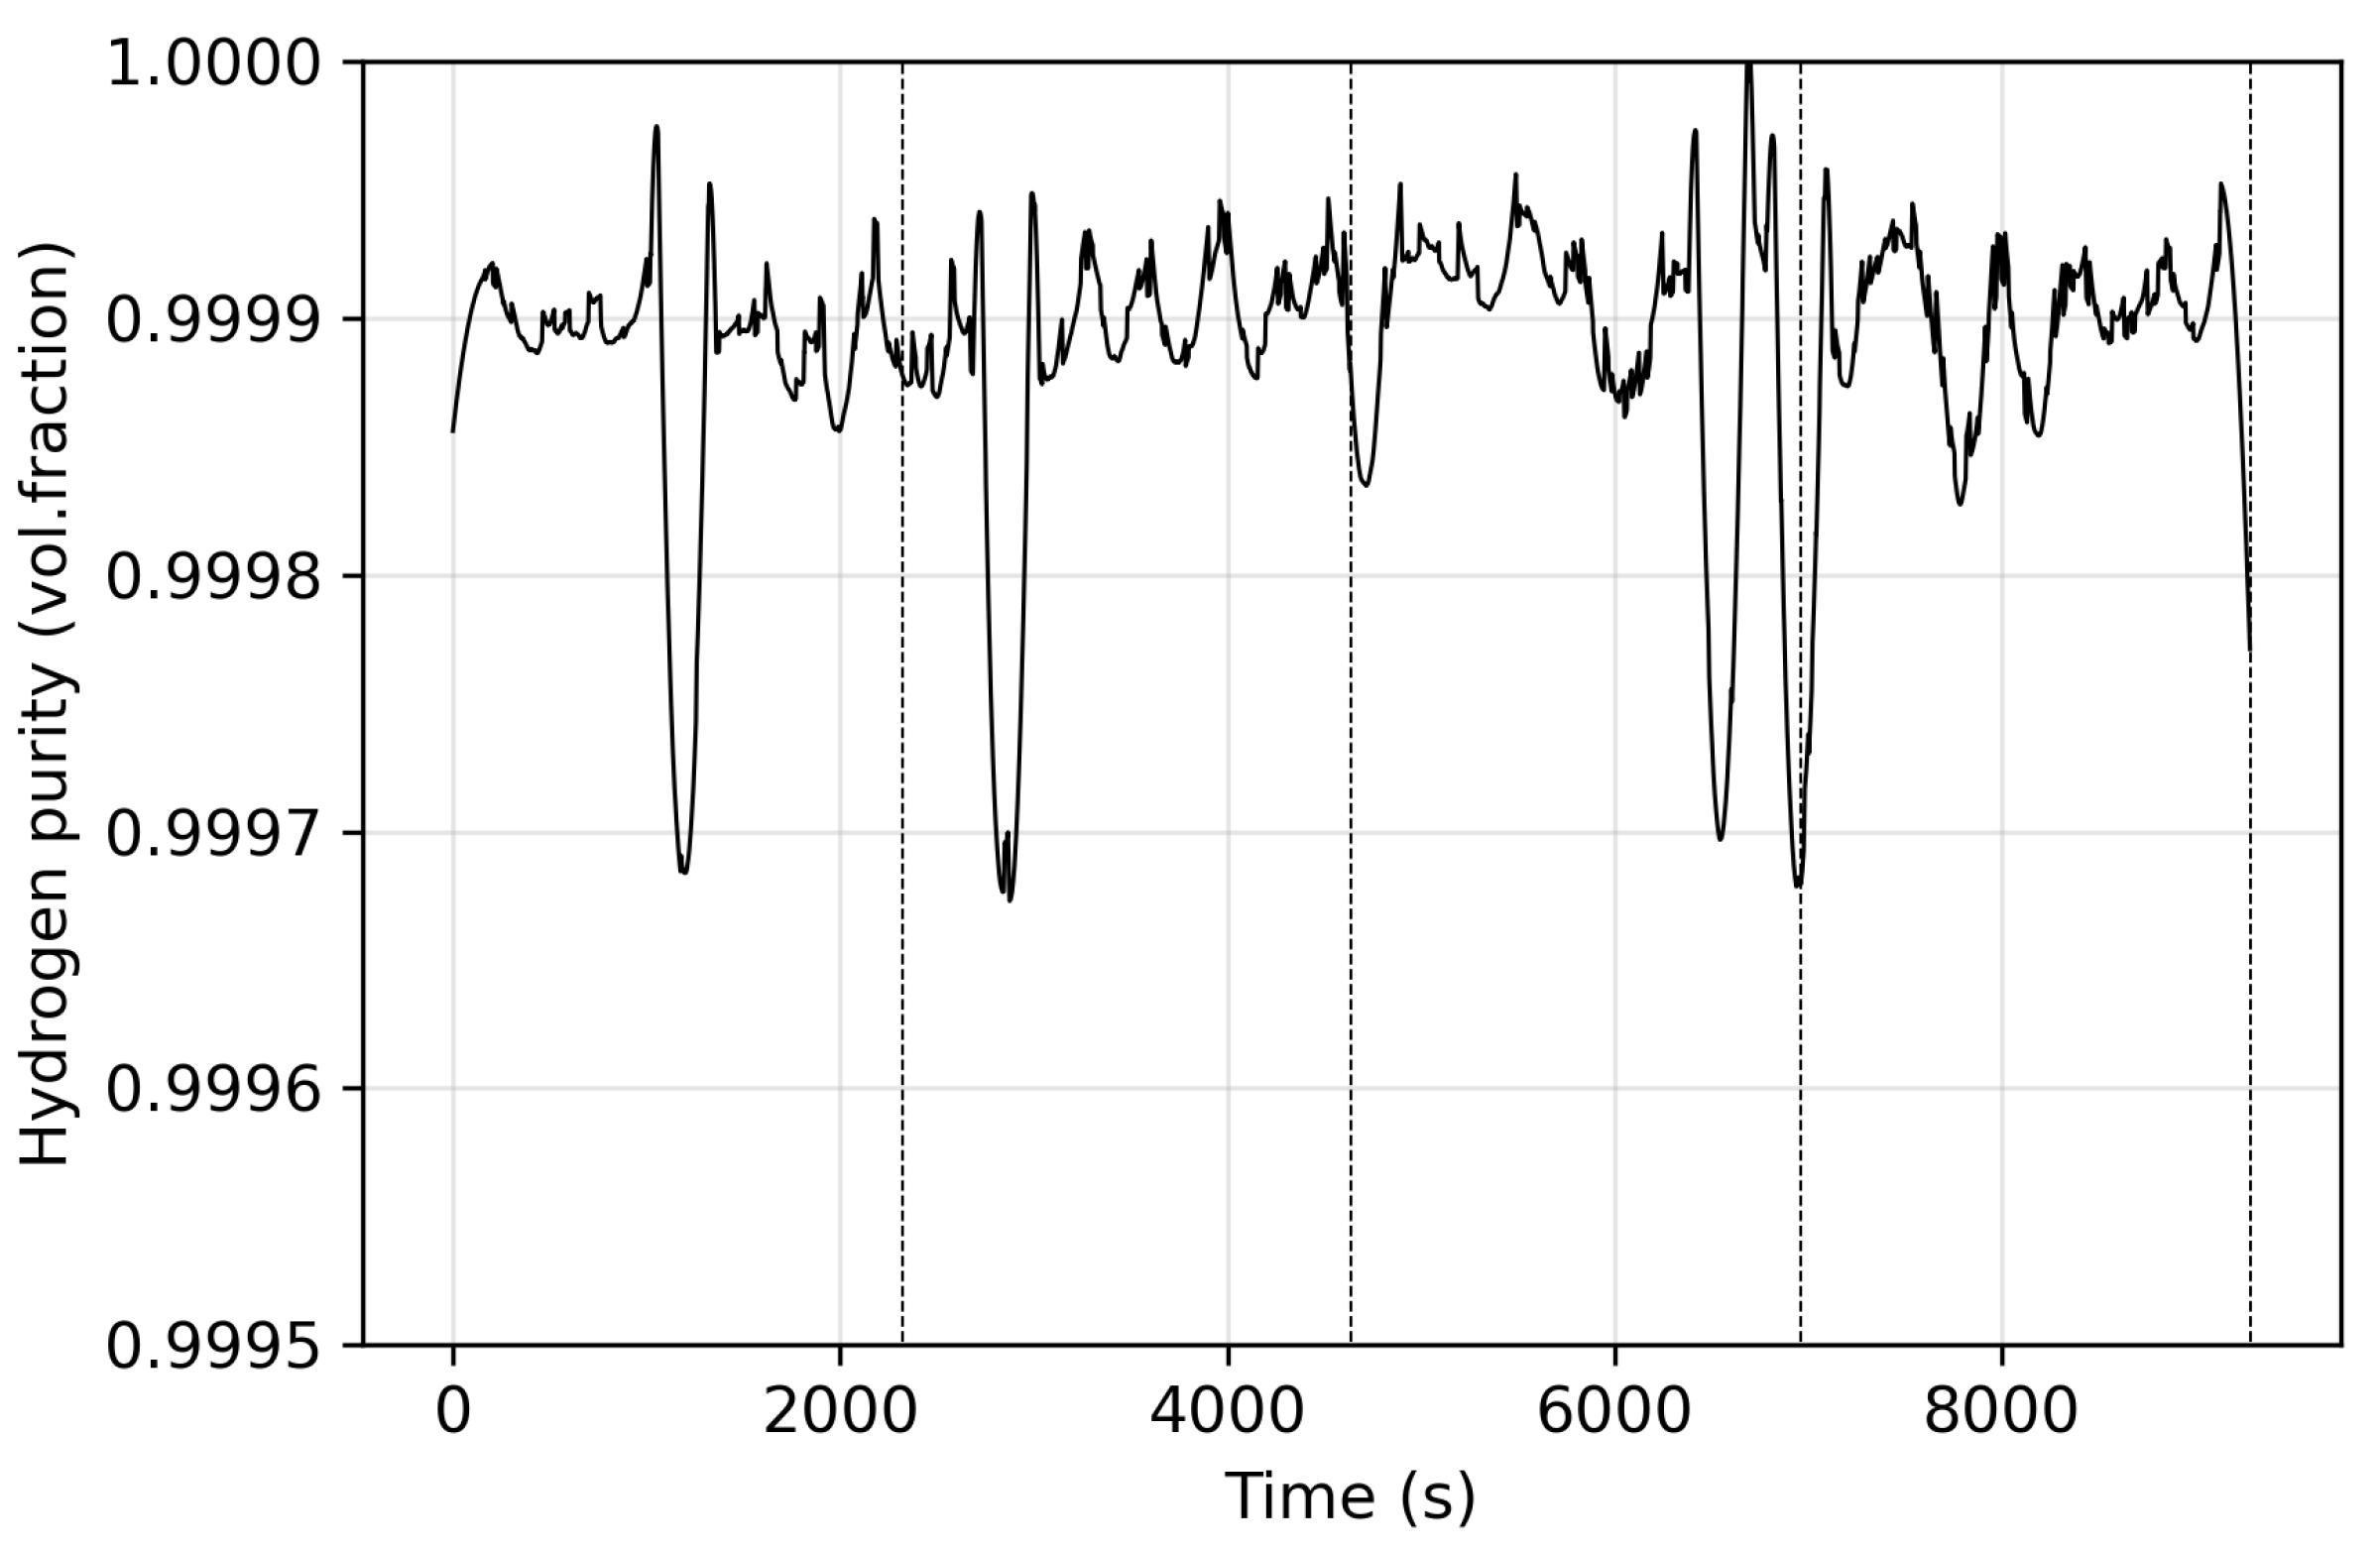
The purity of the product stream is calculated by Equation (1), which uses a material balance. The product line has three flowrate measurements, each on a separate stream, as shown in Figure 4: the methane IR, flowrate meter and straight to flame. These need to be summarized to obtain an accurate calculation. This way, the result is not analytically accurate. A flowmeter after the columns and a sampling line with analytical accuracy would be needed. Still, the results can show major breakthrough events or indicate intercycle trends. The purity values of the stage one experiment in Figure 6 are filtered by the Savitzky–Golay method. The results show that the product purity is consistently 99.99% with four outlying events. As the measurement accuracy and calculation method are not analytical, these dips cannot be accounted for a single reason with confidence. The consistency indicates a good desorption/purging performance and a clean bed at the start of the adsorption step, which is crucial for a long-term operation.

3.2. Stage Two

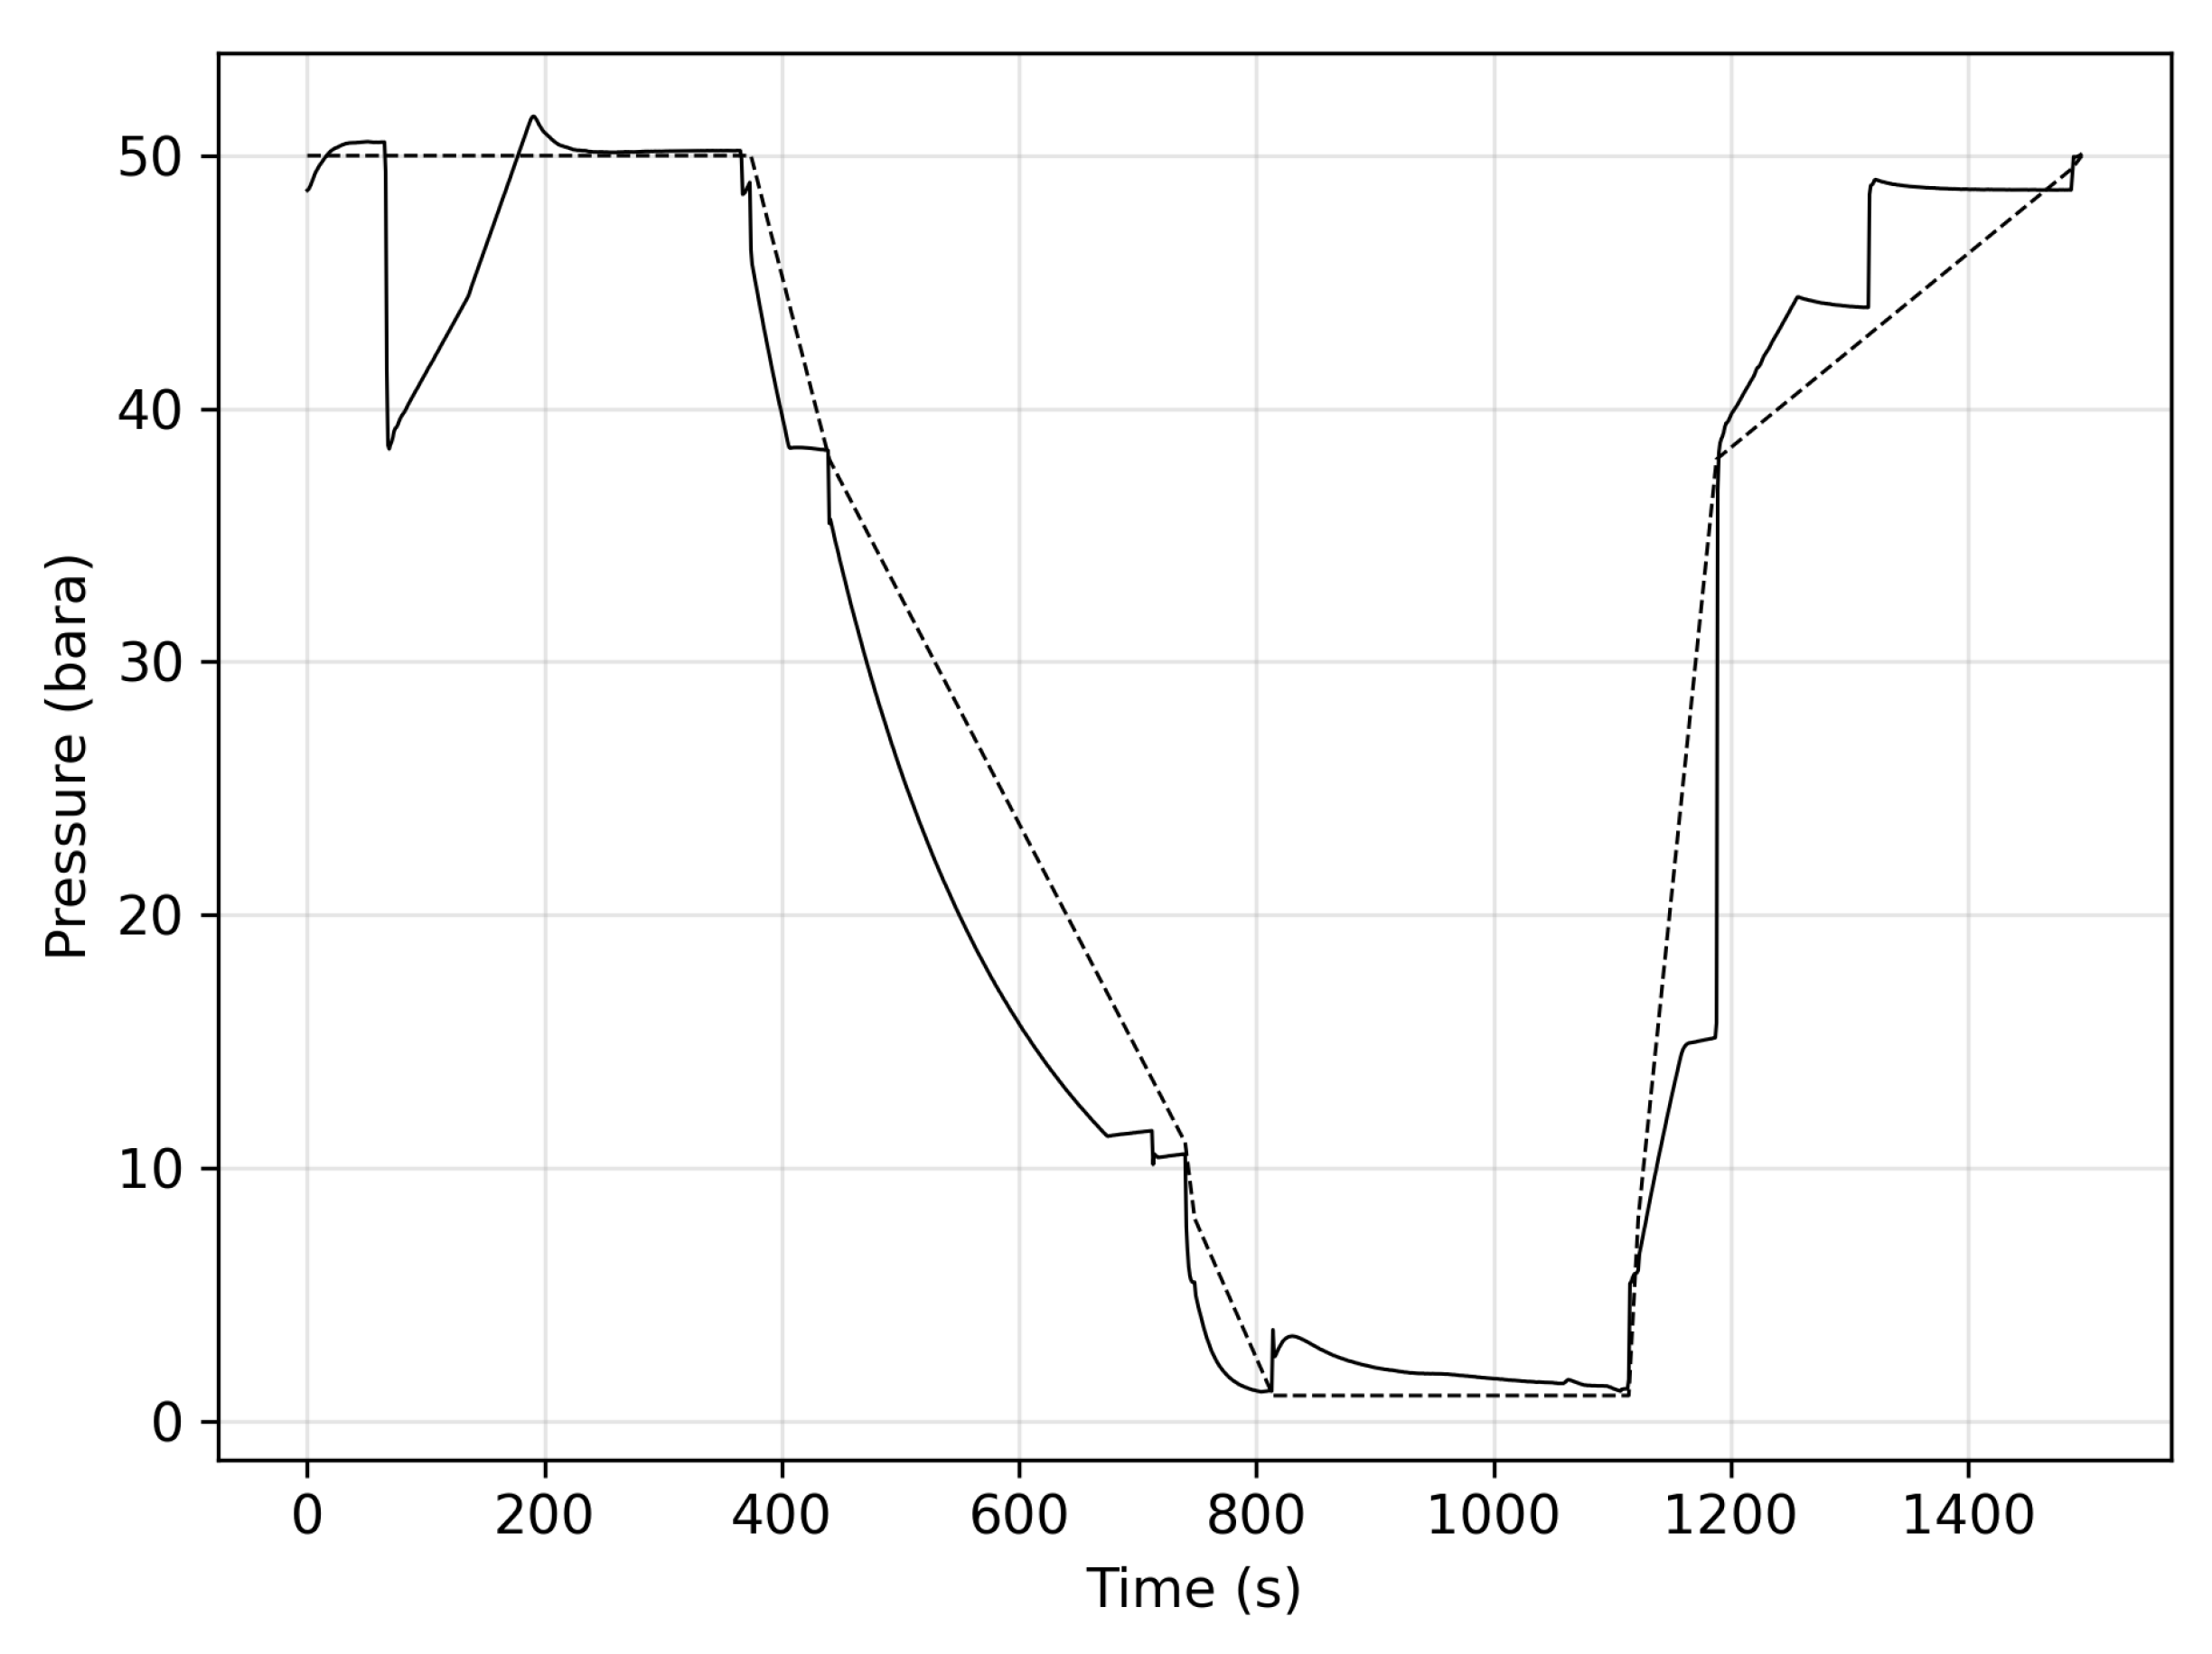
Stage two of the withdrawal is still high pressure and high bed capacity, but the methane content of the feed is not trace values anymore but a more significant 10%. Here, the high-velocity flows between the interconnected beds and rapid depressurization have to be controlled, similarly to stage one. On top of that, the management of methane not breaking through is an added complexity. Looking at the pressure profile of experiment Run#07 in Figure 7, it is seen that some key markers are hit but not all, and it diverges far from the ideal pressure profile. The adsorption step has a deep dip down to 38.4 bar. That is 23.2% below the nominal adsorption pressure, and recovery takes 185 s (49% of the adsorption step). This causes a significant widening of the mass transfer zone, consequently diminishing the quality of the process. The pressure decreases from 50 to 8 bar in the pressure equalization and the provide purge steps are much faster than the nominal, indicating a wrong needle valve setting. This could cause the transfer of methane molecules to the clean beds because a pressure transfer is not performed, but the methane desorption is continuous in the post-working bed. The blowdown from 8 to 1 bar is not linear, but it takes effect under the target time. The nonlinearity is expected as the pressure difference reduces and using a control valve would improve the behavior. At 814 s, the purging starts with a surge of pressure as the interconnecting valve opens. The normalization is very slow and only happens by the very end of the step. This can leave a remnant of methane at the inlet of the bed, and this contamination is brought to the next cycle, reducing the bed capacity. If the bed is not fully regenerated, then at some point the methane accumulates and causes a premature breakthrough of methane in the adsorption step. The pressure-increasing equalization steps do not reach the target pressure. Ideally, at this point, the pressure is 38 bar; in reality, it is only 16 bar. This shows that either these steps were chosen too short or the needle valve setting was too open. The opening of the product valve for pressurization happens at 1188 s, and it is seen that the pressure instantaneously reaches 38 bar, but then it increases stepwise instead of smooth and continuously. This is caused by the unsuccessful equalization (low starting pressure) and by the control system switching the valve on and off as it struggles to keep the target pressure.
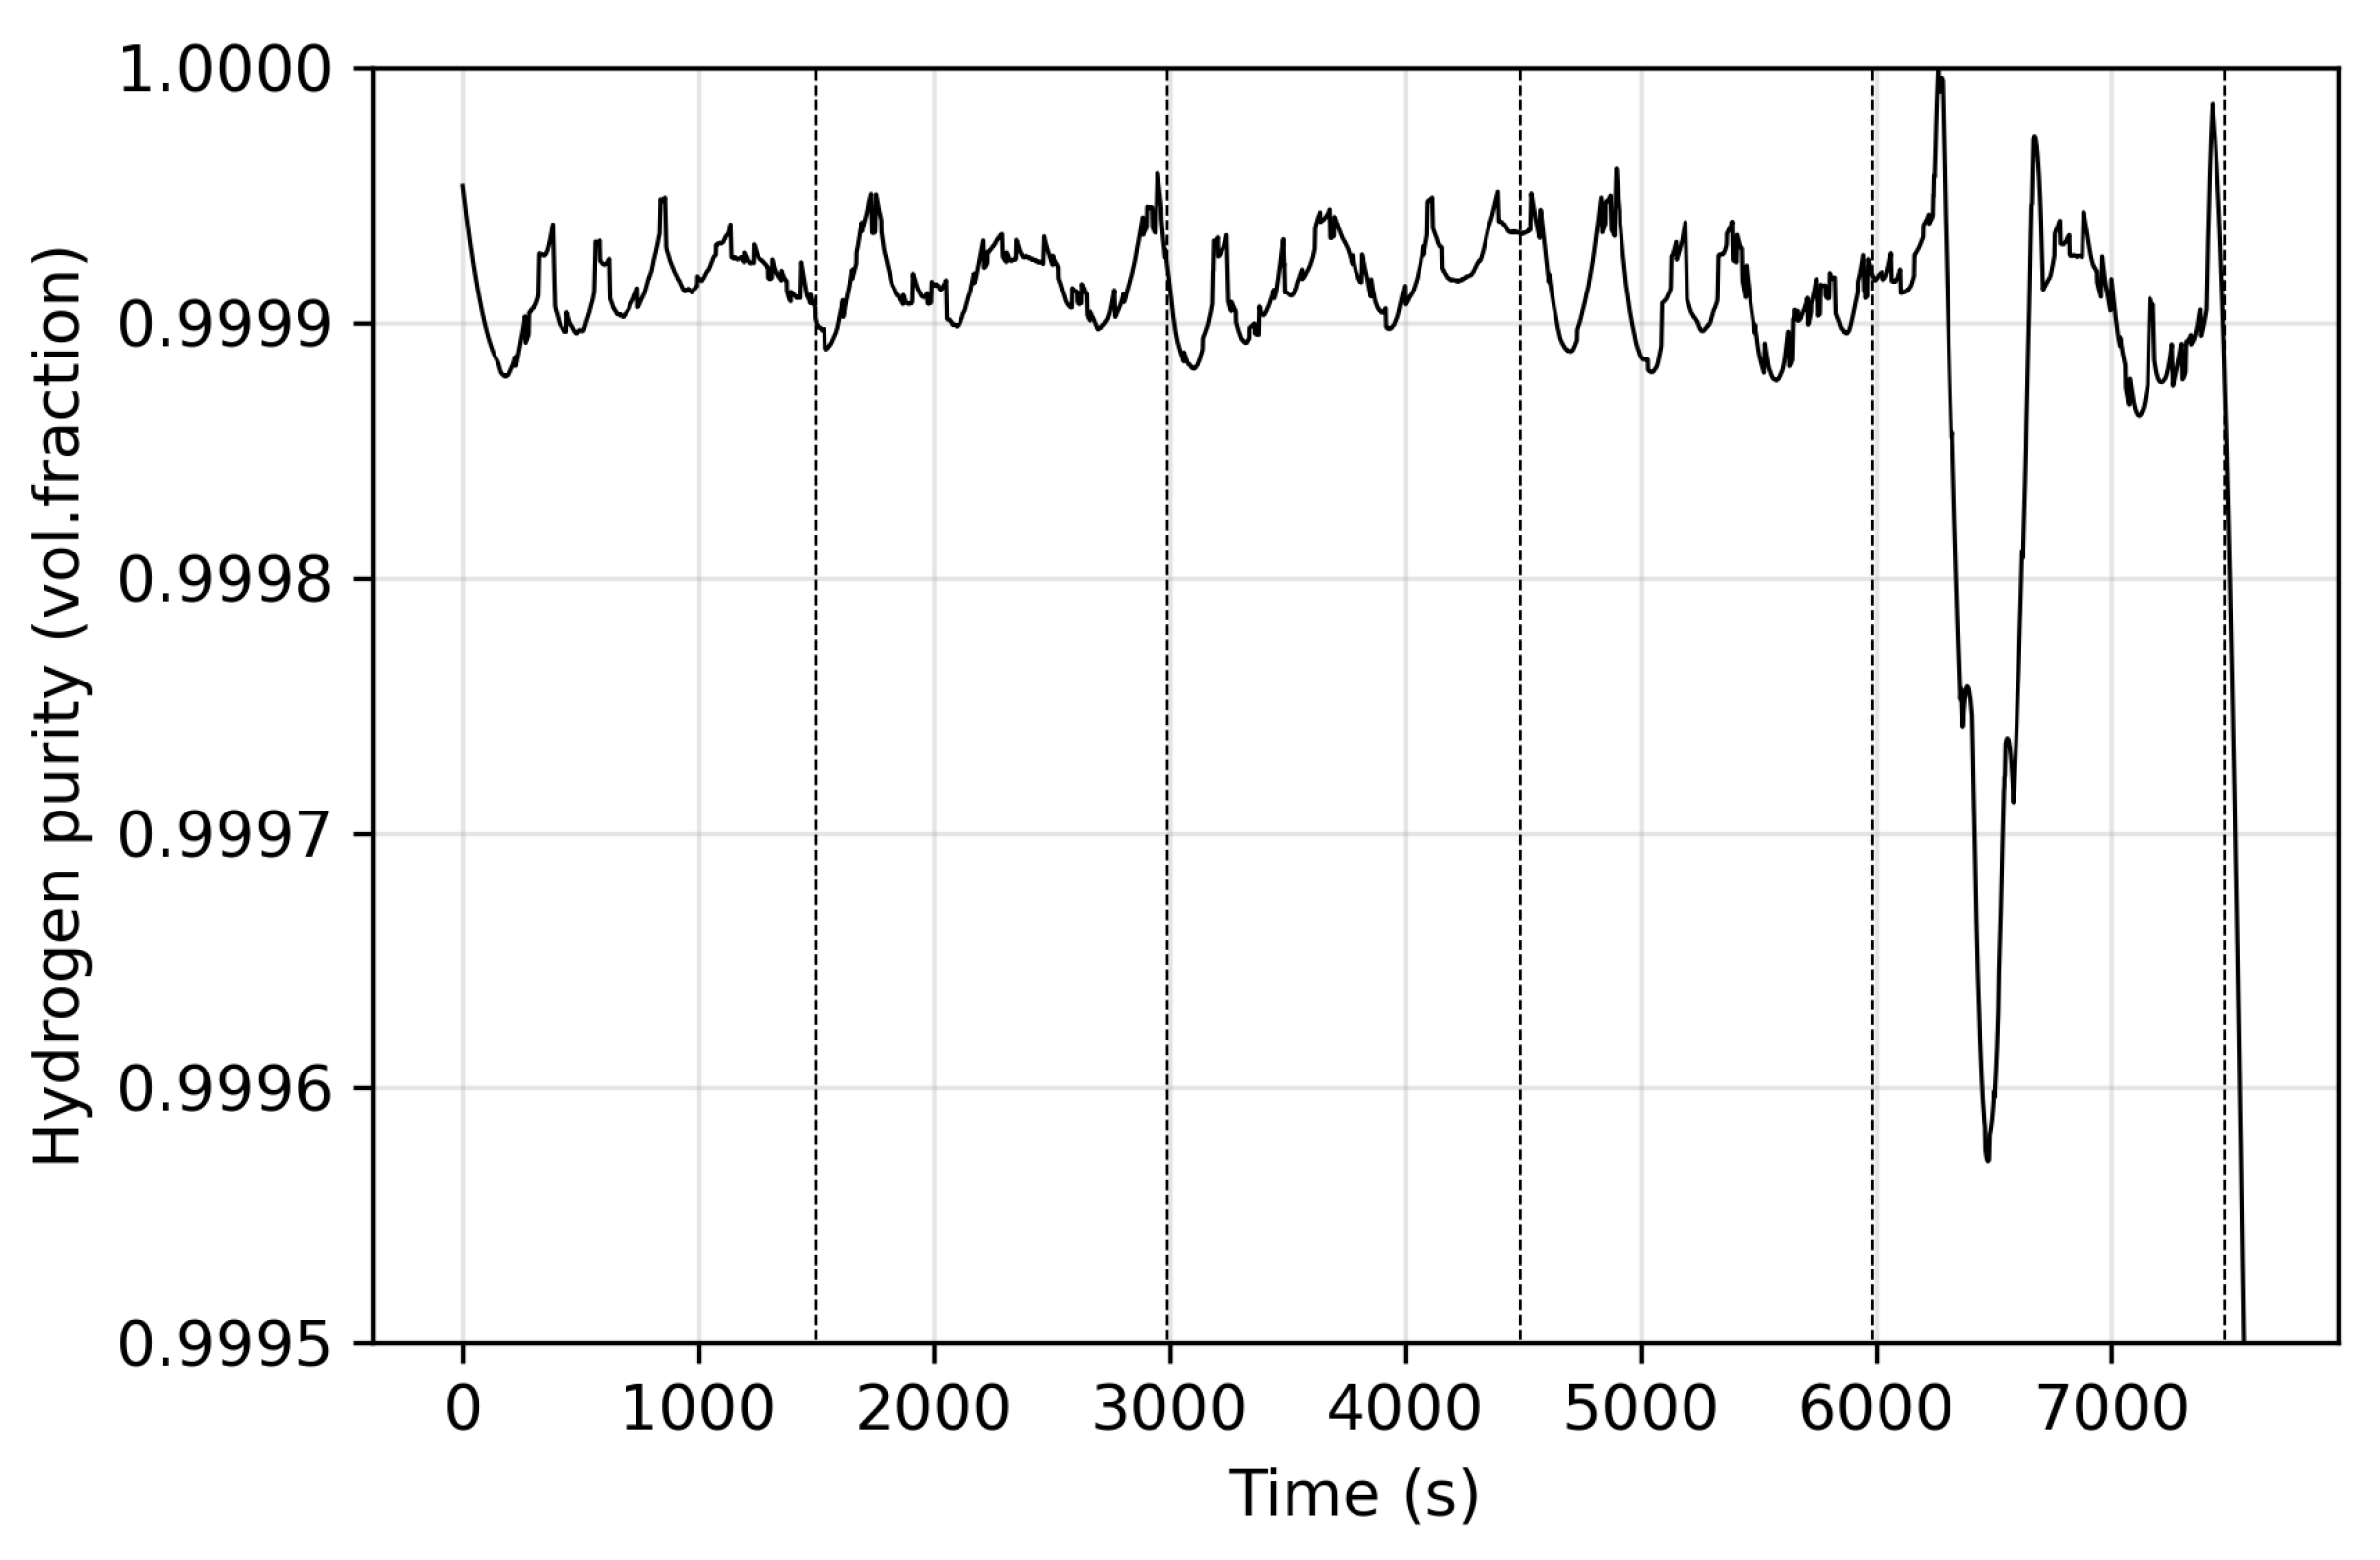
The product purity in this particular experiment is shown in Figure 8. The average value is around 99.99 %, with two major drops at the end of the experiment. The Savitzky–Golay filtering method introduces inaccuracies at the data boundaries, which exaggerates the decrease at the very end. The drops indicate the start of a process runoff, maybe even a minor methane breakthrough. This means that the cycle consistency was insufficient, and a better balance between the step times and pressure levels must be found.

3.3. Stage Three

Moderate pressures and high methane content characterize the third withdrawal stage. Here, the main challenges are the prevention of breakthroughs and the proper regeneration of the bed. This stage is the one which is closest to an industrial PSA system. We can read from the pressure profile of experiment Run#01 in Figure 9 that the issues of this process are similar or the same as in stage two in Figure 7. The drop in the adsorption stage is 20% of the nominal pressure and lingers for ca. 40 s, having 10% of the allocated time. As mentioned, this widens the mass transfer zone as methane desorbs and readsorbs elsewhere. Consequently, the concentration front moves forward, and the time for bed regeneration should have been increased.
This step shows the propagating effect of a pressure drop in the adsorption step. The wider mass transfer zone and advanced concentration front necessitate a more prolonged regeneration. The allocated time is insufficient, and we can see in Figure 10 that the purity shows a decreasing trend from cycle to cycle. The purity is still high, and no breakthroughs of methane were recorded in the experiment because only seven cycles were measured. In a real-world operation, the cycles in a continuous operation go up to several hundred, in which case the bed saturation reaches a critical level, and a stoppage or cycle adjustment is required.

3.4. Stage Four

In the last stage of withdrawal, the pressure is close to the cushion gas pressure, and the composition has shifted toward high methane content. The breakthrough time is significantly reduced at this point because a lower pressure reduces the bed capacity, and a considerable amount of methane flows in with the feed. In Figure 11, the pressure profile of experiment Run#16 is shown. The adsorption step is just below three minutes (172 s). The pressure drop caused by the pressurization of another column appears here, like in other stages. The recovery from the pressure drop is relatively long because of the short adsorption time. The pressure-decreasing steps follow the ideal line until the purge starts at 400 s. The purge pressure is higher than the atmospheric pressure, reducing the regeneration quality. However, the sensors are placed at the top of the bed where the high-pressure purge gas enters. The bottom of the bed is routed to the atmospheric flare, so the recorded pressure contains a small error because of the sensor placement. The first pressure-increasing steps are stepwise as in the other stages, but there are few disruptions, and it closely follows the ideal rundown.
The purity records of this stage differ from the previous ones, i.e., it starts lower and increases in the later cycles, as seen in Figure 12. This indicates poor preparation and a not completely clean bed at the start. However, it shows a good regeneration quality from cycle to cycle, which is crucial at this stage because of the low cycle times.

3.5. Recovery and Summary

A crucial parameter of PSA processes is the recovery factor, introduced in Section 2. It describes the effectivity of the process, i.e., how much of the fed hydrogen is recovered as a pure product. The recovery factor was calculated by Equation (2), and similarly to product purity, it is based on material balancing. The higher the recovery, the more efficient the process is. Recovery is mainly driven by the selectivity of the adsorbent and the quantity of the purge gas used. A 100% recovery is not achievable because residual hydrogen remains in the pores of the adsorbent, even if the purge steps were to be eliminated. State-of-the-art, advanced polybed systems can achieve 90% recovery [34]. These systems use 6 to 16 beds and are usually optimized for a specific feedstock. The target of this research with a small four-bed unit is to achieve 80% recovery. The higher the methane content in the feed stream, the more purge gas is required for sufficient regeneration, so the recovery factor is expected to decrease from stage one to stage four. The recovery factor of the stage one experiments varied in a narrow range, between 0.74 and 0.80. These promising results meet the targeted 80% recovery but could be further improved by an optimized pressurization step and using control valves instead of solenoids. The inconsistency indicated by the pressure profile and the purity can also be recognized in the recovery values of the second-stage experiments because a higher maximum recovery was achieved in stage 3 (see Figure 13), which theoretically should not be the case. The hydrogen recovery across all stage 3 experiments had a wide spread (59–75%) because of the high number of runs, which shows how sensitive to process design the parameter is. In stage 4, the hydrogen recovery ranges between 52 and 66%; it is lowest at this stage, as expected, because of the high bed saturation and the increased requirement of purge gas.

4. Discussion

Each of the four experiments represents a stage in the withdrawal phase of underground, seasonal energy storage in the form of hydrogen. The results show that pressure swing adsorption can be a viable and effective method for the purification of the contaminated hydrogen, even with transient feed conditions or at high pressures. The sizing of the adsorbers was well chosen because, even in the last stage, an easy-to-control process could be implemented, and no rapid PSA mode was needed. At the same time, the unit was also operable in the first stage, where the pressure was high, and the methane content of the feed was low without the excessive need for purging. A key finding is that in this region, the high absolute pressure and the high pressure difference between adsorbers did not cause the erosion of the adsorbent or any irreversible effect in the adsorption–desorption process.
The process did not come without its challenges. Most issues resulted from the system build, i.e., the use of on/off valves and the common line for the pressure equalization and pressurization by-product. This consistently caused a pressure drop in the adsorption step, which widened the mass transfer zone and advanced the concentration front ahead of the planned bed length. Consequently, the gradual decrease in the purity cycle to cycle was seen even in just a few cycles, particularly in the stage three experiment. This error was successfully mitigated in the stage one experiment with the proper setting of the manual needle valve in the pressure equalization line. The subsequent measurements show that the same setting was insufficient in other stages, and no balance was found with the implemented step times. It shows that the process design for a PSA system is complex, and the parameters are heavily interconnected. Transient feed conditions emphasize this challenge because the physical components and step sequence have to be selected for various processes. It is advised to use proportional control valves instead of solenoids. In the case of a four-adsorber system, like the laboratory setup, this would require 16 proportional valves with a wide range of operating conditions. Such components are rarely available off the shelf and significantly increase the separation unit’s capital cost.
While the range of parameters can be estimated with high confidence, their exact progress in the months-long process is difficult to estimate. The four stages defined in this work are qualitative representations. In a continuous operation, changes in the pressure and composition would be continuous. In the case of an on-demand operation, the feed parameters could change drastically between startups. Both use cases require a flexible, adaptive process control strategy. An experimental investigation is time and resource-consuming, and optimizing each possibility is impossible. The present experimental cases are planned to be paired with a dynamic or cyclic steady-state simulation to expand the investigation and optimize the cycle for the withdrawal phase.

5. Conclusions

Long-term energy storage is of considerable interest in research and industry alike. One often-discussed idea was outlined in this research, in which surplus renewable electricity is converted to hydrogen by electrolysis, inserted into a depleted gas field and recovered when demand is high. The cushion gas (present in the porous rock formation for structural support) was assumed to be methane. The research focused on the technological feasibility of recovering hydrogen from the mixture, employing pressure swing adsorption (PSA). The withdrawal process can continue over several months, over which the pressure in the reservoir decreases and the composition of the mixture varies. The pressure range was selected between the cushion gas and gas grid pressure (25–60 bar). The composition range was selected to be between 65 and 98% hydrogen. Four distinct stages were defined within this range for investigation. A four-bed, lab-scale PSA unit and a 12-step process were developed, and cyclic experiments were conducted to evaluate the separation performance. The pressure profiles of each adsorber, product composition and flowrates were measured, and the product purity and recovery were calculated for evaluation. This is the first investigation of a PSA system with changing feedstock conditions and high pressures. The results indicate a viable performance, as the hydrogen purity did not change between stages and the recovery factor decreased slightly with lower pressures and hydrogen content. The process performance was not uniform, especially in stage two, where the recovery was lower than in the subsequent stage. Minor shortcomings of the system were recognized early, but they did not hinder the production of reliable results. The use of solenoid valves introduced unintended pressure changes within the process, and the accuracy of the gas analytics system did not reach analytical standards. A hydrogen purity of 99.95% was achieved in all stages, and the average hydrogen recovery ranged between 60 and 80%. The results support the feasibility of a single PSA system for the on-site separation from methane and suggest that fuel-cell-quality hydrogen can be produced during the recovery period.
A further investigation into mixtures with different parameters should be conducted either experimentally or in the form of a process simulation. The four stages defined here include four distinct feedstock parameters, but they are insufficient to support the process control design for a scaled system. The following steps in the research include the development of a process simulation model using the results of this research as a validation case and designing a process control system for a pilot-sized plant.

Author Contributions

Conceptualization, V.K., J.V. and M.H.; methodology, V.K. and J.V.; investigation, J.V.; formal analysis, V.K.; writing—original draft preparation, V.K.; writing—review and editing, C.J. and M.H.; visualization, V.K.; supervision, C.J. and M.H.; funding acquisition, M.H. All authors have read and agreed to the published version of the manuscript.

Funding

This research was partially supported by the Austrian Research Funding Association (FFG) within the research project “Underground Sun Storage 2030 (USS2030)” (FFG Project # 840705) and Open Access Funding by TU Wien.

Institutional Review Board Statement

Not applicable.

Informed Consent Statement

Not applicable.

Data Availability Statement

Not applicable.

Acknowledgments

Select materials and equipment used in this research were kindly provided by Donau Carbon GmbH and Axiom angewandte Prozesstechnik GmbH. We acknowledge the work of Martin Brenner and Yuga Pradana for their preparation, upgrading, maintenance and testing of the laboratory equipment.

Conflicts of Interest

The authors declare no conflict of interest.

Abbreviations

The following abbreviations are used in this manuscript:
EUEuropean Union
GHGGreenhouse gas
IRInfrared
MFCMass flow controller
MFMMass flow meter
PSAPressure swing adsorption
PLCProgrammable logic controller
SMRSteam methane reforming
UGSUnderground storage

References

  1. Ritchie, H.; Roser, M.; Rosado, P. CO2 and Greenhouse Gas Emissions. Our World Data 2020. Available online: https://ourworldindata.org/co2-and-other-greenhouse-gas-emissions (accessed on 18 August 2022).
  2. European Commission, Directorate-General for Communication. The European Green Deal; COM/2019/640 Final; Publications Office of the European Union: Luxembourg, 2019. [CrossRef]
  3. European Commission, Directorate-General for Energy. A Hydrogen Strategy for Climate Neutral Europe; COM/2020/301 Final; Publications Office of the European Union: Luxembourg, 2020. Available online: https://eur-lex.europa.eu/legal-content/EN/TXT/?uri=CELEX:52020DC0301 (accessed on 20 October 2022).
  4. European Commission, Directorate-General for Communication. REPowerEU, Joint European Action for More Affordable, Secure and Sustainable Energy; COM/2022/230 Final; Publications Office of the European Union: Luxembourg, 2022. [CrossRef]
  5. Gatzen, C. Green gas supply for Germany & Europe—A technology neutral approach. In Proceedings of the 5th European Gas Technology Conference, Hamburg, Germany, 14–15 June 2022. [Google Scholar]
  6. Tarkowski, R.; Uliasz-Misiak, B.; Tarkowski, P. Storage of hydrogen, natural gas, and carbon dioxide—Geological and legal conditions. Int. J. Hydrogen Energy 2021, 46, 20010–20022. [Google Scholar] [CrossRef]
  7. Hévin, G. Underground storage of Hydrogen in salt caverns. In Proceedings of the European Workshop on Underground Energy Storage, Paris, France, 7–8 November 2019. [Google Scholar]
  8. Portarapillo, M.; Di Benedetto, A. Risk Assessment of the Large-Scale Hydrogen Storage in Salt Caverns. Energies 2021, 14, 2856. [Google Scholar] [CrossRef]
  9. Netherlands Enterprise Agency. The Effects of Hydrogen Injection in Natural Gas Networks for the Dutch Underground Storages; Technical Report; DBI Gas- und Umwelttechnik GmbH: Leipzig, Germany, 2017.
  10. Sambo, C.; Dudun, A.; Samuel, S.A.; Esenenjor, P.; Muhammed, N.S.; Haq, B. A review on worldwide underground hydrogen storage operating and potential fields. Int. J. Hydrogen Energy 2022, 47, 22840–22880. [Google Scholar] [CrossRef]
  11. Caglayan, D.G.; Weber, N.; Heinrichs, H.U.; Linßen, J.; Robinius, M.; Kukla, P.A.; Stolten, D. Technical potential of salt caverns for hydrogen storage in Europe. Int. J. Hydrogen Energy 2020, 45, 6793–6805. [Google Scholar] [CrossRef]
  12. Amid, A.; Mignard, D.; Wilkinson, M. Seasonal storage of hydrogen in a depleted natural gas reservoir. Int. J. Hydrogen Energy 2016, 41, 5549–5558. [Google Scholar] [CrossRef] [Green Version]
  13. Hemme, C.; Van Berk, W. Hydrogeochemical modeling to identify potential risks of underground hydrogen storage in depleted gas fields. Appl. Sci. 2018, 8, 2282. [Google Scholar] [CrossRef] [Green Version]
  14. Cihlar, J.; Mavins, D.; van der Leun, K. Picturing the Value of Underground Gas Storage to the European Hydrogen System; Technical Report; Gas Infrastructure Europe: Utrecht, The Netherlands, 2021. [Google Scholar]
  15. Perez, A.; Pérez, E.; Dupraz, S.; Bolcich, J. Patagonia Wind—Hydrogen Project: Underground Storage and Methanation. In Proceedings of the 21st World Hydrogen Energy Conference, Zaragoza, Spain, 13–16 June 2016. [Google Scholar]
  16. Underground Sun Storage Website. 2017. Available online: https://www.underground-sun-storage.at/en/ (accessed on 11 August 2022).
  17. Underground Sun Storage 2030 Website. 2021. Available online: https://www.uss-2030.at/en/ (accessed on 11 August 2022).
  18. Yang, R.T. Gas Separation by Adsorption Processes; Butterworth Publishers: Stoneham, MA, USA, 1987. [Google Scholar]
  19. Skarstrom, C.W. Method and Apparatus for Fractionating Gaseous Mixtures by Adsorption. US2944627A, 12 July 1960. [Google Scholar]
  20. Montgareuil, P.G.D.; Domine, D. Process for Separating a Binary Gaseous Mixture by Adsorption. US3155468A, 3 November 1964. [Google Scholar]
  21. Ruthven, D.M. Principles of Adsorption and Adsorption Processes; John Wiley and Sons, Inc.: Hoboken, NJ, USA, 1984. [Google Scholar]
  22. McCabe, W.L.; Smith, J.C.; Harriott, P. Unit Operations of Chemical Engineering; McGraw-Hill, Inc.: New York, NY, USA, 1993. [Google Scholar]
  23. Ruthven, D.M.; Farooq, S.; Knaebel, K.S. Pressure Swing Adsorption; VCH Publishers, Inc.: New York, NY, USA, 1994. [Google Scholar]
  24. Voss, C. Applications of pressure swing adsorption technology. Adsorption 2005, 11, 527–529. [Google Scholar] [CrossRef]
  25. Malek, A.; Farooq, S. Hydrogen purification from refinery fuel gas by pressure swing adsorption. AIChE J. 1998, 44, 1985–1992. [Google Scholar] [CrossRef]
  26. Sircar, S.; Waldron, W.; Rao, M.; Anand, M. Hydrogen production by hybrid SMR–PSA–SSF membrane system. Sep. Purif. Technol. 1999, 17, 11–20. [Google Scholar] [CrossRef]
  27. Park, J.H.; Kim, J.N.; Cho, S.H. Performance analysis of four-bed H2 PSA process using layered beds. AIChE J. 2000, 46, 790–802. [Google Scholar] [CrossRef]
  28. Lee, J.J.; Kim, M.K.; Lee, D.G.; Ahn, H.; Kim, M.J.; Lee, C.H. Heat-exchange pressure swing adsorption process for hydrogen separation. AIChE J. 2008, 54, 2054–2064. [Google Scholar] [CrossRef]
  29. Lopes, F.V.S. New Pressure Swing Adsorption Cycles for Hydrogen Purification from Stem Reforming Off-Gases. Ph.D. Thesis, University of Porto, Porto, Portugal, 2010. [Google Scholar]
  30. Lopes, F.V.; Grande, C.A.; Rodrigues, A.E. Activated carbon for hydrogen purification by pressure swing adsorption: Multicomponent breakthrough curves and PSA performance. Chem. Eng. Sci. 2011, 66, 303–317. [Google Scholar] [CrossRef]
  31. Shi, W.; Yang, H.; Shen, Y.; Fu, Q.; Zhang, D.; Fu, B. Two-stage PSA/VSA to produce H2 with CO2 capture via steam methane reforming (SMR). Int. J. Hydrogen Energy 2018, 43, 19057–19074. [Google Scholar] [CrossRef]
  32. Du, Z.; Liu, C.; Zhai, J.; Guo, X.; Xiong, Y.; Su, W.; He, G. A Review of Hydrogen Purification Technologies for Fuel Cell Vehicles. Catalysts 2021, 11, 393. [Google Scholar] [CrossRef]
  33. Burgers, I.A.E. Novel Technology for Hydrogen Separation from Natural Gas Using Pressure Swing Adsorption. Master’s Thesis, TU Delft, Delft, The Netherlands, 2020. [Google Scholar]
  34. Luberti, M.; Ahn, H. Review of Polybed pressure swing adsorption for hydrogen purification. Int. J. Hydrogen Energy 2022, 47, 10911–10933. [Google Scholar] [CrossRef]
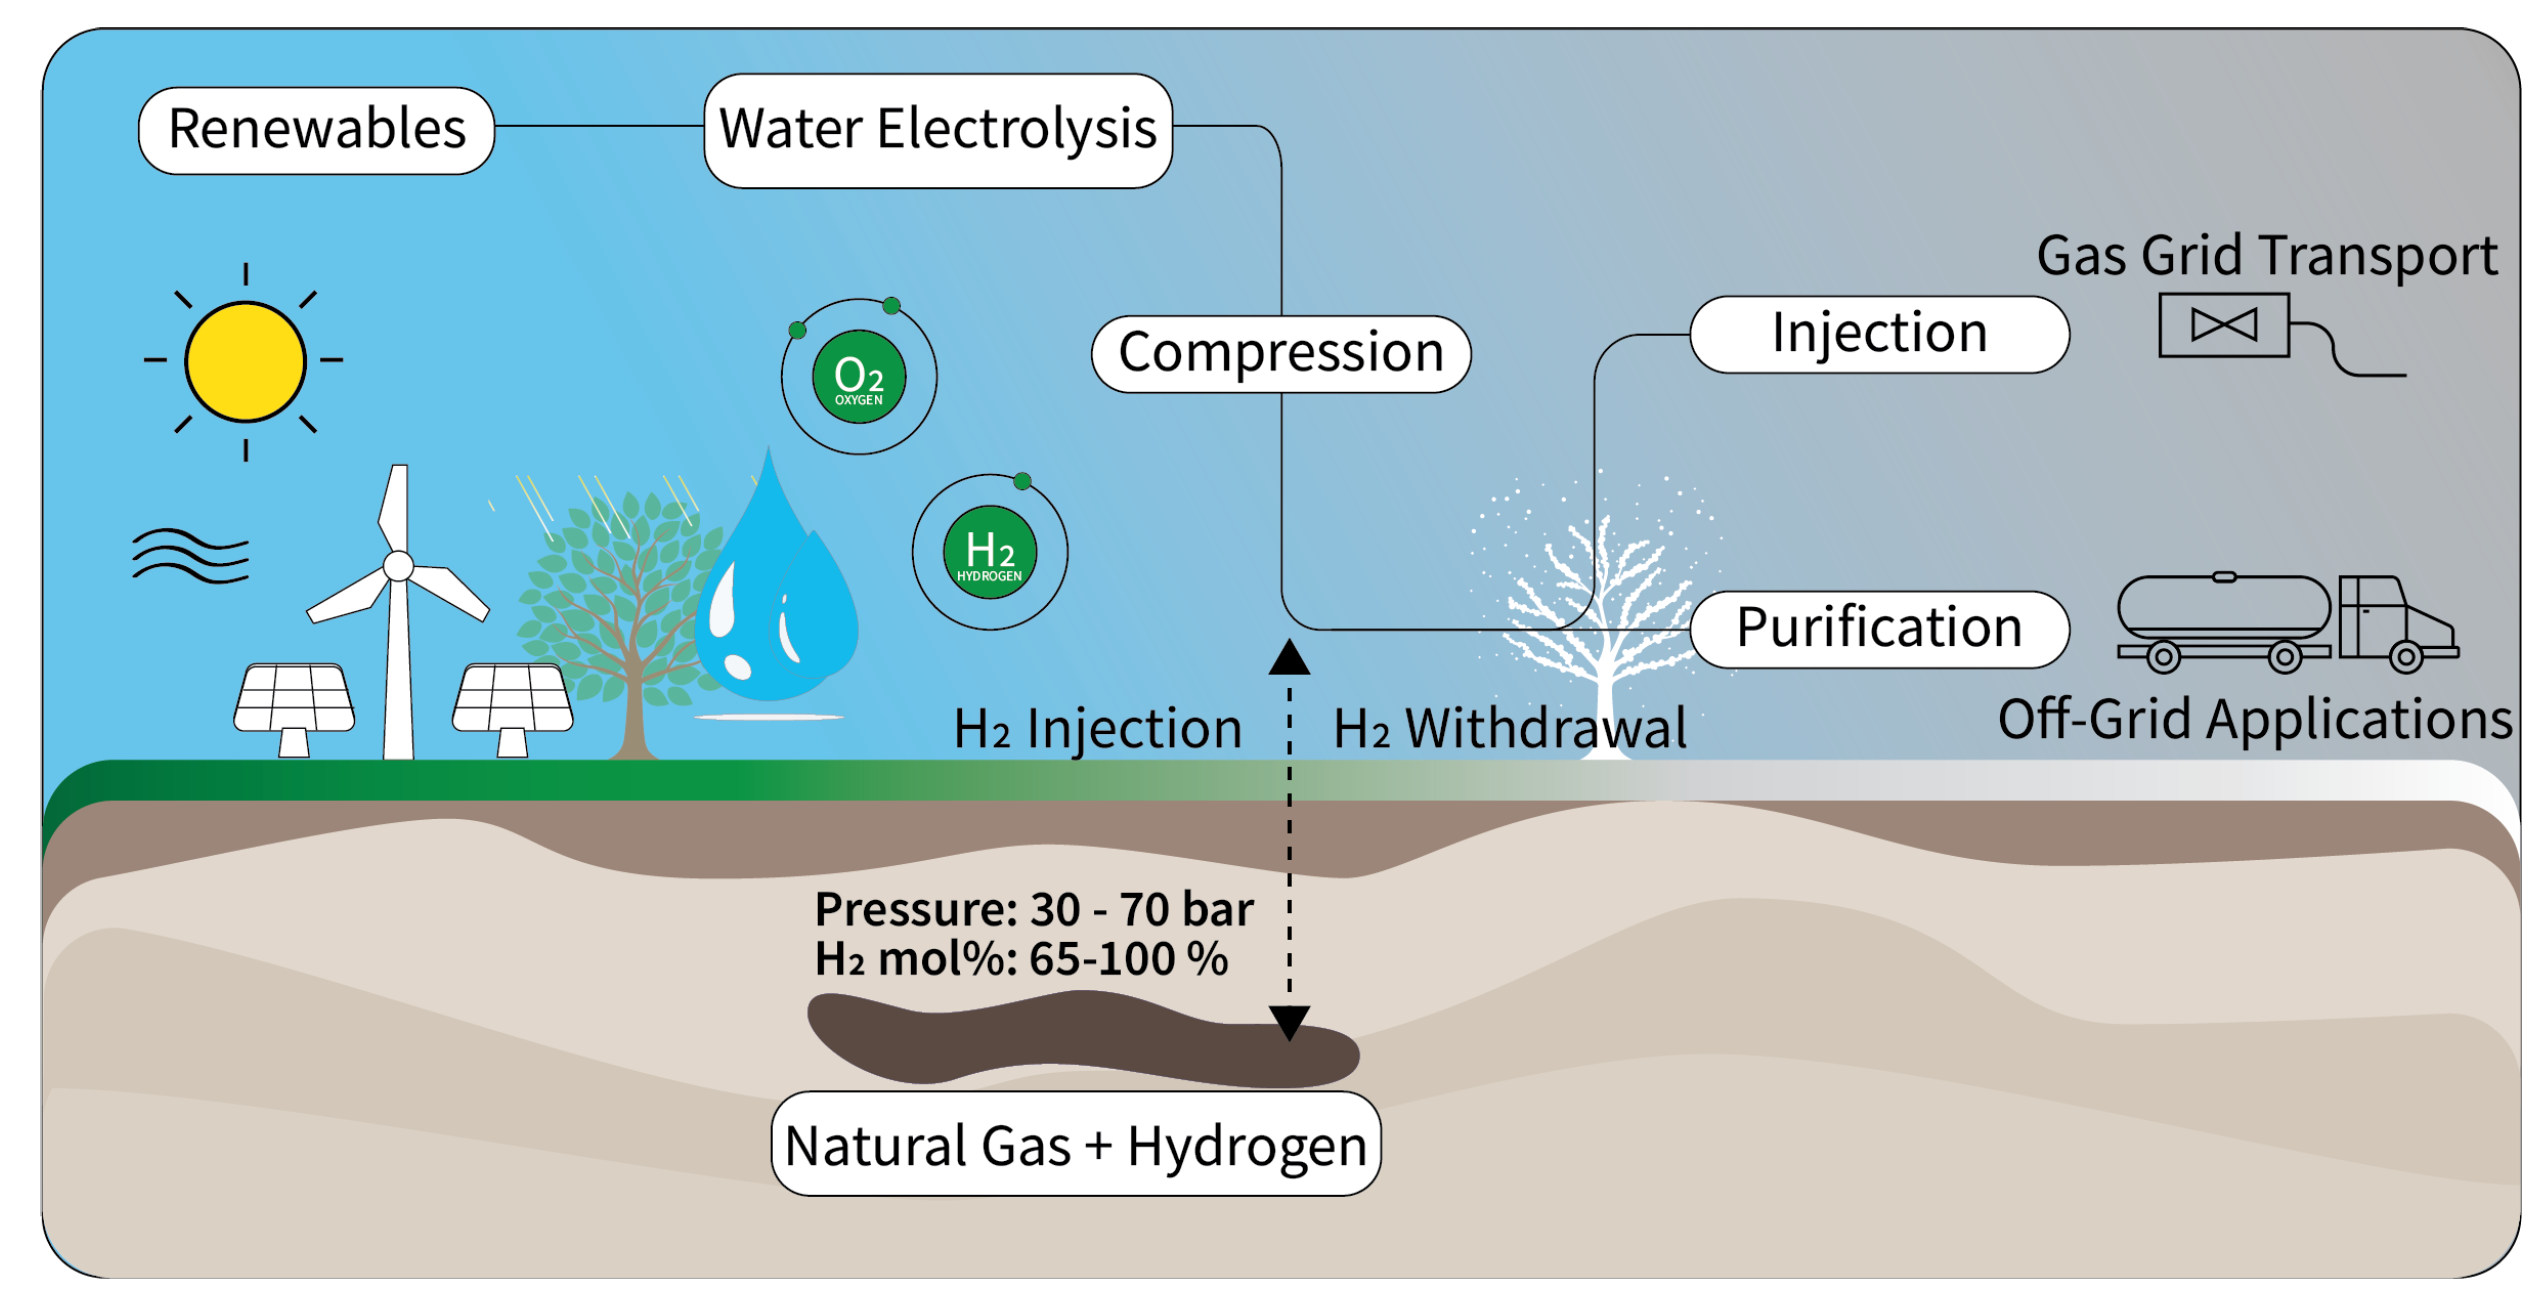
Figure 1. Schematic overview of a seasonal storage solution.
Sustainability 14 14037 g001
Figure 2. Map of European salt deposits and salt structures as a result of suitability assessment for underground hydrogen storage. (1. Alsace Basin; 2. Bresse Basin; 3. Greoux Basin; 4. Valence Basin; 5. Lower Rhine Basin; 6. Hessen Werra Basin; 7. Sub-Hercynian Basin; 8. Lausitz Basin; 9. Leba Salt; 10. Fore-Sudetic Monocline; 11. Carpathian Foredeep; 12. Lublin Trough; 13. Ocnele Mari; 14. Cardona Saline Formation; 15. Pripyat Basin; 16. Cheshire Basin; 17. UK Permian Zechstein Basin; 18. Larne Salt Field; 19. Wessex Basin) Courtesy of Caglayan et al. [11].
Sustainability 14 14037 g002
Figure 3. Progression of gas composition and pressure through the withdrawal process and the selected value pairs to represent different stages of recovery.
Sustainability 14 14037 g003
Figure 4. Simplified flowsheet of the unit. Pressure, temperature sensors and supplementary valves are not shown for easier readability.
Sustainability 14 14037 g004
Figure 5. Ideal (- -) and recorded (–) adsorber pressure profile in Run#13. Adsorption pressure: 60 bar, feed composition: 98% hydrogen–2% methane.
Sustainability 14 14037 g005
Figure 6. Purity of stage one experiment, run #13.
Sustainability 14 14037 g006
Figure 7. Ideal (- -) and recorded (–) adsorber pressure profile in Run#07. Adsorption pressure: 50 bar, feed composition: 90% hydrogen–10% methane.
Sustainability 14 14037 g007
Figure 8. Purity of stage two experiment, run #07.
Sustainability 14 14037 g008
Figure 9. Ideal (- -) and recorded (–) adsorber pressure profile in Run#01. Adsorption pressure: 35 bar, feed composition: 75% hydrogen–25% methane.
Sustainability 14 14037 g009
Figure 10. Purity of stage three experiment, run #01.
Sustainability 14 14037 g010
Figure 11. Ideal (- -) and recorded (–) adsorber pressure profile in Run#16. Adsorption pressure: 25 bar, feed composition: 65% hydrogen–35% methane.
Sustainability 14 14037 g011
Figure 12. Purity of stage four experiment, run #16.
Sustainability 14 14037 g012
Figure 13. Average recovery and standard deviation in all stages.
Sustainability 14 14037 g013
Table 1. In-operation salt caverns used for hydrogen storage [7].
LocationOperatorPressureEnergy
Clemens Dome (USA, TX)Conoco Philips70–135 bar92 GWh
Moss Bluff (USA, TX)Praxair55–152 bar120 GWh
Spindletop (USA, TX)Air Liquide68–202 bar270 GWh
Teesside (UK)Sabic45 bar25 GWh
Table 2. Stages of feed gas mixture in seasonal recovery.
StageAdsorption Pressure (bar)Mole Fraction Ratio (H2:CH4)
Stage 16098:2
Stage 25090:10
Stage 33575:25
Stage 42565:35
Table 3. List of experiments with the most important parameters. The best run for each stage is highlighted.
Experiment NumberFeed H2/CH4 [mol%]Adsorption Pressure [bara]Cycle Time [sec]P/F Ratio 1
Run#06 (Stage 1)98.0/2.06025200.18
Run#09 (Stage 1)98.0/2.06015120.18
Run#13 (Stage 1)98.0/2.06023200.12
Run#07 (Stage 2)90.0/10.05014960.38
Run#10 (Stage 2)90.1/9.9508960.30
Run#14 (Stage 2)90.1/9.95014960.20
Run#01 (Stage 3)80.1/19.93511520.30
Run#03 (Stage 3)80.1/19.93511520.40
Run#04 (Stage 3)80.1/19.93511520.40
Run#11 (Stage 3)80.1/19.9356920.40
Run#15 (Stage 3)80.1/19.93511520.30
Run#02 (Stage 4)70.1/29.9256880.50
Run#05 (Stage 4)70.2/29.8256880.60
Run#08 (Stage 4)70.1/29.9254920.50
Run#12 (Stage 4)70.1/29.9254920.30
Run#16 (Stage 4)70.2/29.8256880.30
1 P/F—purge-to-feed ratio.
Table 4. The 12-step sequence of the cycle used in the experiments.
BedStep Sequence
AADSEQ1−PPGEQ2−BDPGEQ1+EQ2+PR
BEQ1+PRADSEQ1−PPGEQ2−BDPGEQ2+
CBDPGEQ2+EQ1+PRADSEQ1−PPGEQ2−
DEQ1−PPGEQ2−BDPGEQ2+EQ1+PRADS
ADS—Adsorption, EQ—Equalization, PPG—Providing purge, BD—Blowdown, PR—Pressurization.
Table 5. Maximum allowed impurity content in H2 for fuel cells in the ISO 14687:2019 and SAE J2719-202003 standards.
ComponentContent
Hydrogen purity (mole fraction)99.97%
Total non-hydrogen gases300 ppm
Water (H2O)5 ppm
Methane (CH4)100 ppm
Non-methane hydrocarbons2 ppm
Oxygen (O2)5 ppm
Helium (He)300 ppm
Nitrogen (N2)300 ppm
Argon (Ar)300 ppm
Carbon-dioxide (CO2)2 ppm
Carbon-monoxide (CO)20 ppm
Hydrogen-sulfide (H2S)0.004 ppm
Formaldehyde (HCHO)0.2 ppm
Formic acid (HCOOH)0.2 ppm
Ammonia (NH3)0.1 ppm
Total halide ion0.05 ppm
Maximum particulate matter1 mg/kg
Publisher’s Note: MDPI stays neutral with regard to jurisdictional claims in published maps and institutional affiliations.