1. Introduction
The United Nations General Assembly has adopted the 2030 Agenda for Sustainable Development [
1], which calls for a new vision to address the world’s environmental, social, and economic concerns. It includes 17 Sustainable Development Goals (SDGs), where both SDG4 and SDG5 goals address quality education and gender equality [
1].
UNESCO recognizes that for education to achieve its potential, critical changes are needed at both local and global levels [
2]. It believes that persistent disparities in access and achievement in education need to be eliminated to improve educational quality. Eliminating these disparities will help provide learners with the essential knowledge, skills, and attitudes which will consequently ensure the building of inclusive and sustainable societies.
Several stakeholders have a global consensus that science, technology, engineering, and mathematics (STEM) education can play a vital role in transforming societies toward sustainability [
3,
4]. They argue that achieving the 2030 Sustainable Development Agenda necessitates adopting such an interdisciplinary approach to education [
2,
4,
5]. Researchers also emphasize that STEM education has already provided several improvements in many aspects of our life, such as health, agriculture, infrastructure, and renewable energy [
5]. It also plays a vital role in transforming future careers and enabling future generations to actively contribute to building sustainable societies [
4,
6].
STEM education has been considered an important national development tool that shapes how future citizens perceive and understand the world and enables them to take part in a progressively competitive global economy [
7]. According to the US government, STEM encompasses physical, biological, and agricultural sciences; computer and information sciences; engineering and engineering technologies [
8].
Ensuring girls have equal access to STEM education and careers is important from the human rights, scientific, and development perspectives [
9,
10]. From a human rights perspective, all humans are equal and should have equal opportunities to study and work in the field they choose [
10]. From a scientific perspective, the inclusion of girls in studying and working in STEM fields will increase their potential for scientific excellence and boost the quality of STEM outcomes [
3,
11]. Blickenstaff [
12] makes this point, commenting that STEM requires a wide pool of talented boys and girls to promote excellence in societies, and that to leave out girls would be a loss for all. From a development perspective, UNESCO argues that STEM contributes to establishing gender equality in societies and enables both genders to enhance their status and income [
10]. It further emphasizes that STEM ensures that boys and girls can acquire skills and have equal opportunities to contribute to developing their societies [
4].
Although many researchers have concluded that the global status of women’s participation and achievement in STEM education has been enhanced during the past years, gender disparity has not been eliminated [
13,
14]. Although many women are joining the STEM workforce, they are still encountering several barriers that limit their engagement, representation, and participation in many countries [
15,
16].
Studies show that the Arab region is the most youthful in the world [
17]. Compared to the global age average [
4], the median age of Arab youth is 22 making 60% of the Arab population under 25 years old. These numbers stress many sectors in the region, especially the education sector [
17].
International comparative studies such as TIMSS and PISA showed that the participating students from the Middle East including United Arab Emirates (UAE), Saudi Arabia, Jordon, and others performed well below the average score in science and mathematics assessment of both TIMSS and PISA [
18,
19]. These findings raise concerns when we consider science and mathematics as two important disciplines that makeup STEM. Consequently, active educational reforms were introduced in most Arab countries including Jordan to close the gap in performance as well as in enrolment. Several Arab nations, including Egypt, Jordan, and the UAE, have given a high priority to STEM education not only to improve performance in international comparative studies but also to encourage enrolment and participation in STEM-related fields [
20,
21].
Many Arab governments have shown a strong commitment to offering their youth good educational opportunities to enhance their competitiveness [
22]. Moreover, Arab governments have worked hard to enhance the status of women and enable them to play an active role in developing their countries. For example, Kuwait, Qatar, Yemen, and U.A.E had no college/university education until 1960s. However, today all Arab states have a well-developed school and tertiary education system for both men and women [
23]. Additionally, nearly all Arab governments and particularly oil producing countries have allocated a substantial amount of fund (up to 25% of the public budget) to support women’s education [
24].
Additionally, many Arab nations have implemented specific educational reforms to enhance the participation of Arab women in the society through offering them opportunities to join multiple professions that were forbidden to women in the past (i.e., Engineering). Currently, all Arab nations, with some reservations, have ratified the Convention on the Elimination of all Forms of Discrimination against Women (CEDAW) [
25,
26]
In Jordan, the government has invested a huge amount of money and efforts to increase the quality of education offered to Jordanians. For example, in early 1990s, the government launched a 10-year national educational reform project (Education Reform for Knowledge Economy) (ErFKE) that focussed mainly on ICT integration for the sake of making Jordan a regional hub for technology and enabling Jordanians to play an active role in enhancing the national as well as the global economy [
27,
28]. Such efforts were strengthened by recent national projects and initiatives such as the Jordanian National Employment Strategy and the Jordan Vision 2025 [
29]. Furthermore, several national studies have also been undertaken by the National Centre for Human Resource Development (NCHRD) to assess and emphasize the need to enhance university graduates’ skills to enable them to contribute to developing the national economy [
30].
Surprisingly, all those studies and reports did not mention STEM education and ignored the importance of encouraging girls to study STEM fields at both school and university levels. Furthermore, they highlighted gaps that exist in the national labor market without defining the specific details of skills and competencies needed to support the national economic growth and policies that are needed to encourage both girls and boys to study STEM education (i.e., Engineering, Computer Sciences, Medicine and other Health Sciences) and particularly keep girls in the national STEM pipeline.
The ambiguity of a comprehensive understanding of the rationale and significance of STEM education among Jordan’s education stakeholders (i.e., Ministry of Education and Ministry of Higher Education and Scientific Research) has led to offering Jordanian school students the subcomponents of STEM (physics, chemistry, biology, and mathematics) without addressing the blended and active learning which is required for effective STEM education.
The case in the higher education sector is not as hopeful as STEM is not well known in academia and universities offer degrees in different subcomponents of STEM (i.e., science, engineering, mathematics, etc.) without addressing the interdisciplinary nature of STEM to students. This lack of understanding of the rationale of STEM leads to the misalignment between university graduates’ skills and competencies and those required by their current and future careers and occupations [
7].
In the 2019 report published by the Organization for Economic Cooperation and Development (OECD), Jordan was one of three countries where women felt more comfortable with mathematics than men [
31]. On contrary, reports from Europe and North America shows that women still do not prefer to pursue their education in many STEM fields including Mathematics, Physical Sciences, Engineering, and Information technology [
32]. For example, women in Spain tend not to study Mathematics along with many other sciences like Physics, Geology, and Chemistry [
33]. Additionally, women in Canada are less likely to enter and more likely to leave STEM fields [
32].
Despite the advancement made by Jordanian women to enter STEM fields, no studies to date has examined the preferences of students when choosing STEM areas or how many of these students went on to graduate with degrees in any of the STEM fields. Answering these questions is crucial to understanding the barriers that prevent women from finishing their university degrees in STEM education and limit their representation and contribution to the national economy.
Therefore, this study addressed that gap by identifying the enrollment, percentages, and preferences of women pursuing their university degrees in any of the STEM fields. The importance of conducting this study is to provide Jordan’s educators and policymakers with authentic research data about the status of STEM education at the university level and help them put the needed policies to encourage both gender to continue their STEM university education. The results of this study highlight the importance of strengthening STEM education in Jordan’s universities as well as the importance of keeping women in various STEM fields to help strengthen the national economy and enhance the competitiveness of Jordan’s workforce at the national, regional, and global levels.
This study came to particularly answer the following three questions:
Is there any significant difference between male and female students’ enrollments in different STEM fields in Jordan?
What is the percentage of female and male graduates earning a degree in any of the STEM fields?
What STEM field is mostly favored by male and/or female university students?
Theortical Framework
We applied expectancy value theory [
34] with three perspectives to examine gender roles on the enrollment in STEM disciplines. First, we used communal goal congruency to students’ choice of STEM fields [
35]. Second, we examined professional goal orientation in the motive behind joining STEM fields [
36]. Third, we discussed a confirmatory goal to secure jobs in STEM fields.
The Expectancy value theory states that students are motivated to choose a subject or a discipline based on their personal expectation to succeed in that field to achieve their goal in the short term and a related career goal in the long run [
37]. When students are given the choice to join any discipline in higher education, some may look at the ease of the subject matter to get through it, but others may look at their real motivation with respect to communal goal with professional value, respect, and social identity [
35]. From this view, students observe the communal aspect of a discipline in the sense of their connection to others. This relational sense may aid in their understanding of interdependence and social belonging [
38]. On the other hand, when examined from the perspective of professional goal congruency, students may or may not choose STEM or any discipline based on what profession they wish to enter as their career [
36]. Some students may wish to gain more economic gain with better paid jobs, and this may lead them to join STEM disciplines with an impression that “STEM workers command higher wages, earning 26 percent more than their non-STEM counterparts” [
39] (p. 1). This job prospect as a motivation for joining STEM or non-STEM disciplines is guided by the students’ self-perceived sense of security in the job guarantee. In this sense, those students who have a more confirmatory view of their future jobs and economic security and the potential for growth may choose a discipline that is growing, expanding, and advancing fast, which are STEM disciplines [
40].
3. Results
Result showed a statistically significant difference between both male and female students in terms of enrollment in Physics, Chemistry, Biology, Biotechnology, Geology and Environment, and Mathematics favoring the alternative hypothesis (enrollment in females is higher than the male students in areas of sciences as their mean ranks were significantly higher than male students in all sciences).
Table 2, shows the result of testing if there was a statistically significant difference between the enrollment of male and female students in the university in different fields of science over a period of ten years at 0.05 level of significance.
Additionally, we used an independent-samples Mann-Whitney U Test to test if there was a statistically significant difference between the enrollment of male and female students in the university in different fields of Engineering over a period of time at 0.05 level of significance. The result showed a statistically significant difference between the groups in terms of enrollments in Civil, Mechanical, Industrial, Mechatronics, Medical, Architectural, and Software Engineering favoring the alternative hypothesis (
Table 3). While the differences were in favor of male students in Civil, Mechanical, and Mechatronics Engineering (mean ranks for male students were significantly greater than mean ranks for female students), the differences were in favor of female students in Industrial, Medical, Architectural, and Software Engineering (mean ranks for female students were significantly higher than male students) (
Table 3).
Furthermore, to test if there was a statistically significant difference between the enrollment of male and female students in the university in different fields of Medical Sciences over a period of time at a 0.05 level of significance, we implemented an independent-samples Mann-Whitney U Test. The result showed a statistically significant difference between the groups in terms of enrollments in a Medical Laboratory Sciences, Clinical Nutrition, Physical and Occupational Therapy, and Medical Imaging (
Table 4). The results favored the alternative hypothesis showing that the enrollment of female students is higher than that of male students in all areas of Medical Sciences as their mean ranks were significantly higher than male students (
Table 4).
Moreover, we used an independent-sample Mann-Whitney U Test to test if there was a statistically significant difference between the enrollment of male and female students in the university in Science (that includes all sciences together), Engineering (that includes all engineering together), and Medical Sciences (that includes all medical sciences together) over a period of ten years at a 0.05 level of significance. The result showed a statistically significant difference between the groups in terms of overall enrollments in General Sciences and Medical Sciences favoring the alternative hypothesis that the enrollment of female students was higher than that of male students in those areas as their mean ranks were higher than the male students (
Table 5). However, the result for the Engineering favored the male students as their mean rank was higher than the female students, although the difference was statistically not significant at a 0.05 level (
p > 0.05).
To analyze the graduation data, we performed Pearson’s Chi-Square tests for goodness of fit the data to examine if the graduation numbers in all Sciences, Engineering, and Medical Sciences were related to gender (
Appendix A). The results showed that the number of students who graduated across all sciences (Chi-Square Value 57.042, df 5,
p-value < 0.001), engineering (Chi-Square Value 1616.660, df 6,
p-value < 0.001), and medical sciences (Chi-Square Value 228.384, df 3,
p-value < 0.001) were contingent to gender at a 0.05 level of significance.
Data also showed a clear gendered pattern of graduates at the university level. Male students are the majority of those enrolled in engineering and computer sciences, and to a lesser extent in other disciplines (
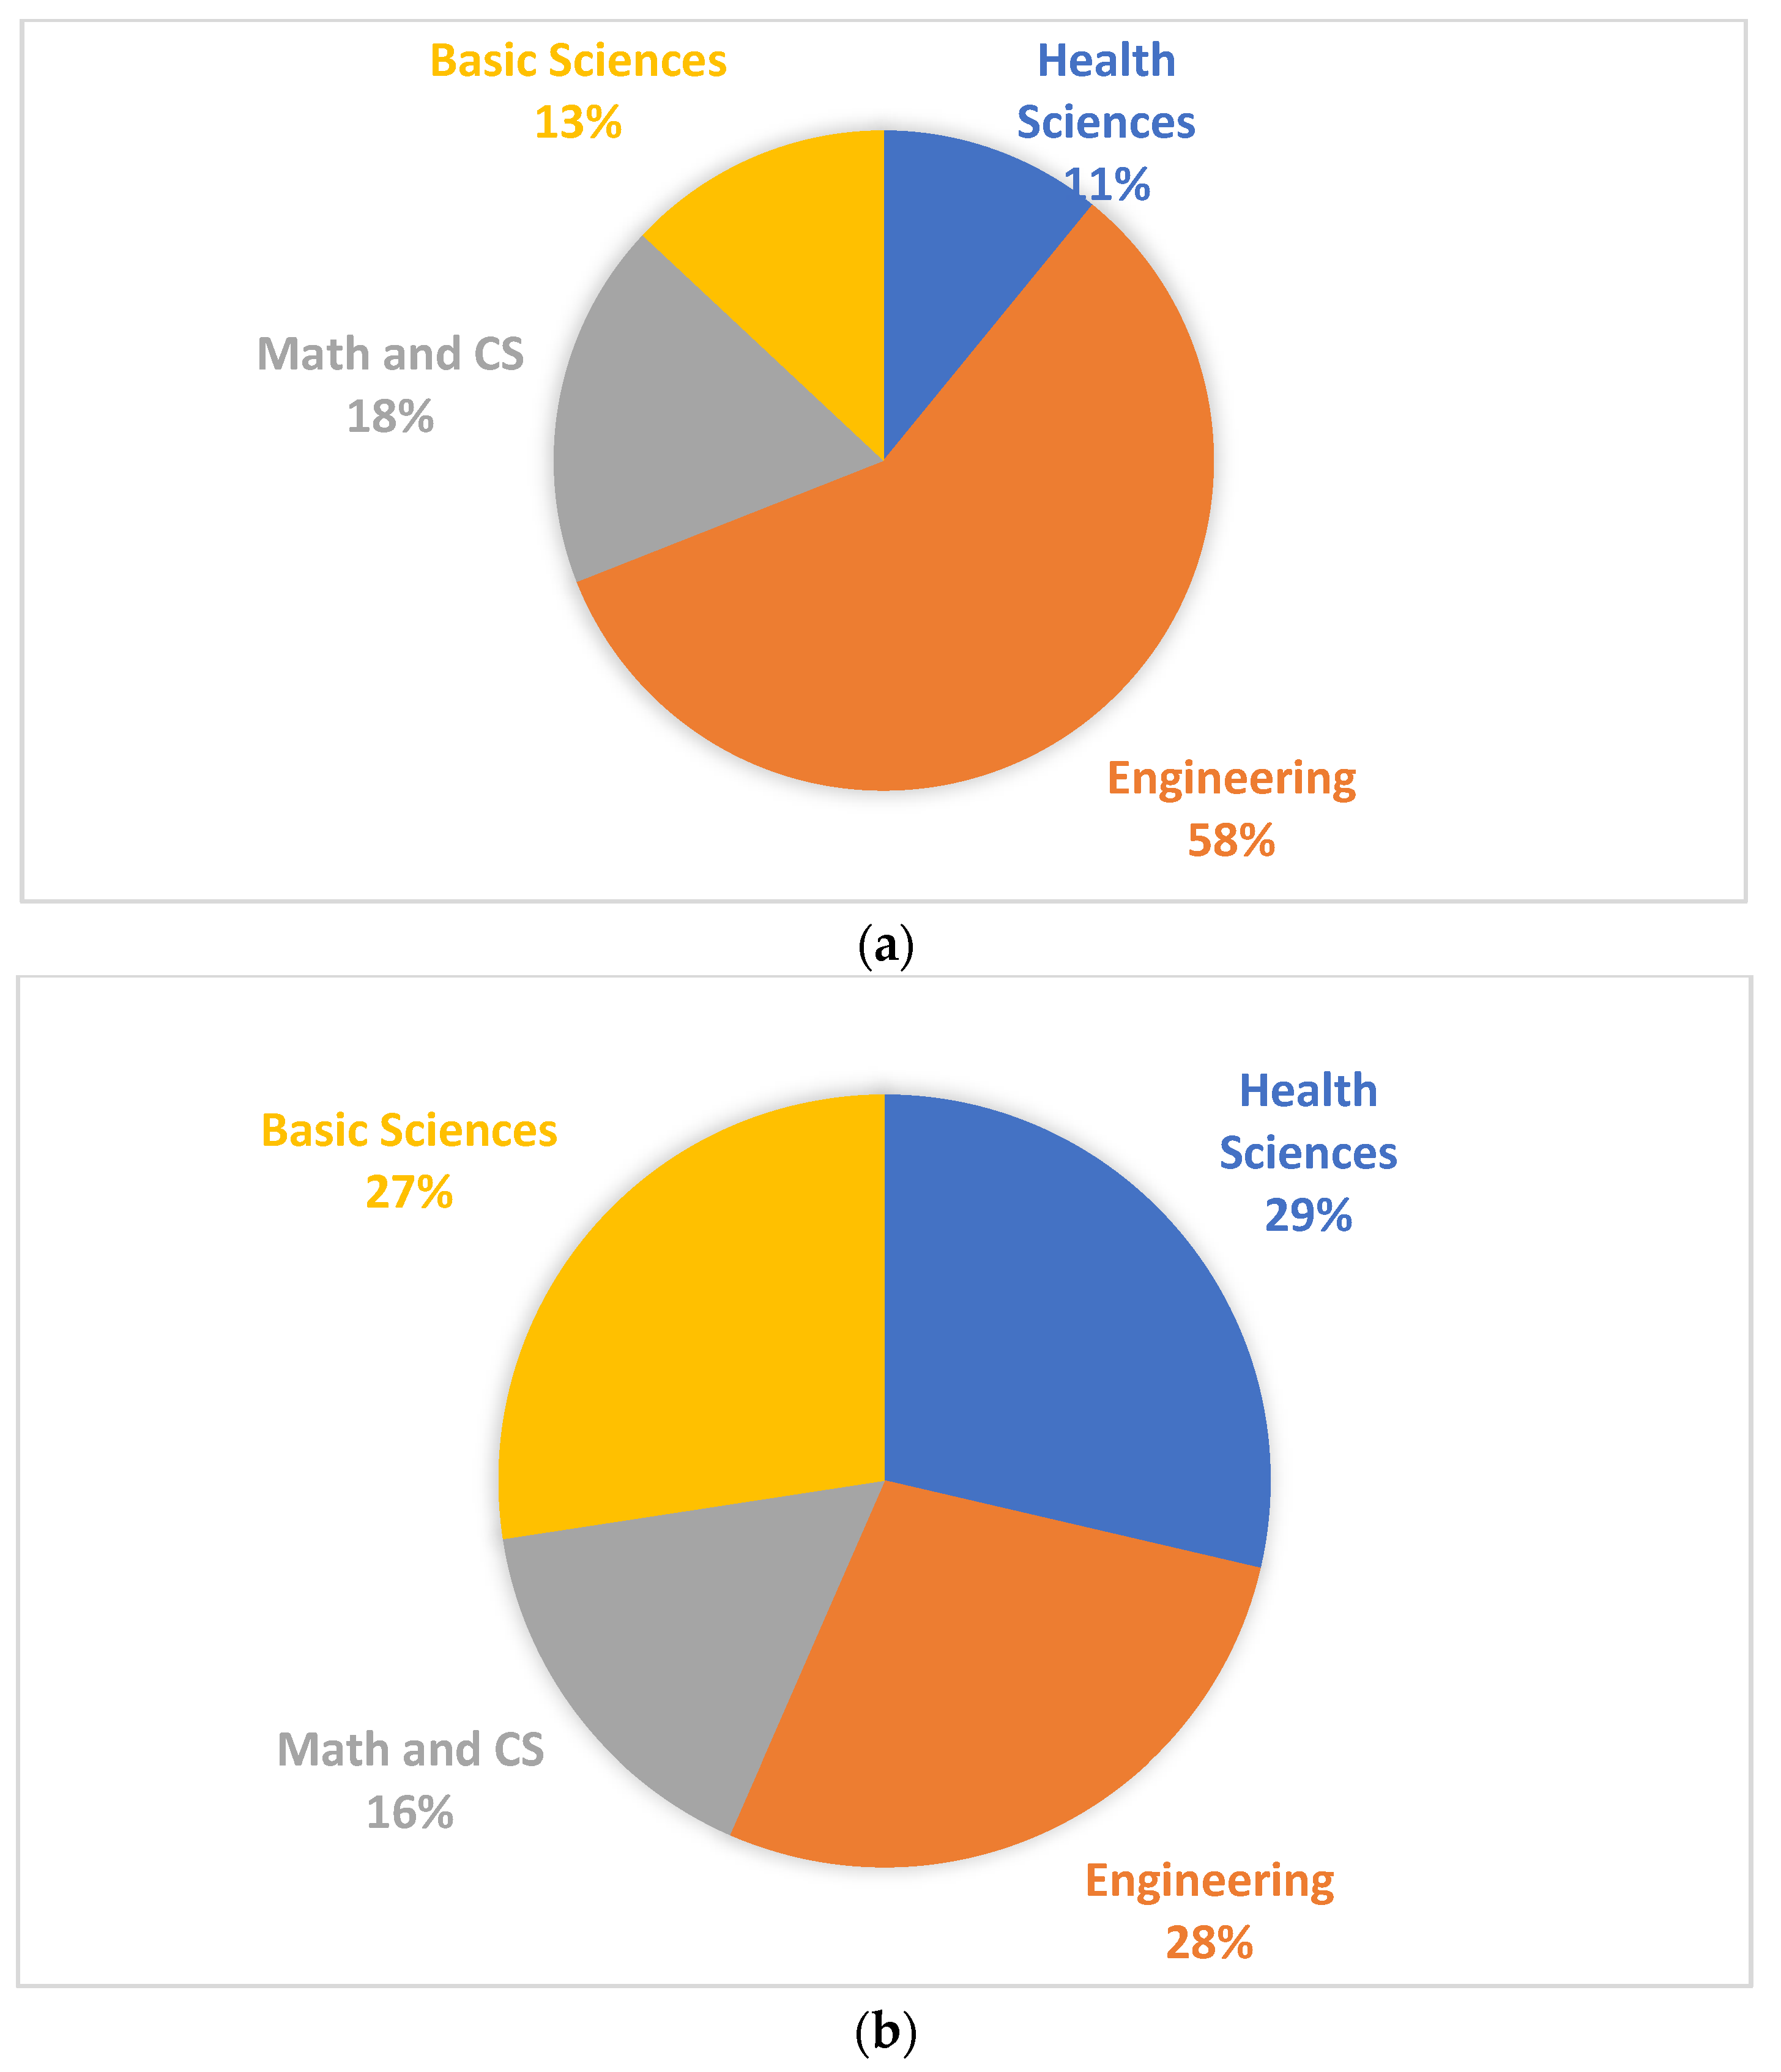
Figure 1a,b). Female students represent the majority in Health Sciences and basic sciences fields. The highest disparity appeared to be in Engineering fields where 58% of the graduates are males compared to only 28% of females.
Among all the male students who graduated in the STEM fields over the period of ten years showed that a majority of them, about 58%, was in Engineering followed by Mathematics and Computer Science, Basic Science, and Health Science with the lowest percentage (11%) (
Figure 1a). However, the distribution of female students across the STEM fields was different from the male students. About 29% of female students graduated with a degree in Medical Sciences followed by Engineering (28%), basic Science (27%), and Mathematics and Computer Science (16%) (
Figure 1b).
Data analysis also indicated that the most favored fields of Engineering by females were Architectural engineering (77% compared to 23% of males), Medical engineering (65% compared to 35% of males), Software engineering (60% compared to 40% of males), and Industrial engineering (59% comparing to 41% of males). However, males favored mostly Mechanical engineering (96% compared to 4% of females), Civil engineering (71% compared to 29% of females), and Mechatronics engineering (73% compared to 27% of females). See
Figure 2 below:
Data also revealed that the most favored fields of Health Sciences by females were Clinical Nutrition and Dietetics (97%), Medical Laboratory Sciences (86%), Physical and Occupational Therapy (81%), and Medical Imaging (65%). However only 35% of male graduates were in favor of studying Medical Imaging, 19% favored Physical and Occupational Therapy, 14% favored Medical Laboratory Sciences, and only 3% studied Clinical Nutrition and Dietetics (
Figure 3).
Concerning basic Sciences, results showed that females dominantly favored those fields. As shown in
Figure 4, 83% and 85% of females studied Biotechnology and Biology followed by 74% and 73% studied Chemistry and Physics. On the contrary, Chemistry was the highest favored science by males (26%) followed by only 17% of males studying Biotechnology and only 15% of male graduates studied Biology.
Similarly, Computer Sciences and Mathematics were mostly studied by female graduates. As shown in
Figure 5 below, (80%) of females studied Mathematics compared to only 20% of male graduates. Likewise, Computer Information Systems (CIS) was also favored by female students (56%) compared to (45%) of males who studied that subject. However, Computer Science and Application seemed to be favored by both male and female students with a percentage of (52% and 48%) respectively.
4. Discussion
The results generally demonstrated the real status of STEM Education in Jordan and particularly among university graduates. Data showed that university male students are in favor of pursuing a degree in almost every field of Engineering except Architectural and Medical Engineering. However, most female students study all fields related to Medical Sciences, Basic Sciences, and Mathematics. The only field that equally attracts both males and females is Computer Sciences and Applications.
These results reflect a striking disparity between the numbers of men and women in STEM education in Jordan. This disparity seems to be shaped by the classical social image of the job market preferences that favor hiring men to do certain jobs (i.e., Civil Engineering (96%) while favoring hiring women to do jobs related to medical fields such as (Clinical Nutrition and Dietetics, (97%), Medical Laboratory Sciences (86%), Physical and Occupational Therapy (81%), and Medical Imaging (65%) as well as teaching-related careers such as Biology (85%), Chemistry (74%), Physics (73%), and Mathematics (80%).
Research documents that in the past there were several assumptions for gender disparities in STEM such as women’s lack of ability due to their biological, innate, and/or immutable differences [
41]. However, recent studies give a role to the sociocultural factors that shape women’s choice of study and career [
15]. Some researchers argue that these sociocultural barriers that limit women’s entrance and advancement in STEM education, mainly come from the prejudices held by men about women [
4]. However, other researchers [
42] argue that both men and women can be involved in gender discrimination and gender disparity. While the attention was previously put on the biases of other people evaluating the work of women, a more complex hypothesis also looks at biases within both women and men themselves, including their preferences, biology, and social experiences that may encourage or discourage them from doing certain careers [
30].
The literature documents three major causes of gender disparity in STEM [
15,
43,
44]. One of these causes is attributed to the differences in abilities of both genders [
45], and the second cause deals with differences in both gender preferences, values, and lifestyle choices [
46,
47,
48], the third cause attributes the differences to the explicit and implicit bias among both genders themselves [
43,
49]. The following paragraphs provide more explanation of how these causes interplay and shape both genders’ choice of study as well as their career choice.
During the early time of the past century, researchers thought that differences in both genders’ abilities in Mathematics is the most important factor that creates such disparity [
45]. However, later during the 20th century, researchers figured out that the gender differences in Mathematics abilities were rapidly closing [
50]. Such a new understanding was derived from the accumulation of data about standardized tests (i.e., TIMSS, and PISA). This result was further supported by recent meta-analysis studies that showed that the gap between both genders in overall Mathematics abilities has significantly dropped. For example, researchers noted that the difference between US students in Mathematics abilities dropped to only with a small value, meaning that the differences between men and women on Mathematics assessments are negligible [
45].
In the context of this study (Jordan), the OECD 2018 report showed that girls scored similarly to boys in Mathematics, and girls outperformed boys in Science by 29 score points. Additionally, some researchers argue that culture and traditional societal norms could influence the performance of both genders in math [
51,
52]. However, the majority of researchers document that there is no convincing evidence that gender differences in Mathematics ability are immutable or biologically innate [
15,
45,
53,
54].
The second cause of variation in both genders’ performance in STEM is their preferences, values, and lifestyle choices [
14,
46,
47]. Or as Diekman named it the “goal congruity hypothesis” [
30]. The idea of Diekman’s hypothesis is that women make the choice, to stay away from pursuing a degree in STEM relying on both sociocultural pressures and innate psychological orientations. Such a conclusion was also proved in the report about Jordan students’ performance on the PISA test, where amongst high-performing students in mathematics or science, about 25% of boys in Jordan expect to work as an engineer or science-related profession, while one in nine girls expects to do so [
31]. Furthermore, the report indicates that about two in three high-performing girls expect to work in health-related professions, while about three in seven high-performing boys expect to do so. However, only 2% of boys and a negligible percentage of girls in Jordan expect to work in ICT-related professions [
31].
Studies show that both genders’ values and preferences arise during their early ages when they both experience social pressures to play certain social roles. Boys are expected to prefer competitive and active activities, while girls are expected to prefer communal and helping activities [
55]. Other researchers [
56] add that women appear to be active in the transfer of knowledge (TOK) than men do as they participate more in informal interactions (i.e., media) promoting TOK and less in other types of activities that may involve the creation of companies and spin-offs via patent trading. These socially influenced values impact both genders’ future choices regarding their education as well as their social or academic preferences. Such influences encourage women to play communal, caring, and family roles while encouraging men to perform self-serving, money, and status values [
48,
57,
58,
59].
Consequently, women tend to stay out of academic fields that are perceived to approve the status and competition (i.e, Engineering) and take more service, social, family and helping roles (i.e, Medical Sciences, teaching), while men tend to take competitive and high paying fields and jobs that align with their values (i.e, Civil Engineering) and stay away from other social and family roles that mismatch with their values [
60,
61].
The third cause of gender disparity is attributed to both genders’ explicit and implicit bias [
62]. While both explicit and implicit biases can be traced and identified through human responses, beliefs, and actions, explicit bias is easy to identify whereas implicit bias is more automatic and requires certain instruments to trace and identify. Studies have shown that these biases critically shape both genders’ beliefs and behaviors and significantly contribute to linking science to men and women to arts [
63]. Therefore, both explicit and implicit biases are important to understand to identify their impact on both genders’ academic and career choices. For instance, research over the past two decades shows that gender bias in STEM is crucial and visible across genders, nations, and time. Such persistence of these biases matches the frequency of gender disparities in STEM career choice, gender representation, pay, and recognition [
62,
64].
Recommendations for Overcoming Gender Disparity
Overcoming barriers that hinder females from pursuing their STEM education requires comprehensive efforts that target the causes of gender disparity. The following paragraphs present some important programs and interventions that contribute to strengthening female capacities, enhancing their social roles and values, and motivating them to pursue their university STEM education.
Probably one of the main causes that discourage Jordanian female students from continuing their STEM education is their preferences, values, and lifestyle choices. As mentioned above, females construct their self-identity and values during their early ages, therefore, they need support to help them develop their STEM identity to be confident about themselves and pursue their STEM degrees. Such goals can be achieved by involving girls during their school age in STEM camps, offering them focused workshops about STEM, and establishing STEM clubs at schools. The purpose of offering such activities is to expose female students to STEM from an early age to advance their belonging [
65] to science and math and mitigate the negative stereotypes about sex-based ability in math and science [
66,
67].
Additionally, exposing girls to female role models in STEM can significantly help them enhance their self-perceptions and confidence in STEM [
68]. Results from a global survey carried out among women working in technology found that 42% of participating women considered the lack of female role models as a strong barrier that prevent them from starting or progressing in their professional career [
69]. Furthermore, 33% of women attributed their underrepresentation in technology to the absence of women role models [
69]. Therefore, providing girls with an opportunity to see and interact with female role models who are progressing very well in their STEM careers throughout their school and university education is of great importance to help them raise their self-confidence [
66,
70,
71] and develop their own personalities and pursue their future education in STEM. Studies also suggested that girls who are more affected by gender stereotypes can significantly benefit from such STEM-focused interventions [
72].
Similarly, family-based, and peer-level interventions can greatly contribute to overcoming the misconceptions that girls do better in arts but not in science or math [
73]. Carefully designed experiences (that are designed for both parents and girls) can have a huge impact on raising both parents’ and girls’ awareness about STEM education and careers. When parents participate in such campaigns, they can play an active role in motivating their girls to engage in STEM activities and pursue their education in STEM fields [
74].
To further support individual and family-level interventions, educational institutions need to introduce system-wide improvements. Such improvements should include revising the educational policies and regulations (i.e., admission policy) to encourage females to engage in studying STEM and develop their interests, confidence, and career goals. A study conducted by the IEA found that improvements that were introduced twenty years to several education systems across the world resulted in improvements in students’ achievements in TIMSS results [
13,
75].
Additionally, educational institutions need to recruit male and female teachers and faculty members who have the needed knowledge and skills about STEM education to help stimulate their students’ interests and boost their motivation to learn about STEM. Considering hiring female teachers/faculty members can significantly influence female students’ pursuit of STEM studies and careers. Previous research studies have argued that increasing the opportunities for inclusion of underrepresented minorities including women will likely benefit the image of STEM as an enterprise and hence a better future for the job market and global STEM needs that cannot be met without the participation of both men and women [
76].
Furthermore, both teachers and university faculty members need to have access to continuous professional development opportunities to advance their STEM knowledge and skills. Participating in such opportunities will strengthen their capacities to be more gender-responsive and impact their students’ interest and motivation in STEM [
66,
75,
77,
78]. Relevant studies identified several teaching strategies that can improve female students’ engagement, motivation, and attitudes toward STEM. These strategies include inquiry-based learning, ICT-based learning, and collaborative learning [
66,
78,
79,
80,
81,
82].
Moreover, revising school science curricula to make them more STEM-oriented can help enhance female students’ interest and engagement in STEM learning [
83]. Curriculum revision should also remove any gender bias from the learning content, illustrations, images, and activities to make the curriculum more gender-friendly. Gender disparities are likely to disappear from STEM-related disciplines if both male and female students have opportunities to continuously discuss and engage in STEM education with peers in STEM-related activities, be afforded opportunities to conduct research, and learn in authentic environments that reflect the essence of STEM. Previous research findings suggest that successful STEM education programs realized the importance of such engaging activities in developing a meaningful understanding of and connection to STEM as a future career with a wider prospect, high priorities, and enhanced processes to promote this field to deal with current and future problems [
84].
In addition to that, reserving STEM scholarships for female students at the university level can enhance their engagement and learning in STEM. These scholarships could be offered by private sectors, companies, and factories to help encourage females to pursue their education in STEM. Furthermore, implementing positive programs at both school and university levels that encourage female faculty members visit high schools can be considered a social persuasion intervention that encourages high female school students to consider pursuing their education in STEM or at least emphasizes that STEM education is open to both gender [
85].
One last thing to consider at the societal level is to utilize media channels to promote positive images about women in STEM. Such utilization can significantly promote gender-diverse representation in STEM [
86] and contributes to eliminating stereotypes about STEM [
87].
5. Conclusions
This study investigated the problem of gender disparity in STEM education in Jordan. It proved that gender diversity gap in STEM fields is composed of many factors. Each of these factors has a different impact and would require specific action (social, educational, political) of several actors and institutions in order to achieve a real change towards a better gender involvement and contribution of females in STEM fields.
The study also proved that gender disparity in STEM in Jordan appears to be mainly originated from differences in both gender’s preferences, values, and lifestyle choices, and differences in the explicit and implicit bias among both genders themselves. Several interventions at the individual, family, school, and society levels have been suggested and can be easily implemented to remove the impediments that discourage female students from pursuing their education in STEM and ultimately from working in STEM careers. Urgent multisectoral efforts are needed to address gender disparity and spark women’s interests and cultivate their ambitions to pursue STEM studies.
We believe that implications at policy levels at different points of cognitive and social development presents challenges from childhood through adulthood. We emphasized that engaging female students in school-based science and Mathematics activities during their early ages is crucial in igniting their interest in science and mathematics. Interventions at this point can significantly play a pivotal role not only in changing cultural stereotypes about STEM, but also in forming more gender-equal beliefs in the first place. Sustained interventions throughout the later developmental levels is crucial to maintain female motivation and interests in STEM education.
While we tried to highlight the status of gender disparity problem in STEM education in Jordan, we believe that some of the insights we offered could be transferred and applied in different contexts, we suggest that implementers need to adjust/modify some of these offered interventions to better suit their contextual differences.
Lastly, it is important to note that the results of this study may have limited generalizability because of the data taken from one country (Jordan) and the case may be different in other countries. Therefore, future studies in this area can be extended by conducting similar studies in other countries or even conduct comparison studies to grasp a better understanding of the case of STEM education around the world.


