Article

Effects of Dynamic Changes of Soil Moisture and Salinity on Plant Community in the Bosten Lake Basin

1
College of Resources and Environment, Xinjiang University, Urumqi 830046, China
2
College of Geography Science and Tourism, Xinjiang Normal University, Urumqi 830054, China
*
Author to whom correspondence should be addressed.
Sustainability 2022, 14(21), 14081; https://doi.org/10.3390/su142114081
Submission received: 30 August 2022 / Revised: 23 October 2022 / Accepted: 24 October 2022 / Published: 28 October 2022
(This article belongs to the Special Issue Landscape and Ecosystem Services Change in Arid Regions)

Abstract

:
To estimate the potential risks of plant diversity reduction and soil salinization in the Bosten Lake Basin, the dynamic changes in the plant community and species diversity affected by soil moisture and salinity were analyzed from 2000 to 2020 based on remote sensing technology and field experiments. A model for simulating soil moisture, salinity, and the productivity of the plant communities was proposed. The results demonstrated that: (1) The soil moisture index (SMI) increased but the soil salinity index (SSI) decreased from 2000 to 2020 in the study areas. Accordingly, the plant community productivity indices, including the vegetation index (NDVI), enhanced vegetation index (EVI), and ratio vegetation index (RVI), exhibited an increasing trend. It was found that the Alpine meadow, Alpine steppe, and temperate steppe desert were the main types of plant communities in the study areas, accounting for 69% of its total area. (2) With increasing SMI or decreasing SSI, the vegetation productivity such as NDVI, RVI, and EVI all exhibited an increasing trend. With the increment of SMI, the species diversity indices of the Simpson, Shannon–Wiener, and Margalef exhibited a distinctly increasing trend. However, the indices of the Simpson, Shannon–Wiener, and Alatalo increased with the decreasing SSI. (3) The study discovered from the SVM model that the species diversity index was optimal when the soil salinity was 0–15 g/kg and the soil moisture was 12–30% in the study areas. It was found that soil moisture, not soil salinity, controls the plant species diversity change in the study areas. (4) A multiple linear regression model was established for simulating the effect of soil water-salinity on the vegetation productivity index at the watershed scale. The model indicated that higher salinity would reduce vegetation productivity and higher soil moisture would promote vegetation growth (except for RVI). The SSI had a higher impact on NDVI and EVI than the SMI in the study areas. This study would support decision-making on grassland ecosystem restoration and management in the other arid areas.

1. Introduction

The species diversity and productivity of plant communities play important roles in maintaining ecosystem stability and biodiversity [1,2]. Especially in the arid areas, hydrological processes, topography, soil moisture, salinity, and other environmental factors affect the ecological dynamics of plant communities [3]. This affects the direction and degree of biological processes in the ecosystem, while its instability strongly restricts the developing direction of the ecosystem [4]. The strong spatial heterogeneity of soil moisture and salinity, which is controlled by many environmental factors, including topography, hydrological processes, and land use, determines the spatial distribution of the vegetation [5]. The key components of hydrological processes include precipitation [6,7], surface water [8], and groundwater [9]. They all change the soil moisture and salinity of a habitat and then significantly affect the composition and productivity of plant communities [10]. Thus, studies on the relationships between plant communities and soil water or salt gradients would help to understand the current habitat conditions and can help identify future changes of surface ecosystems [11,12].
Several studies have been conducted on the effect of soil salinity on plant species diversity and community structure [13,14,15]. High soil salinity can reduce the primary production of some natural plant communities and can affect plant community structures [16,17]. In turn, the magnitude of plant community responses to modifications in soil salinity depends on their structures and compositions [18]. Several studies indicated that the soil moisture and salinity both affected the distribution and ecological response of plant communities [15,19]. The soil moisture and salinity variation are the main environmental factors that affect the composition, result, function, and succession of plant communities [20]. However, few studies have considered the temporal dynamics of species composition and structure characteristics caused by plant community growth [12,21] and few have focused on qualifying the contribution of soil moisture or salinity to the plant community at a watershed scale.
In the past 50 years, natural ecological processes in the Bosten Lake Basin have been changed significantly due to intense human activities with the development and utilization of water resources [22]. As a result, the natural vegetation has been replaced mostly by farmland, leading to soil salinization. The lake salinity increased, the balance of the Bosten Lake wetland ecosystem was damaged, plant biodiversity was reduced, and sustainable development was affected adversely in the basin [23]. The influence of soil moisture and salinity on the succession of plant communities must be examined to provide information that a decision-maker can use to protect and facilitate the integrated management of the Bosten Lake Basin ecosystems.
Based on the remote sensing technology and field monitoring, this paper analyzed the effect of the soil moisture and salinity change on the productivity, distribution, and composition of the natural plant community from 2000 to 2020 in the Bosten Lake Basin. The specific objectives of this paper are to: (1) characterize and compare spatial-temporal characteristics of the soil moisture, soil salinity, and natural plant community in the Bosten Lake Basin; (2) discuss the effects of soil moisture/salinity and their interaction on natural plant community change; (3) propose a model for soil moisture, salinityand plant community change in the study area. The results of this study will contribute for controlling soil moisture or salt and protecting the terrestrial ecosystem and animal husbandry development in the Bosten Lake Basin.

2. Materials and Methods

2.1. Study Area

The Bosten Lake Basin is located in Xinjiang, northwest China and mainly includes Heshuo County, Hejing County, Yanqihui Autonomous County, and part of Bagrax County. The spatial boundaries of the study area are as follows: 41°21′19″–43°21′34.8″ N. and 82°54′10″–88°21′06″ E. Its total area is 43,930 km2 with altitudes of 1008–4801 m. In terms of topography, the region has high elevations in its northwest region and low elevations in the southeast. The study area consists mainly of the Kaidu River Basin (including the Greater and Lesser Yudus basins), Huangshuigou River Basin, Qingshuihe River Basin, Wushtala River Basin, Yanqi Basin, and more than 20 smaller river basins (Figure 1).
The Bosten Lake Basin is characterized by a temperate continental arid climate. The annual average precipitation is only 60 mm, with more than 80% occurring in summer and while annual average evaporation is 2368 mm [24]. The water supply of the rivers in the basin depends mainly on melting ice and snow from the mountains and rainfall. There are different land covers in the Bosten Lake Basin including a glacier snow belt, meadow steppe belt, oasis plain, desert steppe and desert belt, and the Bosten Lake area with the decrease in the elevation [25].

2.2. Remote Sensing Data

The remote sensing data used were the Tier 1 data from the Landsat TM/ETM+/Oli sensors. The Landsat data were processed using the QA band generated by the CFMASK algorithm, a cloud, and a cloud shadow mask to retrieve nearly cloudless images. The band assimilation coefficient of the Landsat series data proposed by Roy was applied to assimilate the data from the three sensors [26]. The Landsat time series data from the Bosten Lake Basin included 305 Landsat-5 data images; 1114 Landsat-7 data images; and 528 Landsat-8 data images from 2000 to 2020. In total, 1947 images were processed using the remote sensing big data platform.

2.3. Investigation of Plant Community Types and Diversity

Field surveys were conducted in the lake and plain area and the Piedmont alluvial fan of the Hoe San Estate in the Bosten Lake Basin from May to July 2020. A total of 43 sample plots of typical vegetation types were selected. Ecological indices such as plant species, quantity, canopy width, coverage, growth tendency, and community types were measured. In order to meet the sample statistical requirements, three samples were randomly selected from each typical plant community sample plot. The tree sample size was 10 m × 10 m, the shrub sample size was 5 m × 5 m, and the herb sample size was 1 m × 1 m. Soil samples were extracted from each sampling area according to the three-point sampling method. The soil sample depths were 0–10 cm, 10–20 cm, and 20–30 cm. The soil samples were analyzed in the laboratory in terms of their soil moisture and soil salinity. The soil moisture content is 15–24%, the soil salinity is 10–20 g/kg in the study areas. The plant communities in the study area were classified based on the field survey data and the results of classifications of vegetation in the Xinjiang grasslands (Table 1).

2.4. Data Processing and Calculation Methods

In this study, based on the series data from the Landsat, the normalized difference vegetation index (NDVI), enhanced vegetation index (EVI), ratio vegetation index (RVI), soil salinity index (SSI), and soil moisture index (SMI) were utilized to quantify the spatial and temporal change of plant communities. The calculation formulas are presented in Table 2.
In order to remove noise and canopy structure information from Landsat data, this paper uses the spectral index of soil moisture or salt salinity as following:
R I ( i , j ) = R i R j  
N D I ( i , j ) = ( R i R j ) ( R i + R j )  
D I ( i , j ) = R i R j    
where R I ( i , j ) is the ratio spectral index, N D I ( i , j ) is the normalized spectral index, D I ( i , j ) is the difference spectral index, and i and j are any two-band data from the Landsat OLI data band.
The Support Vector Regression (SVR) is accurate for the challenge of the non-linearity due to the high generalization characteristics of the Support Vector Machine (SVM) models [32,33]. Thus, the SVM model is adopted to construct the regression model among the spectral index of soil moisture, salt salinity, and plant diversity. Based on the 43 pixels data of RI, NDI, and DI from Landsat and the 43 sampling data of the soil moisture and salt salinity from field investigation, 30 groups of data were selected for modeling randomly and 13 groups were used to validate the results.
The plant species diversity indices are analyzed using the Margalef, Simpson, Shannon–Wiener, and Alatalo indices [34], as shown in Equations (4)–(7), respectively:
M a r g a l e f   i n d e x = ( S 1 ) L n   N  
S i m p s o n   i n d e x = 1 L n [   i = 1 s ( N i N ) 2   ]  
S h a n n o n W i e n e r   i n d e x = P i ln P i  
A l a t a l o   i n d e x = [ 1 ( P i 2 ) 1 ] / [ exp ( P i l n P i ) 1 ] ; P i = N i / N
where S is the total number of species in a sample, N is the total number of individuals in a sample, Ni is the number of individuals of species i, and Pi is the proportion of the number of individuals of species i to the total number.

3. Results

3.1. Dynamic Characteristics of Soil Moisture, Salinity, and Plant Communities in the Bosten Lake Basin

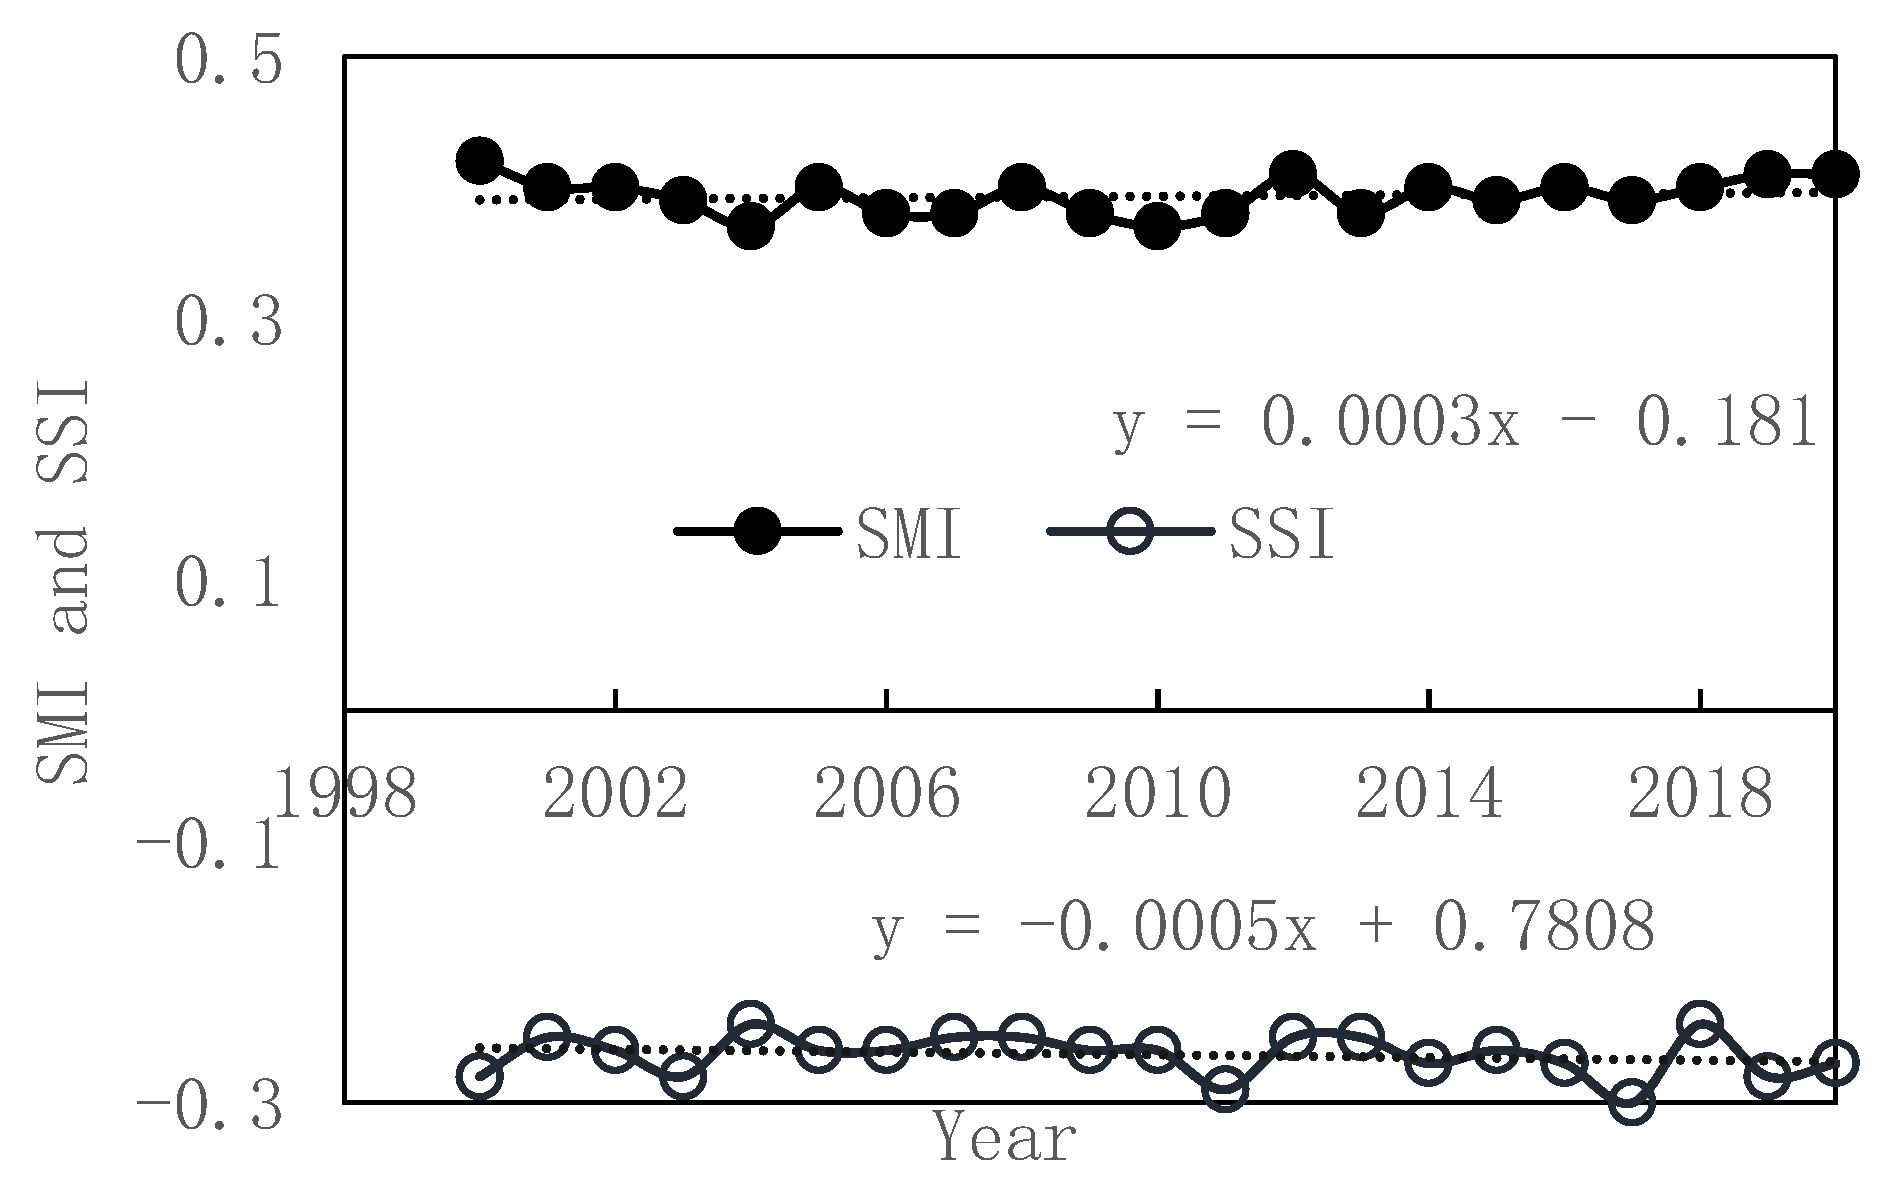
The SMI and SSI were analyzed as shown in Figure 2. The SMI values exhibited a gradually increasing trend and the increased rate is 0.003/10a from 2000 to 2020. Firstly, the SMI values decreased from 2000 to 2004. Then, they exhibited some variability from 2005 to 2010. Finally, they increased gradually from 2011. The SSI exhibited a decreasing trend and the decreased rate was 0.005/10a. It increased from 2000 to 2010, was up to the minima value in 2017, and began to increase since 2017.
Figure 3 showed that the vegetation productivity, such as the NDVI, EVI, and RVI, exhibited a similar increasing trend from 2000 to 2020 in the study areas. The value of NDVI fluctuated between 0.22 and 0.28 and was 0.25 averagely over the 21-year period. The value of EVI was 0.56 averagely and varied between 0.50 and 0.64. The RVI varied between 1.78 and 2.22, was 2.00 averagely, and showed a generally increasing trend.
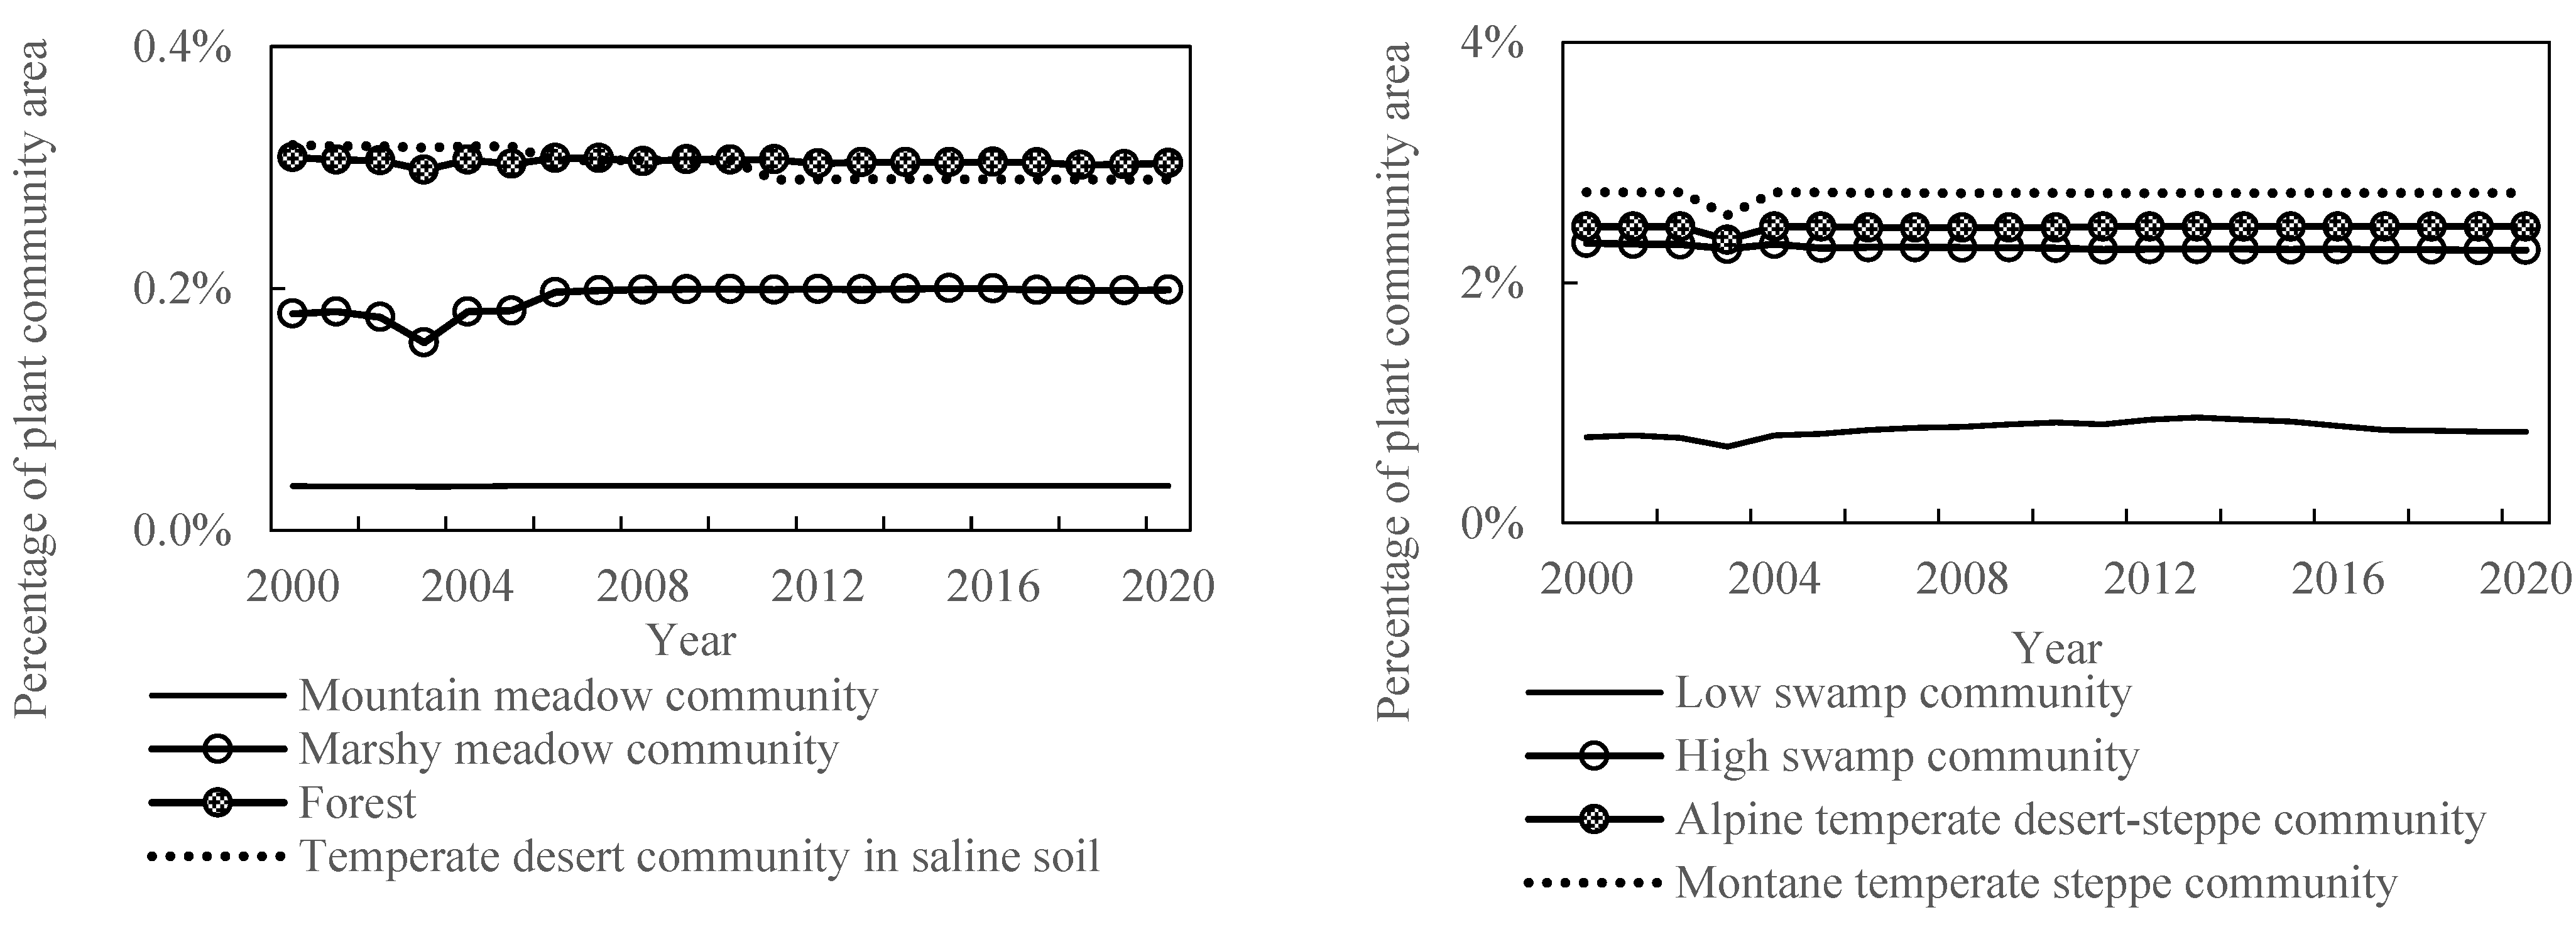
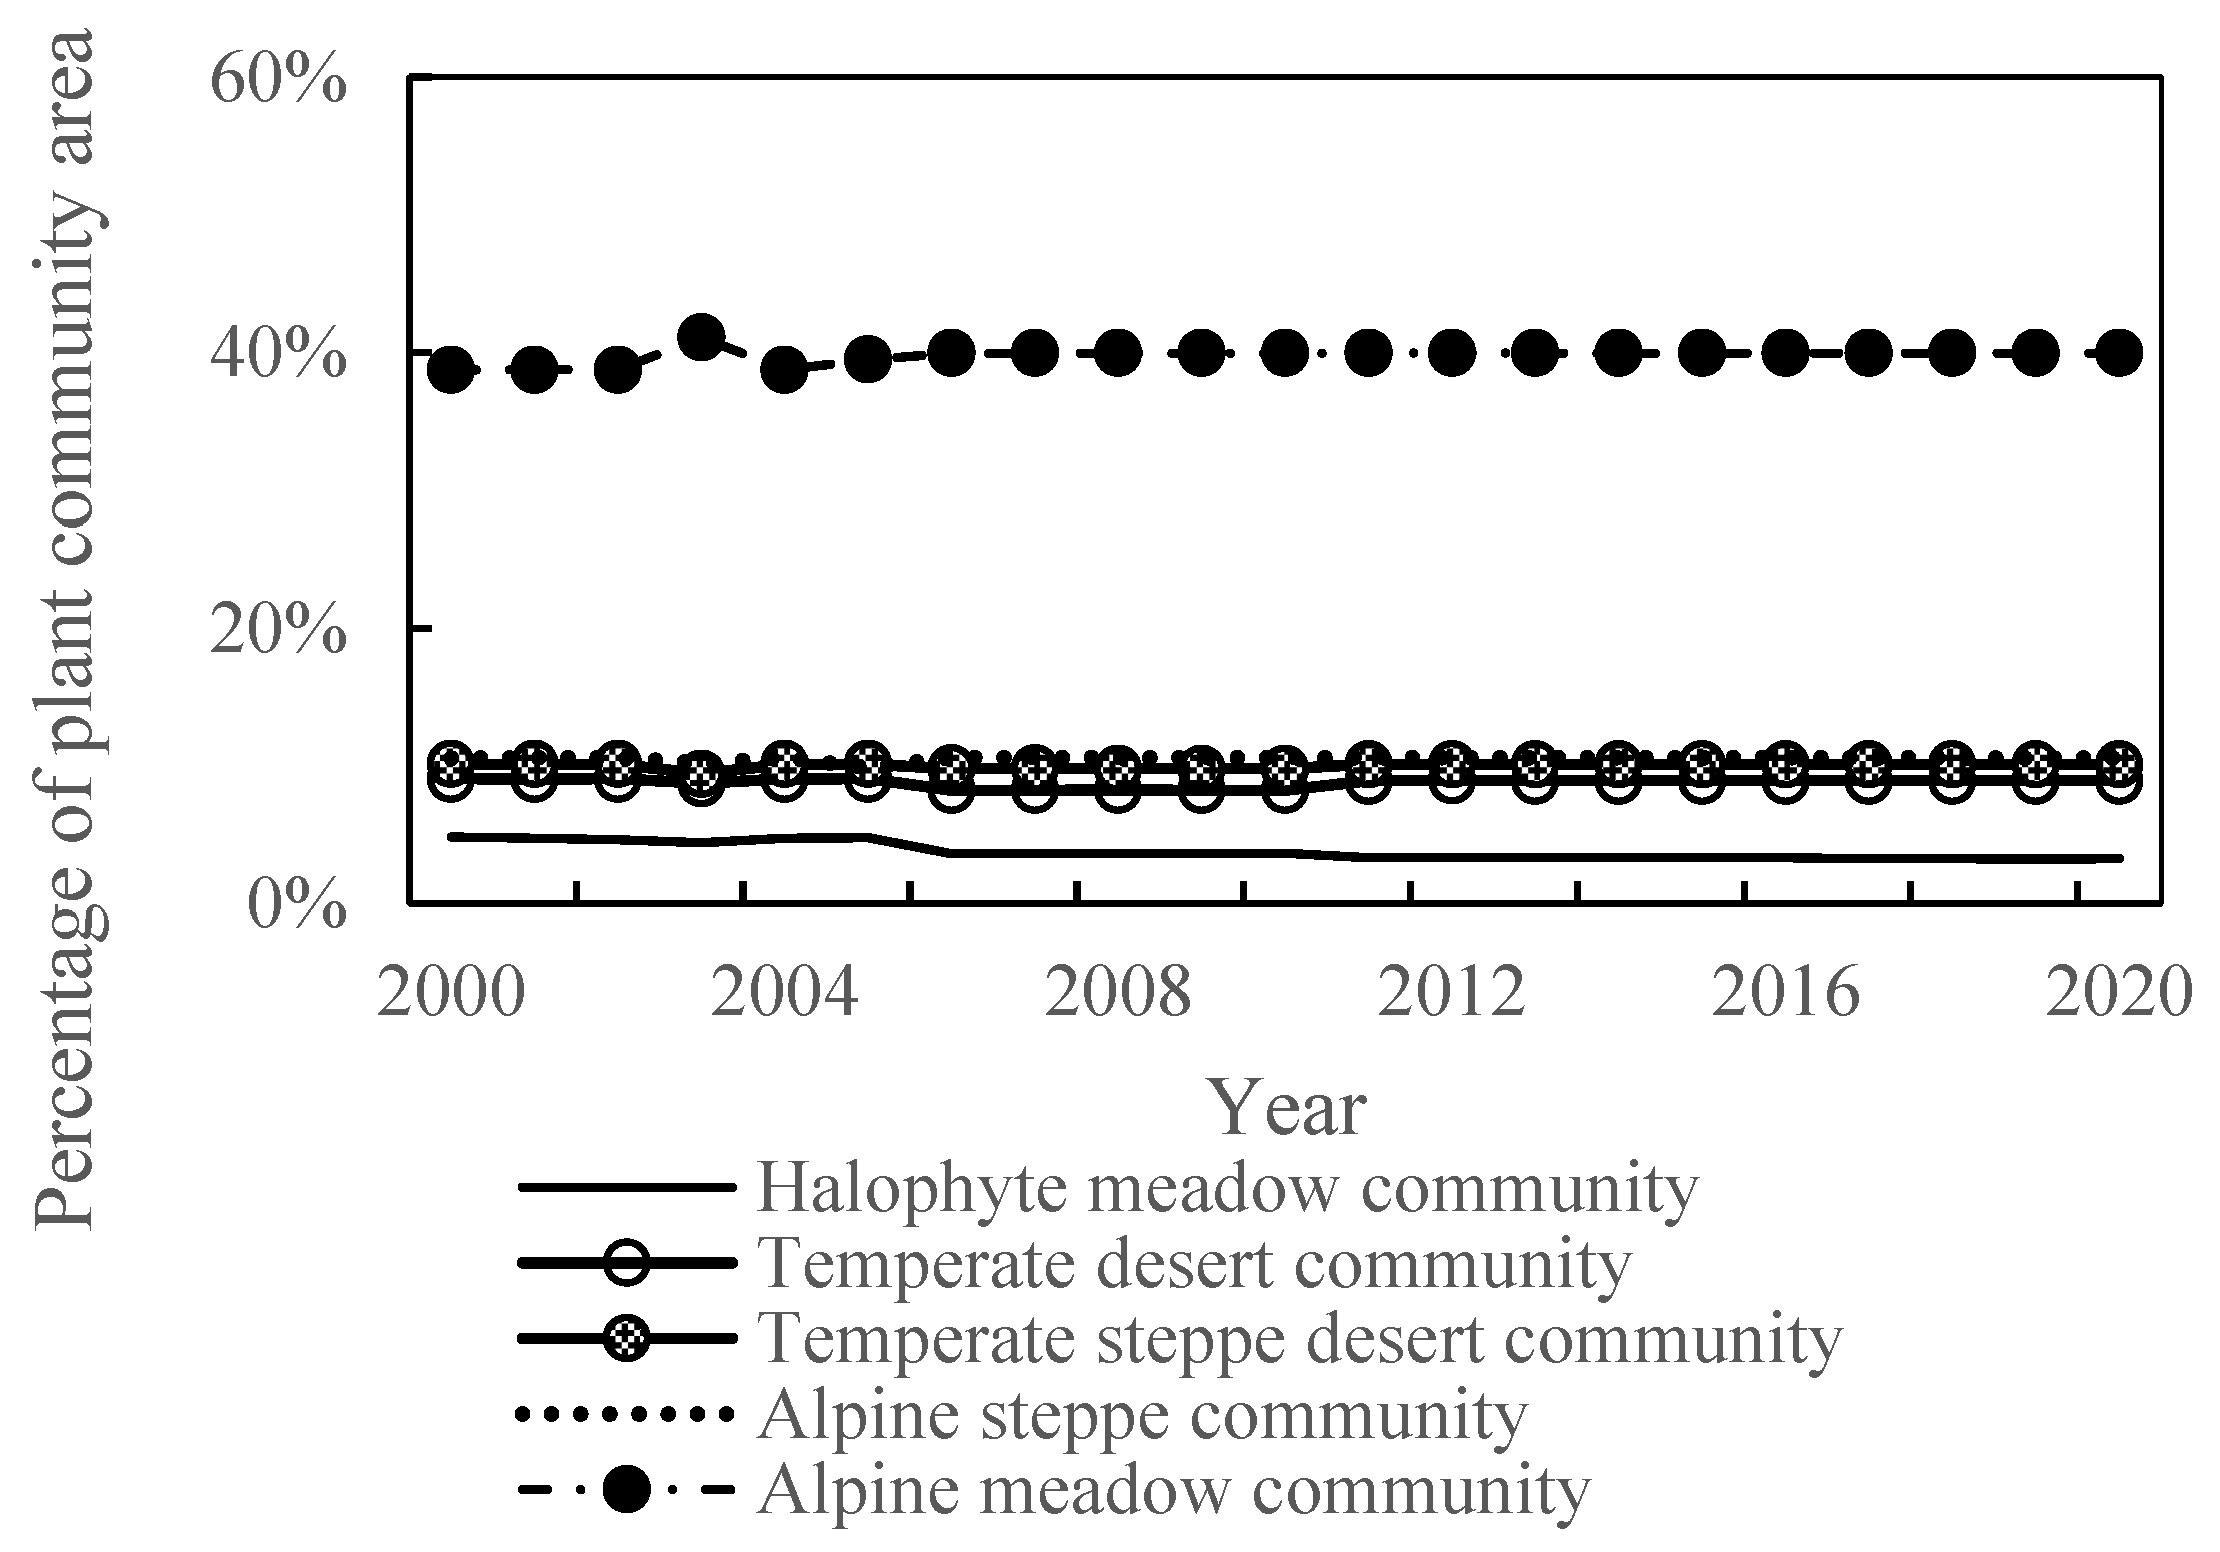
There were significant differences among the area percentage of the different plant community types in the study areas (Figure 4). Alpine meadow, Alpine steppe, and temperate steppe desert were found to be the main community types in the basin, accounting for 69% of the total area. Temperate steppe and lowland halophytic meadow communities were predominant, accounting for 9% of the total communities. The plant community with the smallest area was the mountain meadow community (0.04%). The proportions of the areas of different plant communities in the study areas can be classified in the following order: Alpine meadow community > Alpine steppe community > Temperate steppe desert community > Low swamp community > Mountain temperate steppe community > Temperate desert community > High swamp community > Sub-class of sandy temperate desert community > Mountain meadow community.

3.2. Relationship between Soil Characteristics and Plant Productivity in the Bosten Lake Basin

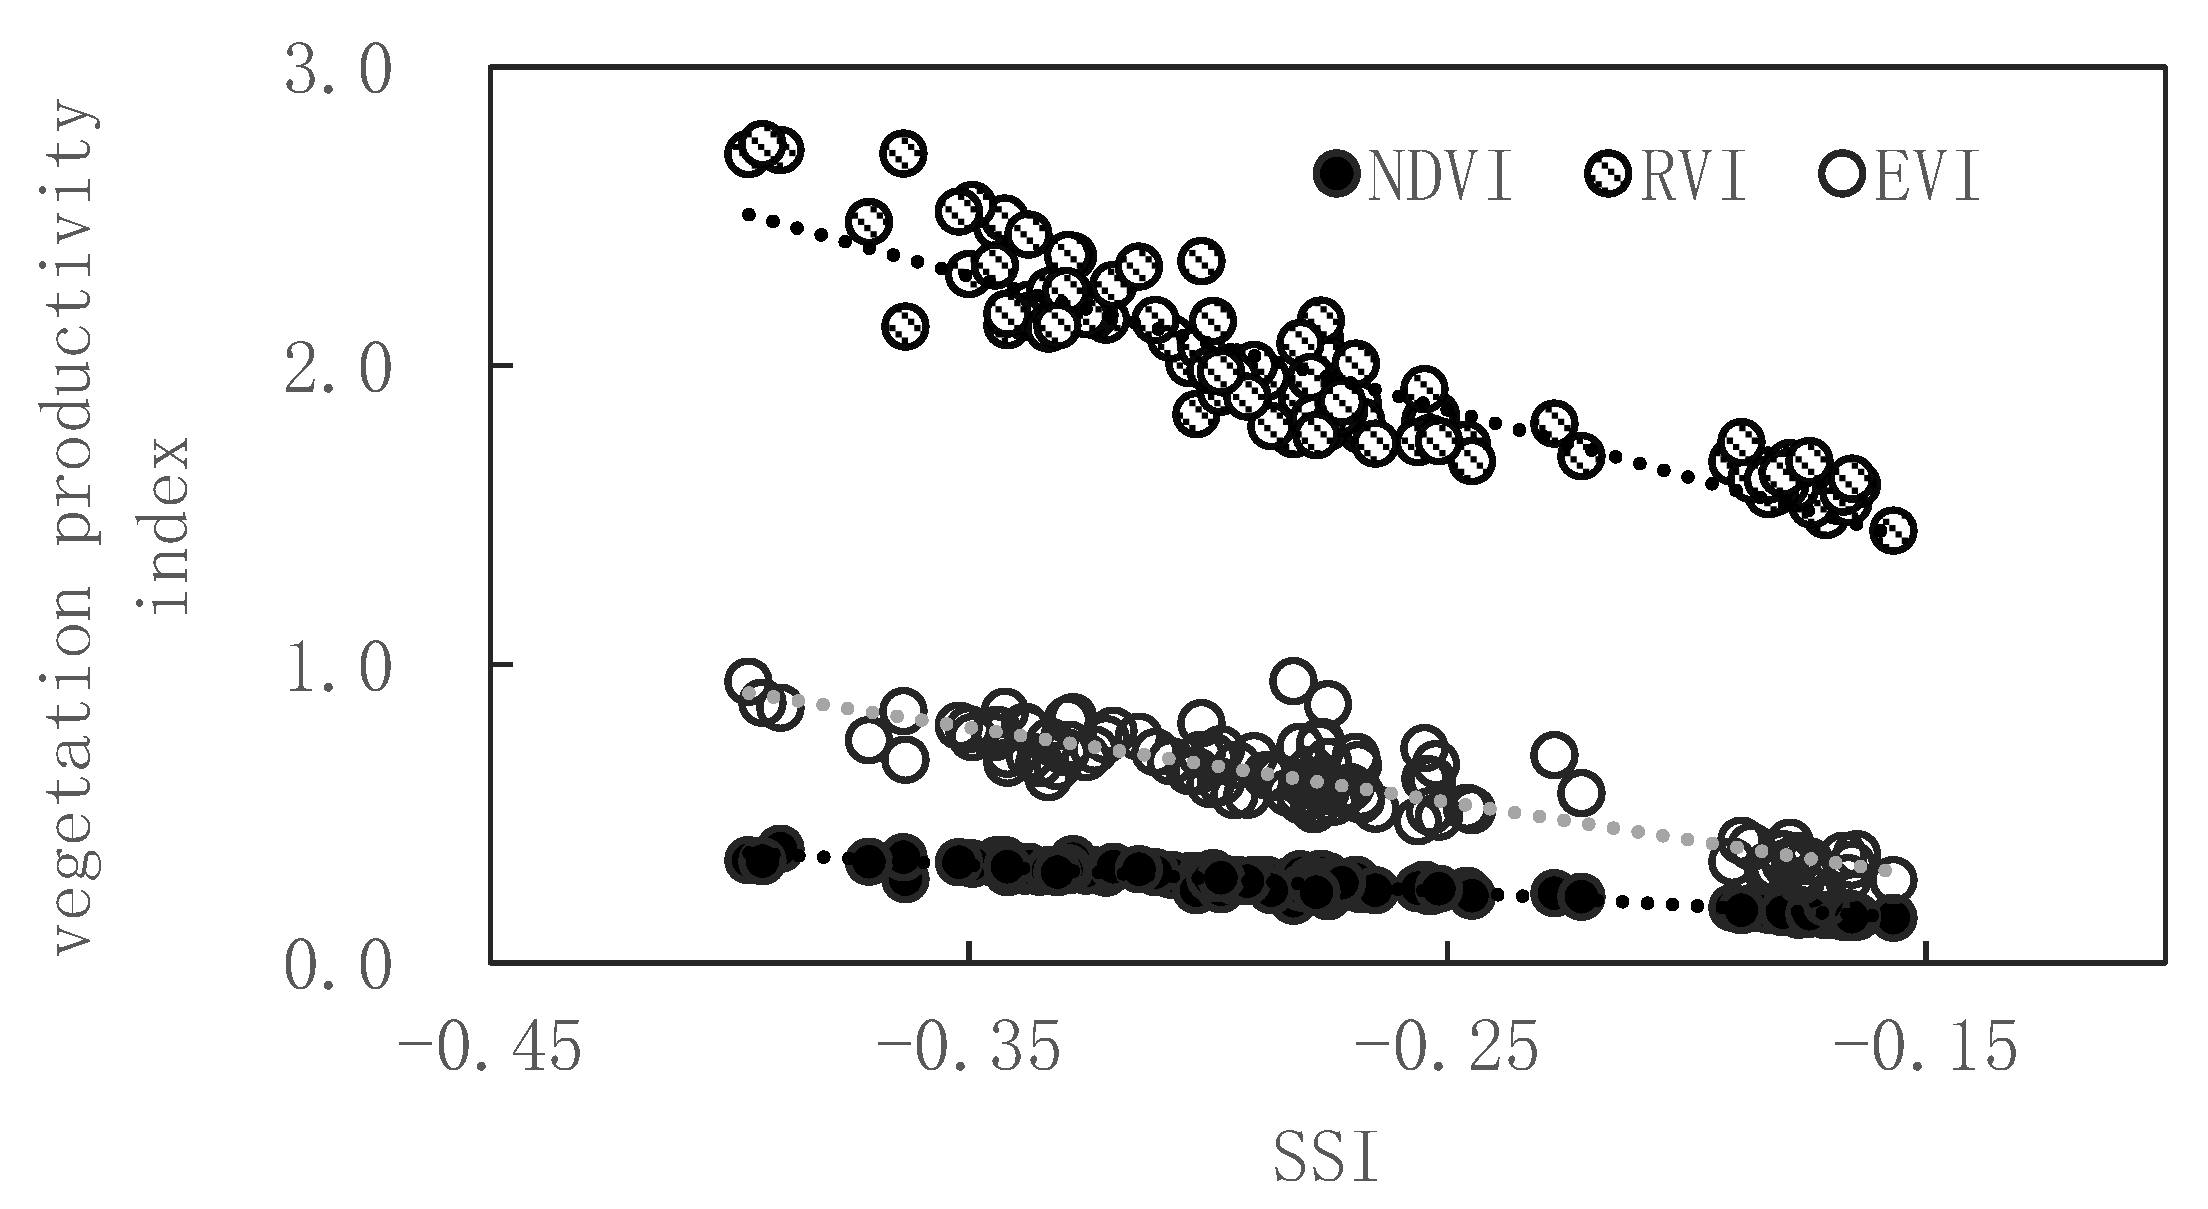
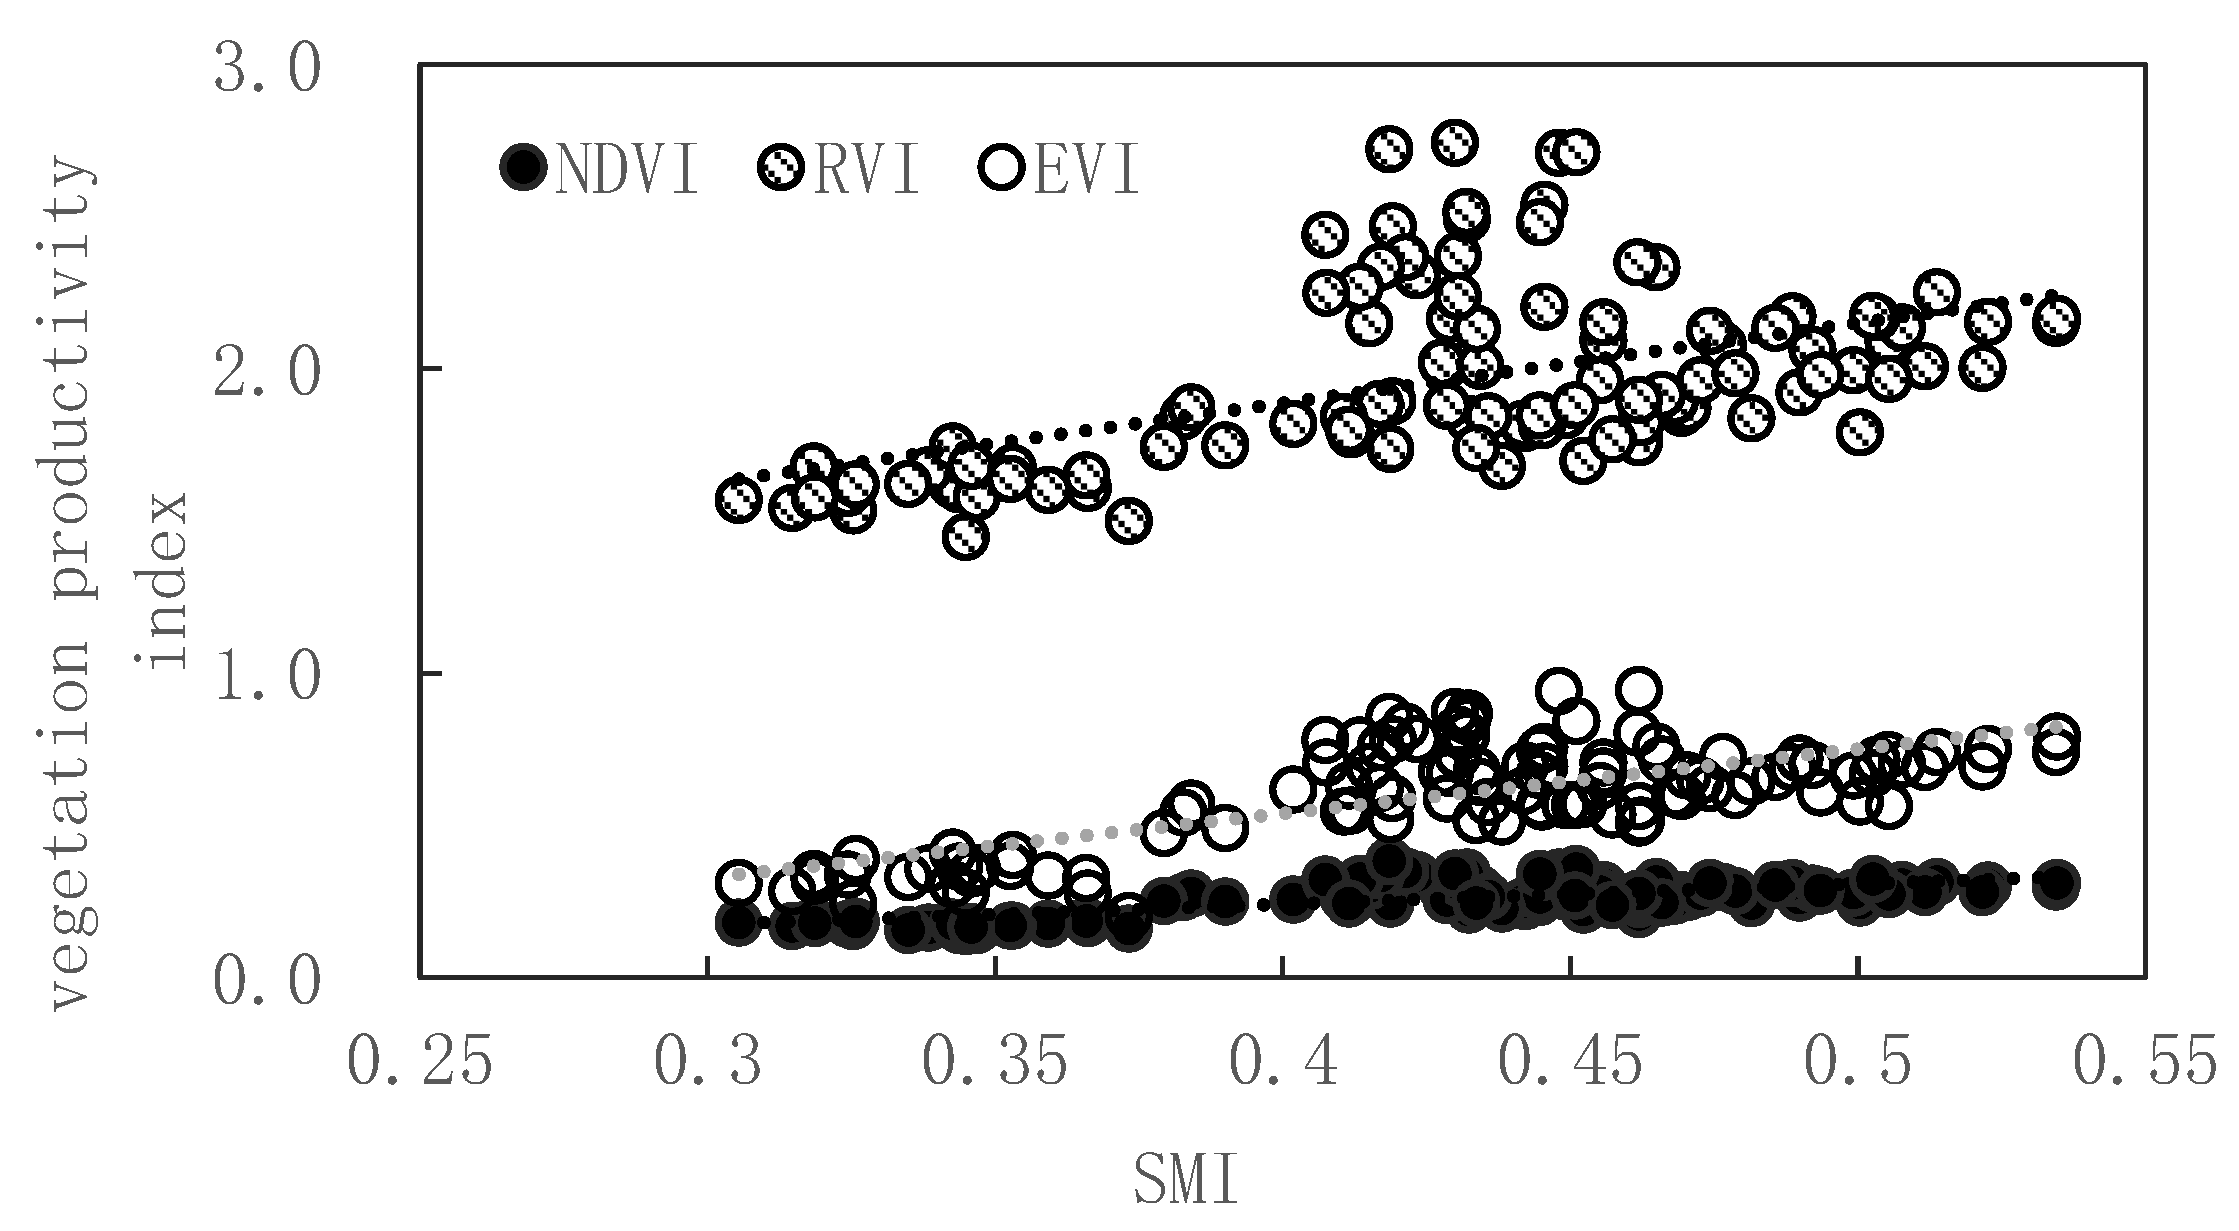
The effects of soil moisture and salinity on the productivity of the vegetation communities were analyzed in Figure 5 and Figure 6. The value of the NDVI, RVI, and EVI all exhibited decreasing trends with the increasing SSI. The value of the NDVI, RVI, and EVI all decreased with the increase in the SMI.
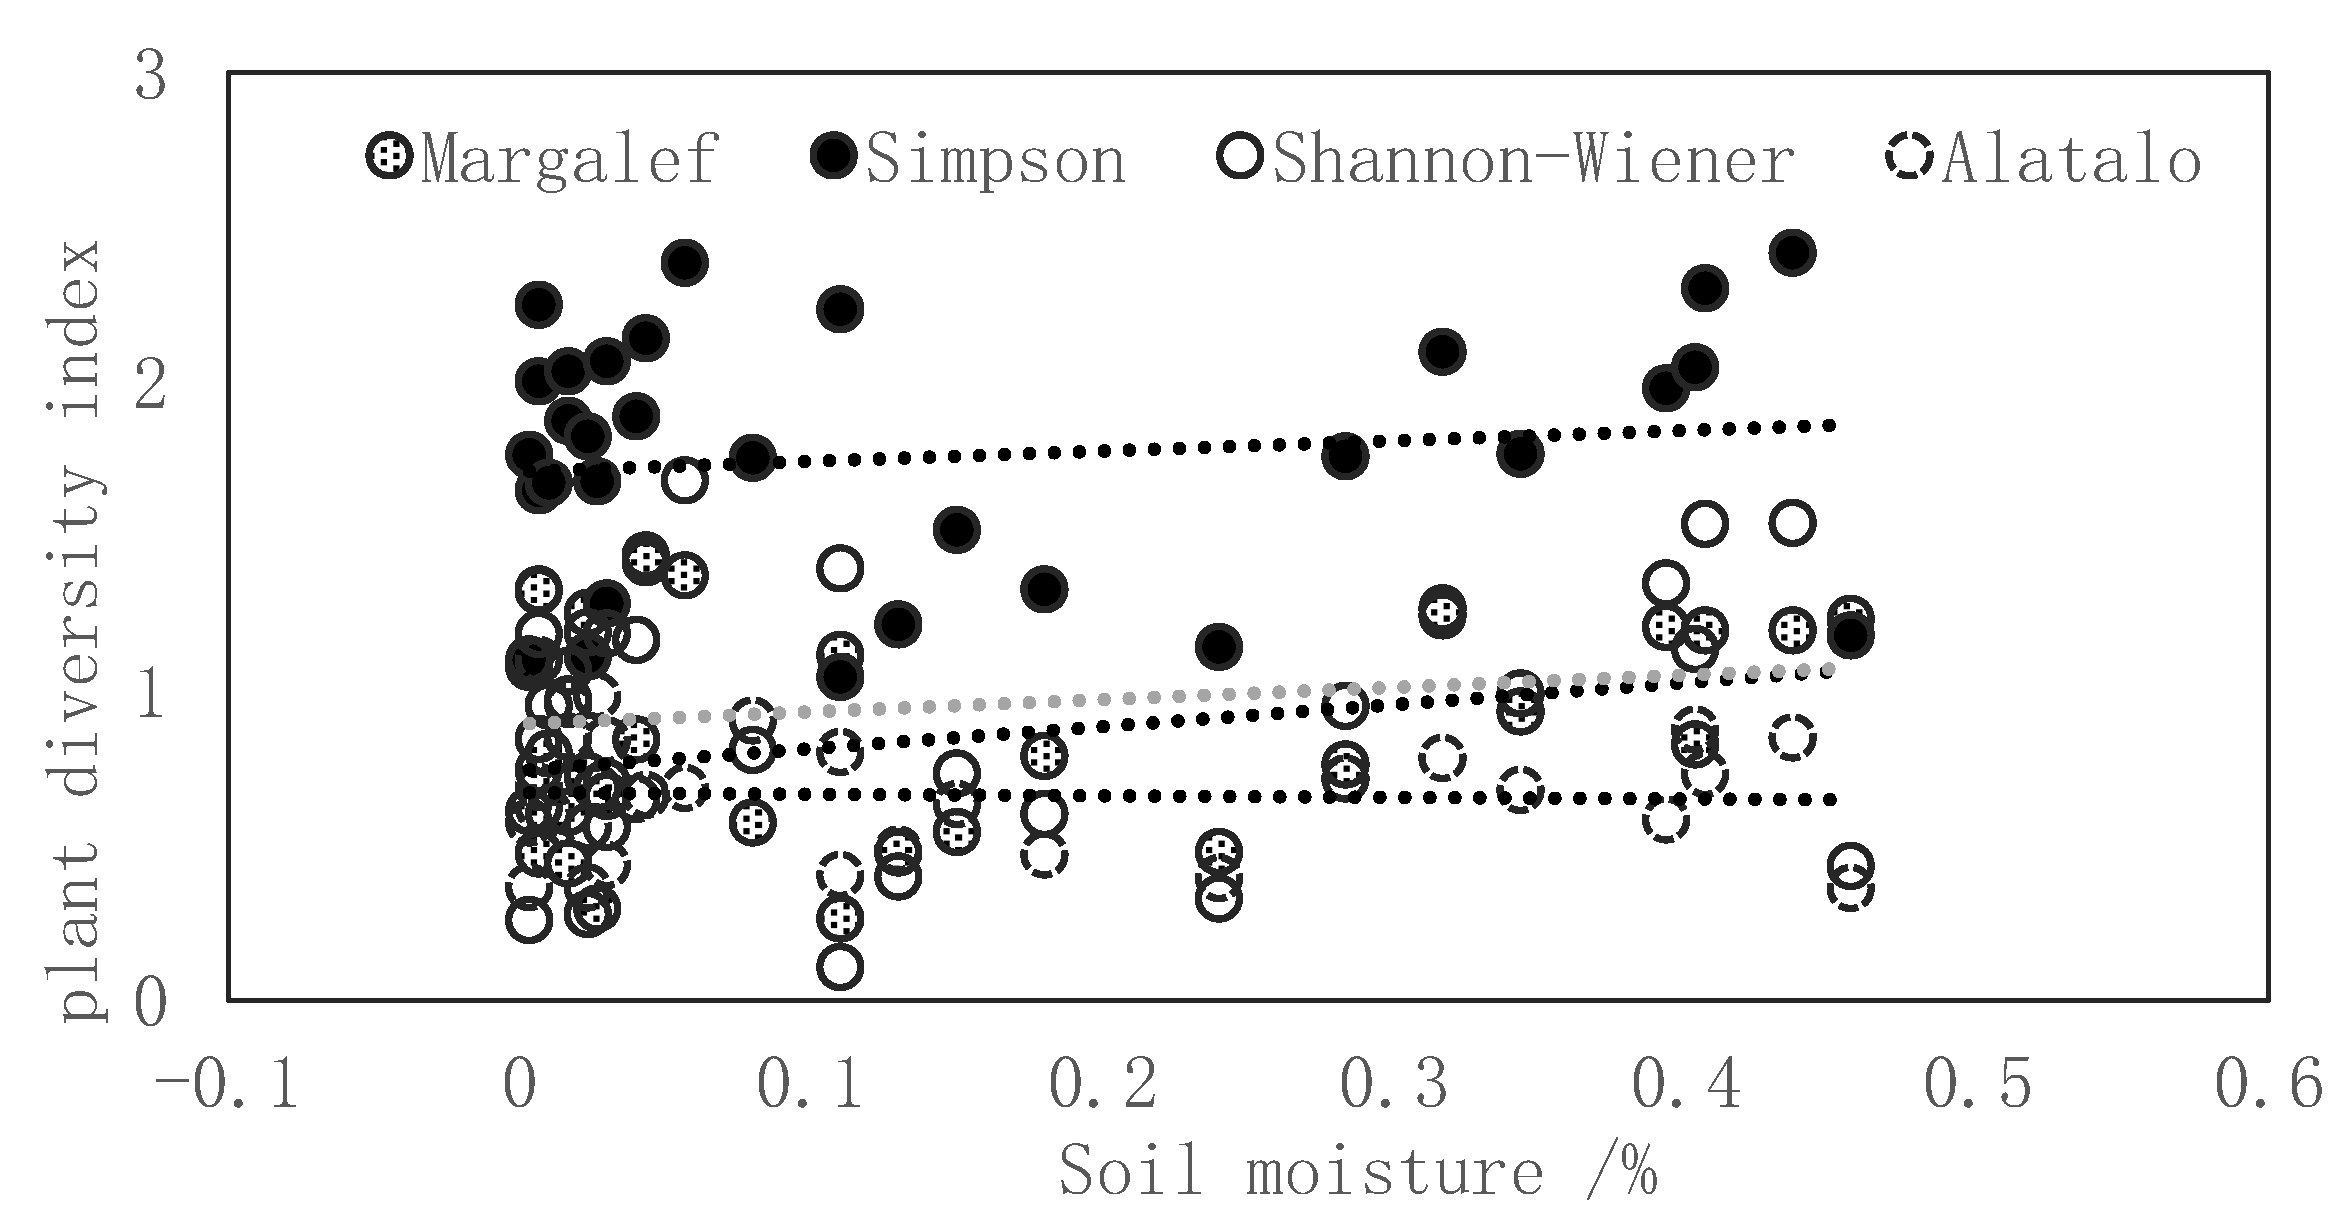
The investigation data from Figure 7 showed the effects of soil moisture and salinity on plant species diversity in the Bosten Lake Basin. The indices of the Margalef, Simpson, and Shannon–Wiener except for the Alatalo exhibited distinctly increasing trends with the increasing soil water content.
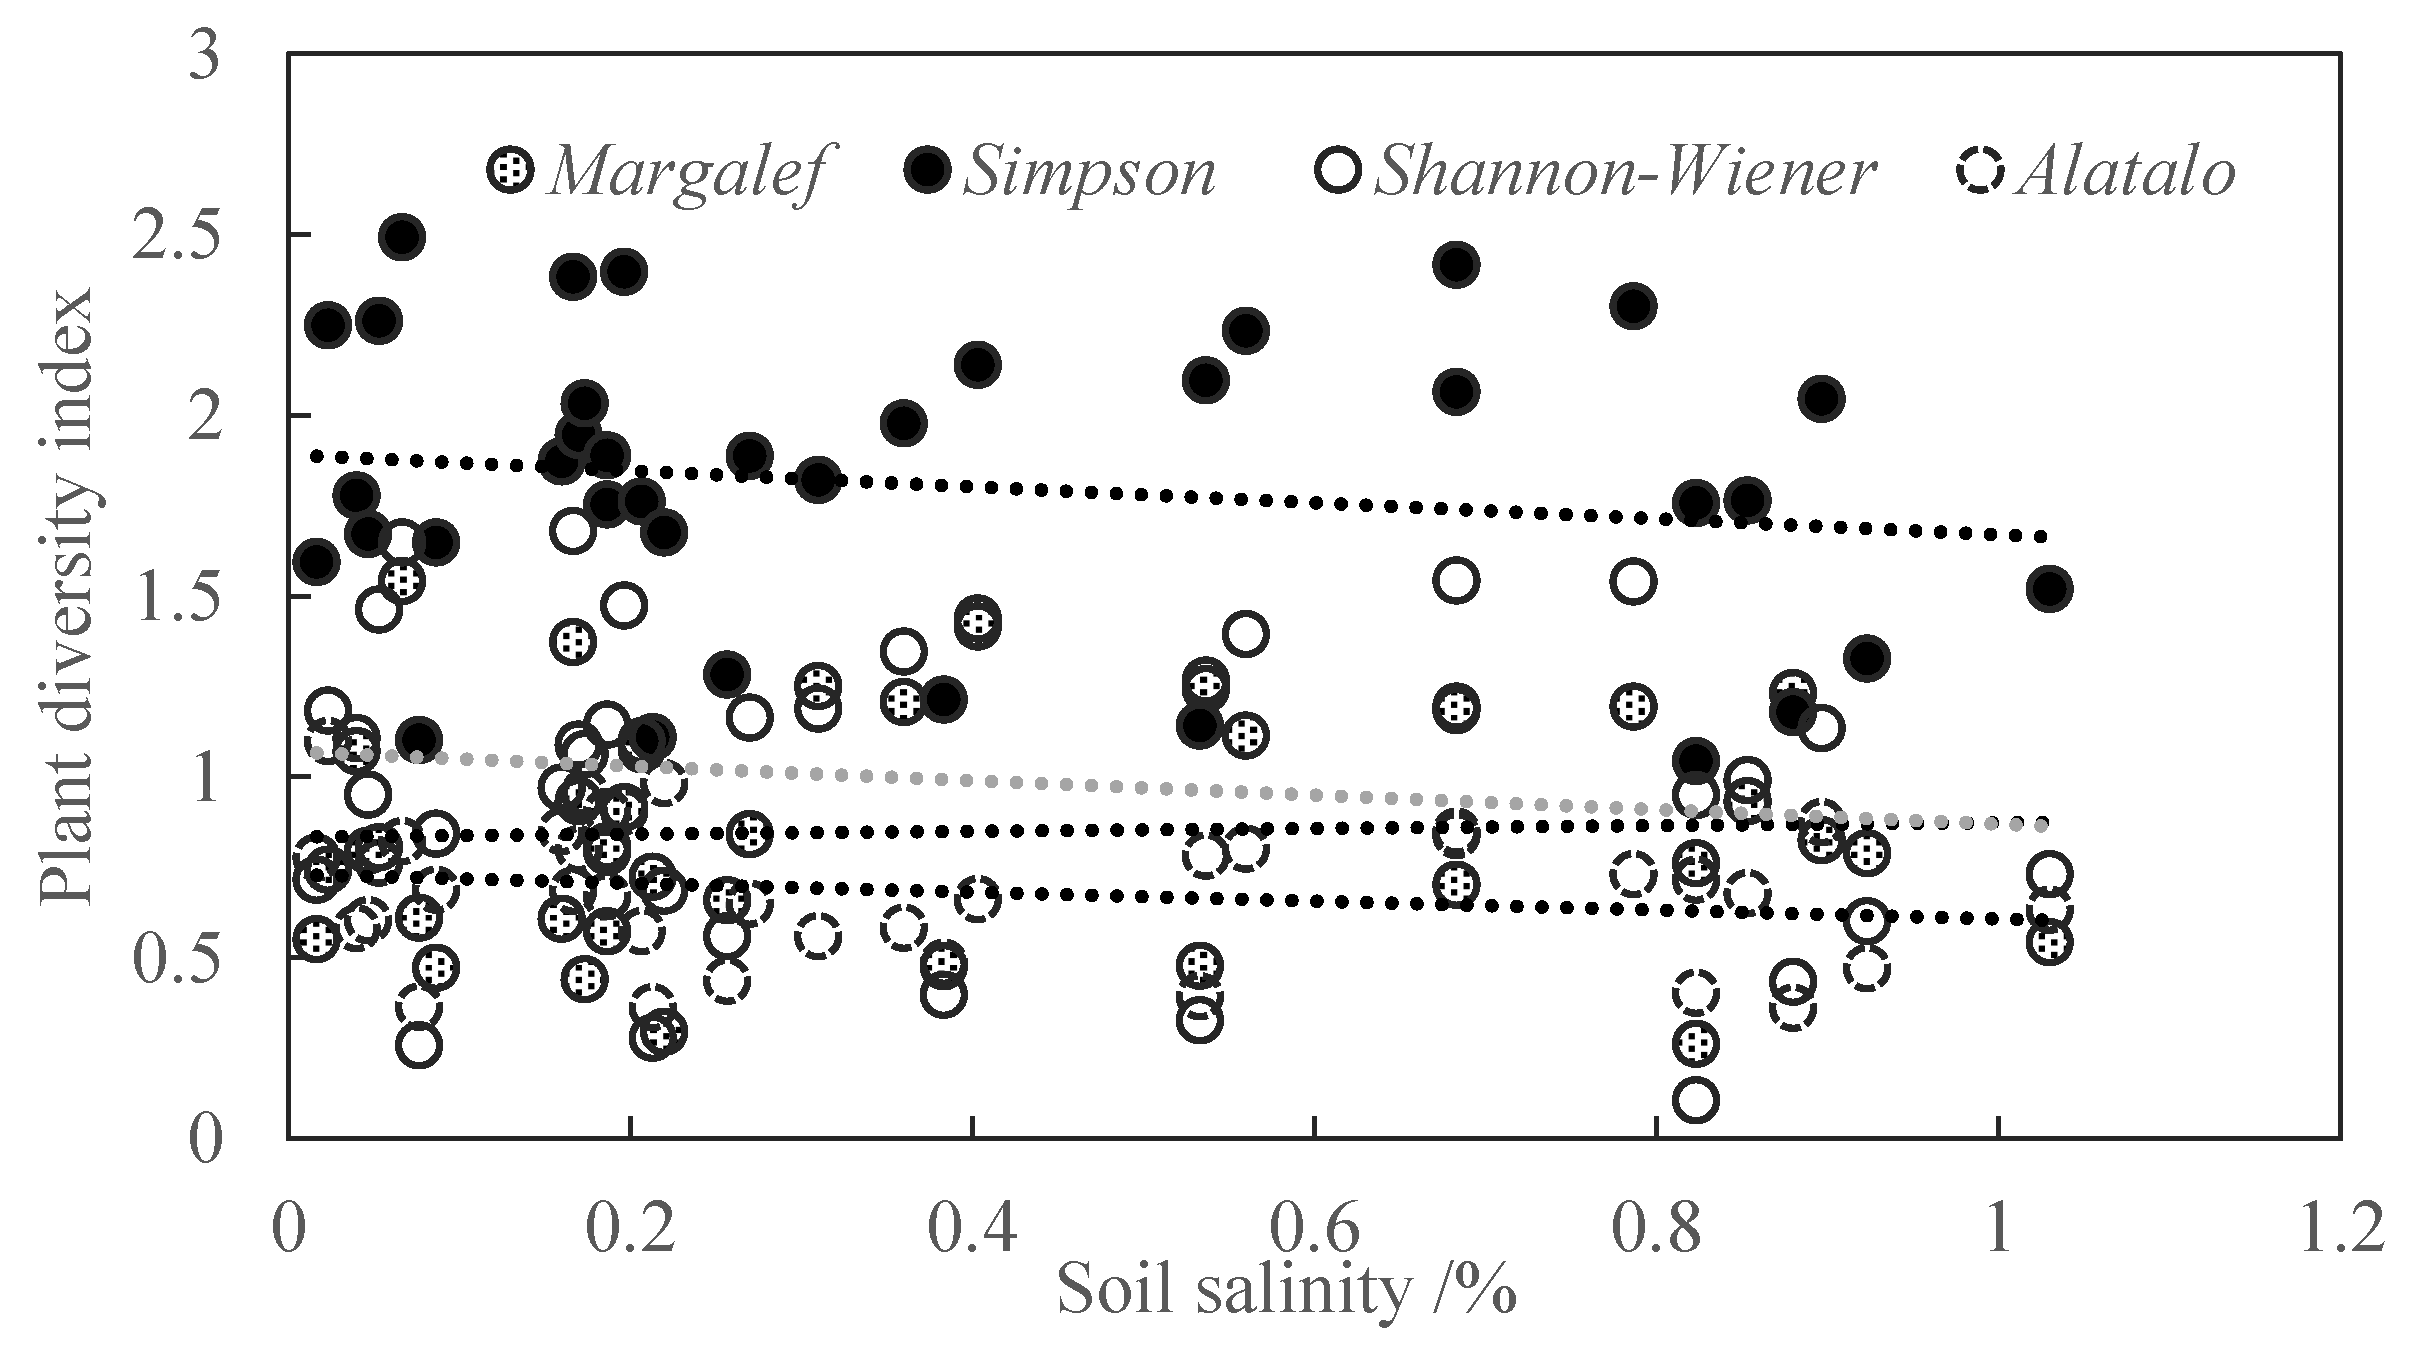
Figure 8 shows the relationship between soil salinity and plant species diversity. It was found that increasing the soil salinity resulted in decreasing trends of the Simpson, Shannon–Wiener, and Alatalo except for the Margalef index.

3.3. Effects of Soil Characteristics on the Coverage Area of Plant Communities in the Bosten Lake Basin

The dynamic changes in the plant community area percentage, soil moisture, and salinity in the Bosten Lake Basin were analyzed (Figure 9 and Figure 10). Figure 9 demonstrated that soil salinity changes somewhat affected the plant community area percentage in the study region. As the SSI increased, the area percentage of six plant communities (high swamp, alpine temperate desert steppe, montane temperate steppe, halophyte meadow, temperate steppe desert, and alpine steppe) exhibited a similar increasing trend. However, the area percentage of the temperate desert positive community and alpine meadow community decreased with the increasing SSI.
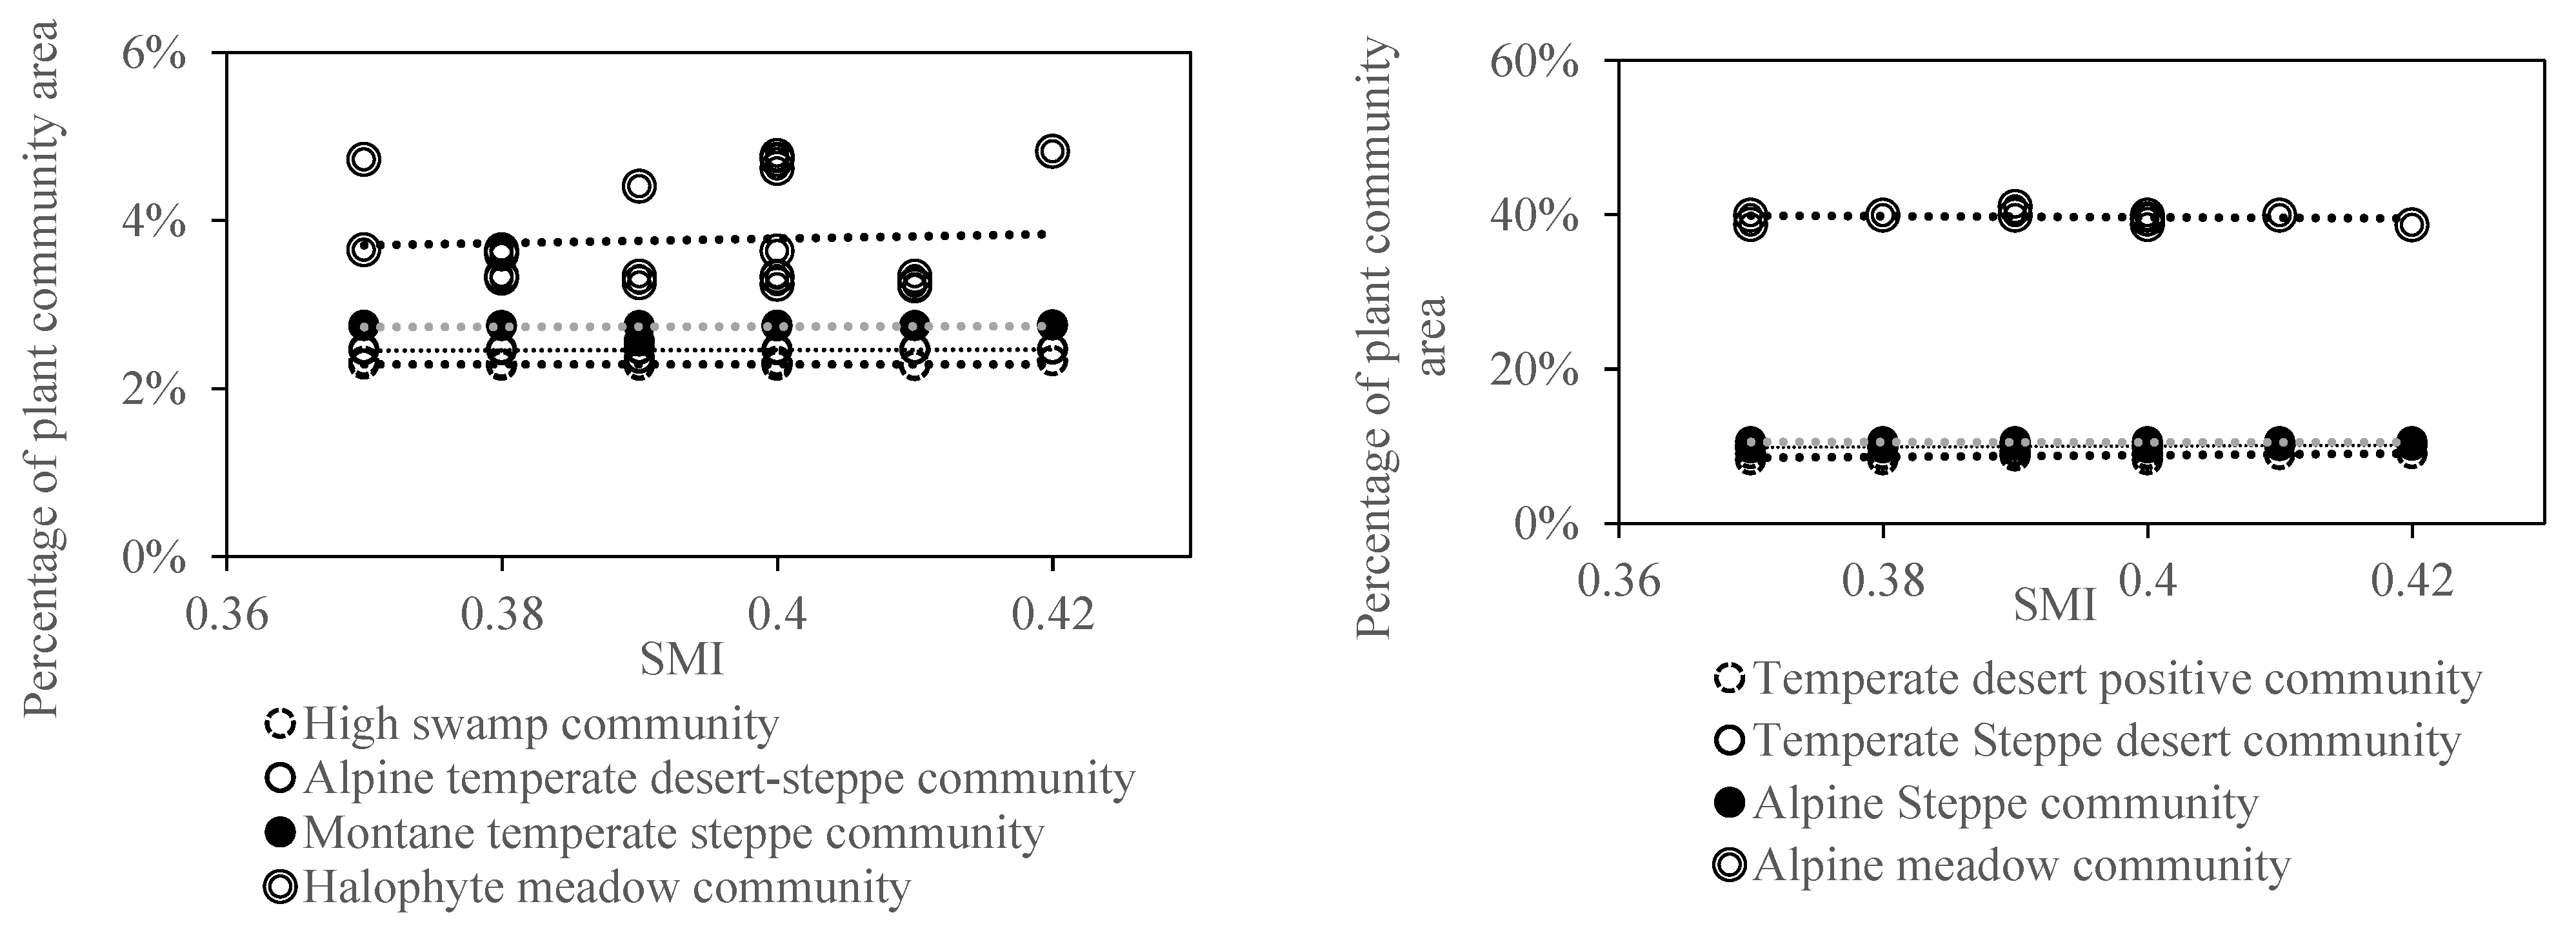
Figure 10 showed that the percentage of high swamp, alpine steppe, and alpine meadow community areas all decreased with gradually increasing the SMI. Other communities, including alpine temperate desert steppe, montane temperate steppe, halophyte meadow, temperate desert positive, and temperate steppe desert gradually increased with the increment of SMI.

3.4. Effects of Soil Moisture-Salinity Interaction on the Plant Diversity and Productivity of Plant Communities in the Bosten Lake Basin

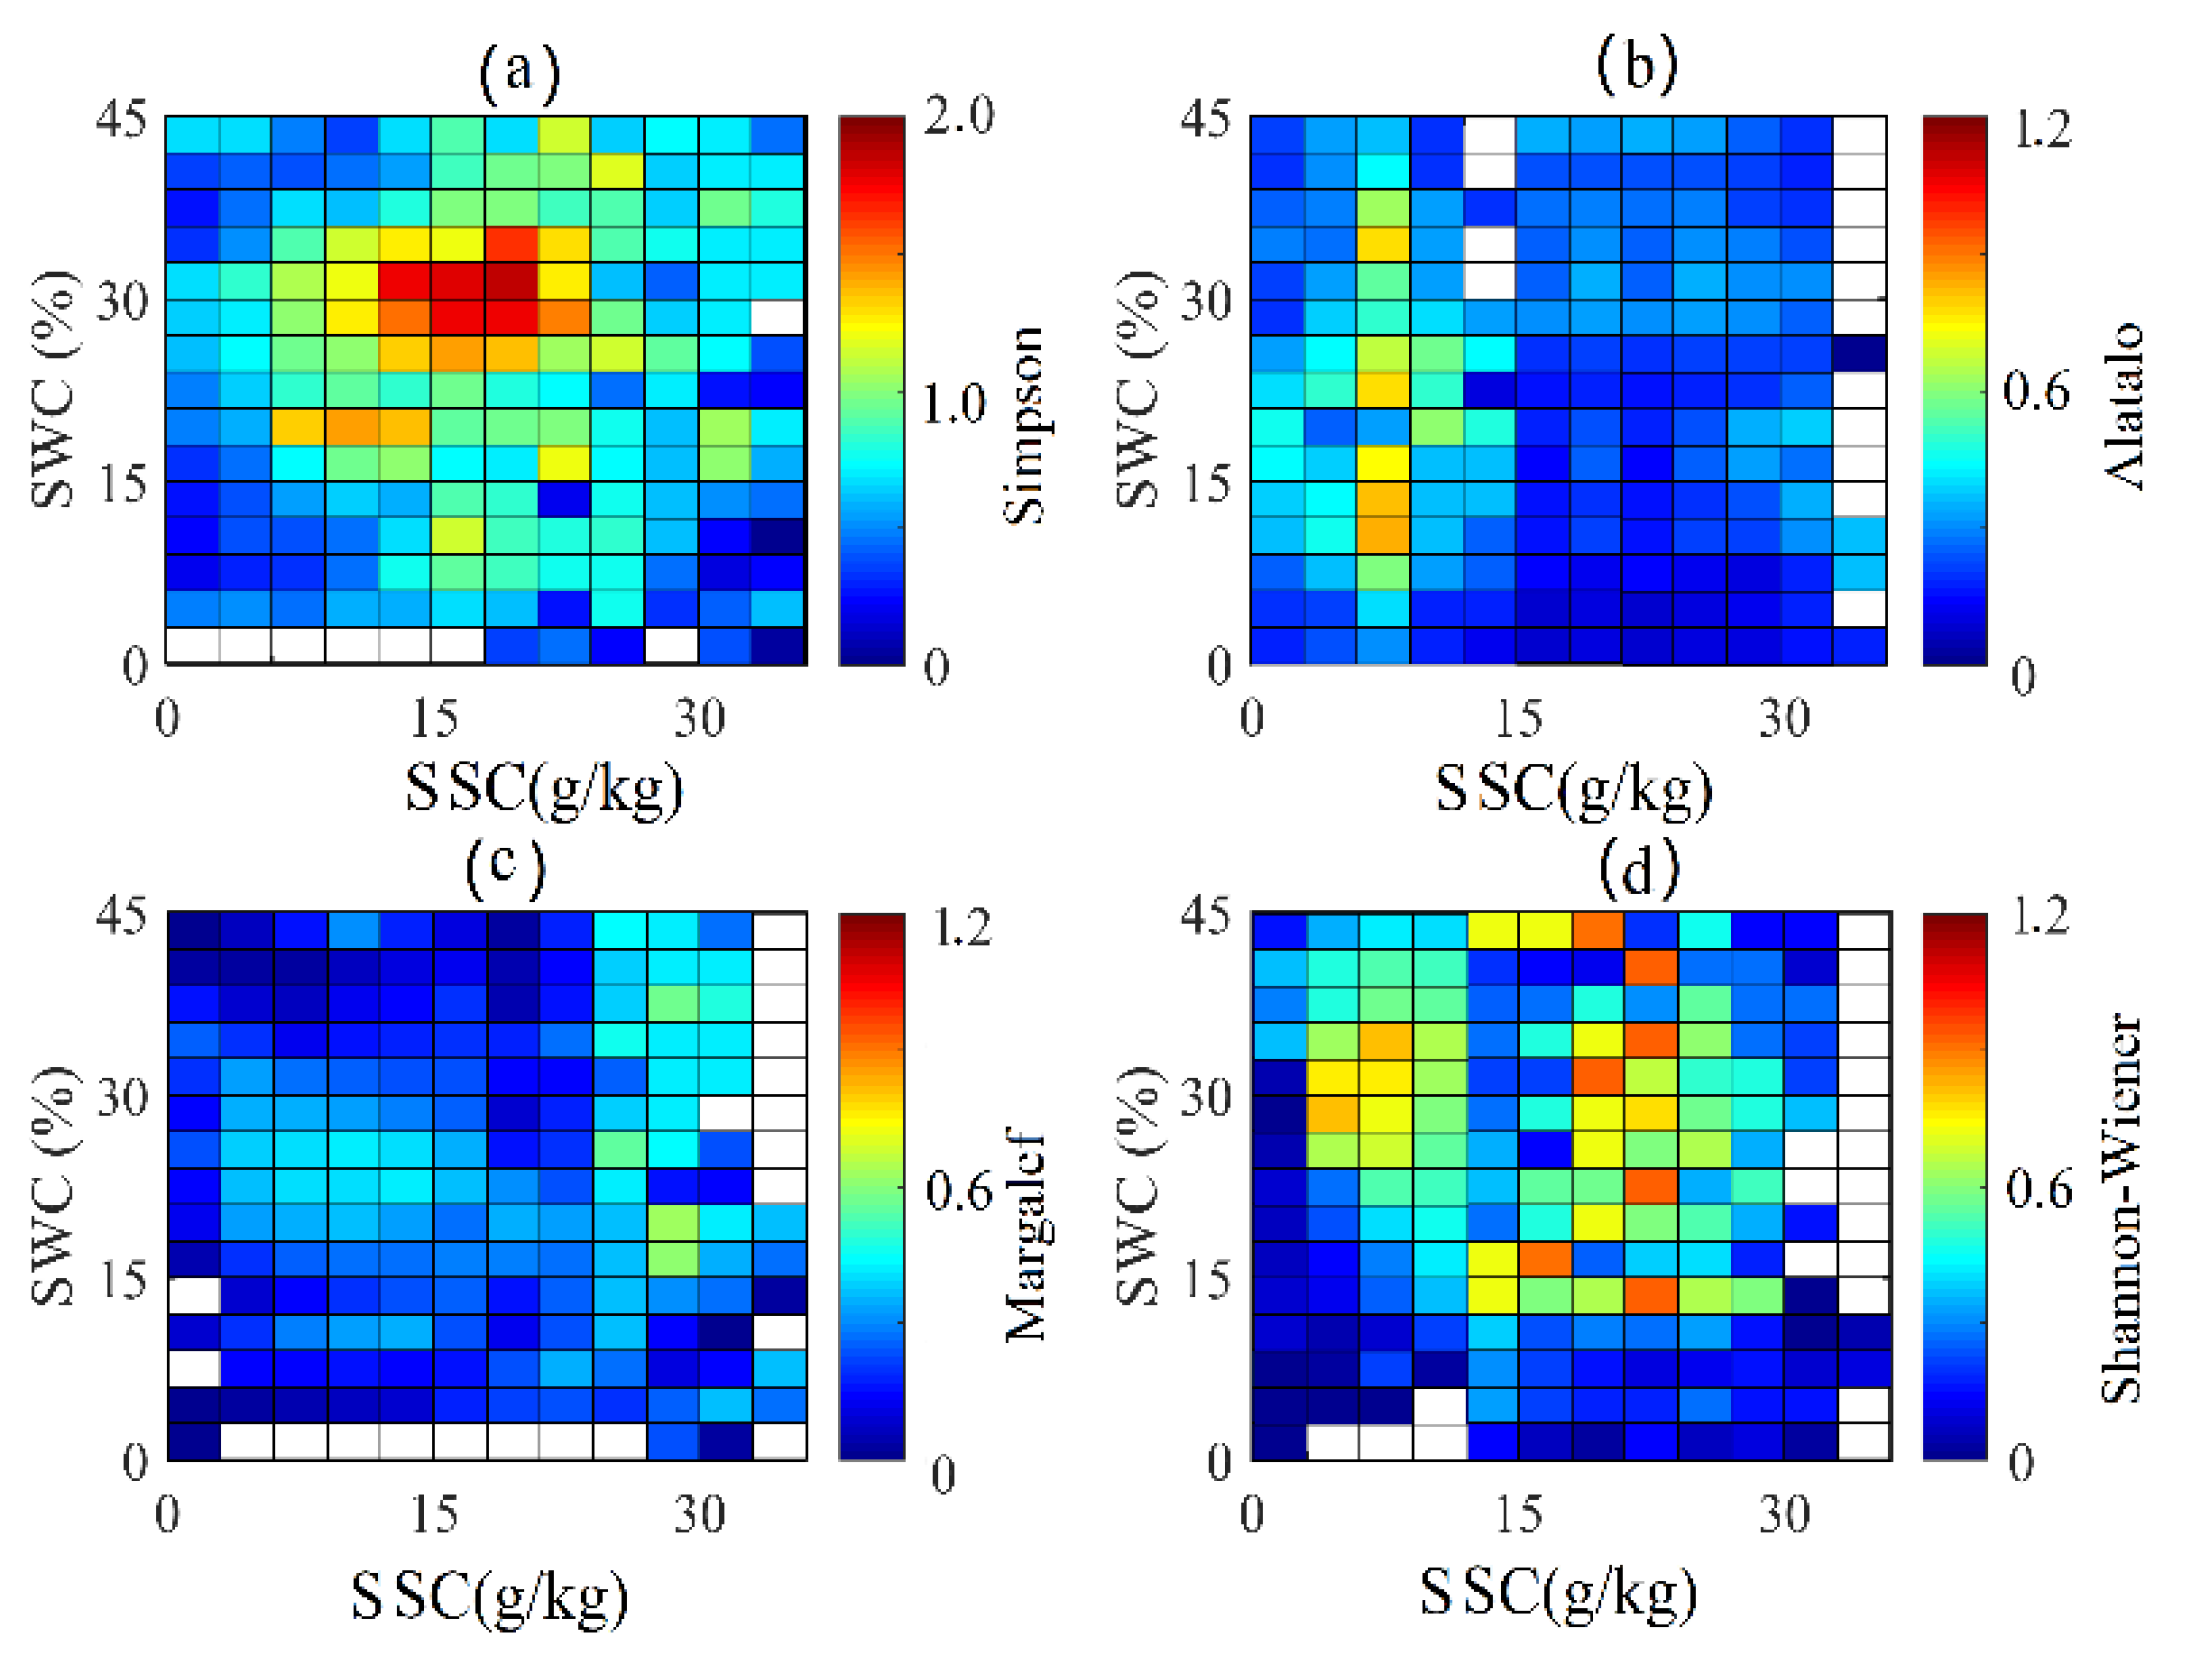
Based on the SVM model and series data of the four plant diversity indices (Margalef index, Simpson index, Shannon–Wiener index, Alatalo index) from 2000 to 2020, the effect of the soil moistureand salinity interaction on plant diversity change was analyzed. This paper took 3% of soil water content (SWC) and 3 g/kg of soil salinity content (SSC) as a step and then looked for a certain adapted threshold for plant diversity (Figure 11). When the soil salinity content is between 0 and 15 g/kg and the soil water content is between 12 and 30%, the plant diversity index is the highest in the study areas. Therefore, when the soil salinity content is 0–15 g/kg and the soil water content is 12–30%, the plant diversity index is optimal in the Bosten Lake Basin. It was also found that soil moisture, not soil salinity, controls the plant diversity change in the study area.
In order to qualify the effect of the soil moisture-salinity interaction on the productivity of plant communities in the study areas, the 21-year data of soil moisture and salinity were utilized to construct a multiple linear regression model of the vegetation productivity index(Y), SSI (X1) and SMI (X2). The three regression equations passed the significance test (p < 0.001), as shown in Table 3.
The regression equation for NDVI, SSI, and SMI demonstrated that NDVI was negatively affected by SSI and positively affected by SMI. Moreover, SSI had a higher impact on NDVI than SMI. The regression equation for EVI, SSI, and SMI indicated that the affection of SSI and SMI on the EVI was similar to the affection of the NDVI. This study indicates that high soil salinity would reduce the vegetation productivity while higher soil water content would promote vegetation growth. The regression equation for RVI, SSI, and SMI demonstrated that the RVI index was negatively affected by SSI and SMI. That the RVI exhibited a decreasing trend as both SSI and SMI increased.

4. Discussion

Climatic factors are the most important factors affecting vegetation change in arid inland regions [35,36]. The annual temperature and precipitation gradually increased from 2000 to 2020 in the Bosten Lake Basin [23]. The climate-driven SMI also increased while the SSI decreased. The NDVI, EVI, and RVI were at a high level and showed an increasing trend from 2000 to 2020. Moreover, the precipitation or temperature change were mostly consistent with the change of the NDVI, RVI, and EVI. The vegetation growth improved, driven by an increase in large-scale regional precipitation [37]. Thus, sufficient heat and water conditions can lead to high vegetation coverage and productivity in the study areas. Due to the increasing precipitation in the study area, the soil salinity decreased continuously from 2000 to 2020. Reductions in salinity are generally beneficial to the growth and survival of plant communities [38]. This study has verified that plant community productivity has generally improved and that changes in the microclimate affect the distribution of plant communities and reflect the overall improvement of the regional environment [39,40].
Soil moisture and salinity both strongly affect the structure, composition, and dynamic change of plant communities in arid regions [41]. Some studies have demonstrated that soil salinity affects plant niches and species diversity by changing the physicochemical properties of the soil [10]. When habitat conditions change from good to poor in arid areas, the water gradients had more significant and more directed effects than salinity gradients on plant species and communities [42]. This study firstly quantified the soil water and salinity content when the species diversity index was optimal in the Bosten Lake Basin. The result was more beneficial to quantitatively identify the plant community response range to changes in soil moisture and salinity.
Soil moisture and salinity strongly affected the productivity and diversity of plant communities but had only a minor effect on the areas of some plant types. The proportion of alpine meadows, temperate steppe deserts, high marsh, mountainous temperate desert steppe, mountainous temperate steppe, and lowland halophytic meadows were not significantly correlated with SSI and SMI in the Bosten Lake Basin. This indicates that the distribution of areas of different plant communities in the basin was more affected by other environmental factors.
Although the regression relationships between vegetation productivity and soil moisture and salinity factors have been quantified, other environmental factors including topography, soil texture, and soil nutrients should be considered [12]. Theoretically, they can also affect the characteristics and distribution of plant communities. Of course, the uncertainty of remote sensing data may affect the research results [36,43]. Our results were also affected by the limitation or uncertainty of Landsat-5 data images. The field survey data may be limited by the number of plant community investigation sampling points in our current study. Thus, the results from simulating the SVM model need to verify and optimize model parameters in the future.

5. Conclusions

This study provides an in-depth analysis of the dynamic change of soil water and salt and their effect on the plant community based on remote sensing data for 21 consecutive years. It can provide a method for improving the species diversity controlled by soil water and salt. It is very important for the local government to estimate the potential risks of plant community function reduction and soil salinization and restore destroyed grassland ecosystem, especially in the arid areas.
It can be concluded that there has been an increase in soil moisture and decrease in soil salt in the last 21 years; the indices of the Simpson and Shannon–Wiener exhibited distinctly increasing trends. The plant species diversity index is optimal when the soil salinity was 0–15 g/kg and the soil moisture was 12–30% when simulating the SVM model. It is indicated that soil moisture, not soil salinity, mainly controls the plant diversity change in the study area.
The productivity of the plant community is also affected by both the soil moisture and salinity. However, the SSI had a negative effect and the SMI had a positive effect on the plant productivity. The SSI had a higher impact on NDVI and EVI than SMI. The research provides findings that can provide a foundation for supporting decision-making related to managing the hydrology, regulating the salinity, and restoring the vegetation in the study areas. Moreover, this study provides a model of the soil water-salinity-plant community and was proposed to reflect the succession of plant communities in the arid areas. Therefore, this research is considered to delicately qualify plant growth and succession at the watershed scale.

Author Contributions

Conceptualization, writing—original draft preparation, J.H.; data analysis, review and editing, M.Y. All authors have read and agreed to the published version of the manuscript.

Funding

This research was funded by National Natural Science Foundation of China and Xing Jiang Joint Fund Project (U1803245) and National Natural Science Foundation of China (42161004).

Institutional Review Board Statement

Not applicable.

Informed Consent Statement

Informed consent was obtained from all subjects involved in the study.

Data Availability Statement

The data presented in this study are available on request from the corresponding author. The data are not publicly available due to ethical restrictions.

Acknowledgments

We would like to express our sincere thanks to the anonymous reviewers.

Conflicts of Interest

The authors declare no conflict of interest. The funders had no role in the design of the study; in the collection, analyses, or interpretation of data; in the writing of the manuscript, or in the decision to publish the results.

References

  1. Tilman, D.; Downing, J.A. Biodiversity and stability in grasslands. Nature 1994, 367, 363–365. [Google Scholar] [CrossRef]
  2. Fraser, L.H.; Karnezis, J.P. A comparative assessment of seedling survival and biomass accumulation for fourteen wetland plant species grown under minor water-depth differences. Wetlands 2005, 25, 520–530. [Google Scholar] [CrossRef]
  3. Zhang, Z.; Wan, C.; Zheng, Z.; Hu, L.; Feng, K.; Chang, J.; Xie, P. Plant community characteristics and their responses to environmental factors in the water level fluctuation zone of the three gorges reservoir in China. Env. Sci. Pollut. Res. Int. 2013, 20, 7080–7091. [Google Scholar] [CrossRef] [PubMed]
  4. Xu, P.J.; Xu, L.P.; Wang, H. Changes of NDVI and its response to climate change in Boston Lake Basin. J. Water Resour. Water Eng. 2018, 29, 86–92. [Google Scholar]
  5. Feng, Q.; Zhao, W.W.; Qiu, Y. Spatial heterogeneity of soil moisture and the scale variability of its influencing factors: A case study in the Loess Plateau of China. Water 2013, 5, 1226–1242. [Google Scholar] [CrossRef]
  6. Devoto, M.; Medan, D.; Roig-Alsina, A.; Montaldo, N.H. Patterns of species turnover in plant-pollinator communities along a precipitation gradient in Patagonia (Argentina). Austral Ecol. 2009, 34, 848–857. [Google Scholar] [CrossRef]
  7. Maharjan, S.K.; Poorter, L.; Holmgren, M.; Bongers, F.; Wieringa, J.J.; Hawthorne, W.D. Plant functional traits and the distribution of west African rain forest trees along the rainfall gradient. Biotropica 2011, 43, 552–561. [Google Scholar] [CrossRef]
  8. Zenner, E.K.; Olszewski, S.L.; Palik, B.J.; Kastendick, D.N.; Peck, J.E.; Blinn, C.R. Riparian vegetation response to gradients in residual basal area with harvesting treatment and distance to stream. For. Ecol. Manag. 2012, 283, 66–76. [Google Scholar] [CrossRef]
  9. Chen, Y.N.; Zilliacus, H.; Li, W.H.; Zhang, H.F.; Chen, Y.P. Ground-water level affects plant species diversity along the lower reaches of the Tarim River, Western China. J. Arid Environ. 2006, 66, 231–246. [Google Scholar] [CrossRef]
  10. Xi, H.Y.; Feng, Q.; Zhang, L. Effects of water and salinity on plant species composition and community succession in Ejina D esert Oasis, northwest China. Env. Earth Sci. 2016, 75, 138. [Google Scholar] [CrossRef]
  11. McIlroy, S.K.; Allen-Diaz, B.H. Plant community distribution along water table and grazing gradients in montane meadows of the Sierra Nevada Range (California, USA). Wetl. Ecol. Manag. 2012, 20, 287–296. [Google Scholar] [CrossRef]
  12. Li, Z.K.; Li, X.Y.; Zhou, S.; Yang, X.F.; Fu, Y.S.; Miao, C.Y.; Wang, S.; Zhang, G.H.; Wu, X.C.; Yang, C.; et al. A comprehensive review on coupled processes and mechanisms of soil-vegetation-hydrology, and recent research advances. Sci. China Earth Sci. 2022, 65, 1–31. [Google Scholar] [CrossRef]
  13. Davis, J.A.; McGuire, M.; Halse, S.A. What happens when you add salt: Predicting impacts of secondary salinisation on shallow aquatic ecosystems by using an alternative-states model. Aust. J. Bot. 2003, 51, 715–724. [Google Scholar] [CrossRef]
  14. González-Alcaraz, M.N.; Jiménez-Cárceles, F.J.; Álvarez, Y.; Álvarez-Rogel, J. Gradients of soil salinity and moisture, and plant distribution, in a Mediterranean semiarid saline watershed: A model of soil–plant relationships for contributing to the management. Catena 2014, 115, 150–158. [Google Scholar] [CrossRef]
  15. Cardinale, B.J. Biodiversity improves water quality through niche partitioning. Nature 2011, 472, 86–89. [Google Scholar] [CrossRef] [PubMed]
  16. Berdugo, M.; Delgadobaquerizo, M.; Soliveres, S. Global ecosystem thresholds driven by aridity. Science 2020, 367, 787–790. [Google Scholar] [CrossRef] [Green Version]
  17. Onkware, A.O. Effect of soil salinity on plant distribution and production at Loburu Delta, Lake Bogoria National Reserve, Kenya. Austral. Ecol. 2000, 25, 140–149. [Google Scholar] [CrossRef]
  18. Wetzel, P.R.; Kitchens, W.M.; Brush, J.M.; Dusek, M.L. Use of a reciprocal transplant study to measure the rate of plant community change in a tidal marsh along a salinity gradient. Wetlands 2004, 24, 879–890. [Google Scholar] [CrossRef]
  19. Wang, S.X.; Dong, X.G.; Liu, L. Diversity and Differentiation of Natural Vegetation Under Water and Salt Gradient in Oasis of Yanqi Basin, Xinjiang. J. Glaciol. Geocryol. 2010, 32, 999–1006. [Google Scholar]
  20. Cui, B.S.; Zhao, X.S.; Yang, Z.F.; Chen, B.; Tang, N.; Tan, X. Responses of reed community to the environment gradient of water depth in the Yellow River Delta. Acta Ecol. Sin. 2006, 26, 1534–1541. [Google Scholar] [CrossRef]
  21. Wang, G.X.; Xia, J.; Li, X.Y. Critical advances in understanding ecohydrological processes of terrestrial vegetation: From leaf to watershed scale. Chin. Sci. Bull 2021, 66, 3667–3683. [Google Scholar] [CrossRef]
  22. Dong, X.G.; Jiang, H.F.; Deng, M.J. Study on the distribution and balance of the salt in the inland basin. Adv. Water Sci. 2005, 16, 638–642. [Google Scholar]
  23. Dai, X.; Yang, X.; Wang, M.; Gao, Y.; Liu, S.; Zhang, J. The dynamic change of Bosten Lake area in response to climate in the past 30 years. Water 2020, 12, 4. [Google Scholar] [CrossRef]
  24. Dilxiati, M.; Rusul, Y.; Hong, J. Temporal and spatial variation of vegetation phenology and its driving factor analysis in the Bosten Lake Drainage Basin from 2001 to 2014. Acta Ecol. Sin. 2018, 38, 6921–6931. [Google Scholar]
  25. Wei, B. Study on morphological changes and influencing factors of Bosten Lake. Ph.D. Thesis, Xinjiang University, Ürümqi, China, 2013. [Google Scholar]
  26. Roy, D.P.; Kovalskyy, V.; Zhang, H.K. Characterization of Landsat-7 to Landsat-8 reflective wavelength and normalized difference vegetation index continuity. Remote Sens. Environ. 2016, 185, 57–70. [Google Scholar] [CrossRef] [Green Version]
  27. Gitelson, A.A.; Kaufman, Y.J.; Merzlyak, M.N. Use of a green channel in remote sensing of global vegetation from EOS-MODIS. Remote Sens. Environ. 1996, 58, 289–298. [Google Scholar] [CrossRef]
  28. Nagler, P.L.; Scott, R.L.; Westenburg, C.; Cleverly, J.R.; Glenn, E.P.; Huete, A.R. Evapotranspiration on western U.S. rivers estimated using the Enhanced Vegetation Index from MODIS and data from eddy covariance and Bowen ratio flux towers. Remote Sens. Environ. 2005, 97, 337–351. [Google Scholar] [CrossRef]
  29. Jordan, C.F. Derivation of leaf—Area index from quality of light on the forest floor. Ecology 1969, 50, 663–666. [Google Scholar] [CrossRef]
  30. Zeng, J.Y.; Chen, K.S.; Cui, C.Y.; Bai, X.J. A Physically-based Soil Moisture Index from Passive Microwave Brightness Temperatures for Soil Moisture Variation Monitoring. IEEE Trans. Geosci. Remote Sens. 2020, 58, 2782–2795. [Google Scholar] [CrossRef]
  31. Khan, N.M.; Rastoskuev, V.V.; Sato, Y.; Shiozawa, S. Assessment of hydro saline land degradation by using a simple approach of remote sensing indicators. Agric. Water Manag. 2005, 77, 96–109. [Google Scholar] [CrossRef]
  32. Ahmad, S.; Kalra, A.; Stephen, H. Estimating soil moisture using remote sensing data: A machine learning approach. Adv. Water Resour. 2010, 33, 69–80. [Google Scholar] [CrossRef]
  33. Holtgrave, A.K.; Förster, M.; Greifeneder, F. Estimation of Soil Moisture in Vegetation-Covered Floodplains with Sentinel-1 SAR Data Using Support Vector Regression. PFG 2018, 86, 85–101. [Google Scholar] [CrossRef]
  34. Ma, K.P. Methods for Measuring Biodiversity of Biological Communities Iα. Divers. Meas. 1994, 3, 162–168. [Google Scholar]
  35. Pei, Z.F.; Fang, S.B.; Yang, W.N.; Wang, L.; Wu, M.Y.; Zhang, Q.F.; Han, W.; Khoi, D.N. The Relationship between NDVI and Climate Factors at Different Monthly Time Scales: A Case Study of Grasslands in Inner Mongolia, China (1982–2015). Sustainability 2019, 11, 7243. [Google Scholar] [CrossRef] [Green Version]
  36. Decuyper, M.; Chávez, R.O.; Čufar, K.; Estay, S.A.; Clevers, J.G.P.W.; Prislan, P.; Gričar, J.; Črepinšek, Z.; Merela, M.; de Luis, M.; et al. Spatio-temporal assessment of beech growth in relation to climate extremes in Slovenia–An integrated approach using remote sensing and tree-ring data. Agric. For. Meteorol. 2020, 287, 107925. [Google Scholar] [CrossRef]
  37. Wan, H.X.; Qin, Z.H.; Xu, Y.M. Variation of vegetation cover and its relationship with climatic factors in the Bosten Lake Basin using MODIS data. J. Lake Sci. 2018, 30, 1429–1437. [Google Scholar]
  38. Kang, E.; Li, X.; Zhang, J.; Xing, L.H. Water resources relating to desertification in the Hexi area of Gansu Province, China. J. Glaciol. Geocryol. 2004, 26, 657–667. [Google Scholar]
  39. Kempping, J.; Niittynen, P.; Happonen, K. Consistent trait-environment relationships within and across tundra plant communities. Nat. Ecol. Evol. 2021, 5, 458–467. [Google Scholar] [CrossRef]
  40. Shen, X.J.; Deng, M.J.; Lu, X.G. Aboveground biomass and its spatial distribution pattern of herbaceous marsh vegetation in China. Sci. China Earth Sci. 2021, 64, 1115–1125. [Google Scholar] [CrossRef]
  41. Zhou, W.L.; Yang, X.Q.; Hao, P.; Liu, Q.W.; Cao, D.C.; Baribault, T.; Li, J.W. Plant diversity and its maintenance in Populus euphratica riparian forests in the Ejina Oasis, China. For. Stud. China 2010, 12, 55–61. [Google Scholar] [CrossRef]
  42. Zhang, J.; Lyu, G.H.; Wang, H.F. Effect of plant diversity on ecosystem multifunctionality in different water-salt environments of Ebinur Lake basin. J. Plant Resour. Environ. 2021, 30, 22–30. [Google Scholar]
  43. Shen, X.J.; Liu, Y.W.; Liu, B.H. Effect of shrub encroachment on land surface temperature in semi-arid areas of temperate regions of the Northern Hemisphere. Agric. For. Meteorol. 2022, 320, 108943. [Google Scholar] [CrossRef]
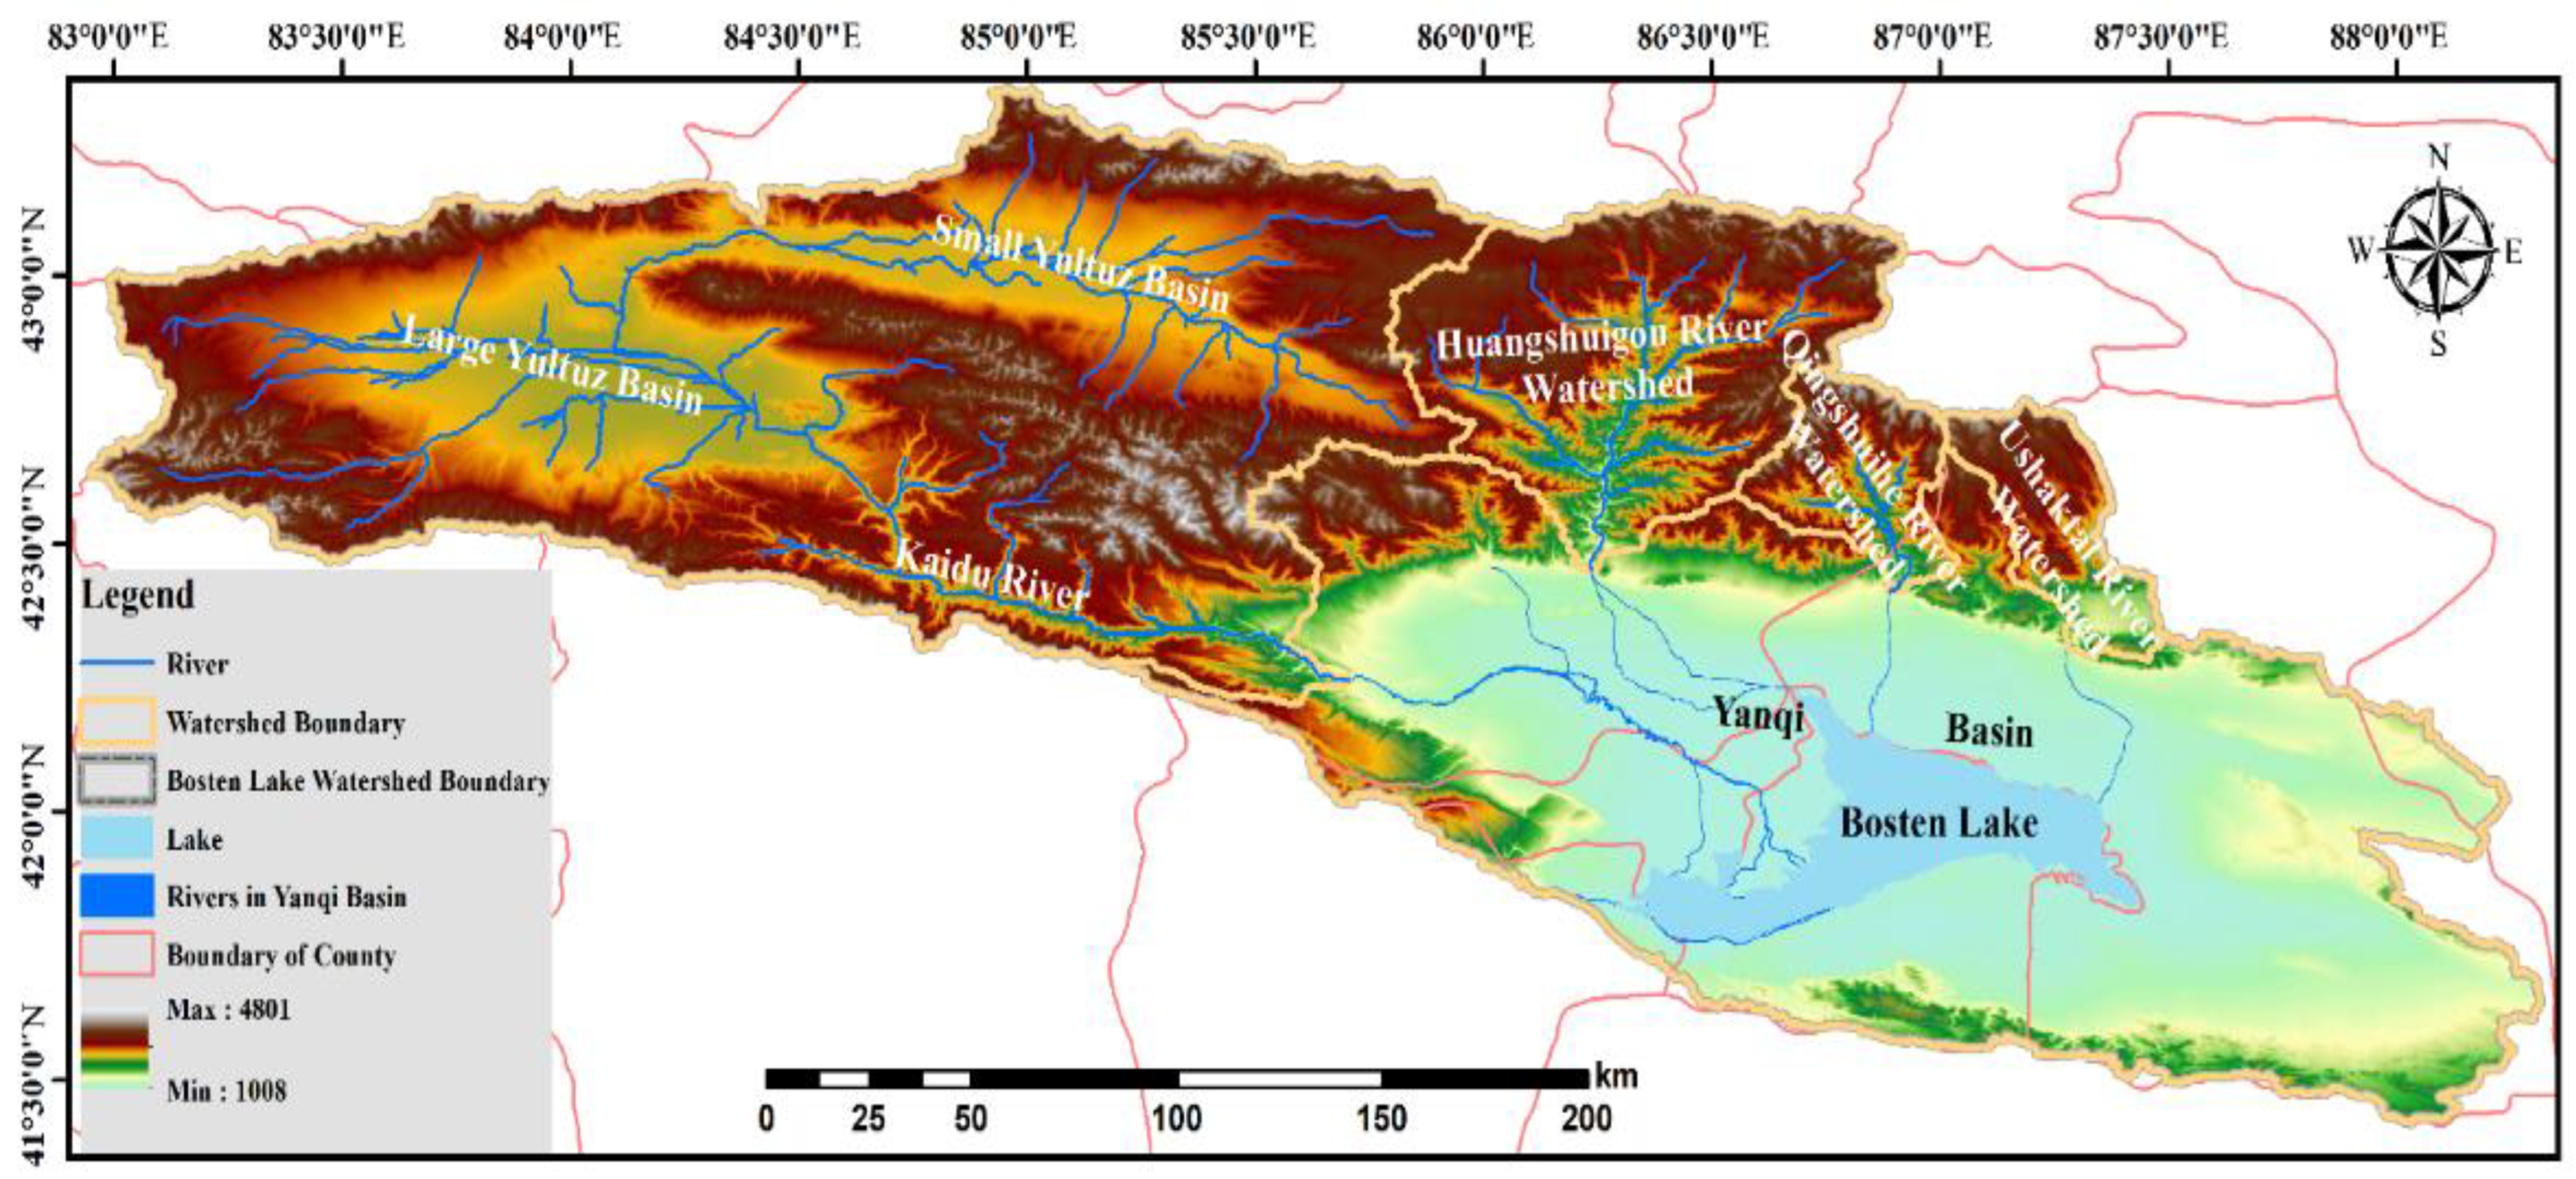
Figure 1. Map of the study area.
Sustainability 14 14081 g001
Figure 2. Changes of the SMI and SSI in the Bosten Lake Basin from 2000 to 2020.
Sustainability 14 14081 g002
Figure 3. Changes of the vegetation index in the Bosten Lake Basin from 2000 to 2020.
Sustainability 14 14081 g003
Figure 4. Dynamic changes in different plant community types in the study area.
Sustainability 14 14081 g004aSustainability 14 14081 g004b
Figure 5. The relationship between NDVI, RVI, EVI, and SSI in the Bosten Lake Basin.
Sustainability 14 14081 g005
Figure 6. The relationship between NDVI, RVI, EVI and SMI in the Bosten Lake Basin.
Sustainability 14 14081 g006
Figure 7. Relationship between plant species diversity indices and soil moisture.
Sustainability 14 14081 g007
Figure 8. Relationship between plant species diversity index and soil salinity.
Sustainability 14 14081 g008
Figure 9. Relationship between SSI and percentage of plant community areas in the Bosten Lake Basin.
Sustainability 14 14081 g009
Figure 10. Relationship between the SMI and the areas of plant community in the Bosten Lake Basin.
Sustainability 14 14081 g010
Figure 11. Plant species diversity in Bosten Lake Basin under the influence of water and salt interaction ((a) Simpson index; (b) Alatalo index; (c) Margalef index; (d) Shannon–Wiener index).
Sustainability 14 14081 g011
Table 1. Classification System of plant communities in the Bosten Lake Basin.
NumberPlant Communities/Land Cover
1Halophyte meadow community
2Marshy meadow community
3Low swamp community
4Alpine steppe community
5Alpine meadow community
6High swamp community
7Sub-class of sandy temperate desert community
8Temperate steppe desert community
9Temperate desert community
10Gravelly temperate steppe desert sub-class community
11Mountain meadow community
12Montane temperate steppe community
13Alpine temperate desert-steppe community
14Temperate desert community in saline soil
15Cultivated land
16Water area
17Forest
18Glaciers and snow
19Construction Land
Table 2. The calculation formulas for the main vegetation, soil moisture, and salinity indices.
Index NameFormula *Reference
NDVI N I R     R e d N I R   +   R e d [27]
EVI 2.5   ×   ( N I R     R e d ) N I R   +   6   ×   R e d     7.5   ×   B l u e   +   1 [28]
RVI N I R R e d [29]
SSI R e d     N I R R e d + N I R [30]
SMI S M I ( i ) o = ( e p ( m a x )     e p   ( i ) ) 2   +   M P D I ( i ) 2 [31]
* Blue, Red, and NIR is B-2, B-4, and B-8 bands, respectively. ep(i) and MPDI(i) stand for the corresponding emissivity and microwave polarization difference index at day i, respectively, and ep(max) represents multiyear maximum value of ep(i) for a specific satellite pixel.
Table 3. Regression model of soil moisture and salinity and vegetation index in the Bosten Lake Basin.
Linear Regression ModelEquation Test Significance
R2FSig.
1YNDVI = −0.879 X1 + 0.026 X2 + 0.0070.918572.7340.000
2YRVI = −5.190 X1 − 1.139 X2 + 1.0260.838264.2430.000
3YEVI = −2.160 X1 + 0.545 X2 − 0.2270.810217.4530.000
Publisher’s Note: MDPI stays neutral with regard to jurisdictional claims in published maps and institutional affiliations.