Article

Usage PlanetScope Images and LiDAR Point Clouds for Characterizing the Forest Succession Process in Post-Agricultural Areas

Department of Forest Resource Management, Faculty of Forestry, University of Agriculture in Krakow, 31-425 Krakow, Poland
Sustainability 2022, 14(21), 14110; https://doi.org/10.3390/su142114110
Submission received: 8 September 2022 / Revised: 24 October 2022 / Accepted: 27 October 2022 / Published: 28 October 2022

Abstract

:
The paper investigates using PlanetScope satellite images together with LiDAR data for automation of land use/cover (LULC) mapping and 3D vegetation characteristics in the aspect of mapping and monitoring of the secondary forest succession areas. The study was performed for the tested area in the Biskupice district (South of Poland), where a forest succession occurs on post-agricultural lands. The research area was parcels where the forest overgrowing process was identified. It was verified whether the image processing allows for reliable LULC classification as an identification forest succession area. The PlanetScope classification showed forested areas as 62.77 ha (44.91% of the analyzed area). The overall accuracy of the image classification was 96.40% The airborne laser scanning (ALS) point clouds were used for deriving detailed information about the forest succession process. The precise vegetation parameters i.e., height and canopy cover were determined and presented as raster maps, histograms, or profiles.

Graphical Abstract

1. Introduction

Forest succession on post-agricultural lands is a very common process [1,2,3]. This takes place on a large scale and changing economic and demographic conditions intensify this phenomenon [4]. Land abandonment is influenced by many factors [5,6] such as distance from forest complexes, demographic changes in countrified areas, and migration of rural residents to cities. Mapping changes in land use, in particular identifying areas of secondary forest succession, is important for proper land management and broadcasting agricultural subsidies [7,8] but also extremely important in terms of increasing the forest cover, determining biomass, issues of renewable energies, and carbon sequestration [9].
Monitoring of areas left for natural afforestation is also significant in terms of the safety of people. It is valid in terms of mapping the risk of fire, directly in areas where agricultural use is stopped, where forest vegetation is formed, and in the aspect of the fire reaching the complexes of commercial forests or protected or urban areas. It is also essential for environmental protection and assesses the breeding relevance of vegetation for shaping the forest on post-agricultural lands [10] and the problems of management and monitoring of newly forming forests, according to the function in the village, environment, and landscape [4].
The mapping and monitoring of the use of the area, including the forest succession process on abandoned farmland, is of wide scientific interest. The usage of remote sensing spatial data offers the possibility of monitoring different times land use and land cover (LULC) changes, especially the process of forest succession [11,12,13,14]. To assess forested lands aerial and satellite imageries have been adopted since the 2000s. Satellite image classification and LiDAR (Light Detection and Ranging) technology offer possibilities for a fusion of 2D/3D information for mapping land use and land cover classes. The procurement of many indexes characterizing vegetation provides automation in LULC monitoring.
The focus of this manuscript is to document the use of remote sensing data sources, specifically digital satellite imagery and airborne LiDAR, to quantify the extent of secondary forest succession (natural afforestation) on abandoned farmland. Existing cadastral data do not adequately update changes in forest cover, nor include forest succession that is found on abandoned farmland, in their estimates of forest area.
The presented study indicates the possibility of automating the process of monitoring wooded and shrubby areas developing in post-agricultural areas by using image classification and laser scanning point cloud processing. There were compared five estimators of forested area on selected land parcels: (1) cadastral data; (2) classification of PlanetScope imagery; (3) classification of Sentinel-2 imagery; (4) analysis of LiDAR point clouds; and (5) manual photointerpretation of orthophotomaps. LiDAR data were also used to provide metrics of forest structure.

2. Materials and Methods

The area of interest is located in the south of Poland (49°58′ N, 20°08′ E; Figure 1)—Biskupice village in Wieliczka district, Małoposka Voivodeship, the terrain between the national road no. 94 and the voivodeship road no. 966. The analyzed area consists of 277 parcels with a total area of 139.77 ha, characterized as examples of the forest succession process on abandoned farmlands. In the cadastral databases, most of them are figured as arable lands (R), pastures (P), or meadows (M), but really, they are not used as agricultural lands but abandoned and afforested.
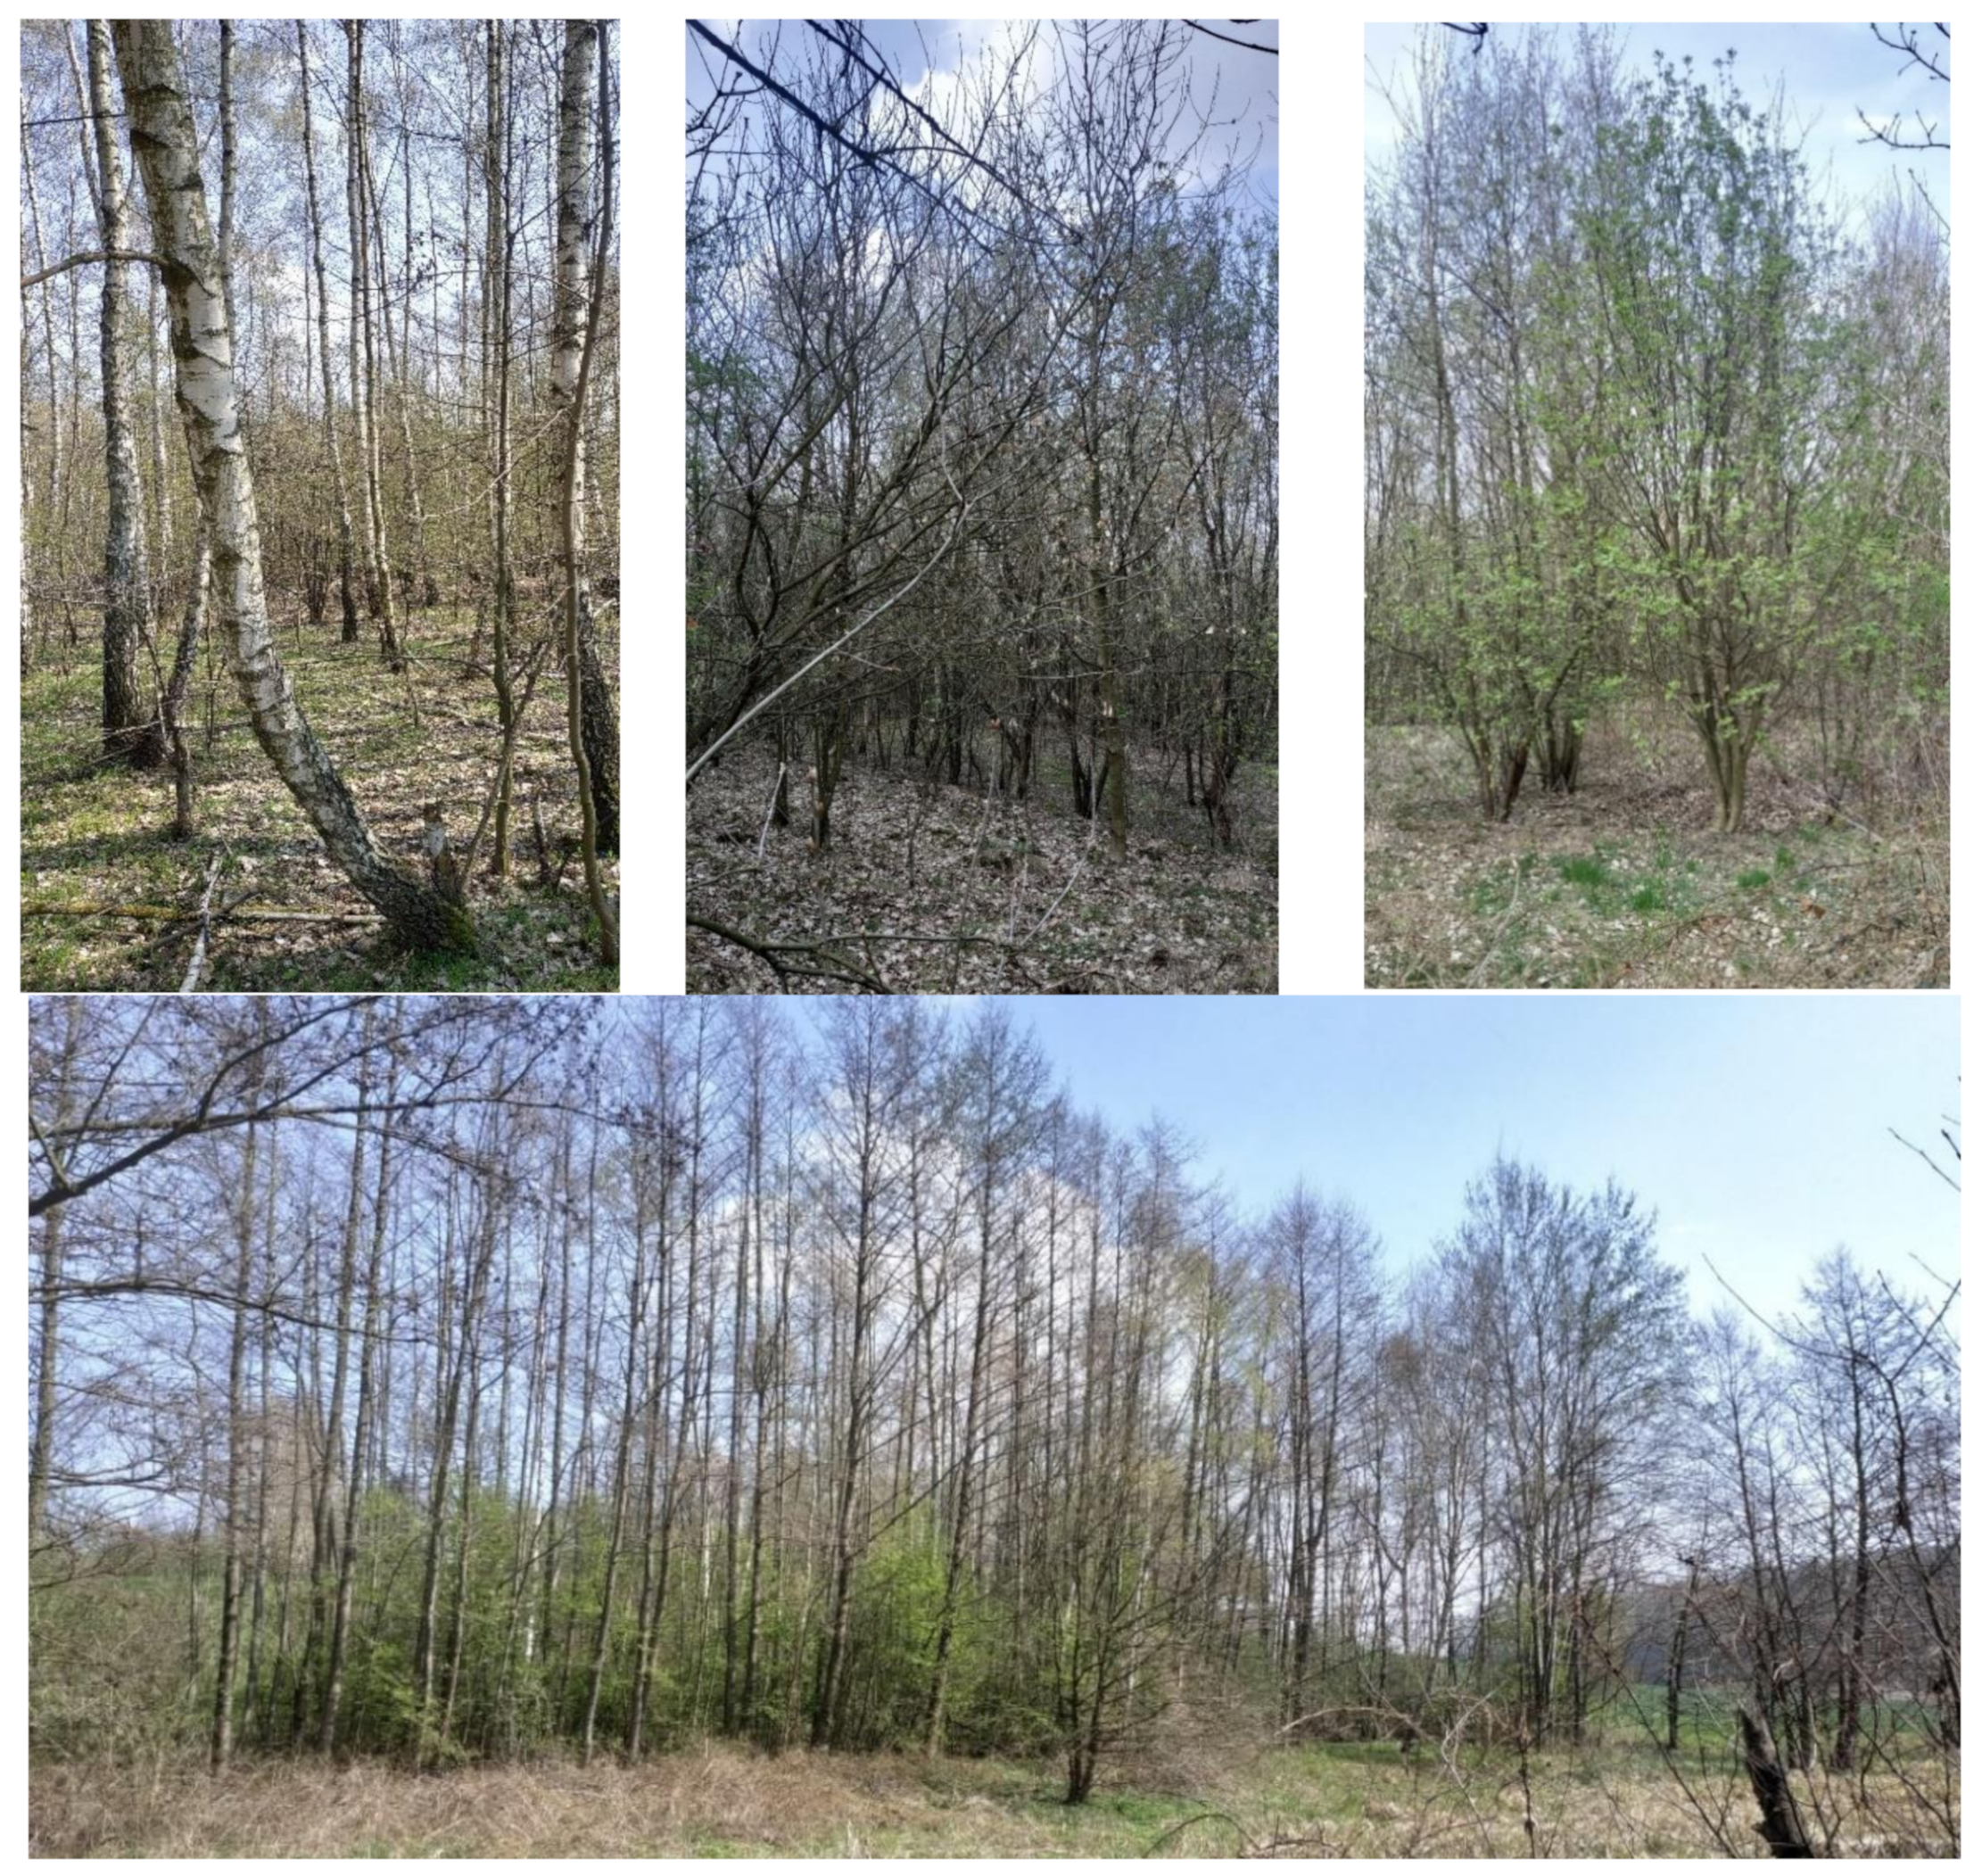
The area was characterized by significant examples of the secondary forest succession process [15] on abandoned farmland (Figure 2). The process of detection and monitoring of LULC changes, and forest succession on abandoned farmland is very common. It is a phenomenon that occurs on many hectares. Succession is taking place on a big scale, and intensifying economic and demographic processes enhance this occurrence.
The research was done using:
  • PlanetScope satellite imageries (bands: B—Blue, G—Green, R—Red, NIR, pixel size: 3.0 m, 05.07.2019); license: Planet’s Program for Education and Research (E&R) [16]. The Planet Scope satellite constellation consists of multiple launches of groups of individual CubeSats (DOVEs; 10 × 10 × 30 cm) and can image nearly all of Earth’s land every day [17].
  • Sentinel-2 satellite imagery (B, G, R, NIR, pixel size: 10.0 m, 25.05.2019, European Space Agency; ESA). The Sentinel-2 satellite imageries [18] (Sentinel-2A and Sentinel-2B) are equipped with high-resolution in 13 spectral channels and a 5-day revisit time (for two satellites).
  • LiDAR data—Airborne Laser Scanning (ALS) point clouds (2019), parameters: 4 reflections as a minimum, 6 points/m2, the altitude accuracy ≤ 0.15 m, situational accuracy ≤ 0.50 m.; source: IT Project—System for the Protection of Poland; Main Office of Geodesy and Cartography [19]).
  • Orthophotomaps (2019, GSD: 0.25 m, coordinates system: PL-PUWG1992).
  • Cadastral data (portals: WebEwid and Geoportal).
The supervised classification for PlanetScope imageries was based on the photointerpretation key (prepared in the field—GNSS measurements). Training plots were located using Training Samples Manager (ArcGIS) for RGB and CIR (color infrared) compositions. There were collected representative training samples, for each land cover class in the image: Forested areas (168 points), Arable lands (164 points), Meadows or Pastures (179 points), and Others (buildings, roads, etc.; 86 points). The image classification was carried out using the Maximum likelihood method (ArcGIS Pro) and the result was generalized (Majority Filter, Boundary Clean; ArcGIS Pro). The classification assessment was done (based on validation points) by determining: PA—Producer’s Accuracy, UA—User’s Accuracy, OA—Overall Accuracy, and the Kappa coefficient. The validation points were chosen using Create Accuracy Assessment Points function (ArcGIS Pro). The total number of validation points was 500 (randomly distributed) created in each class, in which each class has several points proportional to its relative area.
Sentinel-2 image classification, photo interpretation, and manual vectorization of the orthophotomaps and ALS point clouds processing were used to identify the difference in LULC mapping according to the PlanetScope image classification results. Sentinel-2 images were downloaded [20] with the specification of parameters such as acquisition date, and maximum cloud cover. Image pre-processing was done in SNAP software (ESA). The research area was selected (cropped at the image), the channels: R, G, B, and NIR were recorded, exported to the dim format, and finally, tiff was performed. The supervised classification was carried out in the same procedure as for PlanetScope imageries.
The procedure of LiDAR data (ALS point clouds) processing started by creating models: DTM—Digital Terrain Model (automated approximation of the ground points); DSM—Digital Surface Model (the other classes) and nDSM—normalized DSM (difference between the DSM and DTM). It was done using the functions GridSurfaceCreate and CanopyModel in FUSION [21].
Analysis of precise coverage of the forested areas in analyzed parcels was carried out based on reclassified nDSM. The process of nDSM reclassification (Reclassify, ArcGIS Esri) was done using a limit value > 1 meter, representing the height of vegetation. Previous studies [7,8] found that classifying nDSM using the threshold of the height of vegetation >1.0 m produced good results similar to geographic object-based image analysis (GEOBIA).
For deriving accurate information (2D and 3D structure) of vegetation was used FUSION procedure. The height of vegetation was generated using GridMetrics and CloudMetrics functions based on the 95th percentile (P95)—the height below which there exists 95% of points (the relative altitude of the point clouds) [22,23]. The parameter standard deviation of the height was also calculated (Stddev, FUSION).
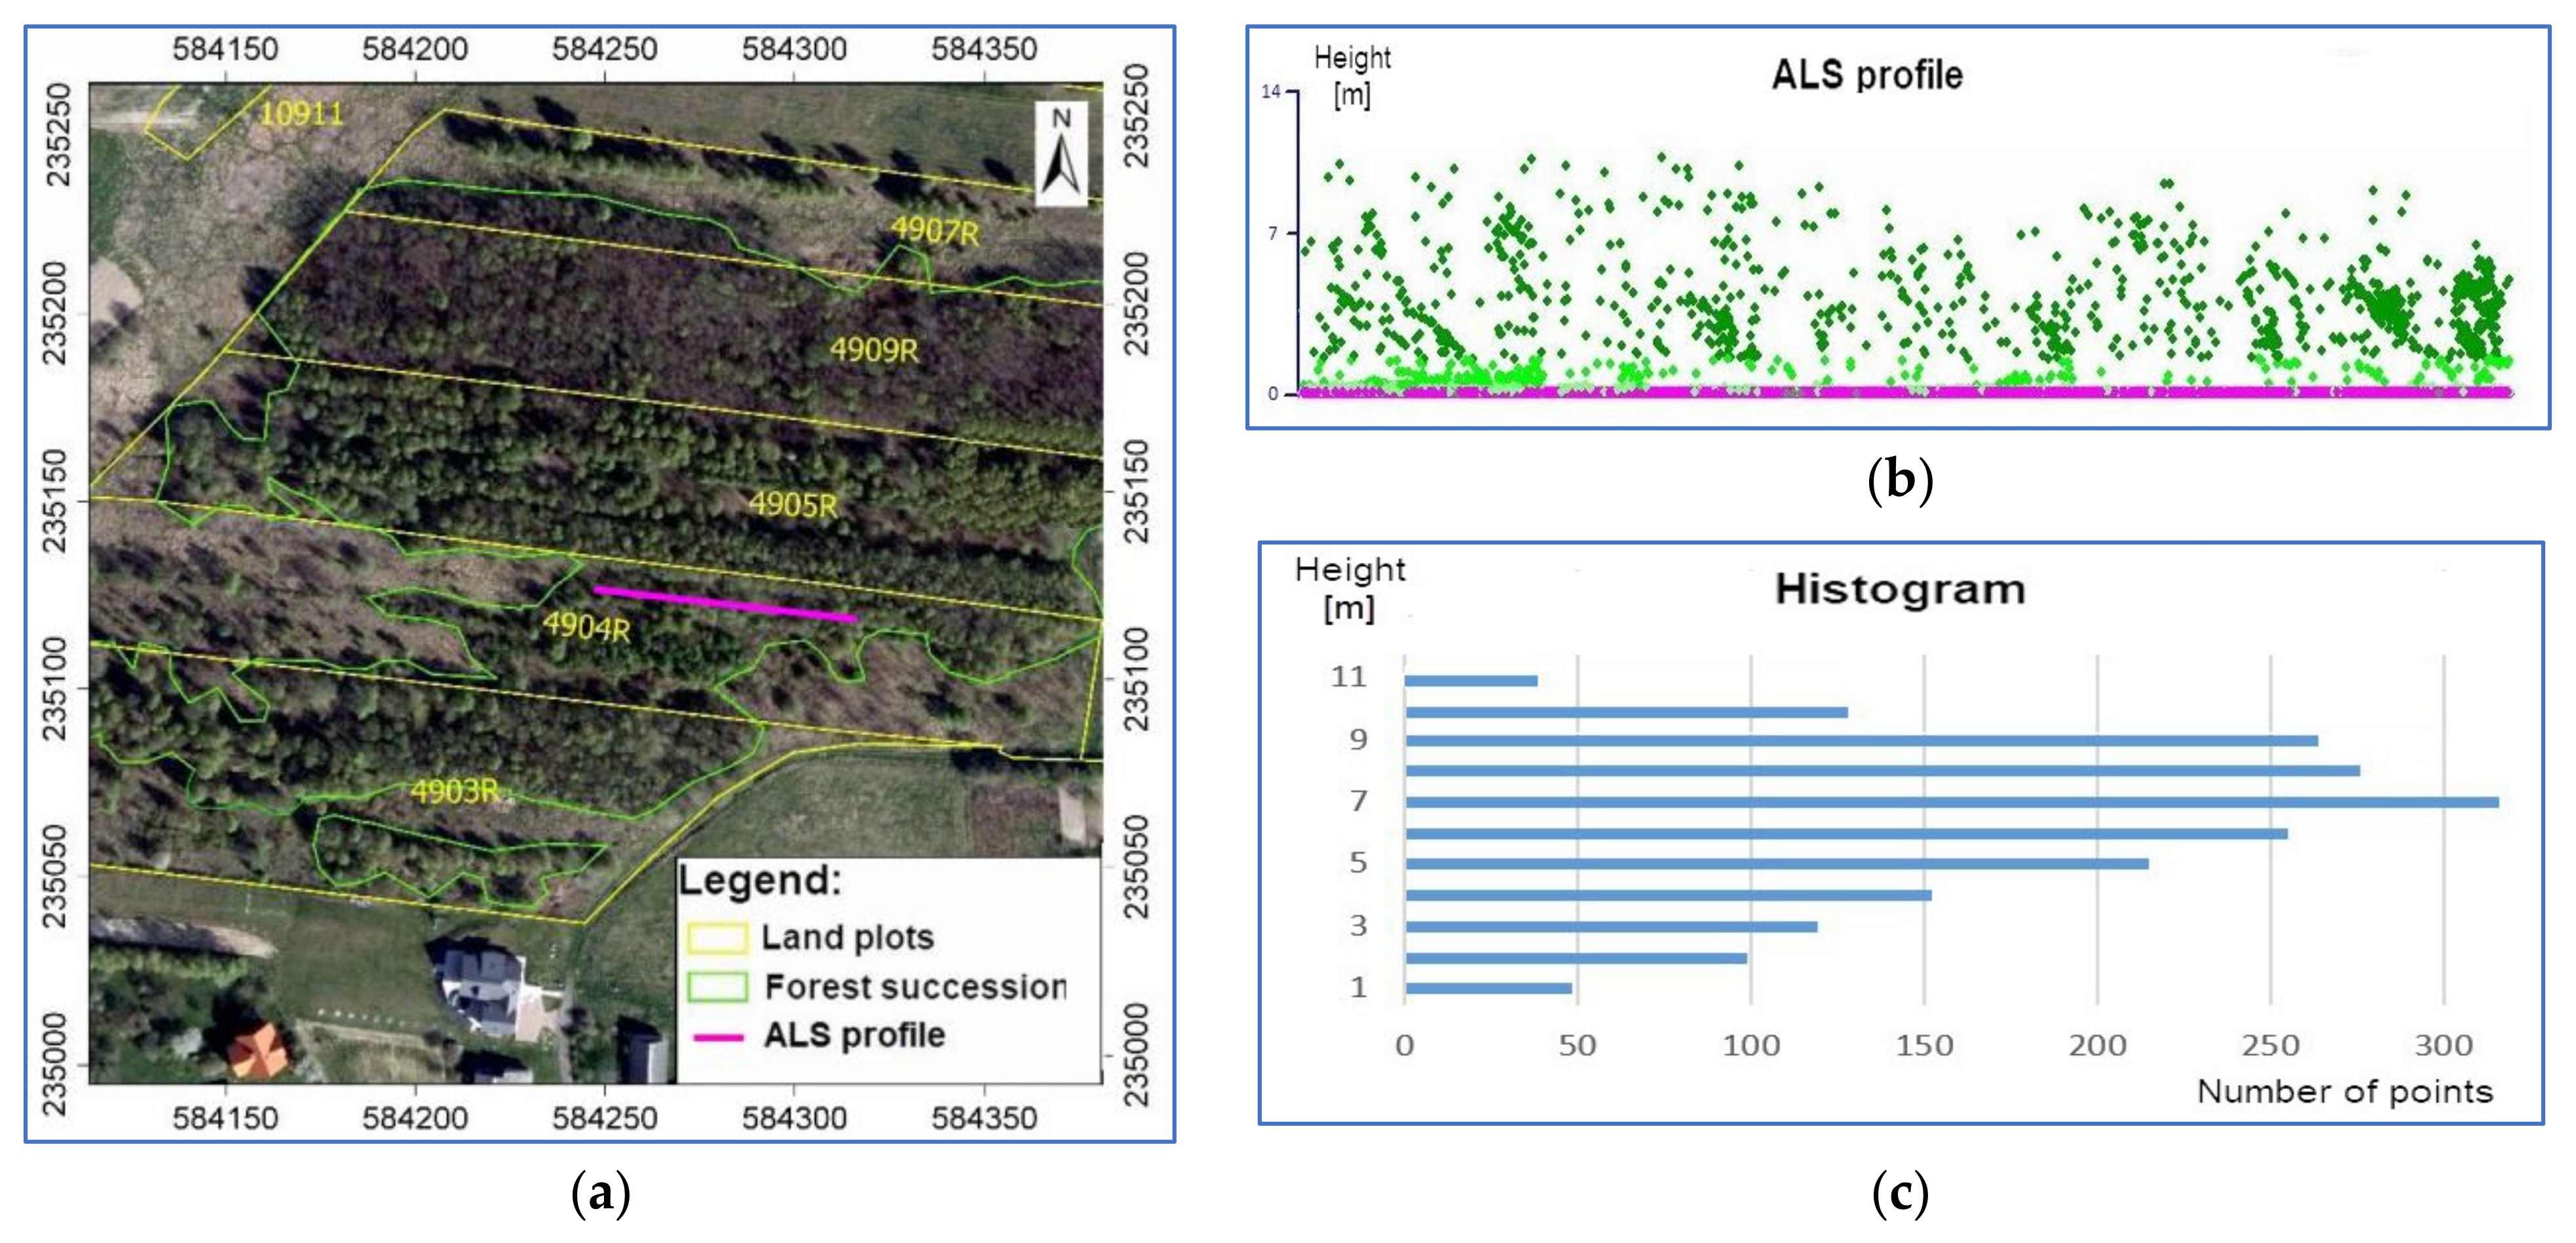
The canopy cover was generated using the Cover procedure (FUSION, [24]) with values of 0%–100%. The vertical structure of vegetation was visualized as histograms using the Densitymetrics method (the number of points reflected from the vegetation in 1-meter vertical intervals for the raster pixel [21].

3. Results

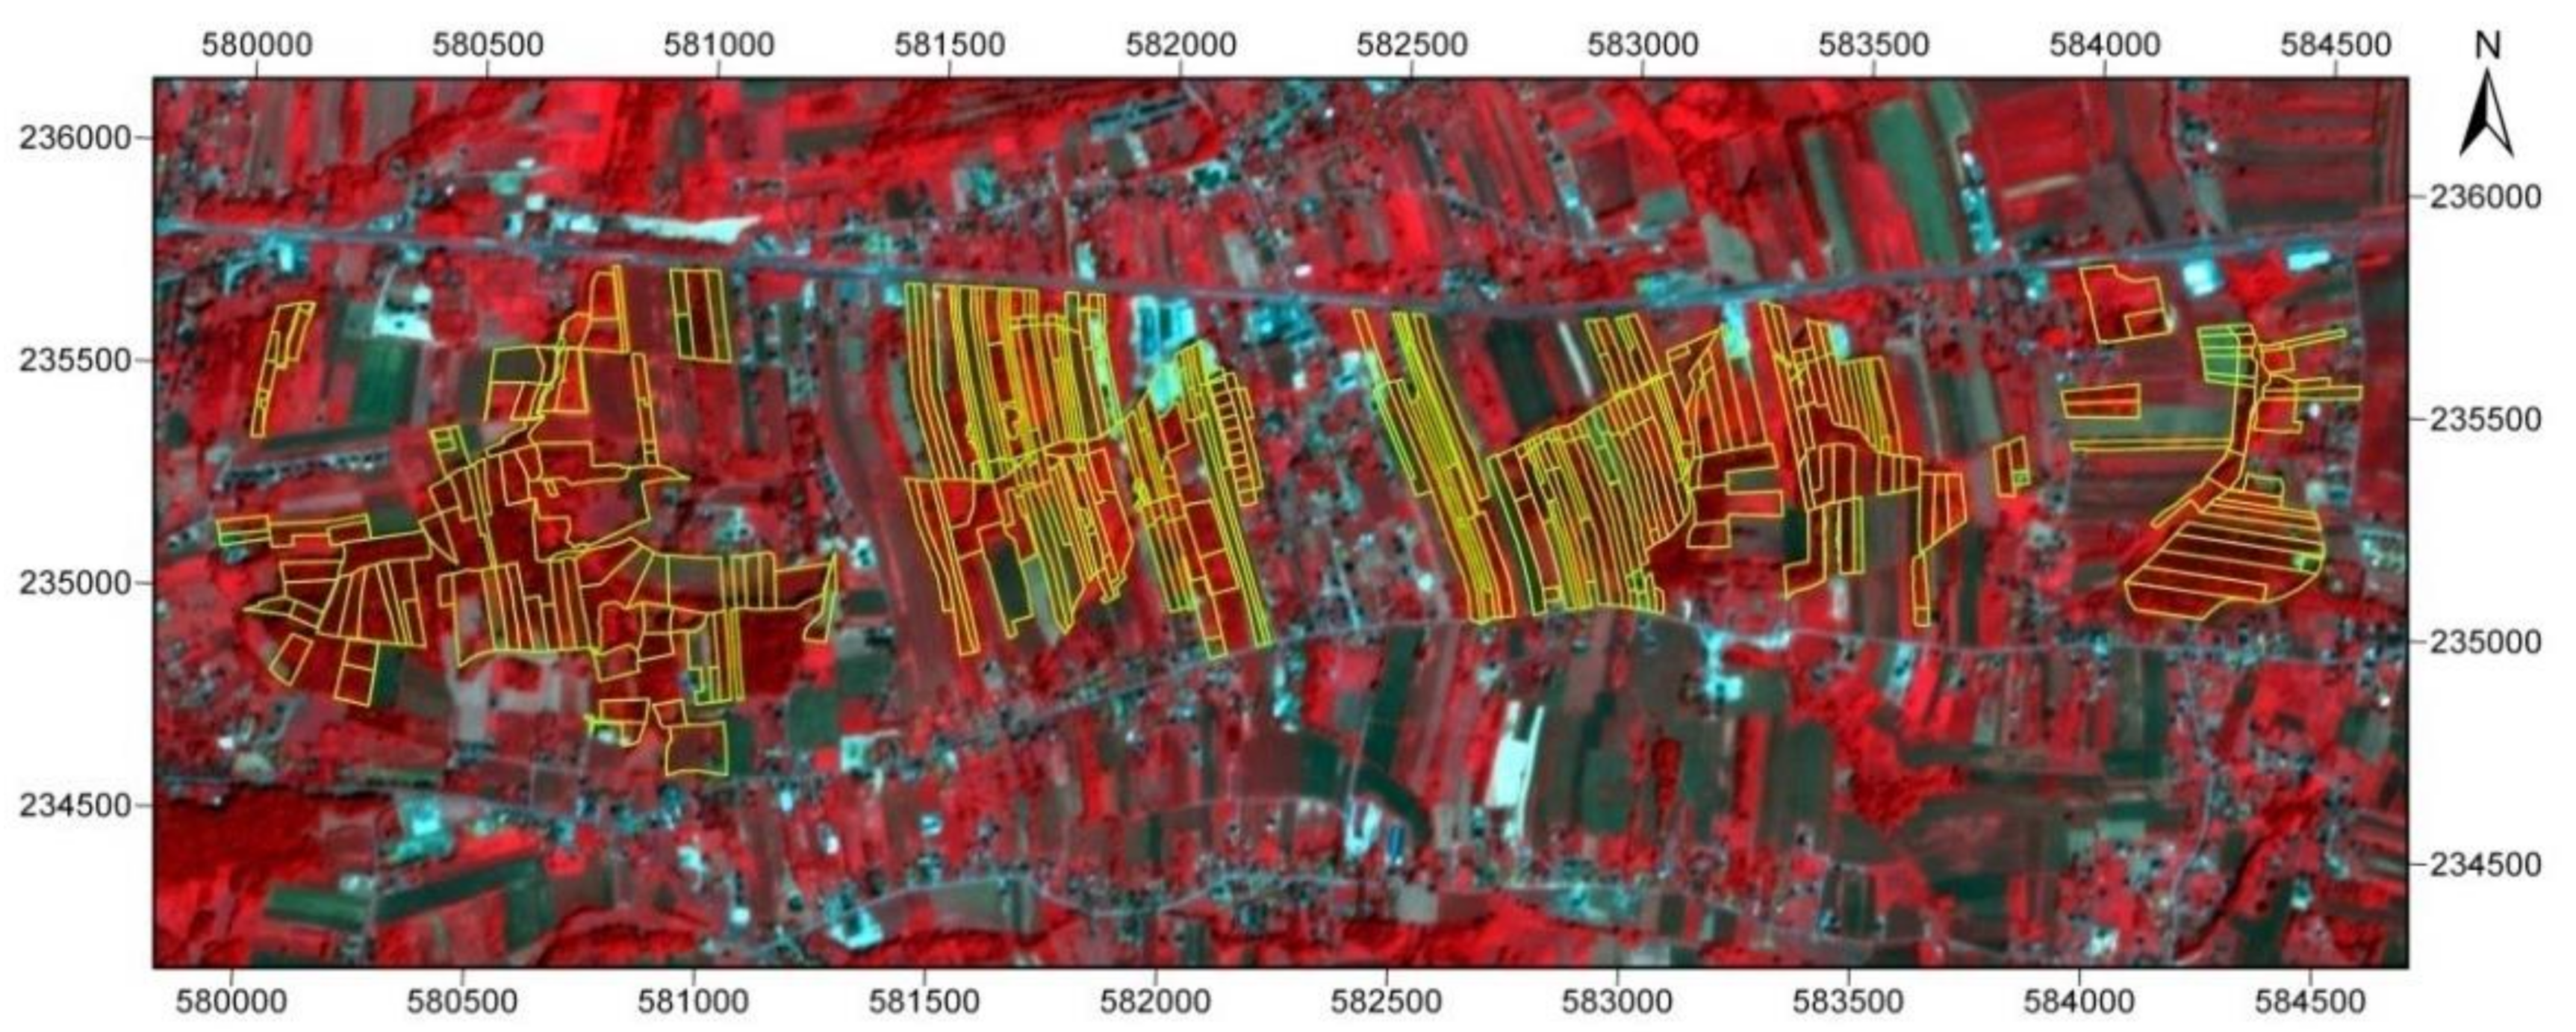
The part of the PlanetScope imagery with marked parcels concerning the analyzed area was shown in Figure 3. For the study area, there were identified LULC classes: Forests, Arable lands, Meadows, Pastures, and Others (Table 1). There were no analyzed parcels with LULC class as totally as Forests but parcels with a part as Forests and another part as a Meadows, Pastures, or Arable lands. Very often these parcels were identified as forest succession areas, so in this study were called Forested areas (Forests and forest succession).
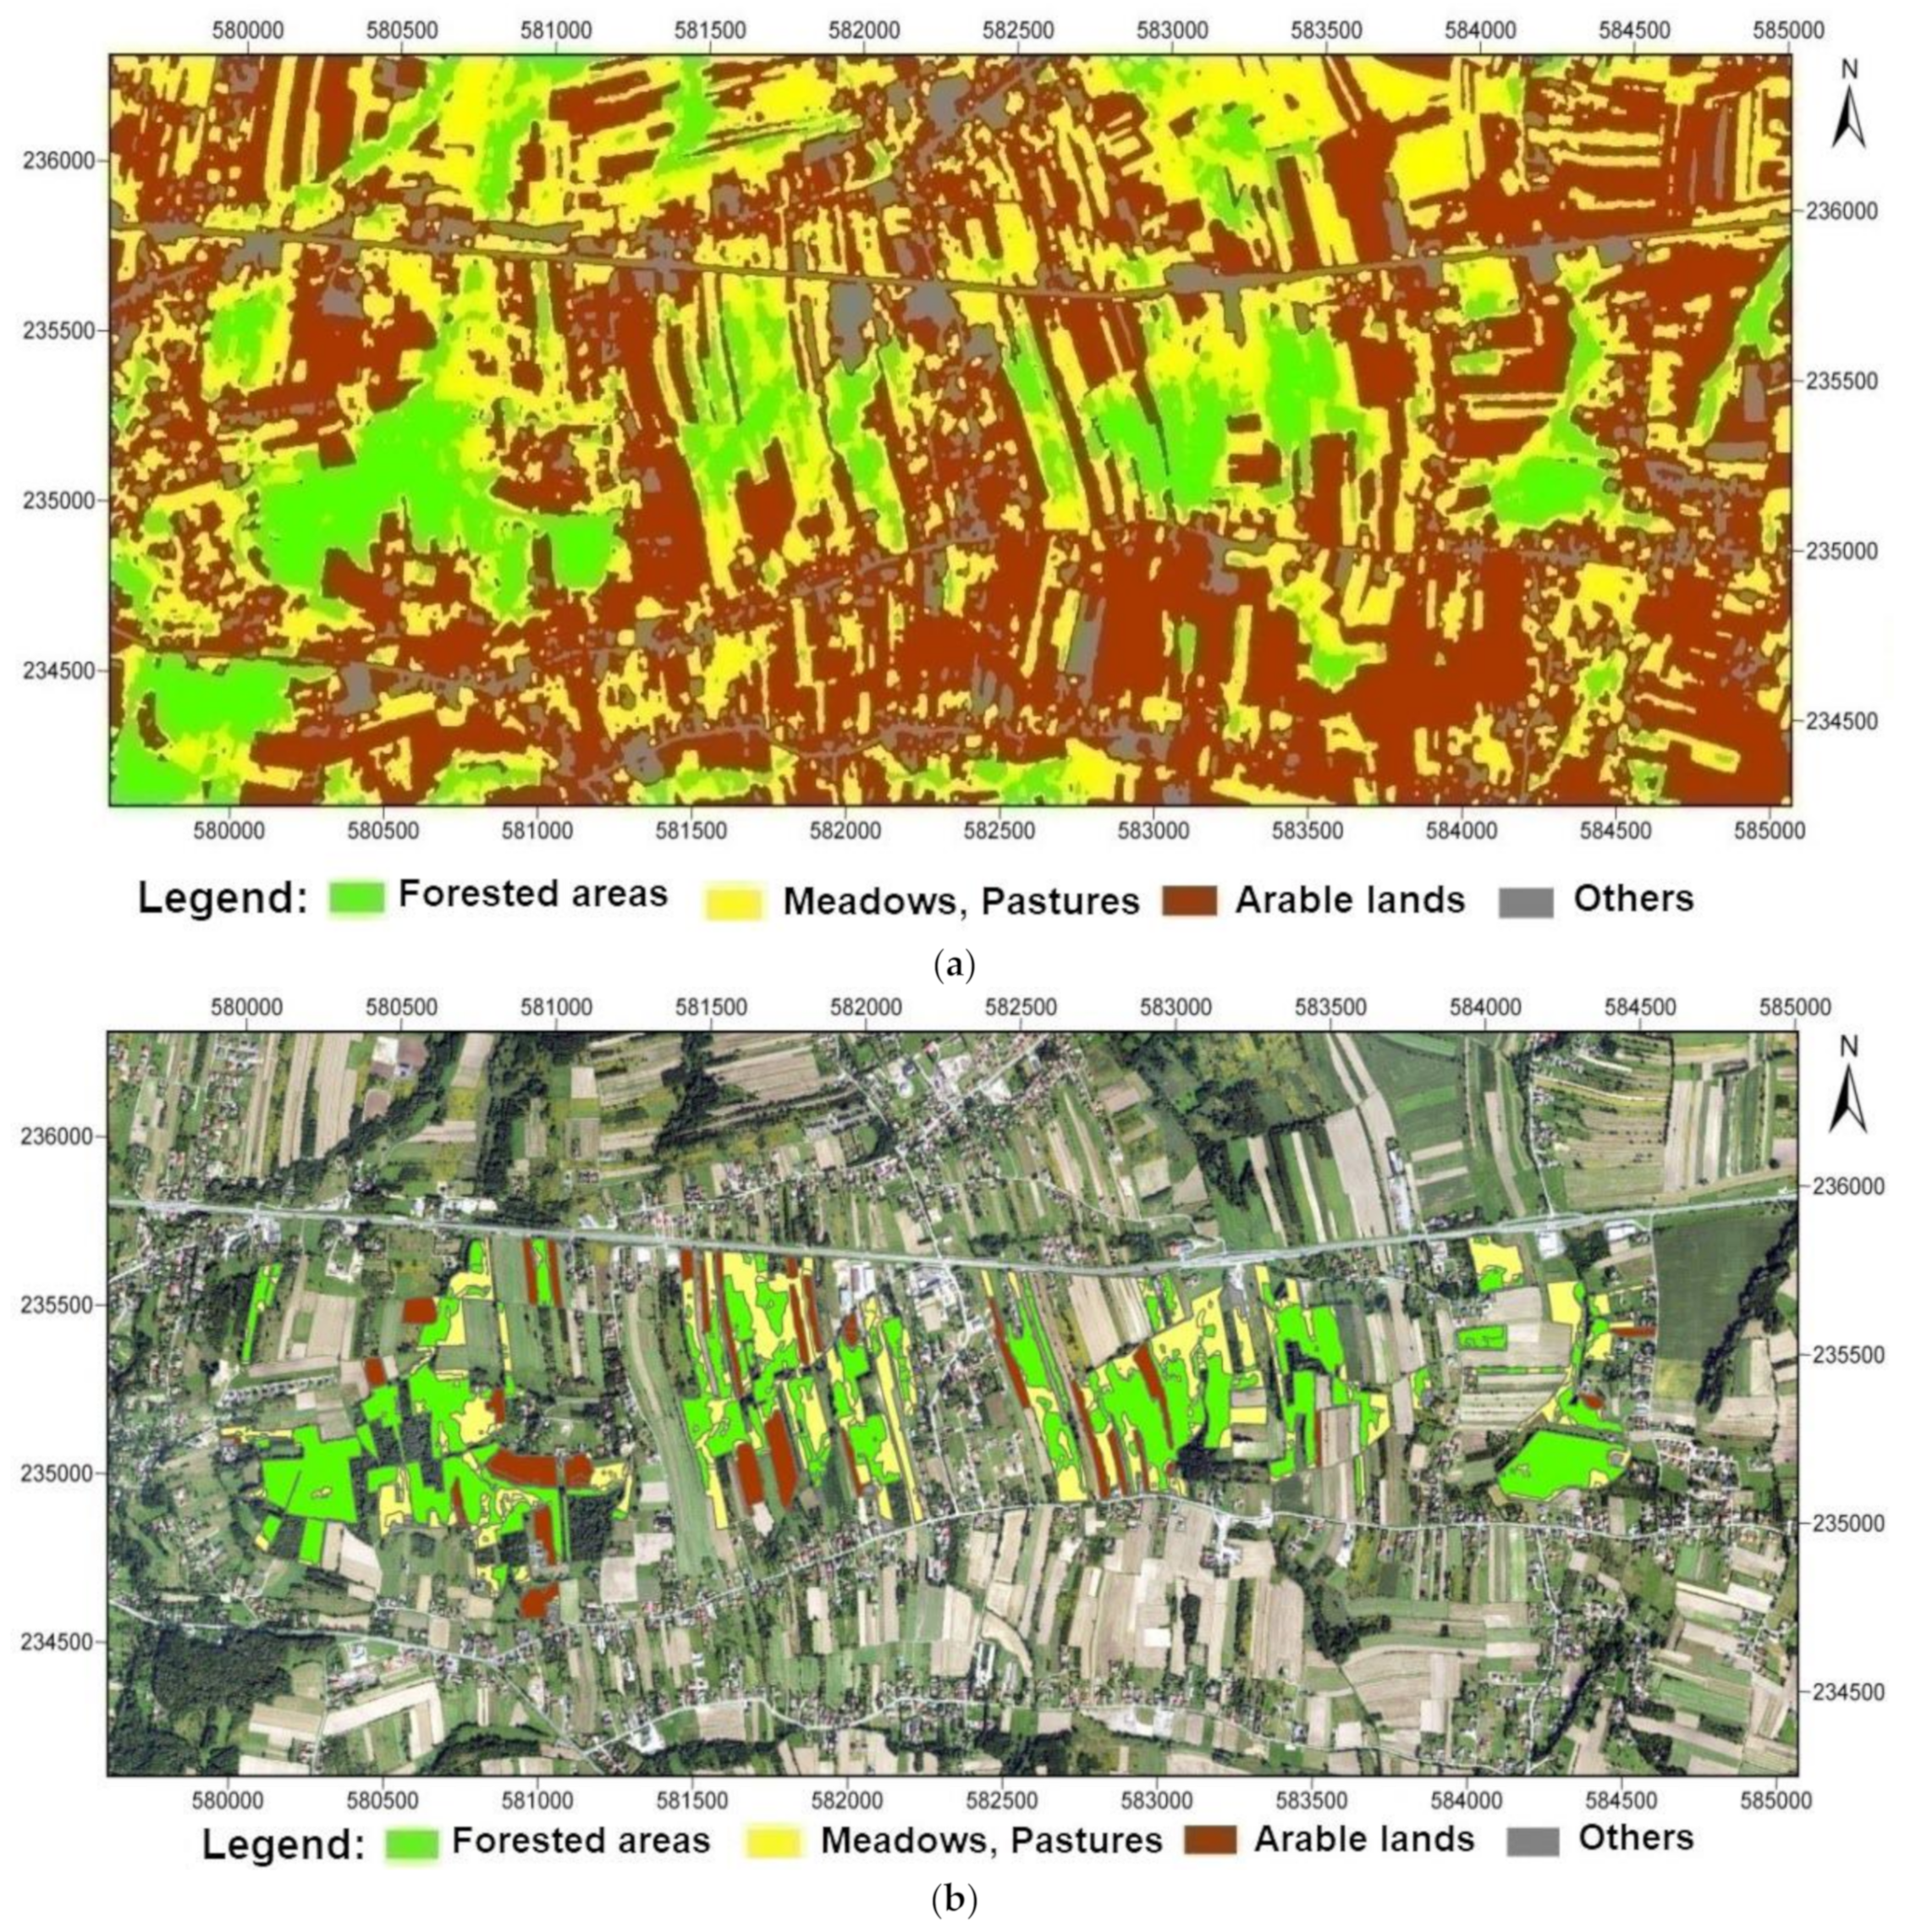
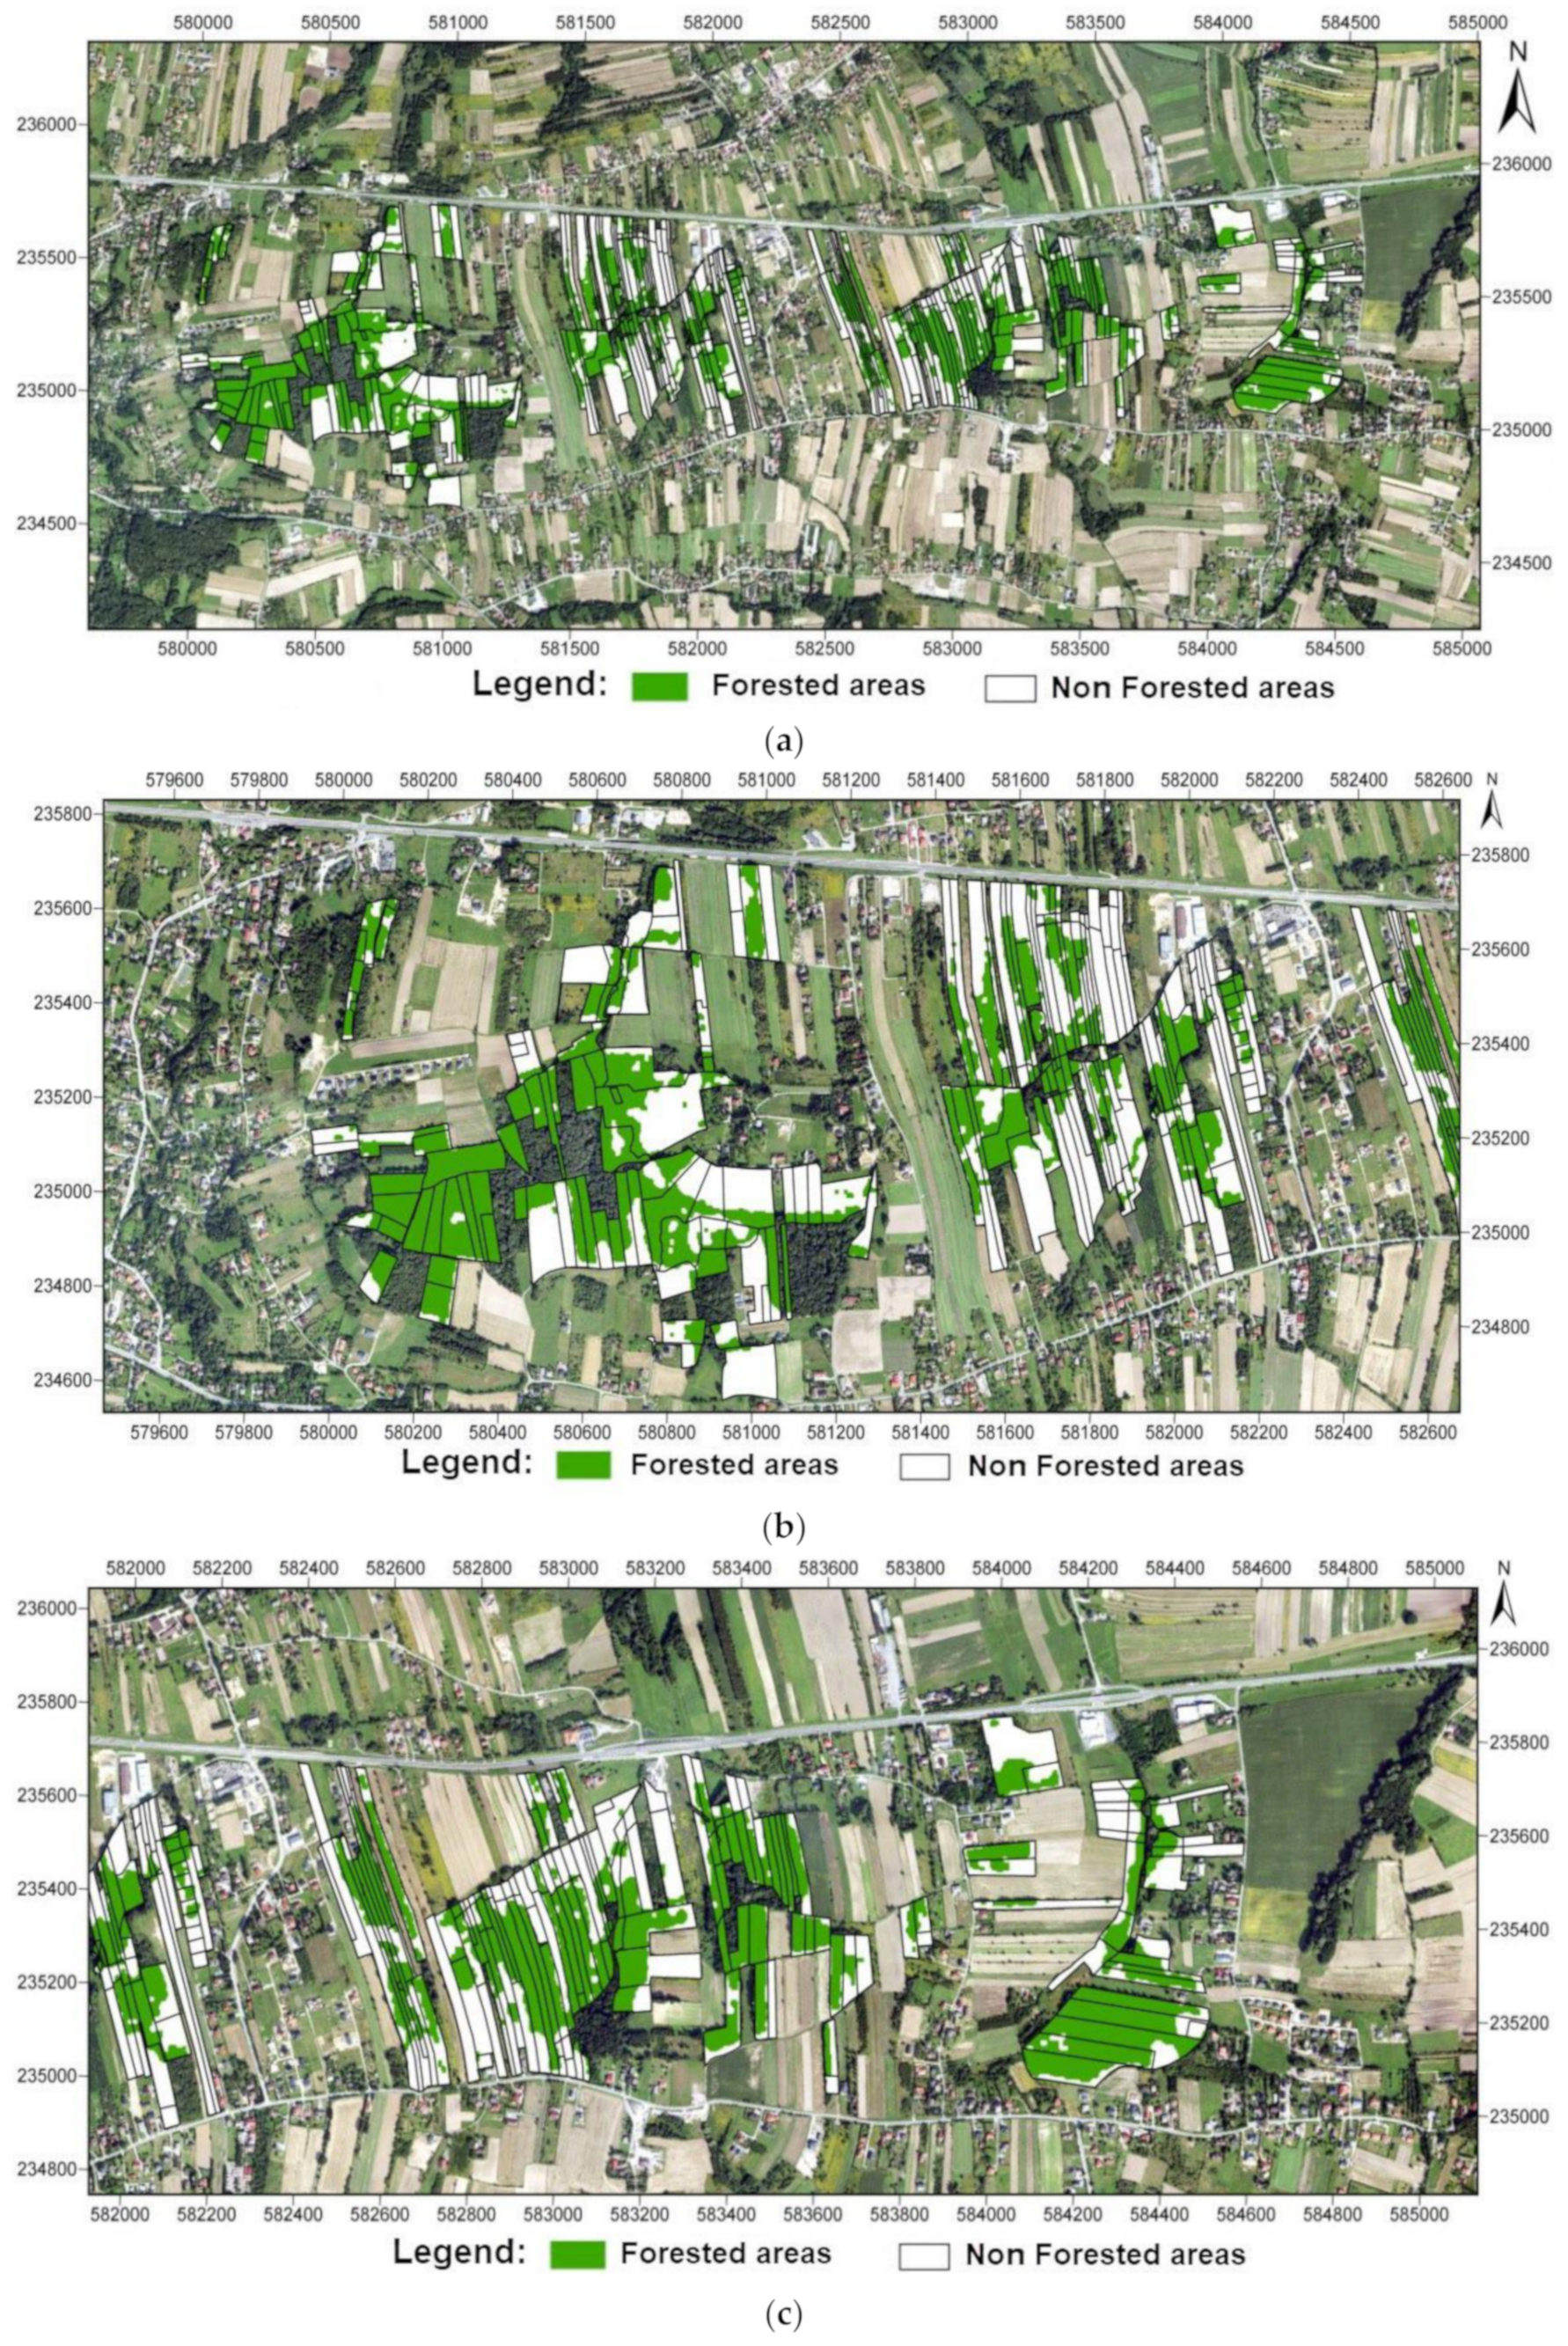
The LULC classes as a result of PlanetScope classification [25] are shown in Figure 4. There are presented for the part of the Planet-Scope image and as cropped to the analyzed area. The accuracy assessment parameters for LULC classes are presented in Table 2. The total parameter—Overall Accuracy was 96.40% and the Kappa coefficient was 94.52% (for Sentinel-2 image classification the accuracy parameters were on a similar level). The results of PlanetScope classification as the identified Forested areas are shown in Figure 5.
The result of image classification showed Forested areas in total values (Table 1): 62.77 ha using PlanetScope and 65.08 ha as a result of Sentinel-2 image classification, which takes 44.91% of the analyzed terrain for PlanetScope and 46.56% for Sentinel-2 (differences were: 3.31 ha, 1.65% in the percentage area). The intense forest succession process in terms of the occupied abandoned farmland area has been confirmed. Mainly it is a result of the abandonment of terrain classes: Meadows and Pastures.
Forested lands take values around six-time areas more (almost a 40% difference in percentage) than figured in the cadastral database (10.76 ha; 7.70%; Table 1). According to Polish law [26,27], a class Forest is designated as ground with forest vegetation (an area greater than 0.1 ha), and space related to forestry (forest’s roads, etc.). There are no included forest succession areas.
Photointerpretation and manual vectorization of the orthophotomaps has identified Forested areas as 56.32 ha (41.73% of the analyzed area). Uing the reclassification nDSM method [7,8] as a height > 1.0 m (Table 1—ALS) takes the result in value: 60.64 ha as Forested areas (43.39%). The difference between PlanetScope image classification according to the nDSM method are respectively: 2.13 ha; 1.52% (for Sentinel-2 image classification: 4.44 ha; 3.18%).
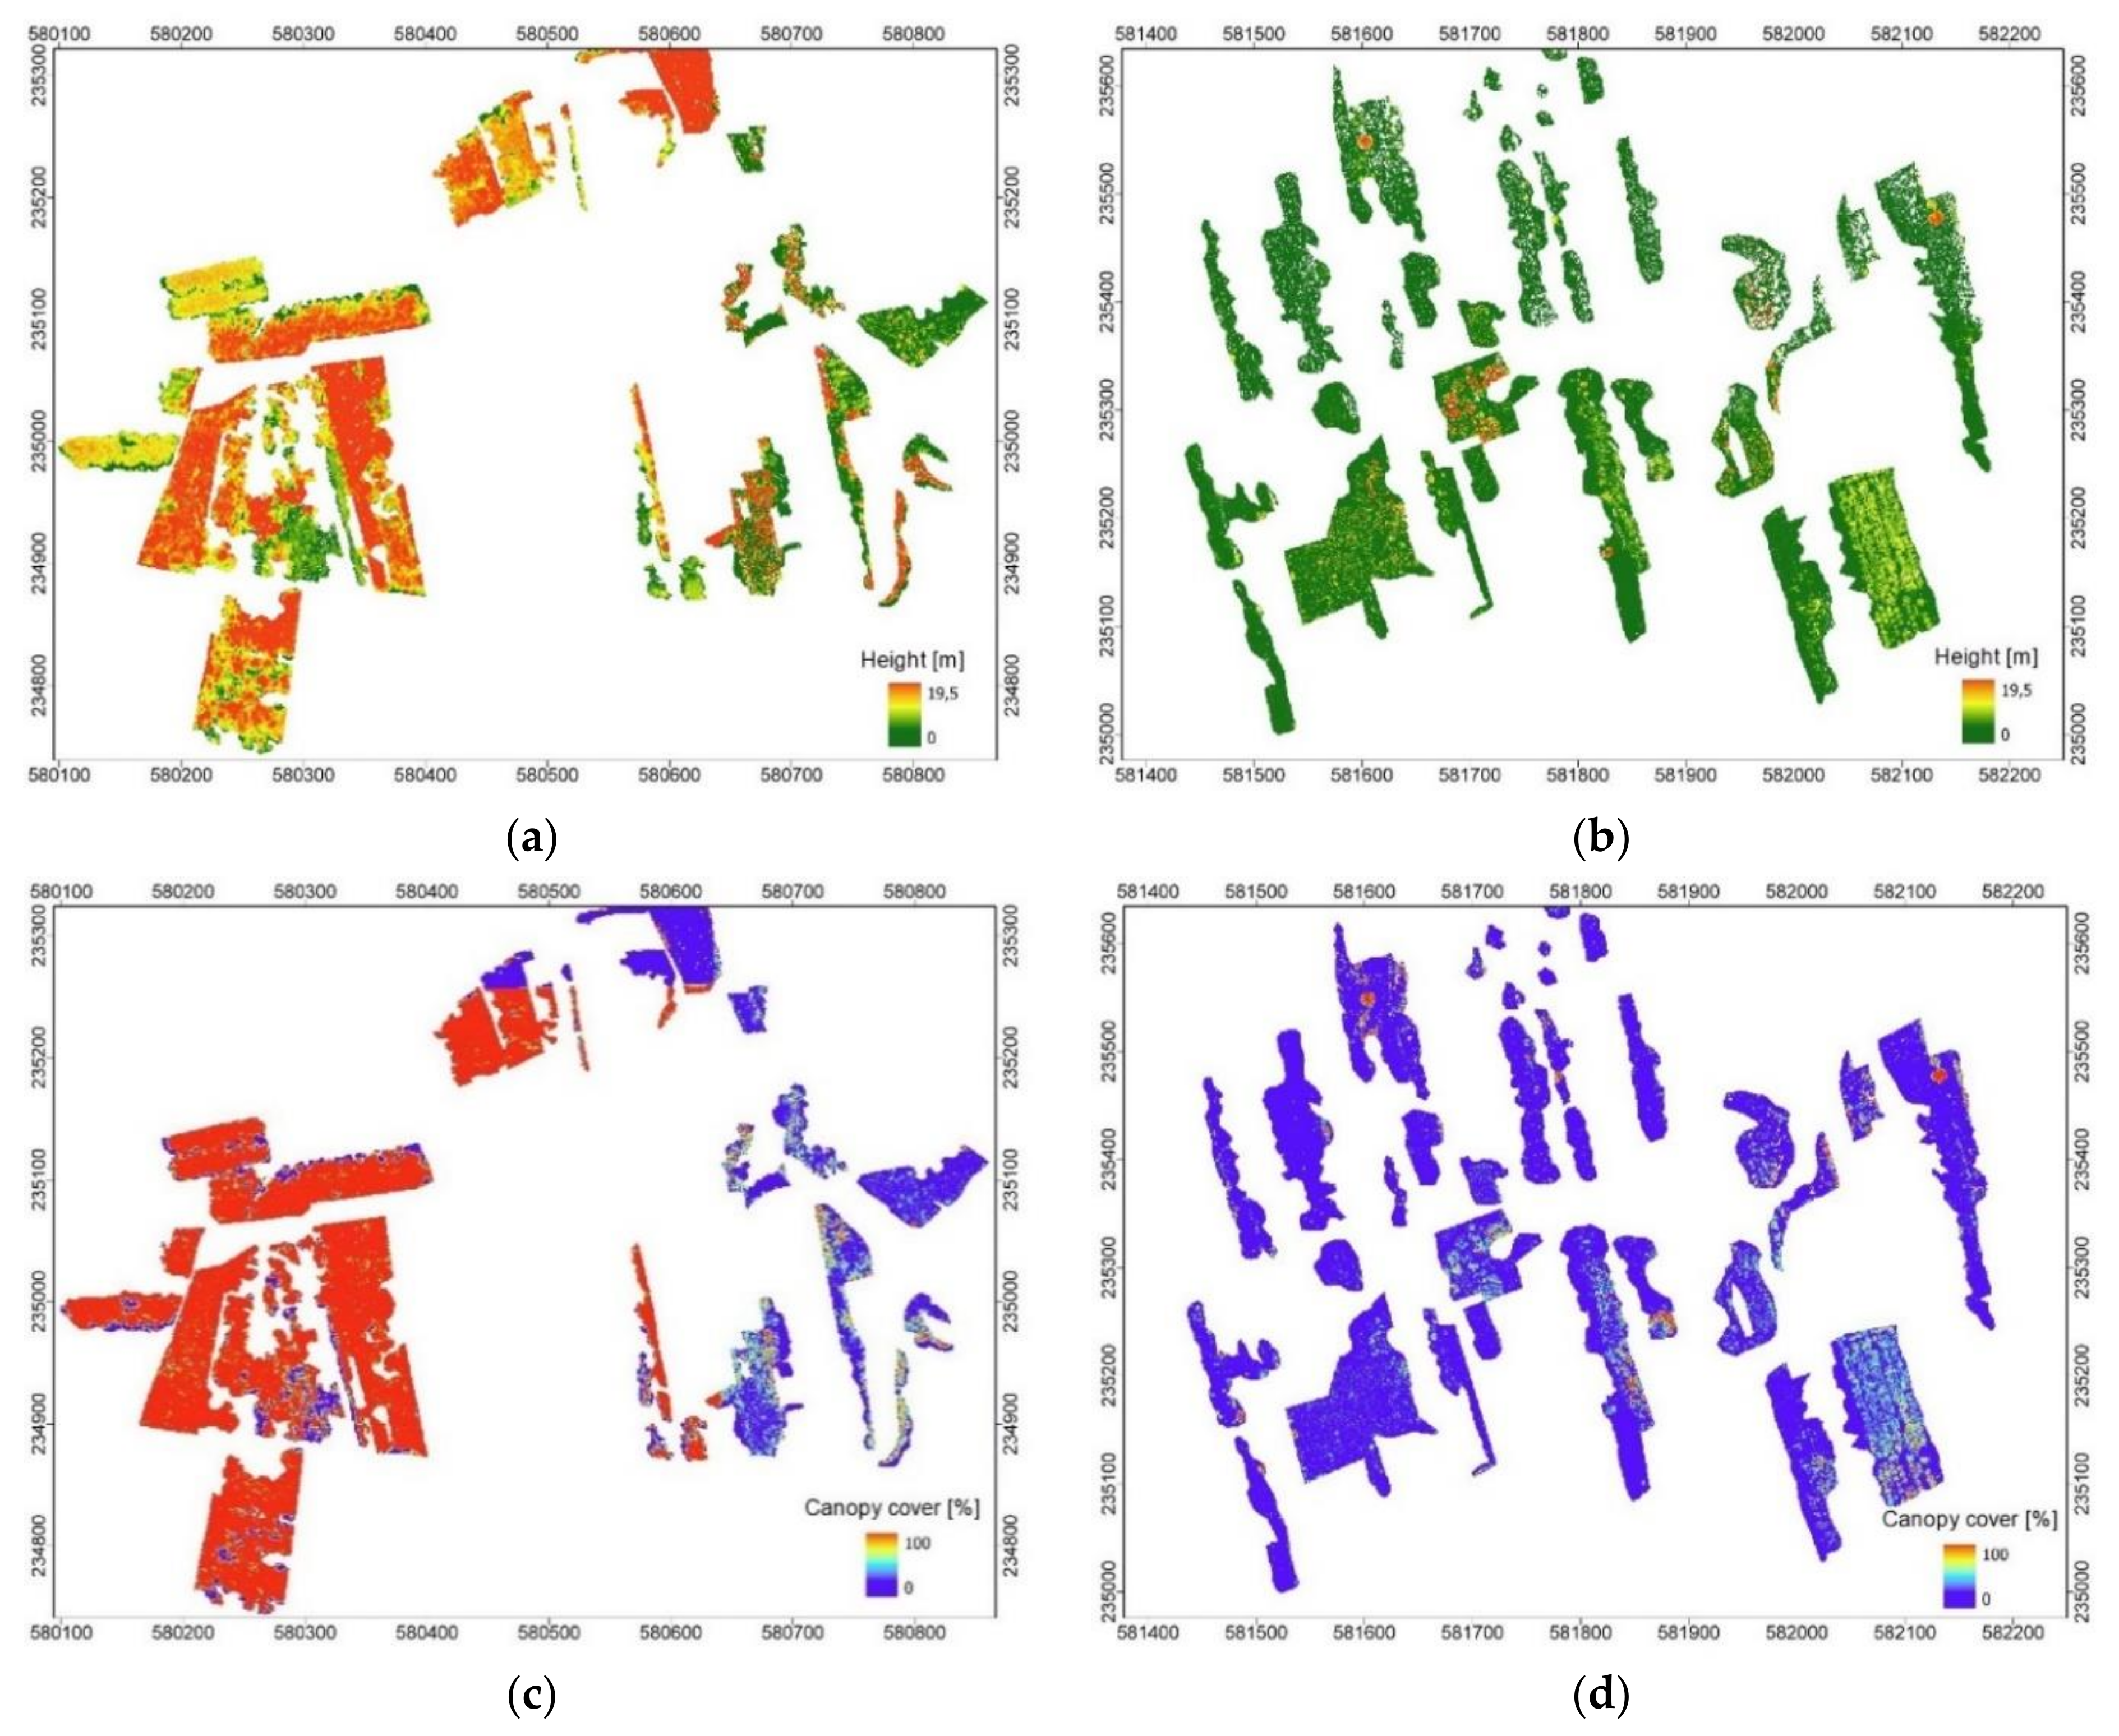
LiDAR (ALS) data usage was indicated to give comprehensive characteristics of vegetation specially to show the growth of forest-type plants. There were calculated parameters [15]: vegetation height (95th percentile), the standard deviation of height, and cover density. Figure 6 presented calculated parameters for the left and middle part of the study area, where the forest succession process increased. The greater values of height and canopy cover are on the left side of the analyzed area, where we can observe a more advanced forest succession process. The progress of forest succession in the occupied area and the growth of shrubs and trees were shown in the study area. Figure 7 presented an example of a profile and histogram generated to assess the spacious flora characteristics.

4. Discussion

In Poland, 78.4% of forests are administrated by The State Forests National Forest Holding, 17.4% are private forests and the rest of the forested areas there are national parks and other communal or public forested grounds. Forest cover in Poland, concerning the Increasing Forest Cover National Program [28], is to constitute 30% of the Poland area, and in the year 2050, it will be pronounced to 33%. It should be added that the actual area of forested grounds is higher than shown in the database of the Central Statistical Office [29,30]. Forecasts of the forest cover growth and plans for afforestation in Poland do not consider the terrain of forest succession—the process is beyond the reach of any control. Commonly, secondary forest succession areas are not specified in cadastral databases as forested grounds because an inventory of the land use is not done often. The forest succession terrains are frequently and constantly figured in cadastral data as agricultural lands. This problem is usually related to grounds located adjacent to the forest lands.
Using satellite images provides new solutions in environmental studies, connected to forest succession mapping [31,32,33], because of the revisit time combine with a good spatial and spectral resolution of the images. Image classification gives accurate data about the LULC changes and speeds up the evaluation of this phenomenon. Satellite imageries carry the data to develop geospatial insights about LULC changes and allow monitoring of areas of interest, discover trends and speed of vegetation changes, or validate information on the ground. We can cite as example research, where the Sentinel-2 satellite multispectral image was used to estimate stand density [34]. The relative accuracy of the estimation (verified by using WorldView-3 satellite high-spatial-resolution images) of the total number of plants in coniferous forests reached 81.57%, so this approach was a feasible way to estimate the absolute stand density on the hectare scale. Given that forest stand, height and density are relevant indicators for studies of carbon cycles and basic parameters for forest management, it requires precise mapping to better assess how it impacts the environment. Most often the calculation of stand range, height, and density has relied on the identification of individual trees which is difficult to balance cost and accuracy on large scale. The present work proposes a fast method to estimate stands parameters gained from remote sensing.
PlanetScope’s imageries give a dataset with a good connection of coverage, frequency, and resolution. In the previous research [35] we investigated the quality of land cover assessment, especially vegetation mapping, using PlanetScope imageries. We obtained precise, objective, and validated information (the Overall Accuracy = 92.8%) about the location, and range of the bushed and forested areas, formed or developed in the post-industrial analyzed area. Cyclic image processing combined with LiDAR data provides give great capabilities, to carry out large-area studies. LiDAR is a useful, and objective method for deriving information about the appearance of vegetation [36,37,38,39,40,41,42,43,44,45]. Falkowski et al. [39] evaluated the usage of LiDAR data for characterizing forest successional stages. Authors proved LiDAR useful for measuring or estimating forest attributes, such as canopy height, basal area, and Leaf Area Index (LAI), and to classify stages of three-dimensional forest development. Kolecka et al. [41] used vegetation information derived from LiDAR for mapping forest succession patterns. The results showed that around 31.0% (Overall Accuracy = 95.0%) of the agricultural land in the analyzed terrain (Szczawnica commune, Poland), is an area of secondary forest succession. The results of this study indicated that the methodology can be applied to large-scale mapping of secondary forest succession patterns on abandoned land. Kolecka [42] illustrated also that height of vegetation can be used to estimate when agricultural land was abandoned. During the initial stages of the succession process, the height of vegetation increases slowly and is uniform. Then creates a composition of various plant heights, sizes, and distributions. The usage of LiDAR especially airborne scanning or point clouds derived based on UAV images [46,47,48,49,50,51,52] gives an objective and exact assessment of many biometric features. The indicators are determined for planning and mapping and inventory of plant associations. Airborne laser scanner (ALS) point cloud processing gives precise data to perform spatial characteristics of vegetation.
In this paper, we indicate the automated PlanetScope image processing and LiDAR point cloud metrics determination to obtain objective, validated, and precise information about the range, location, and spatial structures of trees and shrubs formed in post-agricultural areas. Using PlanetScope imageries and LIDAR data, we get characteristics of the transitional woodland shrub and broad-leaved or coniferous forest. Further, regular LiDAR campaigns (airborne or from the UAV level) can provide biomass characteristics and the PlanetScope satellite constellation utilization is expected to expand in the future, so this research will be useful for readers who are considering the use of remotely sensed data in the future. Results demonstrate the potential advantage of using remote sensing data for monitoring changes in forest cover when cadastral data is not updated on regular basis.
Summing up, the most conclusive attribute of a forest ecosystem is site productivity. It is a fundamental parameter for planning and sustainability forest management and forest growth. The remotely sensed technologies allow for rating forest ecosystem attributes [53,54]. Therefore, landscape information and vegetation mapping can be used to evaluate long-time habitat development and the sustainable management of areas. Because of the causal effects of land abandonment in many regions of the world, it is necessary to provide monitoring the woody biomass and global carbon storage [55,56]. The spatial policy is valid for balanced ecosystem planning and gives also effective afforestation possibilities to the post-agricultural areas. We should focus on the protection of increasing habitats, and discuss the negative and positive effects of land abandonment. Geoinformation methods can help with this issue. Automated remote sensed procedures are useful and a combination of satellite or aerial images and LiDAR data provides good results.

5. Conclusions

The application of the PlanetScope image classification showed the intense process of secondary forest succession on abandoned farmland in the analyzed area. We got the correct information about the LULC classes compared to the information derived based on Sentinel-2 classification and airborne laser scanning point cloud processing. LiDAR data allowed additionally for an accurate assessment of the spatial structure of successional vegetation and showed a significant differentiation of the new ecosystem. This variety is visible in the 2D surface size and the vertical profile (3D) of vegetation, which indicate the natural forest succession process.
The presented study provides solutions in the context of monitoring forested areas according to the problem of carbon sequestration, and the need for reporting the forested area by individual countries to the European Union organization. We thus conclude that this approach is a feasible way to estimate the absolute stands range on the hectare scale and to derive precise parameters such as height and cover density of vegetation in forest succession areas.

Funding

This research was supported by the Ministry of Science and Higher Education of the Republic of Poland and the National Science Centre, Poland. The project number is 2019/03/X/NZ9/00424, MINIATURA-3.

Institutional Review Board Statement

Not applicable.

Informed Consent Statement

Not applicable.

Acknowledgments

Thanks to the Planet’s Education and Research (E&R) Program for the account to download imageries. Planet Application Program Interface: In Space for Life on Earth. San Francisco, CA, USA. https://api.planet.com (accessed on 7 September 2022).

Conflicts of Interest

The authors declare no conflict of interest. The funders had no role in the design of the study; in the collection, analyses, or interpretation of data; in the writing of the manuscript, or in the decision to publish the results.

References

  1. Bergen, K.M.; Dronova, I. Observing succession on aspen-dominated landscapes using a remote sensing-ecosystem approach. Landsc. Ecol. 2007, 22, 1395–1410. [Google Scholar] [CrossRef]
  2. Bowen, M.E.; Mcalpine, C.A.; House, A.P.N.; Smith, G.C. Regrowth forests on abandoned agricultural land: A review of their habitat values for recovering forest fauna. Biol. Conserv. 2007, 140, 273–296. [Google Scholar] [CrossRef]
  3. Ruskule, A.; Nikodemus, O.; Kasparinska, Z.; Kasparinskis, R.; Brumelis, G. Patterns of afforestation on abandoned agriculture land in Latvia. Agrofor. Syst. 2012, 85, 215–231. [Google Scholar] [CrossRef]
  4. Szwagrzyk, J. Forest succession on abandoned farmland; current estimates, forecasts and uncertainties. Sylwan 2004, 4, 53–59. [Google Scholar]
  5. Gniadek, J.; Pijanowski, J.; Śmigielski, M. Impact of the forest succession on efficiency of the arable land production. J. Water Land Dev. 2017, 34, 131–138. [Google Scholar] [CrossRef]
  6. Śmigielski, M.; Pijanowski, J.; Gniadek, J. Forest succession and afforestation of agricultural land as a current challenge agricultural works. Acta Sci. Pol. Form. Circumiectus 2017, 16, 51–63. [Google Scholar] [CrossRef]
  7. Szostak, M.; Wężyk, P.; Tompalski, P. Aerial orthophoto and airborne laser scanning as monitoring tools for land cover dynamics: A case study from the Milicz Forest District (Poland). Pure Appl. Geophys. 2014, 171, 857–866. [Google Scholar] [CrossRef] [Green Version]
  8. Wężyk, P.; Szostak, M.; Tompalski, P. Comparison of the accuracy of the “PHOTO” check method with automatic analysis based on ALS data for direct control of subsidy payments. Arch. Photogramm. Remote Sens. 2009, 20, 445–456. [Google Scholar]
  9. Susyan, E.A.; Wirth, S.; Ananyeva, N.D.; Stolnikova, E.V. Forest succession on abandoned arable soils in European Russia—Impacts on microbial biomass, fungal-bacterial ratio, and basal CO2 respiration activity. Eur. J. Soil Biol. 2011, 47, 169–174. [Google Scholar] [CrossRef]
  10. Buraczyk, W. Structure and Breeding Value of Self-Sown Woody Species in the Initial Phase of Secondary Succession on Post-Agricultural Lands of the Lower Part of Poland; Warsaw Univesity of Life Sciences Press: Warsaw, Poland, 2013. [Google Scholar]
  11. Kolecka, N.; Kozak, J.; Kaim, D.; Dobosz, M.; Ginzler, C.; Psomas, A. Mapping secondary forest succession on abandoned agricultural land in the Polish Carpathians. Int. Arch. Photogramm. Remote Sens. Spat. Inf. Sci. 2016, 41, 931–935. [Google Scholar] [CrossRef] [Green Version]
  12. Lasanta, T.; Arnáez, J.; Pascual, N.; Ruiz-Flaño, P.; Errea, M.P.; Lana-Renault, N. Space–time process and drivers of land abandonment in Europe. Catena 2017, 149, 810–823. [Google Scholar] [CrossRef]
  13. Prishchepov, A.V.; Volker, C.R.; Dubinin, M.; Alcantara, C. The Effect of Landsat ETM/ETM + Image Acquisition Dates on the Detection of Agricultural Land Abandonment in Eastern Europe. Remote Sens. Environ. 2012, 126, 195–209. [Google Scholar] [CrossRef]
  14. Singh, K.; Vogler, J.; Shoemaker, D.; Meentemeyer, R. LiDAR-Landsat data fusion for large area assessment of urban land cover: Balancing spatial resolution, data volume, and mapping accuracy. J. Photogramm. Remote Sens. 2012, 74, 110–121. [Google Scholar] [CrossRef]
  15. Bochenek, J. Analysis of ALS point clouds to determine the spatial structure of vegetation in the areas of secondary forest succession in the Wieliczka district. Master’s Thesis, The University of Agriculture in Krakow, Krakow, Poland, 2019. [Google Scholar]
  16. ESA. Sentinel-2. 2022. Available online: https://sentinel.esa.int (accessed on 1 January 2022).
  17. Planet’s Education and Research (E&R) Program, Planet Team. Planet Application Program Interface: In Space for Life on Earth, San Francisco, CA. 2017. Available online: https://api.planet.com (accessed on 1 January 2022).
  18. Planet. 2022. Available online: https://www.planet.com/products/planet-imagery (accessed on 1 January 2022).
  19. Main Office of Geodesy and Cartography. ISOK Project. 2022. Available online: https://www.isok.gov.pl/index.html (accessed on 1 January 2022).
  20. Copernicus Program, ESA. 2022. Available online: https://www.copernicus.eu/pl (accessed on 1 January 2022).
  21. McGaughey, R.J. Fusion/ldv: Software for Lidar Data Analysis and Visualization; Software manual; USDA Forest Service, Pacific Northwest Research Station: Portland, OR, USA, 2012. [Google Scholar]
  22. Naesset, E. Predicting forest stand characteristics with airborne scanning laser using a practical two-stage procedure and field data. Remote Sens. Environ. 2002, 80, 80–99. [Google Scholar] [CrossRef]
  23. Naesset, E.; Økland, T. Estimating tree height and tree crown properties using airborne scanning laser in a boreal nature reserve. Remote Sens. Environ. 2002, 79, 105–115. [Google Scholar] [CrossRef]
  24. Mcgaughey, R.J.; Carson, W.; Reutebuch, S.; Andersen, H.E. Direct measurement of individual tree characteristics from lidar data. In Proceedings of the Annual ASPRS Conference, Denver, CO, USA, 23–28 May 2004. [Google Scholar]
  25. Sadkowski, P. Identification areas of secondary forest succession in the areas of Milicz and Biskupice commune with the use of PlanetScope satellite imagery. Master’s Thesis, The University of Agriculture in Krakow, Krakow, Poland, 2021. [Google Scholar]
  26. Act of Forest. In Journal of Laws; ECOLEX: Warsaw, Poland, 1991; Volume 101, p. 444.
  27. Act of land and building register. In Journal of Laws; Regulation of the Minister of Development, Labor and Technology: Warsaw, Poland, 2021.
  28. Ministry of the Environment. National Program for Increasing Woodness. In Document Adopted for Implementation by a Resolution of the Council of Ministers in June 1995; updated in 2003; Ministry of the Environment: Warsaw, Poland, 2003. [Google Scholar]
  29. Hościło, A.; Mirończuk, A.; Lewandowska, A. Determination of the actual forest area in Poland based on the available spatial datasets. Sylwan 2016, 160, 627–634. [Google Scholar]
  30. Jabłoński, M.; Mionskowski, M.; Budniak, P. Forest area in Poland based on national forest inventory. Sylwan 2018, 162, 365–372. [Google Scholar]
  31. Forkuor, G.; Dimobe, K.; Serme, I.; Tondoh, J.E. Landsat-8 vs. Sentinel-2: Examining the added value of Sentinel-2′s red-edge bands to land-use and land-cover mapping in Burkina Faso. GISci. Remote Sens. 2018, 55, 331–354. [Google Scholar] [CrossRef]
  32. Marangoz, A.M.; Sekertekin, A.; Akçin, H. Analysis of land use land cover classification results derived from Sentinel-2 image. In Proceedings of the 17th International Multidisciplinary Scientific GeoConference Surveying Geology and Mining Ecology Management, SGEM2017, Vienna, Austria, 27–29 November 2017; pp. 25–32. [Google Scholar]
  33. Sekertekin, A.; Marangoz, A.M.; Akcin, H. Pixel-based classification analysis of land use land cover using Sentinel-2 and Landsat-8 data. Int. Arch. Photogramm. Remote Sens. 2017, 42, 91–93. [Google Scholar] [CrossRef] [Green Version]
  34. Zhang, Z.; Dong, X.; Tian, J.; Tian, Q.; Xi, Y.; He, D. Stand density estimation based on fractional vegetation coverage from Sentinel-2 satellite imagery. Int. J. Appl. Earth Obs. Geoinf. 2022, 108, 102760. [Google Scholar] [CrossRef]
  35. Szostak, M.; Likus-Cieślik, J.; Pietrzykowski, M. PlanetScope Imageries and LiDAR Point Clouds Processing for Automation Land Cover Mapping and Vegetation Assessment of a Reclaimed Sulfur Mine. Remote Sens. 2021, 13, 2717. [Google Scholar] [CrossRef]
  36. Alberti, G.; Boscutti, F.; Pirotti, F.; Bertacco, C.; De Simon, G.; Sigura, M.; Cazorzi, F.; Bonfanti, P. A LiDAR-based approach for a multi-purpose characterization of Alpine forests: An Italian case study. iForest 2013, 6, 156–168. [Google Scholar] [CrossRef] [Green Version]
  37. Andersen, H.E.; Reutebuch, S.E.; McGaughey, R.J. A rigorous assessment of tree height measurements was obtained using airborne lidar and conventional field methods. Can. J. Remote Sens. 2006, 32, 355–366. [Google Scholar] [CrossRef]
  38. Bork, E.; Su, J. Integrating LIDAR data and multispectral imagery for enhanced classification of rangeland vegetation: A meta-analysis. Remote Sens. Environ. 2007, 111, 11–24. [Google Scholar] [CrossRef]
  39. Falkowski, M.J.; Evans, J.S.; Martinuzzi, S.; Gessler, P.E.; Hudak, A.T. Characterizing forest succession with lidar data: An evaluation for the Inland Northwest, USA. Remote Sens. Environ. 2009, 113, 946–956. [Google Scholar] [CrossRef] [Green Version]
  40. Hyyppä, J.; Hyyppä, H.; Litkey, P.; Yu, X.; Haggrén, H.; Rönnholm, P.; Pyysalo, U.; Pitkanen, J.; Maltamo, M. Algorithms and methods of airborne laser-scanning for forest measurements. Int. Arch. Photogramm. Remote Sens. Spat. Inf. Sci. 2004, 36, 82–89. [Google Scholar]
  41. Kolecka, N.; Kozak, J.; Kaim, D.; Dobosz, M.; Ginzler, C.; Psomas, A. Mapping secondary forest succession on abandoned agricultural land with LiDAR point clouds and terrestrial photography. Remote Sens. 2015, 7, 8300–8322. [Google Scholar] [CrossRef] [Green Version]
  42. Kolecka, N. Height of Successional Vegetation Indicates Moment of Agricultural Land Abandonment. Remote Sens. 2018, 10, 1568. [Google Scholar] [CrossRef] [Green Version]
  43. Maier, B.; Tiede, D.; Dorren, L. Characterising mountain forest structure using landscape metrics on LIDAR-based canopy surface models. In Object-Based Image Analysis; Springer: Berlin/Heidelberg, Germany, 2008; pp. 625–643. [Google Scholar] [CrossRef]
  44. Maltamo, M.; Mustonen, K.; Hyyppa, J.; Pitkanen, J.; Yu, X. The accuracy of estimating individual tree variables with airborne laser scanning in a boreal nature reserve. Can. J. For. Res. 2004, 34, 1791–1801. [Google Scholar] [CrossRef]
  45. Szostak, M. Automated land cover change detection and forest succession monitoring using LiDAR Point Clouds and GIS analyses. Geosciences 2020, 10, 321. [Google Scholar] [CrossRef]
  46. Koska, B.; Jirkab, V.; Urbana, R.; Kremena, T.; Hesslerovab, P.; Jona, J.; Pospisila, J.; Fogl, M. Suitability, characteristics, and comparison of an airship UAV with lidar for middle size area mapping. Int. J. Remote Sens. 2017, 38, 2973–2990. [Google Scholar] [CrossRef]
  47. Moudrý, V.; Gdulová, K.; Fogl, M.; Klápště, P.; Urban, R.; Komárek, J.; Moudrá, L.; Štroner, M.; Barták, V.; Solský, M. Comparison of leaf-off and leaf-on combined UAV imagery and airborne LiDAR for assessment of a post-mining site terrain and vegetation structure: Prospects for monitoring hazards and restoration success. Appl. Geogr. 2019, 104, 32–41. [Google Scholar] [CrossRef]
  48. Osińska-Skotak, K.; Jełowiecki, Ł.; Bakuła, K.; Michalska-Hejduk, D.; Wylazłowska, J.; Kopeć, D. Analysis of using dense image matching techniques to study the process of secondary succession in non-forest natura 2000 habitats. Remote Sens. 2019, 11, 893. [Google Scholar] [CrossRef] [Green Version]
  49. Ostrowski, W.; Górski, K.; Pilarska, M.; Salach, A.; Bakuła, K. Comparison of the laser scanning solutions for the unmanned aerial vehicles. Arch. Photogramm. Cartogr. Remote Sens. 2017, 29, 101–123. [Google Scholar] [CrossRef]
  50. Urban, R.; Koska, B.; Moudry, V.; Solsky, M. Terrain of post mining site from airship lidar. In Proceedings of the 16th International Multidisciplinary Scientific GeoConference, SGEM2016, Albena, Bulgaria, 30 June–6 July 2016; Volume 2, pp. 577–584. [Google Scholar] [CrossRef]
  51. White, J.; Stepper, C.; Tompalski, P.; Coops, N.; Wulder, M. Comparing ALS and Image-Based Point Cloud Metrics and Modelled Forest Inventory Attributes in Complex Coastal Forest Environment. Forests 2015, 6, 3704–3732. [Google Scholar] [CrossRef]
  52. White, J.; Wulder, M.; Vastaranta, M.; Coops, N.; Pitt, D.; Woods, M. The Utility of Image-Based Point Clouds for Forest Inventory: A Comparison with Airborne Laser Scanning. Forests 2013, 4, 518–536. [Google Scholar] [CrossRef] [Green Version]
  53. Tymińska-Czabańska, L.; Hawryło, P.; Socha, J. Assessment of the effect of stand density on the height growth of Scots pine using repeated ALS data. Int. J. Appl. Earth Obs. Geoinf. 2022, 108, 102763. [Google Scholar] [CrossRef]
  54. Ai, J.; Zhang, C.; Chen, L.; Li, D. Mapping annual land use and land cover changes in the Yangtze estuary region using an object-based classification framework and Landsat time series data. Sustainability 2020, 12, 659. [Google Scholar] [CrossRef] [Green Version]
  55. Sackov, I.; Barka, I.; Bucha, T. Mapping Aboveground Woody Biomass on Abandoned Agricultural Land Based on Airborne Laser Scanning Data. Remote Sens. 2020, 12, 4189. [Google Scholar] [CrossRef]
  56. Verstegen, J.; der Laan, C.; Dekkerb, S.; Faaij, A.; Santos, M. Recent and projected impacts of land use and land cover changes on carbon stocks and biodiversity in East Kalimantan, Indonesia. Ecol. Indic. 2019, 103, 563–575. [Google Scholar] [CrossRef]
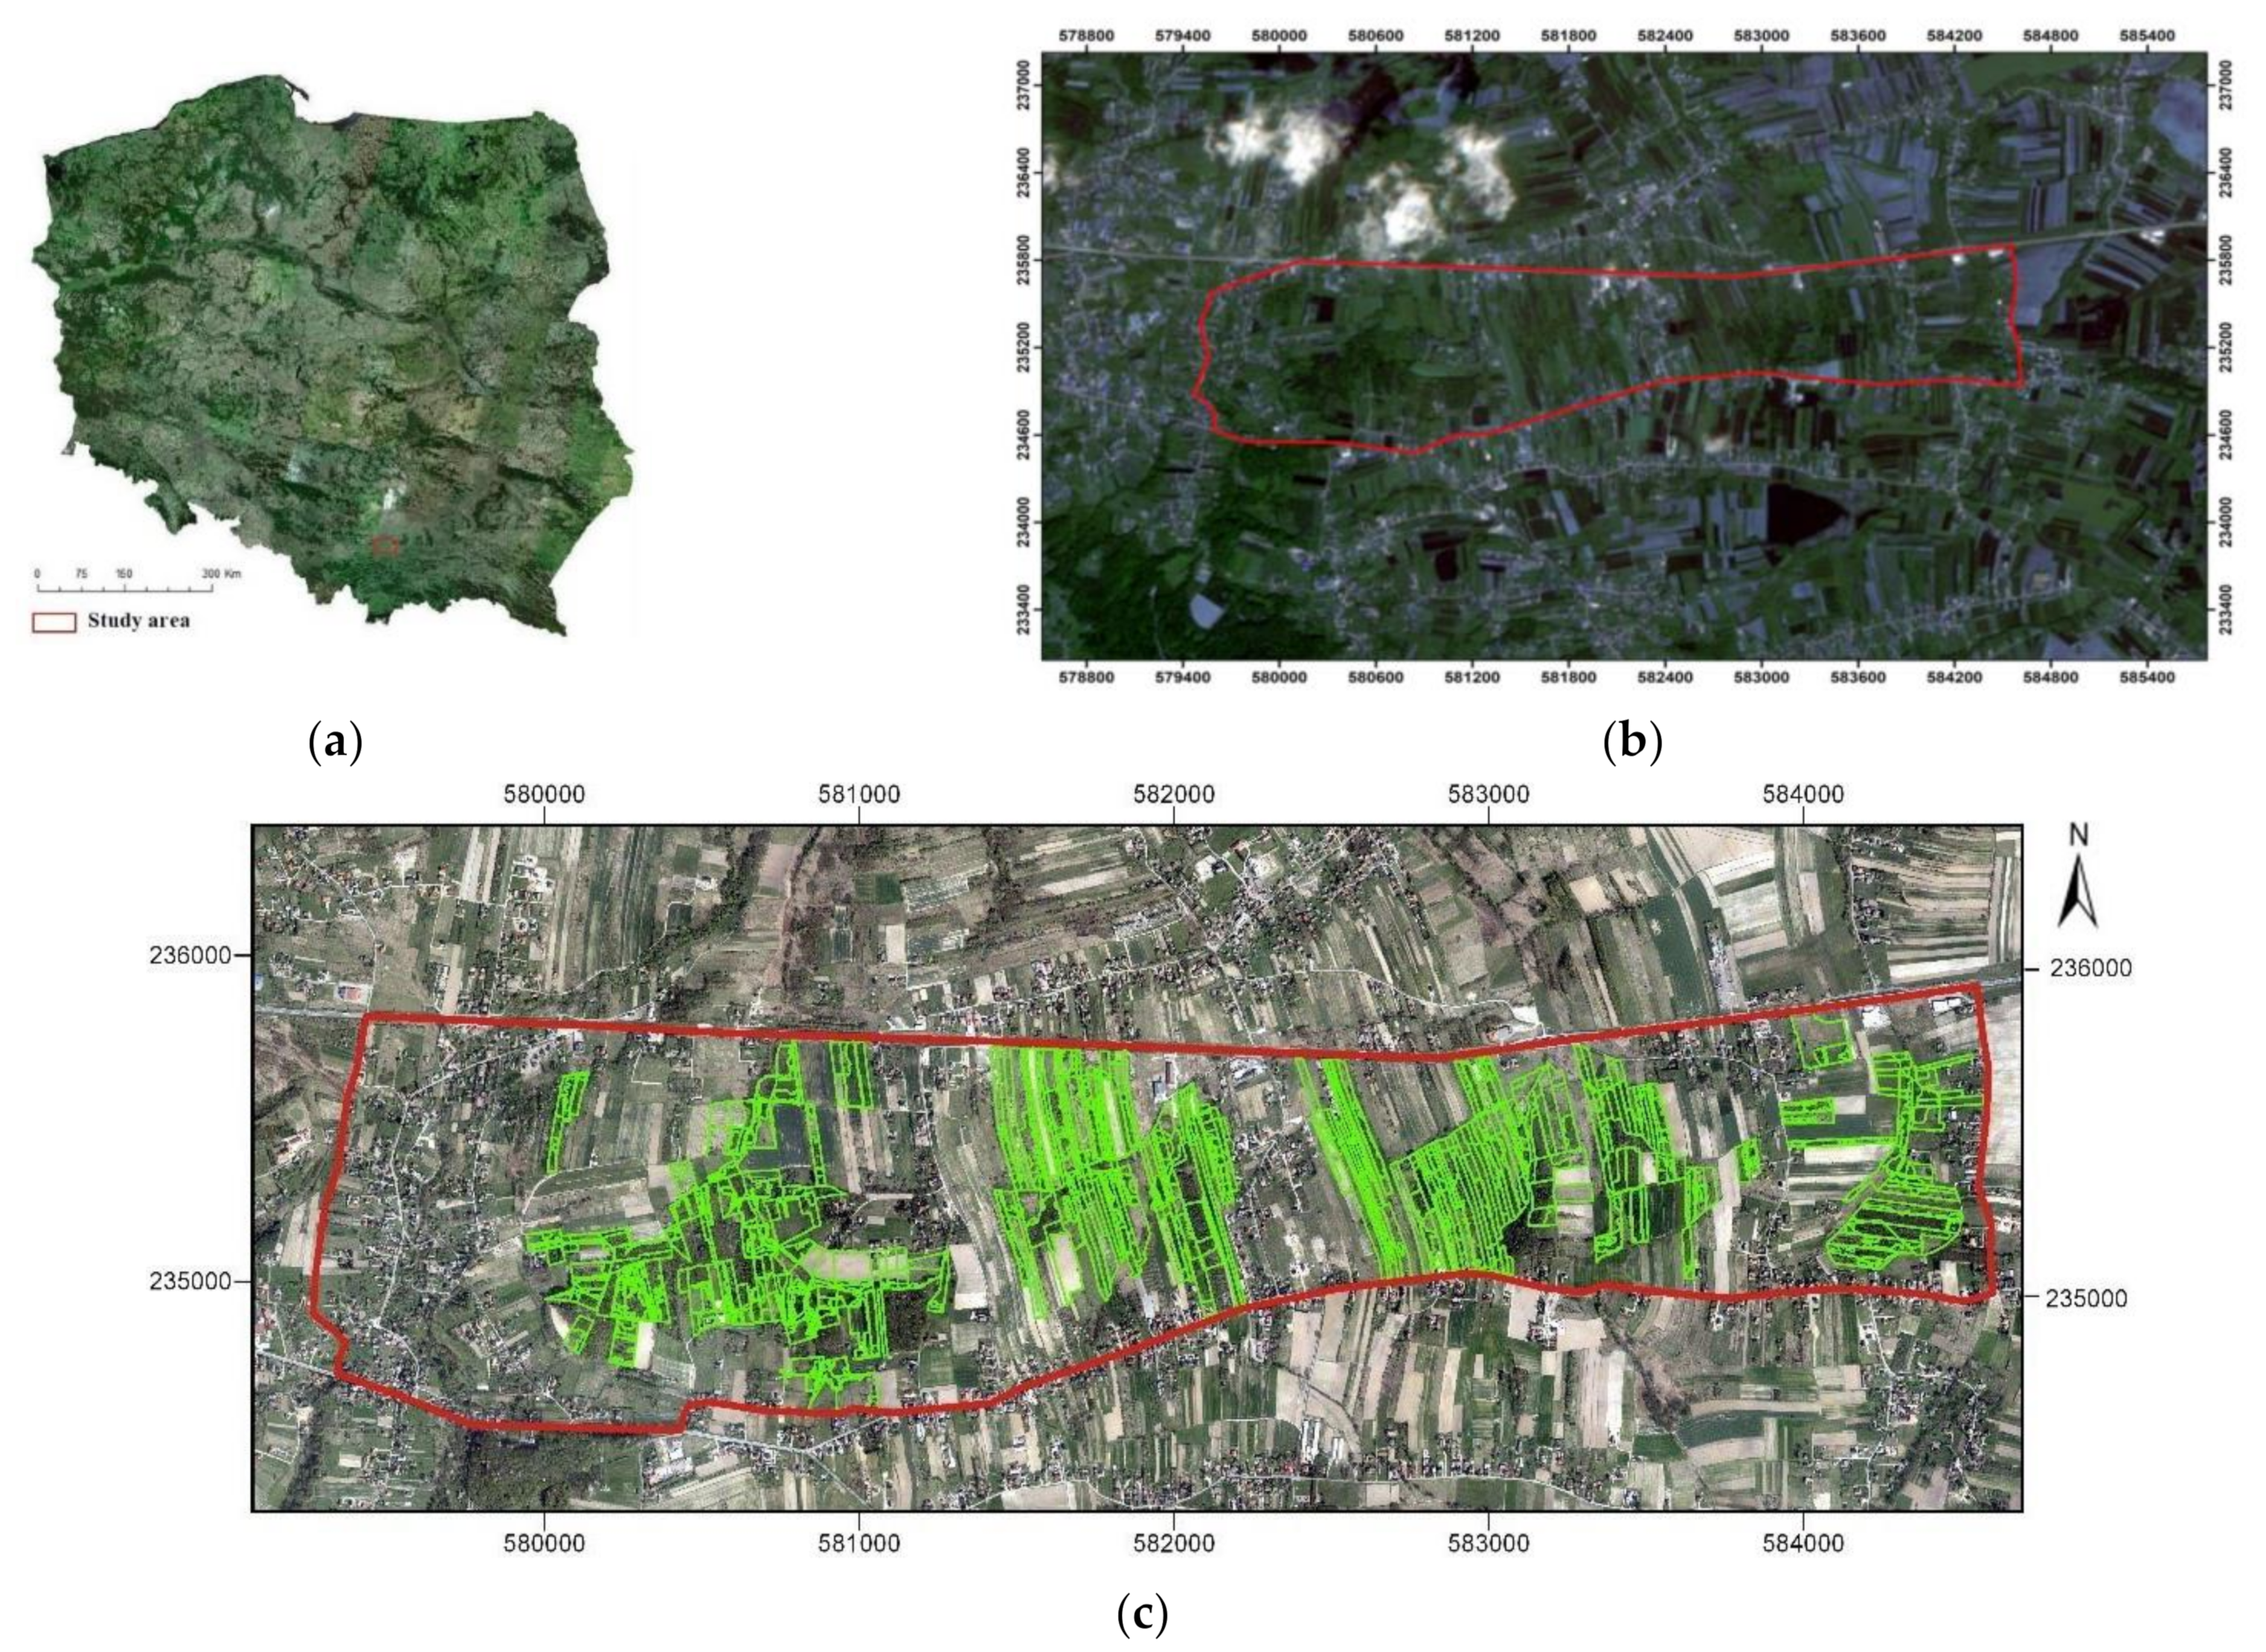
Figure 1. Area of the study: (a) general map of Poland; (b) terrain of the analyses—marked red (background: PlanetScope imagery, 2019); (c) analyzed plots—forest succession on abandoned farmlands; marked green (background: orthophotomap, 2019; coordinates system: PL-PUWG1992).
Sustainability 14 14110 g001
Figure 2. Examples of the forest succession process in the study area.
Sustainability 14 14110 g002
Figure 3. The study area—PlanetScope imagery, CIR (color infrared) composition. Analyzed parcels—forest succession on the abandoned land; marked yellow.
Sustainability 14 14110 g003
Figure 4. The result of PlanetScope classification: (a) the part of the image; (b) the result cropped to the analyzed parcels (background: orthophotomap, 2019).
Sustainability 14 14110 g004
Figure 5. The forested areas for the analyzed area: (a) whole area; and zoom to (b) left, and (c) right side.
Sustainability 14 14110 g005
Figure 6. The results of the ALS (2019) processing—vegetation height (95th percentile) and canopy cover [%] zoom in to (a,c) left side; (b,d) middle side of the analyzed area.
Sustainability 14 14110 g006
Figure 7. The chosen part of the area—(a) orthophotomap; (b) ALS point clouds profile; (c) histogram (number of points).
Sustainability 14 14110 g007
Table 1. The total area of LULC classes (Area: [ha] and Percentage [%]).
LULC ClassesCadastral DataPlanetScopeSentinel-2OrthoALS
Forested areas 10.76 ha 7.70% 62.77 ha 44.91%65.08 ha 46.56%56.32 ha 41.73%60.64 ha 43.39%
Meadows, Pastures101.38 ha 72.53%57.69 ha 41.27%56.75 ha 40.60%  
Arable lands26.39 ha 18.88%18.37 ha 13.14%16.52 ha 11.82%  
Others1.24 ha 0.89%0.94 ha 0.67%1.42 ha 1.02%  
Total139.77 ha (100.00%)  
Table 2. The PlanetScope image classification assessment parameters.
Land Cover Classes (LULC)Forested areasMeadows PasturesArable landsOthersTotalUser Accuracy
[%]
Forested Areas 761007798.70
Meadows, Pastures31502015596.77
Arable Lands06226323596.17
Others021303390.91
Total791592293350095.64
Producer Accuracy [%]96.2094.3498.6990.9195.04OA = 96.40
Kappa = 94.52
Publisher’s Note: MDPI stays neutral with regard to jurisdictional claims in published maps and institutional affiliations.