Article

Operational Efficiency Evaluation of Chinese Internet Banks: Two-Stage Network DEA Approach

1
School of Civil Engineering, Hubei Engineering University, Xiaogan 432000, China
2
Western Business School, Southwestern University of Finance and Economics, Chengdu 611130, China
3
School of Management Science and Engineering, Southwestern University of Finance and Economics, Chengdu 611130, China
4
School of Business, Wuhan Huaxia Institute of Technology, Wuhan 430223, China
*
Author to whom correspondence should be addressed.
Sustainability 2022, 14(21), 14165; https://doi.org/10.3390/su142114165
Submission received: 22 September 2022 / Revised: 24 October 2022 / Accepted: 27 October 2022 / Published: 30 October 2022

Abstract

:
An in-depth study of the operational efficiency of Internet banks is essential to enhance banks’ competitiveness and sustainable development. We use the two-stage network data envelopment analysis (DEA) model to divide the operational process of Internet banks into the value operation stage (stage 1) and the value creation stage (stage 2). This paper adopts the R&D investment that reflects the characteristics of Internet banks as the input of the value operation stage in the two-stage DEA model. It examines the operating efficiency of China’s Internet banks from 2018 to 2019, including stage efficiency and comprehensive efficiency. The empirical analysis results indicate that the contribution of stage 2 to the comprehensive efficiency is higher than that of stage 1. Similarly, it can also be shown that the average values of the stage efficiency and comprehensive efficiency of Internet banking in 2019 are higher than those in 2018. In addition, the Kruskal–Wallis test shows no significant difference in the average comprehensive efficiency of Internet banks in the three major economic belts. These results have significant strategic implications for managers, regulators, and policymakers who share a common interest in boosting financial sustainability and performance.

1. Introduction

China’s economic development trend has been improving long-term and the domestic economy has apparent advantages in more excellent circulation. The operation of the socialist market economy is constantly improving while simultaneously promoting the construction of the “four modernizations”. The progress of the banking industry is in a relatively reasonable growth period, with rare opportunities and intense conditions. To establish a perfect modern financial system, on 11 March 2014, the China Banking Regulatory Commission approved the pilot operation of the first batch of five Internet banks. Unlike traditional banks, Internet banks have no offline entity outlets; with the help of cloud computing and big data technology, they build a platform with convenient service and independent operation for customers, with the characteristics of low cost, high efficiency, and broad coverage. The existence of Internet banking, on the one hand, urges the composition of the banking industry and ownership structure to be more diversified. On the other hand, the traditional banking businesses, serving small and micro enterprises and agriculture, rural areas, and farmers, promotes healthy competition and sustainable growth for the banking industry and makes up for the overall financial notch. However, the development of Internet banking is facing unprecedented challenges due to the frequent thunderstorms of internet peer-to-peer lending platforms and the adverse impact of the Sino—US trade war and the COVID-19 pandemic on China’s economic and financial environment. Research on the operating efficiency of Internet banks is helpful to enhance the competitiveness of Internet banks and accelerate the healthy and surefooted development of the banking sector.
Compared with state-owned banks, Internet banks established and operated by private capital have the ultimate goal of maximizing profits for shareholders. Internet banking is dominated by a non-public economy and adopts a market-oriented operation mode. Its operating efficiency has always attracted the attention of traditional banking and financial industries. The significance of studying the operational efficiency of Internet banking includes: Firstly, it can provide early warnings for the Internet banking industry to prevent financial risks. Strengthening the research on operational efficiency and analyzing the deep-seated reasons for the low efficiency of banks can help banks facing financial difficulties find and solve problems as soon as possible and reduce banks’ operating costs. Secondly, for management and shareholders, it is helpful to evaluate the operation of Internet banks and find out the internal reasons for their ineffective operation. It is convenient to re-integrate and adjust the bank’s workforce, material resources, financial resources, and other resources, which help maximize its profits. Finally, for financial regulators, studying the operating efficiency of Internet banking can enable regulators to grasp the potential risks of Internet banking, adopt early institutional measures to prevent and resolve financial crises, and ensure financial stability.
Internet banking is the product of the trend of the times; its existence can improve social capital allocation and the vitality of capital market competition. Studying its operational efficiency will help enhance the competitiveness of Internet banks, improve the quality and efficiency of Internet financial supervision, accelerate the healthy and sustainable development of the banking industry, and promote the steady progress of society.
In this paper, the two-stage network DEA is adopted, which enriches the current research methods on the operating efficiency of Internet banks. For the first time, a comparative analysis was conducted on the existing 16 Internet banks (there are 17 Internet banks in business now, which were removed due to the lack of financial data on the Anhui Xin‘An Bank). The research scope is extended to the entire Internet industry and the research sample is expanded.
The remainder of this paper is organized as follows. Section 2 analyzes the application of the traditional DEA model and two-stage network DEA model to the study of commercial banks’ operating efficiencies, as well as the existing literature on Internet banking and explores the research direction of this paper. Section 3 outlines the two-stage network DEA model and explains the selection of input and output variables, the processing of weight and the data source. Section 4 applies the two-stage network DEA model to measure the efficiency of the value operation stage, value creation stage, and comprehensive efficiency of 16 Internet banks in China from 2018 to 2019 and performs a relevant comparative analysis. Moreover, the Kruskal–Wallis test method is used to conduct a non-parametric test on the mean value of the comprehensive efficiency in 2018–2019. Section 5 makes a discussion of the results with the same weight assigned to the two stages. Section 6 summarizes the comparative analysis results of the operating efficiency of Internet banks and provides suggestions. The shortcomings of this paper are pointed out and the factors that may affect the efficiency of Internet banking and the methods that may affect its measurement have been prospected.

2. Literature Review

Evaluating bank efficiency has always been a hot topic for domestic and foreign scholars. Data envelopment analysis (DEA) is a standard method for exploratory bank efficiency. Alhadeff first introduced the DEA method into the banking industry; he studied the efficiency of commercial banks in California from 1938 to 1950 and concluded that there was a positive correlation between banks’ operating efficiency and their scale [1]. Farrell used input and output indicators to study efficiency, leading to the concepts of pure technical efficiency (PTE) and scale efficiency (SE), where technical efficiency TE = PTE × SE [2]. Zhu et al. first cited the DEA super-efficiency model to analyze the production efficiency of state-owned commercial banks. The research showed that the low utilization efficiency of human resources of state-owned commercial banks was an important reason for their low efficiency [3]. Sari et al. proposed the DEA method to study the efficiency of Indonesian commercial banks from 2010 to 2019 and the results showed that they were moderately efficient [4]. Zheng et al. analyzed data from the annual reports of 30 banks listed on the Dhaka Stock Exchange in Bangladesh from 2011 to 2018 to determine the productivity of sample banks using the DEA method [5]. In contrast, Xie et al. adopted the DEA method to discuss the impact of revenue diversification on bank efficiency in seven emerging Asian economies between 2008 and 2019 [6]. Chang discussed the relationship between corporate social responsibility and the performance of Chinese commercial banks with the SBM-DEA method from the sustainability perspective [7]. Zhong et al. used DEA and its improved method to evaluate the innovation efficiency of China’s rural commercial banks [8].
The above scholars adopted the traditional DEA method to study the operational efficiency of banks and viewed the whole operation process of banks as a “black box” that only considered the initial input and final output indexes. This model can reflect the bank’s operating efficiency to a certain extent, but it is inaccurate because it ignores the influence of the bank’s internal operating process. Under such circumstances, scholars’ explorations of the two-stage DEA model arise at a historic moment.
Seiford et al. applied a two-stage DEA to bank performance research that divided the bank production process into two stages for the first time by studying the profitability and marketability of the top 55 commercial banks in the United States. It was found that larger banks performed better in profitability while smaller banks performed better in marketability [9]. Using 35 banks in Taiwan as a sample, Lin et al. applied a two-stage DEA model to measure banks’ service penetrations and profit creation efficiencies. The study showed that banks should focus on a few products rather than diversify too widely [10]. Omrani et al. constructed a two-stage DEA model to divide the bank’s business process into the production and profitability stages and evaluated 45 agricultural bank branches in the West Azerbaijan Province of Iran [11]. Wasiaturrahma et al. developed the two-stage DEA method to study the efficient performance of Indonesia’s traditional banks and Islamic rural banks and concluded that the People’s Credit Bank and Islamic People’s Financing Bank were inefficient in the intermediary role but highly efficient in production [12]. Milenkovic et al. used an output-oriented two-stage DEA method to determine the efficiency of the intermediary functions of banks in the Western Balkans for the period 2015–2019 [13]. H. Li et al. applied the two-stage network DEA model to bank performance evaluation and sustainable product design [14]. Li et al. proposed that the business process of commercial banks should be divided into the fund-raising and profit-making stages to obtain the efficiency evaluation of two stages applied to the efficiency evaluation of 32 listed commercial banks in Shanghai and Shenzhen [15]. Wu et al. proposed the two-stage network DEA method to evaluate the overall efficiency, fund-raising efficiency, and fund-using efficiency of 27 Chinese commercial banks from 2006 to 2020. They put forward several policy implications based on the findings [16]. Kumar developed a two-stage network DEA model to compare India’s private-sector and public-sector banks, finding that the former was more efficient than the latter in the profitability efficiency stage [17]. Scholars, as mentioned earlier, have considered the stage characteristics of the bank’s operation process. Nevertheless, the default output of the bank was the desired output, thus ignoring the impact of the undesirable output on the bank’s operating efficiency.
With the in-depth study of bank operating efficiency, scholars at home and abroad began to consider the unexpected output in the process of bank operation. Xie et al. considered the impact of undesirable outputs in the efficiency evaluation of commercial banks, analyzed the efficiency of 16 representative commercial banks in China from 2009 to 2018 and drew four observations [18]. Phung et al. used the DEA method to investigate the impact of non-performing loans on bank efficiency and found a negative relationship between non-performing loans and bank efficiency [19]. Preeti et al. believed that the non-performing loan ratio is an important part of bank performance and proposed a hybrid method combining DEA and ANN to measure and predict the operational efficiency scores of Indian banks [20]. Omrani et al. proposed a mixed-integer network DEA with shared inputs and undesired outputs to evaluate the efficiency of DMUs [21]. Fukuyama et al. studied the cost efficiency level of Turkish banks by establishing a two-stage DEA model, considering the non-performing loan ratio as an undesired output and “labor education quality” as a non-free variable input. The results showed that the inefficient allocation of human capital factors led to the low-cost efficiency of banks [22]. Zhang et al. established an SBM-DEA model with an undesirable output (non-performing loan ratio) to analyze China’s commercial banks’ internal resource allocation efficiencies [23]. Lin et al. used the two-stage network DEA model to divide Taiwan Financial Holding Company (FHCs)‘s operation process into the profit and marketization stages. They used the non-performing loan ratio as the undesirable output of the bank’s profit stage to evaluate the performance of FHCs from 2007 to 2012 [24]. Shao et al. proposed a non-parametric model based on DEA, which included bank product innovation as non-desired output in the performance evaluation system. They applied it to the performance evaluation of China’s listed commercial banks [25]. Based on the two-stage cross-efficiency model, Xue et al. quantitatively measured the efficiency of 16 commercial banks in China from 2006 to 2015. Considering fixed assets and the number of employees as shared input and non-performing loan ratio as undesired output, the evaluation results were more objective and stable using this model [26]. Wang et al. constructed a dynamic SBM-DEA model considering unexpected output, which measured the operating efficiency of 25 commercial banks in China from 2015 to 2019 [27].
Since establishing the first batch of 5 Internet banks in 2014, the number of Internet banks has increased to 17. Li used the case analysis and DEA methods to conduct a comparative and empirical analysis of online commercial and micro banks. The study evaluates the efficiency of online commercial, micro, city commercial, and rural commercial banks from 2015 to 2017. He found that the efficiency value of Internet banks was higher than that of traditional banks [28]. Tang et al. noted that Internet banks had contributed majorly in serving the real economy, benefiting small and micro enterprises, and promoting the development of inclusive finance. Therefore, the supervision of Internet banks should consider the differences between Internet banks and traditional banks that adopt differentiated supervision strategies that avoid “one size fits all” [29]. Wang et al. conducted a study on the profitability of eight Internet banks in my country through factor analysis, which found that because they were in the early stage of exploration, their profitability was different and affected by different conditions and backgrounds [30]. Mao et al. adopted the traditional DEA model to study the operational efficiency of 17 private banks in China in 2018 from the perspective of “Internet plus Inclusive Finance” and concluded that private banks were more efficient and were also positioned in the “Internet plus Inclusive Finance” business [31]. Hu constructed a traditional DEA model that conducted a comparative study of traditional and pure online banks represented by online commercial and micro public banks [32]. Zheng explored the development characteristics of Internet banking and proposed the problems and suggestions for institutional innovation in Internet banking at this stage from the perspective of banking supervision, such as vague laws, regulatory bodies, vague access mechanisms, and insufficient consumer protection [33].
The existing literature found that due to the comparatively late origin of Internet banking, the early data are not easy to collect, and domestic and foreign scholars use the DEA method to study it less. At present, the research methods of Internet banking are mainly from the aspects of risk control, comparative analysis of financial data, or platform supervision. There are also a few scholars using the traditional DEA method to study the efficiency of several Internet banks and a few scholars using the two-stage network DEA method to evaluate the efficiency of the entire Internet banking industry.
To this end, this paper uses a two-stage network DEA model referring to the naming of the value chain that divides the business process of Internet banking into two stages: value operation and value creation. Through the calculation of the financial data in the annual report of Internet banking, the value operation efficiency, value creation efficiency, and overall comprehensive efficiency of Internet banking are obtained.
The existing literature found that early data are not easy to collect due to the late emergence of Internet banking; domestic and foreign scholars have performed little research on it using the DEA method. At present, the research methods of Internet banking are mostly studied from the aspects of risk management and control, comparative analysis of financial data, construction of banking systems, or development of platforms. Few scholars use the two-stage network DEA method to evaluate the efficiency of the entire Internet banking industry.
Based on this, from the perspective of the enterprise value chain, this paper divides the operation process of Internet banking into two stages: value operation (stage 1) and value creation (stage 2). With Internet banking’s light assets, heavy artificial intelligence, and big data technology, research and development (R&D) is selected as the input index. At the same time, considering the impact of the non-performing loan ratio on Internet banks, operation processes are taken as an undesired output indicator in the value creation stage. Finally, the Kruskal–Wallis non-parametric test method is used to test whether there is a significant difference in internet operational efficiency in the three major economic belts. The research route is shown in Figure 1.

3. Research Methods

Since the DEA method was proposed by Charnes et al. in 1978, it has been widely applied by scholars at home and abroad to evaluate the efficiency of institutions with multiple inputs and outputs. Blagojević et al. applied the DEA model to the efficiency evaluation of freight transport railway undertakings [34]. Mitrović et al. established the DEA model to evaluate the safety of transportation systems [35]. Additionally, T. Arsu adopted the DEA model to study the efficiency of European football clubs [36]. As a non-parametric method to analyze the multi-factor production process, the production frontier is constructed through the investigation of the input and output elements of the decision-making unit. If the sample data points are on this frontier, the DMU is said to be effective; otherwise, it can be improved according to the model. Compared with the traditional accounting index ratio evaluation, this method is more comprehensive and can better reflect the relative efficiency gap among DMUs.
The DEA model has the following advantages: First, it does not need to know the specific form of production function; Second, the inputs/outputs can use variables of different units. For example, indicators can include both CNY and quantity, etc. Third, multiple input indicators and multiple output indicators can be measured simultaneously. At the same time, there are also shortcomings. For example, this method is a comparative method of relative efficiency and efficient individuals are only relatively efficient rather than absolute. The DEA model cannot evaluate the negative output, which is determined by the basic principle of the model. However, we can still apply some mathematical techniques to convert the negative output into data that can be fed into DEA models. This will not affect the use of the model.
In summary, the DEA model has many advantages in performance evaluation and its shortcomings can also be corrected by various mathematical methods. The application of the DEA model in today‘s society is deepening and it is widely used in evaluating relative efficiency, economic system modeling, cost–benefit analysis, forecasting, and other aspects. All these prove that the DEA model has unique advantages in the field of performance analysis. Therefore, this paper hopes to use the DEA model to evaluate the operational efficiency of Internet banks.
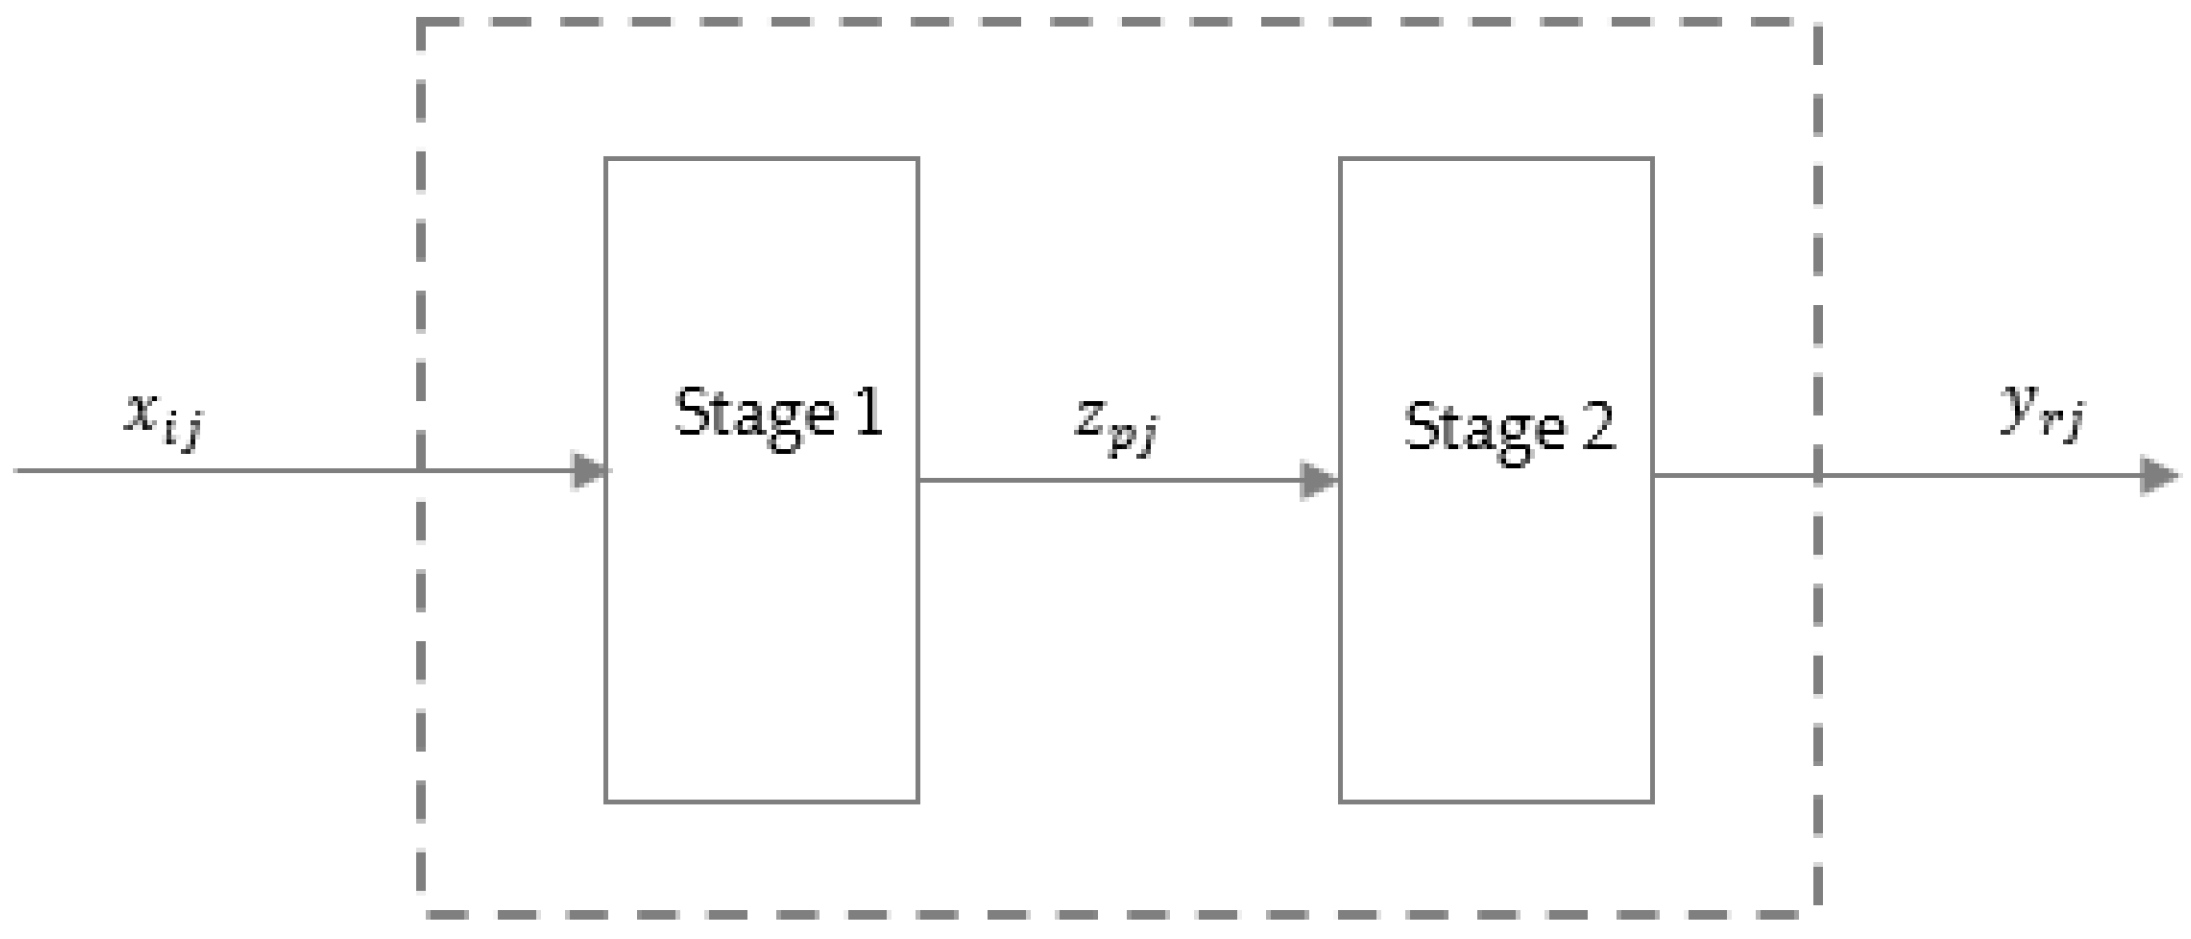
The two-stage network DEA method opens the “black box” of bank operation, divides its operation process into two stages, and analyzes the reasons for the inefficiency of comprehensive bank efficiency from the internal perspective. The traditional two-stage network DEA model (Figure 2) assumes that there are n banks and D M U j (j = 1, 2, …, n) represents the jth bank. In stage 1, it is assumed that the bank input is x i j (i = 1, 2, …, m) and the corresponding output is z p j (p = 1, 2, …, q); In stage 2, z p j is taken as the input and its output is y r j (r = 1, 2, …, s).
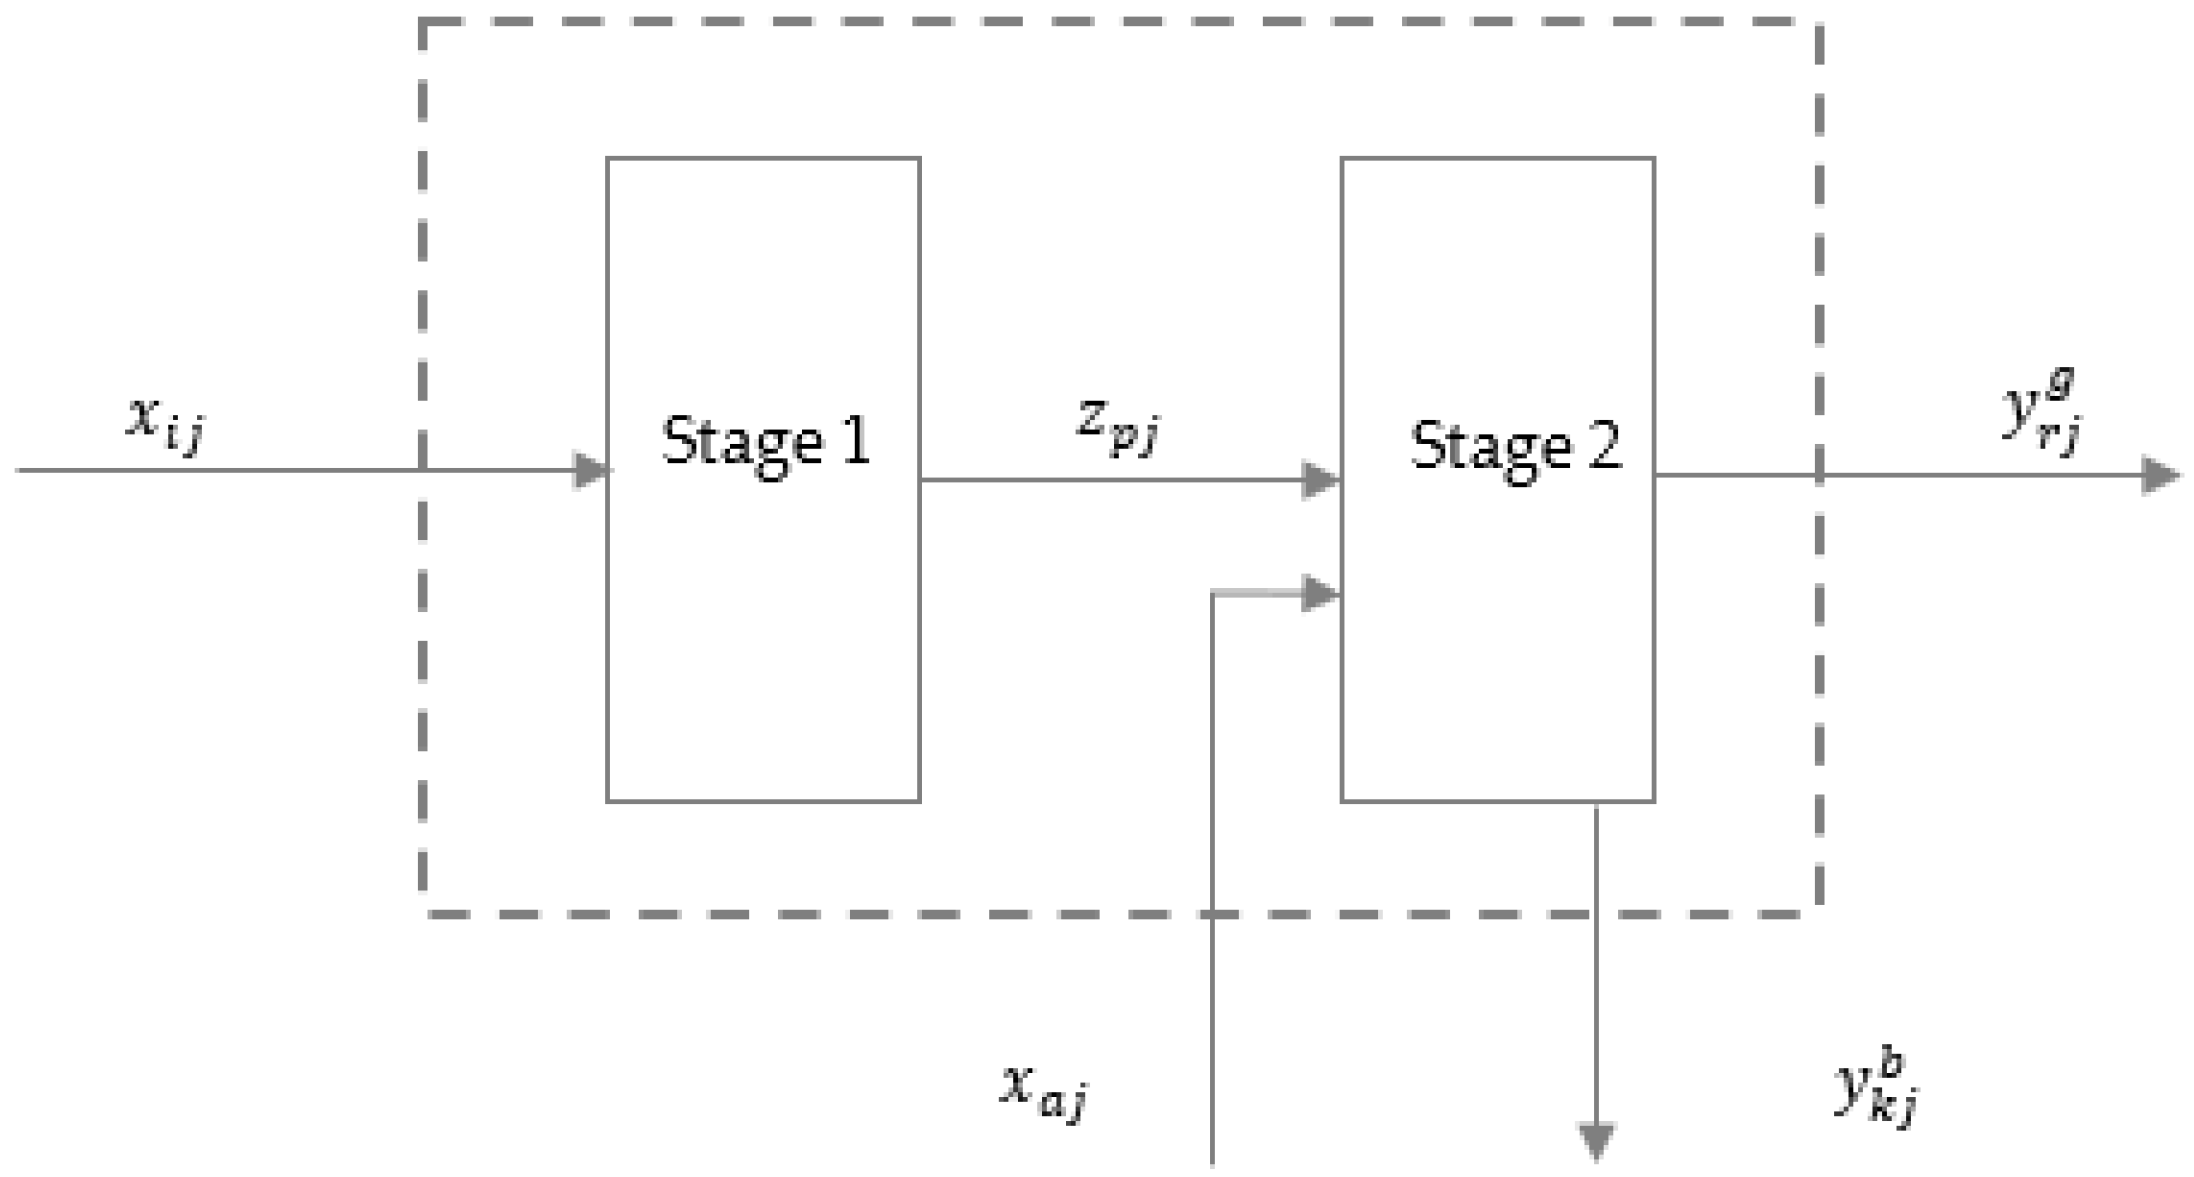
Kao et al. [37,38] proposed that under constant returns to scale, the total system efficiency is equal to the product of subsystem efficiency. That is to say, for D M U j (j = 1, 2, …, n), the relationship among the efficiencies is θ j = θ j 1 × θ j 2 . Since the geometric efficiency decomposition model proposed by Kao et al. [37,38] can only be used under the premise of constant returns to scale, it does not apply to the case of variable returns to scale, so it has certain limitations. In this case, to study the two-stage DEA efficiency decomposition method under the condition of variable returns to scale, Chen et al. proposed an additive efficiency decomposition method, arguing that the total efficiency of the system can be decomposed into the weighted sum of the efficiency of two subsystems [39]. That is: θ j = ω 1 θ j 1 + ω 2 θ j 2 , where ω 1 represents the weight of subsystem 1, and ω 2 represents the weight of subsystem 2. Based on the traditional two-stage network DEA model, considering that there may be new inputs and undesired outputs in stage 2, the model in Figure 3 is constructed.
Based on the premise of constant returns to scale, the fractional planning of stage 1 is as follows:
θ d 1 = max p = 1 q w p d 1 z p d i = 1 m v i d x i d s . t . p = 1 q w p d 1 z p d i = 1 m v i d x i d 1 , j = 1 , 2 , , n p w p d 1 , v i d ε , p = 1 , , q ; i = 1 , 2 , , m ;
The fractional planning of stage 2 is as follows:
θ d 2 = max p = 1 q u r d g y r d g p = 1 q w p d 2 z p d + a = 1 c g a d x a d + k = 1 t u k d b y k d b s . t . p = 1 q u r d g y r j g p = 1 q w p d 2 z p j + a = 1 c g a d x a j + k = 1 t u k d b y k j b 1 u r d g , u k d b ε , r = 1 , , s ; k = 1 , 2 , , t ; w p d 2 , g a d ε , i = 1 , 2 , , m ; p = 1 , , q ; a = 1 , , c .
The overall efficiency can be expressed by Equation (3):
θ d = max p = 1 q w p d 1 z p d + r = 1 s u r d g y r d g i = 1 m v i d x i d + p = 1 q w p d 2 z p d + a = 1 c g a d x a d + k = 1 t u k d b y k d b s . t . p = 1 q w p d 1 z p j i = 1 m v i d x i j 1 , j = 1 , 2 , , n ; r = 1 s u r d g y r j g p = 1 q w p d 2 z p j + a = 1 c g a d x a j + k = 1 t u k d b y k j b 1 w p d 1 , w p d 2 ε , p = 1 , 2 , , q ; v i d , g a d ε , i = 1 , 2 , , m ; a = 1 , 2 , , c . u r d g , u k d b ε , r = 1 , 2 , , s ; k = 1 , 2 , , t .
The overall efficiency can also be expressed as:
θ d = ε 1 θ d 1 + ε 2 θ d 2
We assume that w p d 1 = w p d 2 . ε 1 and ε 2 denote the importance of stage 1 and stage 2 efficiency. ε 1 and ε 2 can be expressed as:
ε 1 = max i = 1 m v i d x i d i = 1 m v i d x i d + p = 1 q w p d z p d + a = 1 c g a d x a d + k = 1 t u k d b y k d b ε 2 = max p = 1 q w p d z p d + a = 1 c g a d x a d + k = 1 t u k d b y k d b i = 1 m v i d x i d + p = 1 q w p d z p d + a = 1 c g a d x a d + k = 1 t u k d b y k d b
The Charnes—Cooper change is performed on Equation (4) so let:
t = 1 i = 1 m v i d x i d + p = 1 q w p d z p d + a = 1 c g a d x a d + k = 1 t u k d b y k d b , μ r d g = t u r d g , μ k d b = t u k d g , ω p d = t w p d , ϑ i d = t v i d , η i d = t g i d ,
The following linear programming can be obtained:
θ d = max p = 1 q ω p d z p d + r = 1 s μ r d g y r d g s . t . i = 1 m ϑ i d x i d + p = 1 q ω p d z p d + a = 1 c η a d x a d + r = 1 s μ k d b y k d b = 1 p = 1 q ω p d z p j i = 1 m ϑ i d x i j 0 r = 1 s μ r d g y r j g p = 1 q ω p d z p j a = 1 c η a d x a j r = 1 s μ k d b y k j b 0 ϑ i d , η a d , ω p d ε μ r d g , μ r d b ε , j = 1 , 2 , , n
The system’s overall efficiency is obtained by solving Equation (5). According to the two-stage additive efficiency decomposition method proposed by Chen et al. [39], θ d 1 can be obtained by the following equation:
θ d 1 = max p = 1 q ω p d z p d s . t . i = 1 m ϑ i d x i d = 1 . p = 1 q ω p d z p j i = 1 m ϑ i d x i j 0 r = 1 s μ r d g y r j g p = 1 q ω p d z p j a = 1 c η a d x a j k = 1 t μ k d b y k j b 0 ( 1 θ d * ) p = 1 q ω p d z p d + r = 1 s μ r d g y r d g θ d * i = 1 m ϑ i d x i d θ d * a = 1 c η a d x a d θ d * k = 1 t μ k d b y k d b = 0 ϑ i d , η a d , ω p d ε μ r d g , μ k d b ε , j = 1 , 2 , , n
The θ d 1 * is solved by Equation (6) and then the efficiency of stage 2 is obtained by:
θ d 2 = ( θ d * ε 1 * θ d 1 * ) / ε 2 *

4. Empirical Analysis

4.1. Index Selection of Internet Banking System

When evaluating the efficiency of banks, different efficiency may be obtained according to different index selection principles. From an objective and comprehensive perspective, this paper evaluates the operating efficiency of Internet banks under the premise of the following three principles. (1) The principle of comprehensiveness. The selection of indicators should be thoughtful, not only considering the core financial indicators, but also selecting indicators that have a greater impact on the bank’s operation. (2) Operational principles. The selected indicators should be easy to obtain, real and effective, and can be effectively obtained from official or authoritative channels, which is the basis of empirical research. (3) The principle of pertinence. The selected financial indicators should reflect the operating characteristics of Internet banks and help to find out the internal reasons leading to the inefficiency of bank operations.
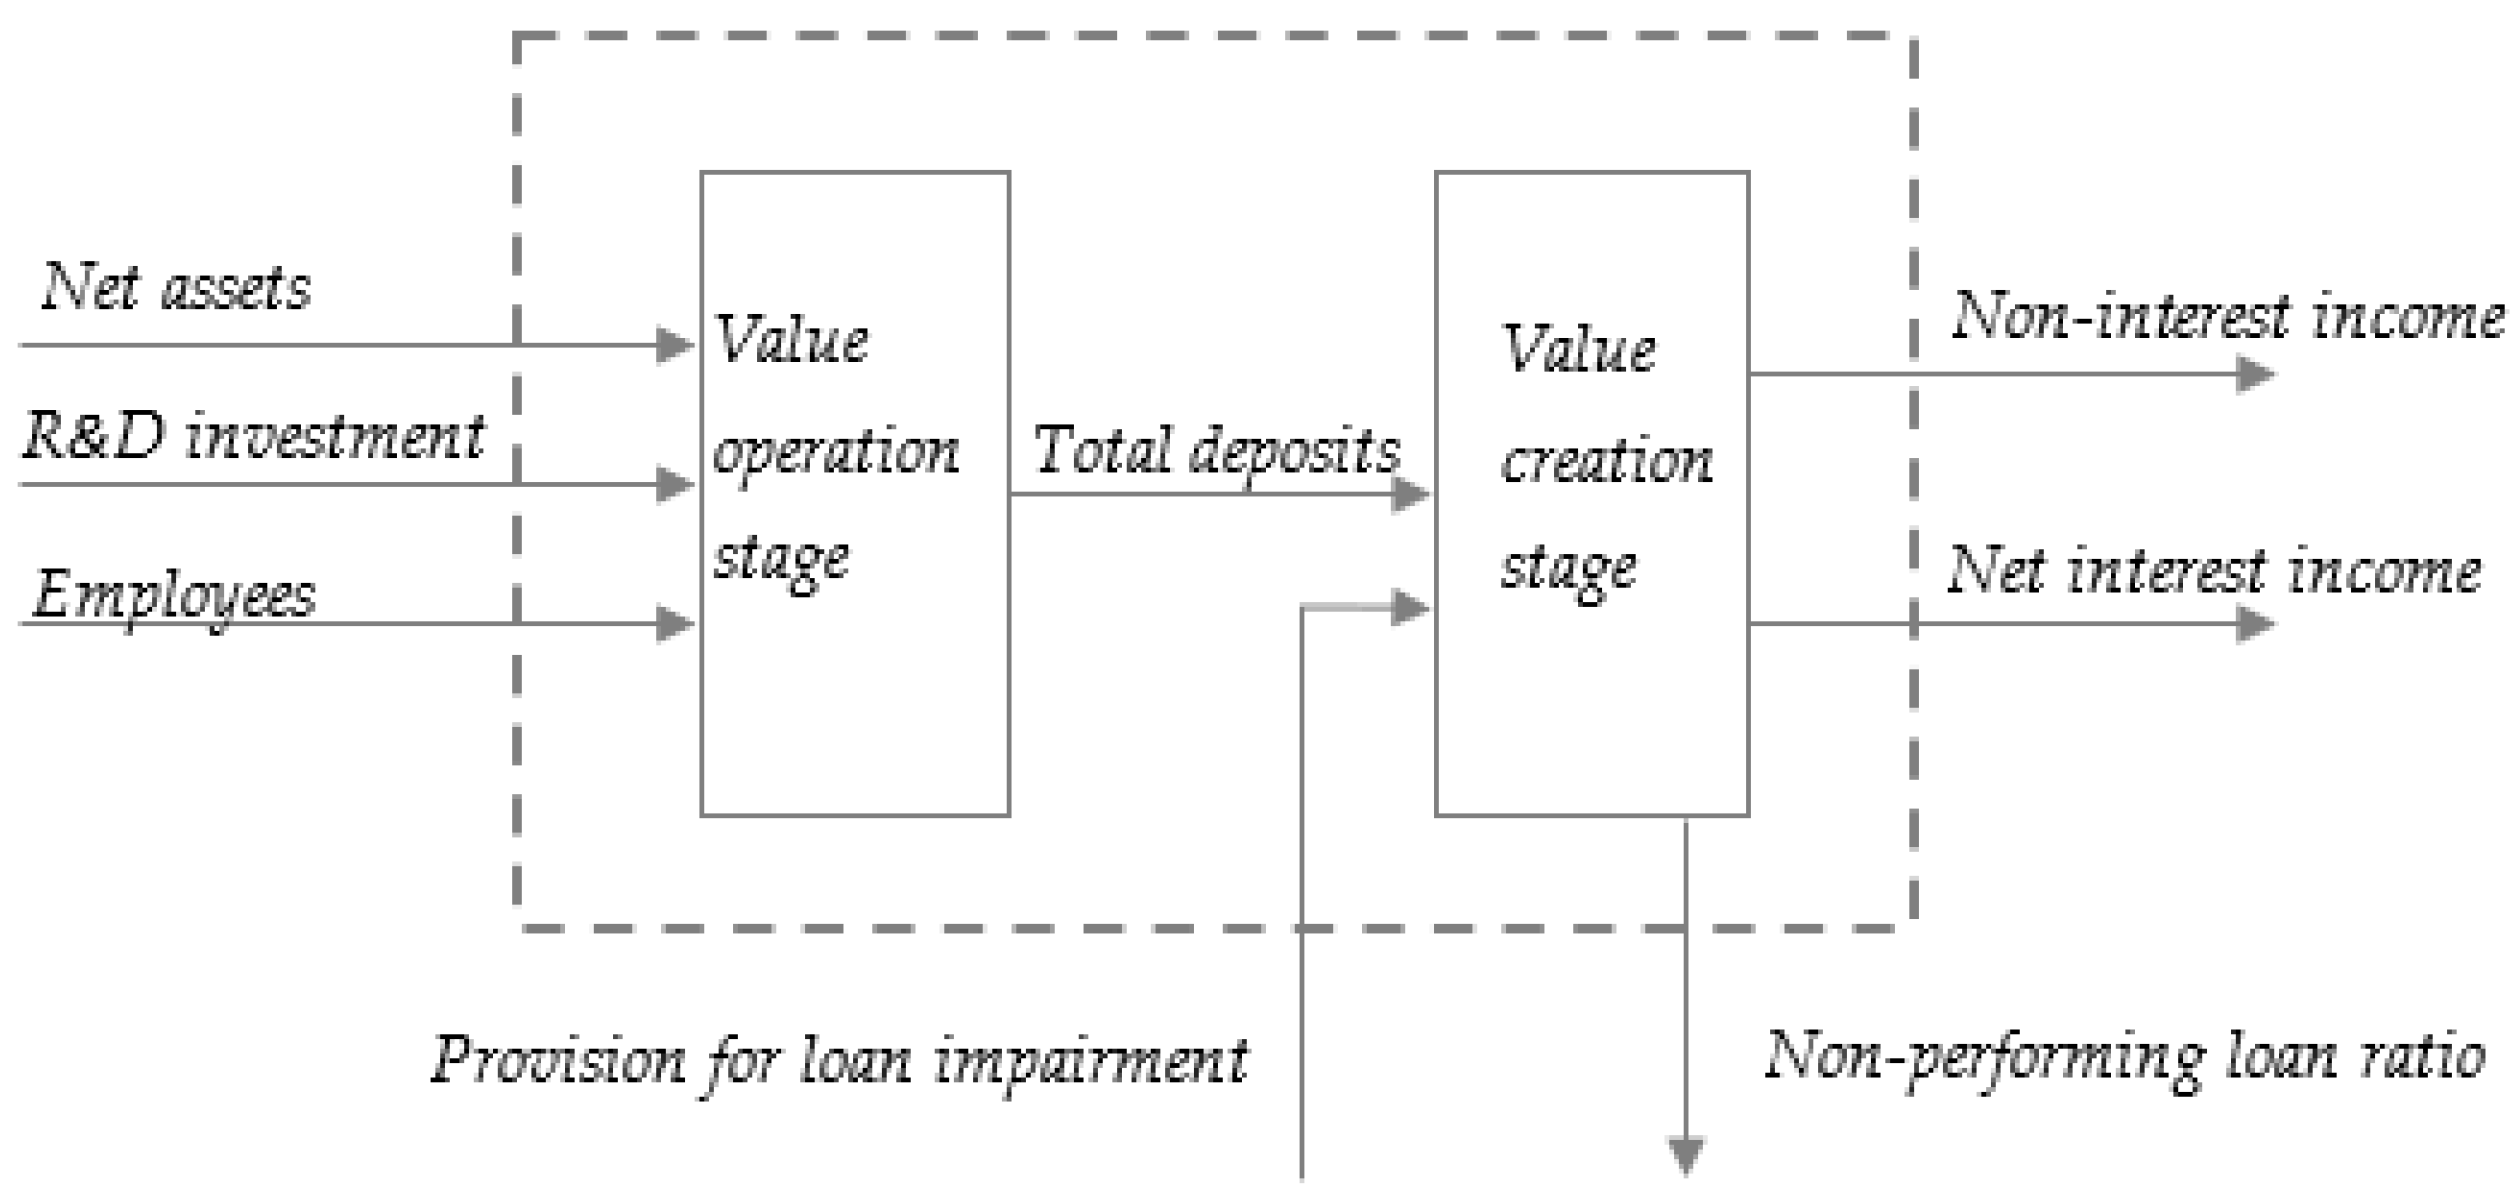
In the existing literature, there are three main methods for selecting bank indicators: production, intermediary, and asset. The above three methods have their advantages and disadvantages; this paper will consider the advantages of the above three methods and select indicators from the perspectives of easy access to indicators and data authority. Drawing on the research experience of domestic and foreign scholars (Seiford et al. [8], Fukuyama et al. [22], Kwon et al. [40], Xue et al. [26], Li et al. [15]), the model construction and index selection of the two-stage network DEA method to evaluate the operating efficiency of Internet banks are shown in Figure 4.
In the index system of this paper, net assets are the core primary capital of banks. The number of employees reflects the investment of Internet banks in human resources. R&D investment reflects the investment of Internet banks in technology R&D, which is a unique indicator that distinguishes them from traditional banks. The total amount of deposits, including deposits and interbank deposits, serves as an intermediate index to connect the two stages of Internet banking operation. A loan impairment provision is a special fund for banks to recover from loan losses in the future. Non-interest income reflects the ability of Internet banks in financial innovation. Net interest income refers to the difference between the interest income of the assets of banks or other financial institutions and the interest expenditure of liabilities. The unexpected non-performing loan ratio reflects the proportion of loans issued by banks that have not been recovered and is a risk indicator of bank credit.

4.2. Sample Selection and Data Sources

In this paper, 16 out of the 17 Internet banks were selected to capture valuable financial data from their disclosed annual reports, among which the primary financial data of Anhui Xin‘An Bank in 2019 were not disclosed, so we eliminated them. The loan impairment reserves of Qianhai WeBank in 2018 were not disclosed and the average values of 2017 and 2019 were used as substitutes. Therefore, the descriptive statistics of the input—output indicators of Internet banks in 2018–2019 are shown in Table 1.
The net interest income and non-performing loan ratio indicators in 2018–2019 have zero or negative data. Additionally, the DEA requires all indicator data to be positive; the efficiency coefficient method (or the extremum method) is used to positively standardize the 2018–2019 data with the indicator data.
y i = 0.1 + 0.9 x i X m i n X m a x X m i n
where x i is the original data and y i is the adjusted data. X m i n = m i n { x 1 , x 2 , , , x n } , which is the minimum value of the index. X m a x = m a x { x 1 , x 2 , , , x n } , which reflects the maximum value of the index.
The standardized indicators are used as the final indicators for subsequent research.

4.3. Two-Stage Efficiency Analysis

By adopting the additive efficiency decomposition method of the two-stage DEA model, programming with MATLAB software, and importing the input-output index data of this paper, the stage efficiency and comprehensive efficiency of Internet banking in 2018 and 2019 are obtained through operation, as shown in Table 2 and Table 3.

4.3.1. Stage Efficiency and Comprehensive Efficiency Analysis of Internet Banking in 2018

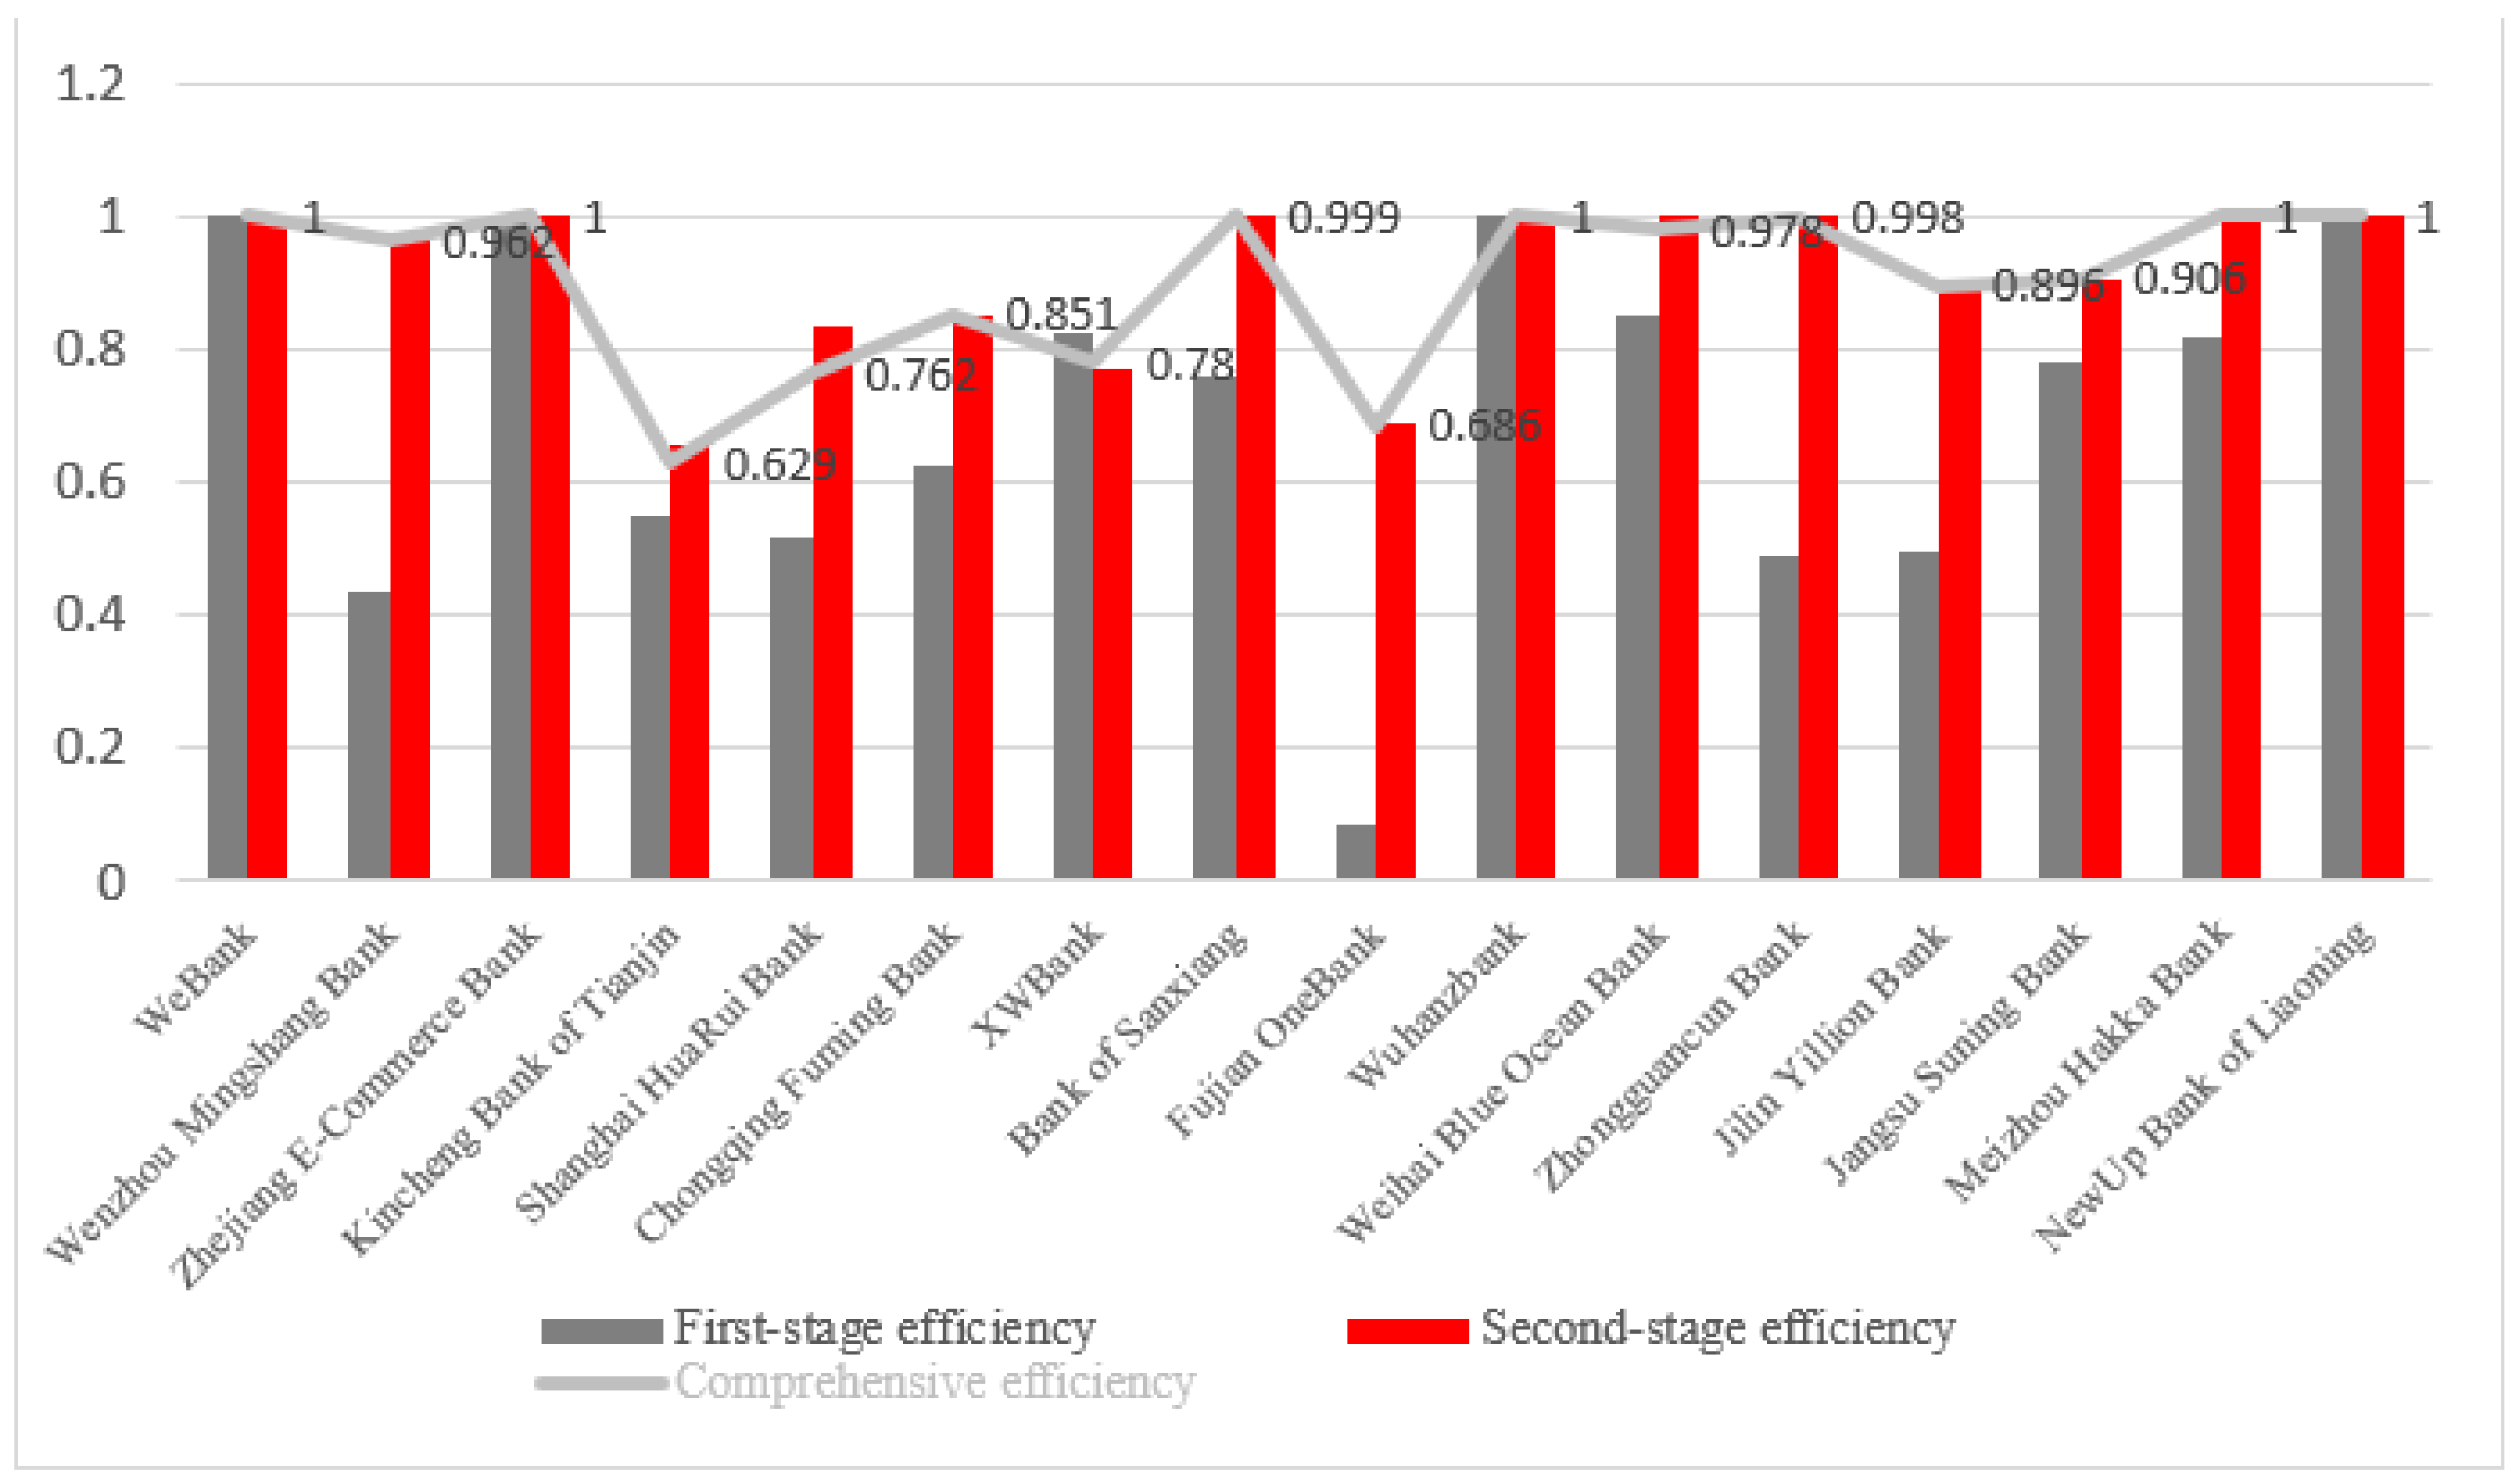
Draw statistical Figure 5 according to Table 2.
It can be seen that there are 4 banks at the effective frontier of the 16 Internet banks in the value operation stage in 2018, namely WeBank, Zhejiang E-Commerce Bank, Wuhanzbank, and NewUp Bank of Liaoning. In this stage, the average efficiency of 16 Internet banks is 0.702, of which 9 are above the average, indicating that most banks have good performance in absorbing deposits. However, the efficiency values of Fujian OneBank and Zhongguancun bank in stage 1 are 0.087 and 0.490, respectively, ranking first and second to last, indicating that under the same circumstances, the performance of these two banks in absorbing deposits is weak. By comparing the indicators of Fujian OneBank and Wuhanzbank, it is found that the net asset of these two Internet banks is nearly the same. The number of employees is also similar, but the R&D investment of Fujian OneBank is more than twice that of Wuhanzbank’s. Still, the total deposit is 1.976 billion, which is far below the total deposit of Wuhanzbank’s 26.229 billion. This indicates that in the case of obtaining the same total deposit, the redundancy of R&D investment and the low amount of deposits absorbed are the reasons for the inefficiency of Fujian OneBank.
In the value creation stage, the average efficiency of the 16 Internet banks is 0.910. Among them, in addition to the eight banks with an efficiency value of 1, the efficiency value of Wenzhou Civil and Commercial Bank also exceeds the average, the same as the number of banks that exceed the average efficiency in the value operation stage. Still, its average value is higher than 0.702 in the value operation stage, indicating that Internet banks’ overall performances in stage 2 are higher than in stage 1.
Through the two stages of value operation and value creation, we can see that there are five banks with a total efficiency of 1, namely, Webank, Zhejiang e-commerce bank, Wuhanzbank, Meizhou Hakka Bank, and NewUp Bank of Liaoning. That is, the comprehensive efficiencies of the above five banks have reached DMU effectiveness. The efficiency of Internet banks in both stages will impact their overall efficiency. Therefore, banks should adjust the two stages of their operations to achieve DMU effectiveness.

4.3.2. Stage Efficiency and Comprehensive Efficiency Analysis of Internet Banking in 2019

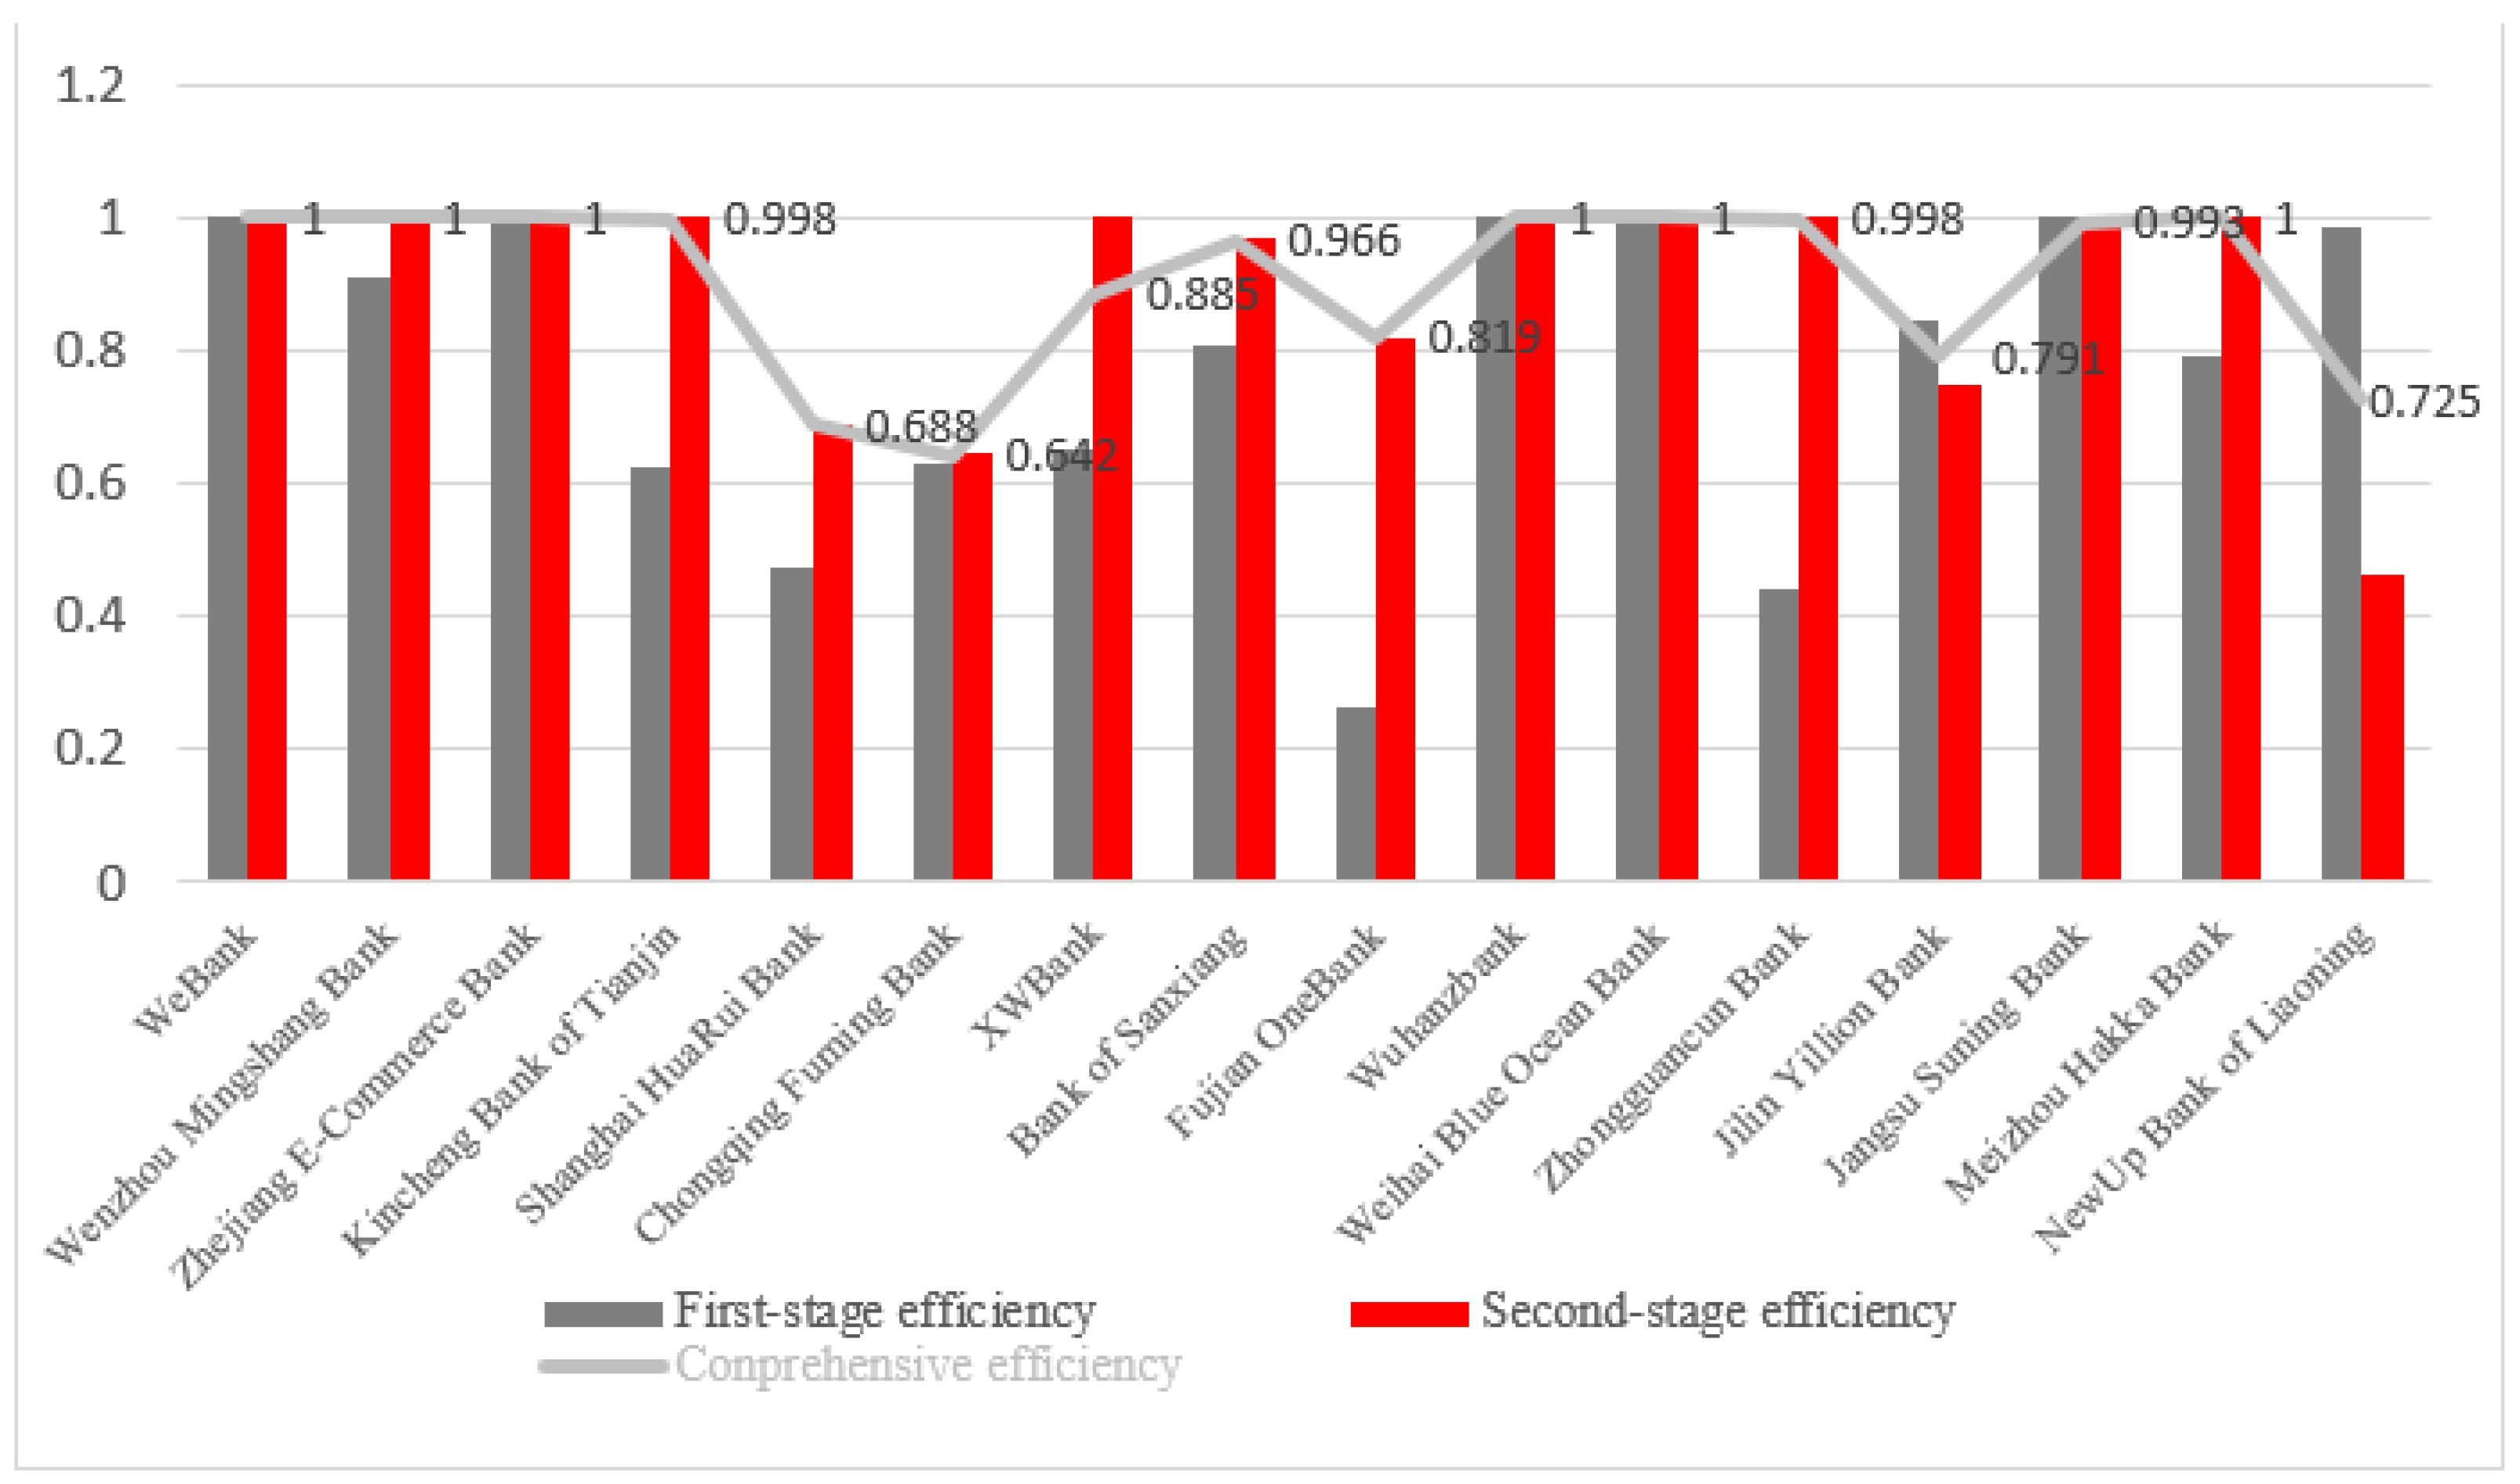
Draw statistical Figure 6 according to Table 3.
As seen from Table 3 and Figure 6, 16 of the Internet banks in 2019 are located on the effective frontier in the value operation stage. The lowest efficiency value in this stage in 2019 is Fujian OneBank (0.262), but it is significantly higher than the efficiency value of 0.087 in 2018. It is found that the average efficiency of the value operation stage in 2019 is 0.776, which is higher than 0.702 in 2018, indicating that in 2019, the efficiency values of the 16 Internet banks in stage 1 improved as a whole.
In 2019, the average efficiency in the value creation stage was 0.895, of which nine reached DMU effectiveness. Except for the efficiency value of NewUp Bank of Liaoning being 0.461, which was 0.648 or above among the 15 Internet banks, this indicates that the performance of Internet banks was considerable and generally good in the process of capital utilization.
In 2019, the comprehensive efficiency of six Internet banks reached DMU efficiency. Compared with 2018, Wenzhou Civil and Commercial Bank and Weihai Blue Ocean Bank were added to and NewUp Bank of Liaoning was reduced. The data show that the efficiency value of Fujian OneBank in the value operation stage from 2018 to 2019 is at the lowest level of the 16 Internet banks. The efficiency value in the value creation stage is also lower than the average value, indicating that the Fujian OneBank should improve the efficiency value of the two stages simultaneously to improve the overall efficiency. Other banks should adopt targeted adjustments according to the characteristics of their stage efficiency and strive to achieve DMU effectiveness.
By comparing Table 2 and Table 3, it can be seen that from 2018 to 2019, the weight of the value creation stage of all the Internet banks is higher than that of the value creation stage. In general, the former has a greater impact on the comprehensive efficiencies of the Internet banks. Therefore, banks should pay more attention to the operation condition of the second stage. In addition, the average value of stage efficiency and comprehensive efficiency of Internet banks in 2019 is higher than that in 2018, indicating that the operating status of Internet banking in 2019 is better than that in 2018.

4.4. The Kruskal–Wallis Test

To study the distribution of the average comprehensive efficiency of Internet banks in the whole country and to explore whether the operation status of Internet banks will be affected by the region, the Kruskal–Wallis, a non-parametric test method, is adopted based on the three major economic zones.
The Kruskal–Wallis test, also known as the H test, is used to test whether there is a significant difference between the distributions of multiple independent samples from multiple populations. Based on the basic idea of the Kruskal–Wallis test, 16 Internet banks are grouped according to the three economic belts of the eastern, central, and western regions. It observes the significant differences in the Internet banks’ average comprehensive efficiency values in the three economic belts. H 0 : There is no significant difference in the average value of the comprehensive efficiency of multiple independent samples of Internet banks in each economic belt. H 1 : There is a significant difference in the average value of the comprehensive efficiency of multiple independent samples of Internet banks in each economic belt. Using SPSS software to calculate multiple groups of data, the results are shown in Table 4.
It can be seen from Table 5 that the mean value of comprehensive efficiency is p = 0.257 > 0.05. So, the null hypothesis is not rejected and it is concluded that the Internet banks distributed in the three major economic belts have no significant difference in total efficiency values. The box diagram of Figure 7 shows that the distribution range of the average comprehensive efficiency of Internet banks in the eastern region is the widest. Including the distribution range of the average comprehensive efficiency of the central and western regions and the number of Internet banks in the three major economic belts: eastern region > central region > western region.

5. Discussion

Combined with the financial data of Internet banks from 2018 to 2019, this study adopts Matlab to analyze the two-stage network DEA model. The results in Table 2 and Table 3 show that the value operation and the value creation stages have different weights and the value creation stage has a greater impact on the comprehensive efficiency. In fact, in the application research of two-stage network DEA models, many scholars assign the same weight to the two stages [41,42]. Therefore, considering the game and cooperation between the two stages, referring to the treatment methods of other scholars, the weights of the two stages are uniformly set to 0.5 and 0.5, which means the contribution of the two stages to the whole is the same. The Max DEA software is used for analysis and the input—output indicators remain unchanged. The stage efficiency and comprehensive efficiency values for 2018–2019 are shown in Table 6.
From the data in Table 6, it can be seen that in 2018, among the efficiency values measured by Max DEA with the same weight in the two stages, there are six banks with an efficiency value of 1 in the first stage, which is higher than the number of banks provided by MATLAB with different weights. The number of banks with efficiency values of 1 in the second stage obtained by the two methods is the same, so is the comprehensive efficiency. In 2019, the number of banks with the same weight measured in the first stage efficiency, the second stage efficiency, and the comprehensive efficiency is 10, 12, and 9, respectively, which are higher than the 5, 9, and 6 banks with different weights provided by the model in this paper. It is found that the banks with the efficiency value of 1 measured by the latter are all included in the former. It shows that the efficiency results are overestimated by providing the same weight to the two stages and the efficiency results obtained by providing different weights to the two stages can better distinguish the real operation status of Internet banks. In 2019, the same weight was provided to the two stages to measure the first stage efficiency, the second stage efficiency, and the comprehensive efficiency. The results show that the number of banks with an efficiency value of 1 is 10, 12 and 9, respectively, which is higher than the 5, 9 and 6 banks with different weights provided by the model in this paper, and it is found that the banks with an efficiency value of 1 measured by the latter are all included in the former. It shows that the efficiency results are overestimated by providing the same weight to the two stages and the efficiency results obtained by providing different weights to the two stages can better distinguish the real operation status of Internet banks.

6. Conclusions

Based on the above empirical analysis results, this paper proposes improvement from the following three perspectives for the healthy development of China’s Internet banks and the improvement of their operational efficiency: Firstly, R&D investment is the lifeblood of the development of Internet banking. In seeking development, banks should grasp the principle that R&D investment is compatible with the scale of banks, which not only avoids the lack of development power brought by insufficient R&D but also avoids the disadvantages of low efficiency caused by redundant R&D investment. Secondly, the operating efficiency of Internet banks depends on the efficiency value in the value creation stage. Internet banks can explore ways to improve the efficiency value in the value creation stage to improve the overall efficiency. Finally, it is recommended to improve the financial supervision mechanism of Internet banks, regulate the financial behavior of Internet banks through the system, further reduce the non-performing loan rate of Internet banks, and reduce the undesired output.
The innovations of this paper include: The selection of indicators in the research method, combined with the characteristics of Internet banks that are light on assets and heavy on artificial intelligence and network technology, and the selection of financial indicators of R&D investment in the value operation stage, which reflect the characteristics of Internet banks that focus on R&D and enrich the current research methods on their operational efficiency. In the application of the model, the two-stage network DEA model is applied to the research on the operating efficiency of Internet banks for the first time. Additionally, the operating performance of 16 Internet banks in China in 2018–2019 is compared and analyzed. Compared with the traditional DEA model, the research depth is expanded and the research samples of Internet banks are also expanded, which overcomes the shortcomings of previous scholars who only analyzed a few Internet banks, thus more genuinely reflecting the operational efficiency of China’s Internet banks in 2018–2019. In terms of test methods, the Kruskal–Wallis test is used to test the average comprehensive efficiency of Internet banks located in the three major economic belts. It is concluded that there is no significant difference in the average comprehensive efficiency of Internet banks distributed in the eastern, central, and western regions from 2018 to 2019.
The limitations of this study are as follows: Due to the short establishment time of China’s Internet banking industry, the research sample of this paper only selects the financial data of Internet banking from 2018 to 2019 for research. The sample size is small and the period is short. Therefore, the relevant financial data are volatile. In terms of weight processing, the idea of cooperation and game is adopted to obtain the weight of the two stages and its rationality needs to be proved. In selecting the investment index, there is no consideration of the two stages of shared investment. The net assets, R&D investment, and the number of employees of Internet banks run through the whole process of the Internet banks. In the future, the two-stage network DEA model with shared input, the dynamic network SBM-DEA model, and the method combined with DEA and the Malmquist index can be considered to study the operating efficiency of Internet banks.

Author Contributions

Conceptualization, M.L. (Min Li) and N.Z.; methodology, M.L. (Min Li) and N.Z.; software, M.L. (Min Li); validation, M.L. (Min Li), K.H. and M.L. (Minghui Li); formal analysis, M.L. (Min Li); investigation, M.L. (Min Li); resources, N.Z.; data curation, M.L. (Min Li); writing—original draft preparation, M.L. (Min Li); writing—review and editing, K.H.; visualization, M.L. (Minghui Li); supervision, N.Z. All authors have read and agreed to the published version of the manuscript.

Funding

This research received no external funding.

Institutional Review Board Statement

Not applicable.

Informed Consent Statement

Informed consent was obtained from all subjects involved in the study.

Data Availability Statement

The data that support the findings of this study are available from the corresponding authors upon reasonable request.

Acknowledgments

We thank to the editor and anonymous reviewers for their careful reading of our manuscript and their insightful comments and suggestions.

Conflicts of Interest

The authors declare no conflict of interest.

References

  1. Alhadeff, D. Monopoly and Competition in Banking; University of California Press: Berkeley, CA, USA, 1954; Volume 65, p. 323. [Google Scholar]
  2. Farrell, M.J. The Measurement of Productive Efficiency. J. R. Stat. Soc. 1957, 120, 253–290. [Google Scholar] [CrossRef]
  3. Zhu, N.; Zhuo, X.; Dong, Y. Empirical Analysis and Reform Strategy on the Efficiency of Chinese State-owned Commercial Banks. Manag. World 2004, 18–26. [Google Scholar] [CrossRef]
  4. Sari, S.; Ajija, S.R.; Wasiaturrahma, W.; Ahmad, R.A.R. The Efficiency of Indonesian Commercial Banks: Does the Banking Industry Competition Matter? Sustainability 2022, 14, 10995. [Google Scholar] [CrossRef]
  5. Zheng, Y.; Rashid, M.H.U.; Siddik, A.B.; Wei, W.; Hossain, S.Z. Corporate Social Responsibility Disclosure and Firm’s Productivity: Evidence from the Banking Industry in Bangladesh. Sustainability 2022, 14, 6237. [Google Scholar] [CrossRef]
  6. Xie, Z.; Liu, X.; Najam, H.; Fu, Q.; Abbas, J.; Comite, U.; Cismas, L.M.; Miculescu, A. Achieving Financial Sustainability through Revenue Diversification: A Green Pathway for Financial Institutions in Asia. Sustainability 2022, 14, 3512. [Google Scholar] [CrossRef]
  7. Chang, M.C.; Chen, C.-P.; Lin, C.-C.; Xu, Y.-M. The Overall and Disaggregate China’s Bank Efficiency from Sustainable Business Perspectives. Sustainability 2022, 14, 4366. [Google Scholar] [CrossRef]
  8. Zhong, K.; Li, C.; Wang, Q. Evaluation of Bank Innovation Efficiency with Data Envelopment Analysis: From the Perspective of Uncovering the Black Box between Input and Output. Mathematics 2021, 9, 3318. [Google Scholar] [CrossRef]
  9. Seiford, L.M.; Zhu, J. Profitability and Marketability of the Top 55 U.S. Commercial Banks. Manag. Sci. 1999, 45, 1270–1288. [Google Scholar] [CrossRef] [Green Version]
  10. Lin, S.H.; Lai, H.H.; Change, T.P.; Chen, Y.J. Discussion on Banking Efficiency and Determinants in the Digital Finance Environment—Evidence in Taiwan. Int. J. Bus. 2022, 27, 1–30. [Google Scholar]
  11. Omrani, H.; Alizadeh, A.; Emrouznejad, A.; Oveysi, Z. A novel best-worst-method two-stage data envelopment analysis model considering decision makers’ preferences: An application in bank branches evaluation. Int. J. Financ. Econ. 2022. [Google Scholar] [CrossRef]
  12. Wasiaturrahma; Sukmana, R.; Ajija, S.R.; Salama, S.C.U.; Hudaifah, A. Financial performance of rural banks in Indonesia: A two-stage DEA approach. Heliyon 2020, 6, e04390. [Google Scholar] [CrossRef] [PubMed]
  13. Milenković, N.; Radovanov, B.; Kalaš, B.; Horvat, A.M. External Two Stage DEA Analysis of Bank Efficiency in West Balkan Countries. Sustainability 2022, 14, 978. [Google Scholar] [CrossRef]
  14. Li, H.; Xiong, J.; Xie, J.; Zhou, Z.; Zhang, J. A Unified Approach to Efficiency Decomposition for a Two-Stage Network DEA Model with Application of Performance Evaluation in Banks and Sustainable Product Design. Sustainability 2019, 11, 4401. [Google Scholar] [CrossRef] [Green Version]
  15. Li, F.; Zhu, P.; Liang, L.; Kou, G. Research on Two-Stage Efficiency Evaluation Method of DEA Based on Nearest Distance Projection. Chin. J. Manag. Sci. 2020, 1–13. [Google Scholar] [CrossRef]
  16. Wu, H.Q.; Yang, J.Y.; Wu, W.S.; Chen, Y. Interest rate liberalization and bank efficiency: A DEA analysis of Chinese commercial banks. Cent. Eur. J. Oper. Res. 2022, 1–32. [Google Scholar] [CrossRef]
  17. Kumar, V.P.; Kar, S. Measuring the efficiency of Indian public and private banks using the two-stage network DEA model. Benchmarking Int. J. 2022. [Google Scholar] [CrossRef]
  18. Xie, Q.W.; Xu, Q.F.; Chen, L.F.; Jin, X.; Li, S.Q.; Li, Y.J. Efficiency evaluation of China’s listed commercial banks based on a multi-period leader-follower model. Omega 2022, 110, 102615. [Google Scholar] [CrossRef]
  19. Phung, Q.T.; Vu, H.V.; Tran, H.P. Do non-performing loans impact bank efficiency? Financ. Res. Lett. 2022, 46, 102393. [Google Scholar] [CrossRef]
  20. Preeti; Roy, S. Application of Hybrid Approach in Banking System: An Undesirable Operational Performance Modelling. Glob. Bus. Rev. 2022, 09721509211026789. [Google Scholar] [CrossRef]
  21. Hashem, O.; Zeynab, O.; Ali, E.; Tamara, T. A mixed-integer network DEA with shared inputs and undesirable outputs for performance evaluation: Efficiency measurement of bank branches. J. Oper. Res. Soc. 2022. [Google Scholar] [CrossRef]
  22. Fukuyama, H.; Matousek, R.; Tzeremes, N.G. A Nerlovian cost inefficiency two-stage DEA model for modeling banks’ production process: Evidence from the Turkish banking system. Omega 2020, 95, 102198. [Google Scholar] [CrossRef]
  23. Zhang, K.; Zhou, X. Is Promoting Green Finance in Line with the Long-Term Market Mechanism? The Perspective of Chinese Commercial Banks. Mathematics 2022, 10, 1374. [Google Scholar] [CrossRef]
  24. Lin, T.Y.; Chiu, S.-H.; Wang, Y.; Ouyang, Z. Value Creation Performance Evaluation for Taiwanese Financial Holding Companies during the Global Financial Crisis Based on a Multi-Stage NDEA Model under Uncertainty. Axioms 2022, 11, 35. [Google Scholar] [CrossRef]
  25. Shao, L.; You, J.; Xu, T.; Shao, Y. Non-Parametric Model for Evaluating the Performance of Chinese Commercial Banks’ Product Innovation. Sustainability 2020, 12, 1523. [Google Scholar] [CrossRef] [Green Version]
  26. Xue, K.L.; Fan, J.P.; Kuang, H.B.; Zhao, M.; Wu, M.Q. Efficiency Evaluation of Chinese Commercial Banks Based on Two-Stage Cross-Efficiency Model. Chin. J. Manag. Sci. 2021, 29, 23–34. [Google Scholar]
  27. Wang, M.Q.; Chang, M. An Analysis of the Operational Efficiency of Chinese Commercial Banks Considering the Way of Capital Operation. Chin. J. Manag. Sci. 2021, 1–14. [Google Scholar] [CrossRef]
  28. Li, Y.P. Research on the Business Model and Efficiency of Internet banking in China; Zhejiang University: Hangzhou, China, 2019. [Google Scholar]
  29. Tang, M.; Zuo, X.L. Differentiated Supervision of Internet Banking. China Financ. 2020, 41–42. [Google Scholar] [CrossRef]
  30. Wang, P.P. An Empirical Research on Profitability of Internet Banks in China. J. Financ. Dev. Res. 2020, 79–85. [Google Scholar] [CrossRef]
  31. Mao, H.Q.; Hu, Z. Empirical Analysis of the Factors Influencing the Operating Efficiency of Private Banks in China: Based on the Development Perspective of “Internet plus Inclusive Finance”. West China Financ. 2021, 32–38. [Google Scholar] [CrossRef]
  32. Hu, L. Comparative Study on Operating Efficiency of Pure Online Banking; Southwestern University of Finance and Economics: Chengdu, China, 2021. [Google Scholar] [CrossRef]
  33. Zheng, X.L. Discussion on the Reform of Banking Supervision System under the Background of Internet Finance. China Mark. 2022, 51–52. [Google Scholar] [CrossRef]
  34. Blagojević, A.; Vesković, S.; Kasalica, S.; Gojić, A.; Allamani, A. The application of the fuzzy AHP and DEA for measuring the efficiency of freight transport railway undertakings. Oper. Res. Eng. Sci. Theory Appl. 2020, 3, 1–23. [Google Scholar] [CrossRef]
  35. Mitrović Simić, J.; Stević, Ž.; Zavadskas, E.K.; Bogdanović, V.; Subotić, M.; Mardani, A. A novel CRITIC-Fuzzy FUCOM-DEA-Fuzzy MARCOS model for safety evaluation of road sections based on geometric parameters of road. Symmetry 2020, 12, 2006. [Google Scholar] [CrossRef]
  36. Arsu, T. Investigation into the efficiencies of European football clubs with bi-objective multi-criteria data envelopment analysis. Decis. Mak. Appl. Manag. Eng. 2021, 4, 106–125. [Google Scholar] [CrossRef]
  37. Kao, C.; Hwang, S.N. Efficiency decomposition in two-stage data envelopment analysis: An application to non-life insurance companies in Taiwan. Eur. J. Oper. Res. 2008, 185, 418–429. [Google Scholar] [CrossRef]
  38. Kao, C.; Hwang, S.N. Decomposition of technical and scale efficiencies in two-stage production systems. Eur. J. Oper. Res. 2011, 211, 515–519. [Google Scholar] [CrossRef]
  39. Chen, Y.; Cook, W.D. Additive Efficiency Decomposition in Two-stage DEA. Eur. J. Oper. Res. 2009, 196, 1170–1176. [Google Scholar] [CrossRef]
  40. Kwon, H.B.; Lee, J. Two-stage production modeling of large U.S. banks: A DEA-neural network approach. Expert Syst. Appl. 2015, 42, 6758–6766. [Google Scholar] [CrossRef]
  41. Wang, Q.Q.; Wu, Z.B.; Chen, X. Decomposition weights and overall efficiency in a two-stage DEA model with shared resources. Comput. Ind. Eng. 2019, 136, 135–148. [Google Scholar] [CrossRef]
  42. Huang, T.H.; Chen, K.C.; Lin, C.I. An extension from Network DEA to copula-based network SFA: Evidence from the U.S. 433 commercial banks in 2009. Q. Rev. Econ. Financ. 2018, 67, 51–62. [Google Scholar] [CrossRef]
Figure 1. The research flow diagram.
Sustainability 14 14165 g001
Figure 2. Two-stage network DEA model.
Sustainability 14 14165 g002
Figure 3. Two-stage network DEA model including second-stage input and undesired output.
Sustainability 14 14165 g003
Figure 4. The Internet banking indicator system of this paper.
Sustainability 14 14165 g004
Figure 5. Stage efficiency and comprehensive efficiency of Internet banking in 2018.
Sustainability 14 14165 g005
Figure 6. Stage efficiency and comprehensive efficiency of Internet banking in 2019.
Sustainability 14 14165 g006
Figure 7. Mean distribution of comprehensive efficiency of Internet banks.
Sustainability 14 14165 g007
Table 1. Descriptive statistics of input—output indicators in 2018–2019.
YearProjectNet Assets (Thousand CNY)Employees (Number)R&D Investment (Thousand CNY)Total Deposits (Thousand CNY)Provision for Loan Impairment (Thousand CNY)Net Interest Income (Thousand CNY)Non-Interest Income (Thousand CNY)Non-Performing
Loan Ratio
2018Mean3,528,078384241,92431,418,835581,4841,021,746435,0690.43%
Std2,453,992433662,62642,136,088986,1961,611,8831,161,7840.82%
Min1,793,165875281,976,12951,00021,313−156,5460.00%
Max11,940,47519062,698,378175,462,8883,554,5005,520,0114,509,7283.16%
0.252,092,61618012,4599,487,995134,115196,03736980.00%
0.503,118,31127139,51320,661,524216,242484,09263,5290.01%
0.703,962,590396155,25526,652,582433,465862,893179,5500.56%
2019Mean4,289,105475306,54246,232,394878,7331,670,672442,2990.67%
Std3,767,311568744,39960,823,5721,244,0402,400,0711,404,8750.48%
Min1,959,40311373828,230,61579,520176,085−800,3780.00%
Max16,119,12825093,044,986253,423,2294,323,0009,463,7795,406,5521.30%
0.252,166,87322025,04515,410,046223,668397,12645090.17%
0.503,369,34432177,08226,489,432472,171934,28356,5850.60%
0.704,153,743445208,33841,718,618748,5001,649,300355,5141.14%
Table 2. Stage efficiency and comprehensive efficiency in 2018.
Bank NameValue Operation Stage Efficiency θ d 1 Value Creation Stage Efficiency θ d 2 Comprehensive Efficiency θ d Value Operation Stage Weight ε 1 Value Creation Stage Weight ε 2
WeBank1110.40060.5994
Wenzhou Mingshang Bank0.4370.9630.9620.00210.9979
Zhejiang E-Commerce Bank1110.38640.6136
Kincheng Bank of Tianjin0.5490.6560.6290.24980.7502
Shanghai HuaRui Bank0.5180.8340.7620.22540.7746
Chongqing Fuming Bank0.6250.8520.8510.00410.9959
XWBank0.8250.7710.7800.1620.838
Bank of Sanxiang0.76010.9990.00350.9965
Fujian OneBank0.0870.6880.6860.00230.9977
Wuhanzbank1110.22150.7785
Weihai Blue Ocean Bank0.85010.9780.14560.8544
Zhongguancun Bank0.49010.9980.00320.9968
Jilin Yillion Bank0.4930.8970.8960.00230.9977
Jiangsu Suning Bank0.7790.9060.9060.00330.9967
Meizhou Hakka Bank0.817110.00120.9988
NewUp Bank of Liaoning1110.07870.9213
Table 3. Stage efficiency and comprehensive efficiency in 2019.
Bank NameValue Operation Stage Efficiency θ d 1 Value Creation Stage Efficiency θ d 2 Comprehensive Efficiency θ d Value Operation Stage Weight ε 1 Value Creation Stage Weight ε 2
WeBank1110.02660.9734
Wenzhou Mingshang Bank0.908110.00140.9986
Zhejiang E-Commerce Bank1110.41990.5801
Kincheng Bank of Tianjin0.62610.9980.00420.9958
Shanghai HuaRui Bank0.4720.6890.6880.00530.9947
Chongqing Fuming Bank0.6300.6480.6420.37050.6295
XWBank0.65210.8850.33190.6681
Bank of Sanxiang0.8050.9670.9660.00540.9946
Fujian OneBank0.2620.8200.8190.00310.9969
Wuhanzbank1110.02540.9746
Weihai Blue Ocean Bank1110.09620.9038
Zhongguancun Bank0.43910.9980.00270.9973
Jilin Yillion Bank0.8460.7470.7910.44880.5512
Jiangsu Suning Bank10.9920.9930.04130.9587
Meizhou Hakka Bank0.794110.00170.9983
NewUp Bank of Liaoning0.9860.4610.7250.50350.4965
Table 4. Average comprehensive efficiency of Internet banking and its distribution in the economic belt in 2018–2019.
Bank NameMean Comprehensive Efficiency ( θ d ¯ ) ProvinceEconomic BeltGroup
WeBank1.000GuangdongEastern1
Wenzhou Mingshang Bank0.981ZhejiangEastern1
Zhejiang E-Commerce Bank1.000ZhejiangEastern1
Kincheng Bank of Tianjin0.814TianjinEastern1
Shanghai HuaRui Bank0.725ShanghaiEastern1
Chongqing Fuming Bank0.746ChongqingWestern3
XWBank0.832SichuanWestern3
Bank of Sanxiang0.983HunanCentral2
Fujian OneBank0.752FujianEastern1
Wuhanzbank1.000HubeiCentral2
Weihai Blue Ocean Bank0.989ShandongEastern1
Zhongguancun Bank0.998BeijingEastern1
Jilin Yillion Bank0.844JilinCentral2
Jangsu Suning Bank0.949JiangsuEastern1
Meizhou Hakka Bank1.000GuangdongEastern1
NewUp Bank of Liaoning0.863LiaoningEastern1
Table 5. Hypothesis test results.
The Null HypothesisTestSig.Decision
θ d ¯ The distribution of the mean value of comprehensive efficiency has no significant difference among the three economic beltsIndependent samples
Kruskal–Wallis test
0.257Do not reject the null hypothesis
Table 6. The efficiency values under two weight settings.
Bank Name20182019
MATLABMax DEAMATLABMax DEA
θ d 1 θ d 2 θ d θ d 1 θ d 2 θ d θ d 1 θ d 2 θ d θ d 1 θ d 2 θ d
WeBank111111111111
Wenzhou Mingshang Bank0.4370.9630.9620.860.8450.8520.90811111
Zhejiang E-Commerce Bank111111111111
Kincheng Bank of Tianjin0.5490.6560.6290.5880.6510.6190.62610.9980.71910.859
Shanghai HuaRui Bank0.5180.8340.7620.5560.9130.7340.4720.6890.6880.5140.7310.623
Chongqing Fuming Bank0.6250.8520.8510.6190.4010.510.6300.6480.6420.6030.5890.596
XWBank0.8250.7710.7800.6430.7760.7090.65210.8850.67510.837
Bank of Sanxiang0.76010.9990.80110.9010.8050.9670.9660.62410.812
Fujian OneBank0.0870.6880.6860.9090.6880.7980.2620.8200.8190.9590.7320.845
Wuhanzbank111111111111
Weihai Blue Ocean Bank0.85010.9780.96610.983111111
Zhongguancun Bank0.49010.9980.71610.8580.43910.998111
Jilin Yillion Bank0.4930.8970.89610.5130.7570.8460.7470.79110.7570.878
Jiangsu Suning Bank0.7790.9060.9060.5480.8080.67810.9920.993111
Meizhou Hakka Bank0.817111110.79411111
NewUp Bank of Liaoning1111110.9860.4610.725111
The number of banks with an efficiency value of 148568559610129
Publisher’s Note: MDPI stays neutral with regard to jurisdictional claims in published maps and institutional affiliations.