Abstract
White chocolate is considered an unhealthier product than dark and milk chocolate due to the absence of cocoa solids containing polyphenols and other valuable components such as minerals and dietary fiber. This paper aimed to improve the nutritional value of white chocolate (C) by adding blueberry bioactive compounds. Since natural polyphenols are easily degradable because of their sensitivity, whey, as a rich source of proteins, was used as a material for encapsulating blueberry juice. Whey proteins protect blueberry anthocyanins and increase their bioaccessibility in the human body. Blueberry juice encapsulates (B) were added to white chocolate, replacing 8% (C-B8) and 10% (C-B10) of white chocolate mass. Blueberry encapsulates significantly (p < 0.05) increased the viscosity of chocolates (from 0.63 Pa·s in C to 1.13 Pa·s in C-B8 and 1.40 Pa·s in C-B10) with no significant impact on their melting peak. Both enriched chocolates had significantly (p < 0.05) higher protein and dietary fiber content and lower fat content than white chocolate. The total polyphenol content increased 3.7-fold, while antioxidant capacity increased 5.2-fold in C-B10. The oxidation stability, determined by pressurized accelerated oxidation, was also improved in enriched chocolates. Blueberry juice encapsulated in whey positively influenced the color and sensory characteristics of fortified white chocolates, where C-B10 had higher sensory scores for blueberry odor and taste than C-B8. The obtained results open up a possible pathway and indicate opportunities and limitations for the incorporation of other materials, such as various dietary/fruit components, in white chocolate.
1. Introduction
The primary chocolate categories are dark, milk, and white, which differ in the content of cocoa solids, cocoa butter, and milk fat. Chocolates with a high content of cocoa solids make a positive contribution to human nutrition through the provision of antioxidants, principally polyphenols, including flavonoids such as procyanidins, epicatechin, and catechin [1]. Numerous studies have shown that cacao products have a much greater antioxidant capacity and more flavonoids per serving than tea, fruits, red wine, vegetables, and berries, which are renowned for their rich flavonoids [2]. White chocolates differ from milk and dark through the absence of cocoa solids, which reduces the nutritional properties of chocolate [1] since phenolic compounds are powerful antioxidants and play a crucial role in preventing diseases [3]. Improving the health properties of white chocolate was demonstrated by Muhammad et al. [4]. A 2l2-fold improvement of phenolic content and 52-fold increase in antioxidant activity was achieved by supplementation with cinnamon extracts. Didar [5] used free and encapsulated pomegranate extract to enhance the functionality of white chocolate in terms of antioxidant activity. Altınok et al. [6] utilized grape pomace powder in white chocolate formulation for the partial replacement of sucrose.
Blueberries are considered “superfruits”, which provide many health benefits in human nutrition due to the high content of polyphenols, especially anthocyanins [7]. Anthocyanins are responsible for the blue, violet, and red colors of fruits [8]. They are a class of water-soluble natural pigments in plants that have a strong antioxidant capacity and anti-cancer, blood pressure lowering, and blood vessel-softening, functions [9].
Natural polyphenols are easily degradable during processing and storage because of their sensitivity to heat, oxygen, light, and pH [10], so the technique of encapsulation is often used to cover an active compound with a protective wall material and to impart some degree of protection against evaporation, reaction, or migration in food [11]. Lang et al. [12] found that α-casein and β-casein protect blueberry anthocyanins under simulated digestive conditions, as well as their antioxidant capacity, increasing their bioaccessibility during intestinal digestion. Other proteins, including whey protein, showed similar effects on the stability of blueberry anthocyanins [13], anthocyanins-based color in model beverage systems [14], grape skin anthocyanin extracts [15], and blueberry anthocyanins under illumination conditions [16]. Whey is a natural by-product of cheese production where the cheese-making process produces large amounts of whey. Liquid whey makes up almost 90% of the milk used for cheese production. Although the whey is nutritionally very valuable, a large amount is disposed of as wastewater. On the other hand, whey represents an excellent source of functional proteins and a rich source of vitamins B, lactose, and minerals (Ca, P, Na, K, Cl−, Fe, Cu, Zn, and Mg). For this reason, 50% of the obtained whey is recycled for the production of high-value food and chemical products [17,18].
The trend for functionally enhanced traditional products has also expanded to the chocolate market. So far, existing functional chocolate products include chocolate with glucomannan and insoluble cocoa fibers [19], whey chocolate produced without sugar, only with whey proteins [20], multi-vitamin dark chocolates with chamomile, B, C, and D vitamins [21], chocolate with ginseng, green tea, Ginkgo biloba, guarana, etc. Belscak-Cvitanovic et al. [22] explored the possibility of using an aqueous extract of red raspberry leaf to produce functional chocolate. Although the polyphenolic content and antioxidant activity were increased, the resulting chocolate products were harder and with higher viscosity, as well as having rough and coarse product surfaces with numerous bumps and protrusions, resulting in an unattractive and sensorily unacceptable product. In addition to these drawbacks, polyphenol compounds could be deteriorated during chocolate processing at high temperatures but also during product storage. Encapsulation offers protection and concentration of these valuable compounds, as well as their easier dosing and, finally, controlled release. Furthermore, whey proteins as carriers offer additional functionality compared to commonly used polysaccharides for encapsulation purposes. Therefore, the addition of blueberry juice encapsulated in whey proteins has many advantages.
In contrast to our previous studies in which green tea extract and blackberry juice were encapsulated on maltodextrin [10,23] and considering the functional properties of whey and its positive effect on polyphenols bio-accessibility, this research examined the effect of blueberry juice encapsulated in whey on the physical properties, polyphenol content, sensory characteristics, and oxidation stability of white chocolate.
2. Materials and Methods
2.1. Chocolate Ingredients
The experiments in laboratory conditions included white chocolate with 34.8% of cocoa butter, provided by Eugen chocolate Ltd., Gložan, Serbia, as well as blueberry juice (Nectar, Backa Palanka, Serbia) encapsulated in whey (Olimp, Debica Laboratories, Debica, Poland) (B).
2.2. Spray-Drying Process
The whey protein concentrate was purchased from Olimp Laboratories (Debica, Poland), with 77% minimum protein content. Whey protein (7 g) was dissolved in 40 mL of water at 60 °C and kept under stirring until the temperature reached 30 °C and then mixed with 21 mL of blueberry juice to reach the ratio 75:25. The mixture was spray-dried using a lab-scale spray dryer (Büchi mini B-290, Büchi Labortechnik, Flawil, Switzerland) at an inlet temperature of 130 °C and an outlet temperature of 65 ± 2 °C. The spraying air flow rate and rate of liquid feed were 600 L/h and 8 mL/min, respectively. The spray-dried encapsulates, with 5.1% moisture and 69.6% protein content, were stored at −20 °C until further use.
2.3. Tempering Chocolate
Tempering of chocolate mass was carried out in a modified Brabender farinograph (Duisburg, Germany), as described in our previous research [10]. First, 120 g of white chocolate (control sample—C) were poured into the kneader and tempered according to the following three-stage procedure: (1) Melting for 30 min at 42 °C, (2) stirring for 60 min at 42 °C, and (3) stirring for 60 min at 29.5 °C. After tempering, the white chocolate mass was poured into plastic molds that held 50 g of chocolate and cooled for 90 min at 5 °C in a refrigerator.
The results of our previous investigations of the production of white chocolate with blackberry juice encapsulated on maltodextrin in laboratory conditions [10] indicated that the amount of encapsulate should not exceed 8% since 10% caused a matte color on the chocolate surface. On the other hand, the production of white chocolate with encapsulated green tea extract in maltodextrin in industrial conditions [23] showed that 10% of the encapsulate did not impair the surface appearance of the enriched chocolate and, moreover, it maximized the content of polyphenol content. Accordingly, we decided to produce the white chocolate with the addition of 8% (C-B8) and 10% (C-B10) of blueberry juice encapsulated in whey. The enriched samples were tempered under the same conditions as the control sample, where the encapsulate was dosed immediately before stirring.
2.4. Particle Size Distribution (PSD) in Encapsulates and Chocolates
The particle size analyzer based on laser diffraction, Mastersizer 2000 (Malvern Instruments, Malvern, UK), was used for the determination of particle size distribution in B, C, C-B8, and C-B10. The encapsulates were dispersed in the air using the Scirocco dispersion unit, while chocolates were dispersed in sunflower oil in the Hydro 2000 μP dispersion unit. The results were expressed as the volume-based PSD and described by PSD parameters obtained using the Mastersizer 2000 software: d[4,3], volume mean diameter, and parameters d(0.1), d(0.5), and d(0.9) that represent the particle sizes where 10, 50, or 90% of the total sample volume consists of particles smaller than that size.
2.5. Rheological Properties of Chocolate Mass
The rheometer, Rheo Stress 600 (Haake, Vreden, Germany), equipped with Z20DIN coaxial cylinders, was used for the determination of the rheological properties of chocolate samples at the temperature 40 ± 1 °C [24]. The shear rate was varied in three successive steps: (1) increasing from 0 s−1 to 60 s−1 for 180 s, (2) keeping constant for 60 s at 60 s−1, (3) reducing from 60 s−1 to 0 s−1, in a period of 180 s.
2.6. Chocolate Hardness
The texture analyzer TA.HD Plus (Stable Micro Systems, Godalming, UK) was used to determine chocolate hardness using the method 3-Point Bending Rig (HDP/3PB) according to Baycar et al. [25].
2.7. Melting Properties of Chocolates
The thermal profile of white chocolate and fortified white chocolates was determined by differential scanning calorimetry DSC 910, Thermal analyzer 990, and dynamic mechanical analyzer (TA Instruments, New Castle, DE, USA). Then, 5 mg of the sample was placed into pans and sealed with lids using a sample press. Pans were heated from 20 to 50 °C at 5 °C/min [10].
2.8. Color of Encapsulates and Chocolates
The color on the surface of blueberry encapsulates and chocolate samples was measured by the MINOLTA Chroma Meter CR-400 (Minolta Co., Ltd., Osaka, Japan) using D 65 lighting, a 2° standard observer angle, and an 8 mm aperture in the measuring head. The Chroma Meter was calibrated using a Minolta calibration plate (No. 11333090; Y = 92.9, x = 0.3159; y = 0.3322). The color was interpreted using the obtained values of CIELab color coordinates: L*—lightness, a*—redness to greenness, and b*—yellowness to blueness.
2.9. Sensory Evaluation
Chocolate samples were evaluated in the laboratory for sensory evaluation at the Faculty of Technology Novi Sad 24 h after sample preparation. A sensory panel of 8 trained panelists was selected according to the guidelines of the standard ISO 8586:2012 [26]. The sensory evaluations were conducted in individual cabinets designed in accordance with standard ISO 8589:2007 [27]. During training sessions, the panelists were introduced to the terms that can be used to evaluate chocolate [28]. The panelists developed a 7-point scale (1 = the least intensity and 7 = the most intensity) with the following sensory attributes: color intensity (light to dark), glow (mat to shiny), surface appearance (unacceptable to distinctive), hardness (soft to hard), melting (slowly to quickly), smoothness (very even to very granular), blueberry odor (light to distinct), blueberry taste (light blueberry notes to distinct blueberry notes), and sweetness (lightly sweet to very sweet) [29]. Each chocolate sample was labeled with a three-digit code and served on a plastic plate.
2.10. Chemical Composition of Chocolates
The chemical composition of chocolate was defined by determining the content of moisture, protein, total fat, ash, and dietary fiber using the standard AOAC methods: No. 931.04, No. 939.02, No. 963.15, No. 930.22, and No. 985.29, respectively [30]. The non-fiber carbohydrate content was determined by the following calculation [31]:
%Total Carbohydrate = 100 − %(Protein + Fat + Moisture + Ash + Fiber)
2.11. Total Polyphenol Content and Antioxidant Capacity Assay
For the extraction of chocolate samples, the methods determined by Belščak-Cvitanović et al. [32] were applied. Briefly, a 2.0 g sample was defatted with 10 mL of n-hexane three times and left to air dry for 24 h. Then, 2 × 10 mL of 70% methanol was used for extraction for 30 min in an ultrasonic bath in two consecutive extractions. Each extraction was followed by centrifugation for 10 min at 3000 rpm. Filtered supernatants were used for the determination of polyphenols and antioxidant capacity.
The polyphenol content in chocolate was determined using the Folin–Ciocalteau spectrophotometrical method, adjusted to a microtiter plate [33]. Reaction mixtures containing 15 μL of extract, 170 μL of distilled water, 12 μL of Folin–Ciocalteu’s reagent (2M), and 30 μL of 20% sodium carbonate were applied to microtiter plate wells, shaken, and left in the dark for 1 h. Water was used as a blank. The absorbances were read at 750 nm, and results were expressed using gallic acid for calibration.
For the determination of the antioxidant capacity (AC) of chocolate samples, a DPPH assay adjusted to a microtiter plate was used [34], described in our previous paper [23]. Briefly, 250 μL of DPPH• solution in methanol (0.89 mmol/L) were mixed with 10 μL of chocolate extract in the microplate well and left in a dark at room temperature. After 50 min, absorbances were read at 515 nm using methanol as a blank. The AC of the chocolate samples was calculated as follows:
where AS is the absorbance of the reaction mixture with the sample, and A0 is the absorbance of the initial DPPH• solution. Trolox was used for calibration.
AC (%) = 100 − (AS/A0) × 100
2.12. Oxidation Stability of Chocolate Samples
The chocolate samples were analyzed for oxidation stability using RapidOxy 100 (Anton Paar, Blankenfelde-Mahlow, Germany). First, 3 g of finely chopped chocolate sample were placed in a glass dish and placed in the sealed instrument chamber. The samples were tested with a user-defined program at a test temperature of 120 °C and 700 kPa filling pressure until a pressure drop of 10% below maximum pressure (pmax) was detected. The induction period represents the time in minutes elapsed between the start of the test when oxygen pressure is stabilized at 700 kPa to the pressure drop of 10% from the recorded maximum pressure at 120 °C [35].
2.13. Statistical Analysis
All data are presented as mean values of three values (except the results of sensory analyses, 8 values) along with their standard deviations (SD). Means were compared by Duncan’s multiple range test with a confidence interval of 95% (p < 0.05). Statistical analysis was carried out using Statistica 13.0. (StatSoft, Inc., Tulsa, OK, USA).
3. Results and Discussion
3.1. The Impact of Encapsulates on Particle Size Distribution and Rheology of White Chocolate
With improvements in chocolate quality through new product development, it is necessary to control the rheological properties of chocolate mass due to their reflection on production cost and quality of the final product. The viscosity of chocolate is important in the manufacturing process for obtaining final products with well-defined textures. Chocolates with high viscosity have a pasty mouthfeel and melt slowly in the mouth when consumed [1]. Chocolate viscosity (flow) is directly influenced by the particle size distribution (PSD) of solids and the composition of chocolate. In addition to the fact that the PSD directly affects the viscosity and texture of chocolate, it also has a direct influence on its sensory properties [36].
Figure 1a presents the particle size distribution of the control sample of white chocolate (C), blueberry encapsulates (B), and enriched white chocolate with 8% (C-B8) and 10% (C-B10) of B.
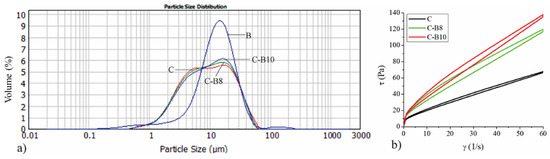
Figure 1.
(a) The particle size distribution of blueberry juice encapsulated in whey (B), white chocolate (C), and chocolates with 8% and 10% of B (C-B8 and C-B10); (b) flow curves of chocolates.
Even 40.72% of B volume is consisted of particles in the range of 10 to 20 μm, as shown by Mastersizer 2000 software (version number 5.60, Malvern, UK). This results in increasing the volume of enriched chocolates that have particle sizes in that range, according to the added amount of B. Table 1 represents the particle size parameters of the encapsulate, control sample of white chocolate, and chocolates with 8% and 10% of B. The volume-weighted mean d[4,3] parameter of blueberry juice encapsulated in whey amounts to 16.15 μm, which is almost two times lower value compared to the encapsulates we used in our previous investigations when we used maltodextrin as a carrier material [10,23]. Accordingly, the d[4,3] values of enriched chocolates also have lower values.

Table 1.
Particle size distribution and rheological parameters of chocolates.
The addition of 8% and 10% of B did not have a significant effect on the volume-weighted mean d[4,3] in enriched chocolates (12.76 μm in sample C-B8 and 13.18 μm in sample C-B10) compared to the control sample of white chocolate (13.06 μm). Assuming that chocolate particles must be below 30 μm [37], it is obvious that B can be used as a supplement in chocolate production with no possibility of causing a gritty mouth feeling during consummation. The addition of 8% and 10% of B to white chocolate had no significant impact on parameter d(0.1), while it significantly (p < 0.05) increased parameter d(0.5) in sample C-B10 and significantly (p < 0.05) decreased parameter d(0.9) in enriched chocolates C-B8 and C-B10 compared to control sample of white chocolate.
Figure 1b represents the impact of added blueberry juice encapsulated in whey (B) on the rheological properties of enriched chocolates. All chocolate samples exhibited a thixotropic flow where the addition of B increases the viscosity of enriched white chocolate mass in accordance with the added amount. Considering the smaller particles of the encapsulate where whey is the carrier of blueberry juice, the viscosity values are higher compared to our previous research where maltodextrin was used as a carrier for blackberry juice and green tea extract. The obtained flow curves were fitted using the Casson model to determine the following parameters: Cason yield stress (Pa) and Casson viscosity (Pa·s). The values of Cason yield stress (Pa) and Casson viscosity (Pa·s) are presented in Table 2. Both amounts of B significantly increased (p < 0.05) the values of Casson yield stress and Casson viscosity in enriched chocolate samples (1.13 Pa·s in C-B8 and 1.40 Pa·s in C-B10) compared to the control sample of white chocolate (0.63 Pa·s). While the Casson yield stress values did not differ significantly between samples C-B8 and C-B10, the value of Casson viscosity was significantly (p < 0.05) higher in sample C-B10 compared to sample C-B8. The lubricating effect of the cocoa butter and lecithin affects the flow behavior of white chocolate, decreasing its viscosity [38], whereas reducing the fat content in chocolate causes a significant increase in chocolate viscosity [39]. Additionally, increasing solid concentration in chocolate results in higher viscosity and yield stress because of interactions between the suspended particles and increased surface area of the particles in contact with cocoa butter [40]. Accordingly, the increase in viscosity occurred since the amount of cocoa butter and milk fat decreased in chocolate samples with increasing amounts of B. An investigation by Baycar et al. [25] also showed significant but tolerable changes in increasing yield stress and viscosity in the white spread and compound chocolate samples with black carrot extract. On the other hand, in another investigation, encapsulated pomegranate extract reduced the Casson yield stress while it also increased the Casson viscosity of fortified white chocolate [5]. Our previous research [10,23] also showed the increase in Casson viscosity with the addition of blackberry juice and green tea extract encapsulated in maltodextrins.
Table 2.
Textural and thermal properties of chocolates.
3.2. The Impact of Encapsulates on Textural and Thermal Properties of Chocolates
In addition to particle size distribution and rheological measurements, differential scanning calorimetry (DSC) has also been used to study the melting characteristics of chocolates produced with supplements or processed under different conditions [36]. The DSC parameters, onset temperature (Tonset), peak temperature (Tpeak), and conclusion temperature (Tend), are presented in Table 2.
The addition of 8% of B to white chocolate did not have a statistically significant influence on the Tonset of enriched chocolates, while the addition of 10% of B significantly (p < 0.05) decreased the Tonset value of C-B10. This sample started to melt earlier, probably due to the lower fat phase content and the highest encapsulates content. Didar [5] showed that encapsulated pomegranate extract decreased the Tonset and Tpeak values of fortified white chocolate. However, there was no significant effect of both amounts of B on the Tpeak and Tend values in enriched chocolates.
While the course of DSC melting curves of chocolates depends on numerous factors such as the presence and quality of the fat phase, the amount of sugar, emulsifiers and particle size distribution in chocolate, the texture of the chocolate is a combination of triglyceride packing structures (polymorphs), microstructural properties, dispersed particulates, particle size distribution, and solid fat content (SFC), as well as the ratio of solid to liquid fat in a product [41]. The addition of 8% of B to white chocolate did not significantly affect the hardness of C-B8, while 10% of B significantly (p < 0.05) lowered the hardness of C-B10 due to the reduction in the amount of fat phase in that sample.
3.3. The Impact of Encapsulates on Color of Chocolate Samples
In recent years, the official rules of the European Union (EU) and the United States have restricted the use of synthetic colorants (especially red ones) as food additives because of their potential adverse health effects [42]. Baycar et al. [43] used betalains and beetroot powder in the production of white compound chocolate and chocolate spread as a source of bioactive components and coloring effects.
The blueberry juice encapsulated in whey as a natural colorant, changed the color of fortified white chocolates. The photograph of chocolates, indicating the impact of 8% and 10% of B on their color, is presented in Figure 2. Enriched chocolates have a purple color and the color intensity increases with increasing amounts of encapsulates. Figure 2 also represents the values of lightness (L*), a* (red tone), and b* (yellow tone) measured on the surface of B and its further influence on the surface color of enriched chocolates. The control sample of white chocolate has significantly (p < 0.05) higher L* and b* values compared to C-B8 and C-B10, indicating the bright surface with a high share of a yellow tone on the chocolate surface. At the same time, C has significantly (p < 0.05) the lowest a* value on its surface, where a negative value indicates the presence of green tones. Enriched chocolates have negative values of b*, or the presence of blue tones on their surface, significantly (p < 0.05) more pronounced in samples C-B8. The addition of both amounts of B to white chocolate influenced the increase in a* tone values on C-B8 and C-B10 whose values do not differ significantly between each other but differ significantly (p < 0.05) compared to B and C.
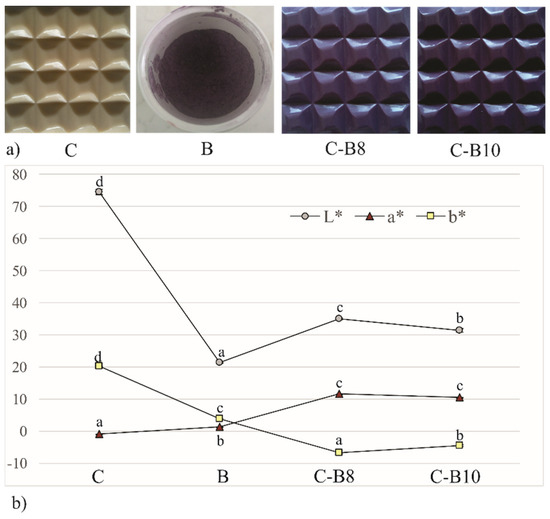
Figure 2.
(a) The photograph and (b) color of white chocolate (C), blueberry encapsulates (B) and enriched chocolates C-B8 and C-B10. Values represent average of triplicates ± SD. Means with different letters (a, b, c, and d) for each parameter are significantly different (p < 0.05).
3.4. The Impact of Encapsulates on the Chemical Composition of Chocolate Samples
The basic chemical composition, total polyphenol content, and antioxidant capacity in chocolate samples are presented in Table 3.
Table 3.
Basic chemical composition, polyphenol content, and antioxidant capacity of chocolates.
The addition of 8% and 10% of blueberry juice encapsulated in whey to white chocolate significantly (p < 0.05) increased the moisture content in fortified chocolates, where the values for C-B8 and C-B10 did not significantly differ. The protein content was also significantly (p < 0.05) increased from 5.94% in C to 6.11% in C-B8 and 6.24% in C-B10, with a statistically significant difference (p < 0.05) between the values for C-B8 and C-B10. It was expected that the protein content would increase to a greater extent; however, it did not happen, probably because the addition of encapsulates also reduced the share of milk powder in enriched chocolates, which are also rich with proteins. On the other hand, C had significantly (p < 0.05) higher content of total fats (37.58%) compared to enriched chocolates, while C-B10 had significantly (p < 0.05) lower fat content (35.76%). The addition of 8% and 10% of B to white chocolate significantly (p < 0.05) increased the content of total dietary fiber in both enriched chocolates; however, there was no significant difference between the values in fortified chocolates (1.38% in C-B8 and 1.48% in C-B10). However, research conducted by our team [44] showed that the dietary fiber content in white chocolate could be increased up to 9.76% using 15% of resistant starch in the raw composition of white chocolate. Both amounts of B significantly (p < 0.05) reduced the values of carbohydrates, where C-B8 had significantly (p < 0.05) lower value (53.26%).
3.5. The Impact of Encapsulates on Total Polyphenol Content and Antioxidant Capacity of Chocolates
Following the addition of the blueberry encapsulate to the chocolate samples, polyphenol contents and antioxidant capacity increased with the increase in the encapsulate amount. Similar to our previous research [10,23], where the polyphenol content of white chocolate was increased with the addition of blackberry juice and green tea extract encapsulated in maltodextrins, the addition of blueberry juice encapsulated in whey significantly (p < 0.05) increased the polyphenol content and antioxidant capacity of enriched chocolates compared to white chocolate, where the values of polyphenol content and antioxidant capacity of C-B10 significantly (p < 0.05) differed from the values of C-B8. While the polyphenol content in C-B10 (1.10 g GAE kg−1) was increased 2.7 times compared to white chocolate (0.41 g GAE kg−1), the antioxidant capacity (6.31 mmol TE kg−1) was increased 5.2 times. The research of Kaur et al. [45] also showed that the addition of up to 3% raspberry and blueberry extract significantly increased the antioxidant potential (DPPH-radical scavenging and total-phenolic content), lipid oxidative stability, and the microbial and sensory quality of calcium and chicken protein fortified milk chocolate.
3.6. The Impact of Encapsulates on Oxidation Stability of Chocolate Samples
The impact of both amounts of B on the oxidation stability of fortified white chocolates is presented in Figure 3.
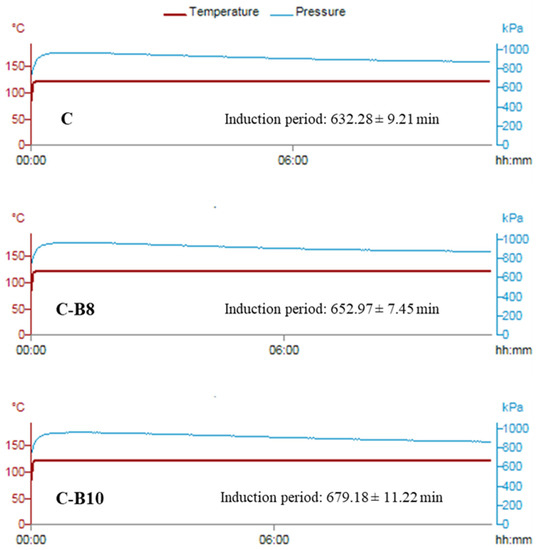
Figure 3.
Oxidation stability of chocolates.
All chocolate samples had good oxidation stability, given the fact that cacao butter contains a low content of unsaturated fatty acids and a high content of natural antioxidants [46]. With the addition of 8% and 10% of encapsulated blueberry juice in whey, the induction period of enriched chocolates was additionally increased from 632.28 min in C to 652.97 min in C-B8 and 679.18 min in C-B10. The statistically significantly different (p < 0.05) increase in oxidation stability between chocolate samples probably occurred due to the increase in the content of polyphenols with the addition of encapsulates in white chocolate.
3.7. The Impact of Encapsulates on Sensory Evaluation of Chocolate Samples
The influence of blueberry juice encapsulated in whey on the sensory characteristics of fortified white chocolates C-B8 and C-B10 is presented in Figure 4.
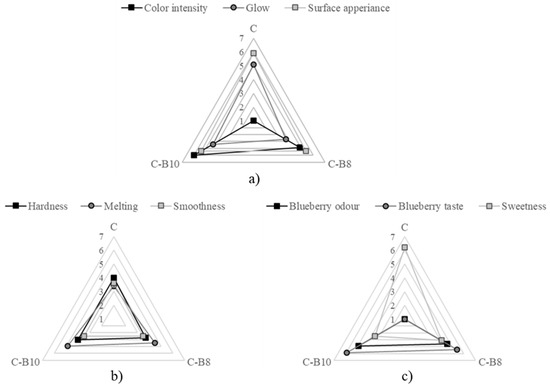
Figure 4.
Sensory characteristics of chocolates (1 = the least intensity and 7 = the most intensity): (a) appearance, (b) texture, and (c) aroma.
The addition of B affected the chocolate’s appearance in terms of color; however, it did not adversely affect the appearance of the chocolate. All samples were free of damage and bubbles. The samples had a purple color, and the intensity significantly (p < 0.05) increased with a higher amount of encapsulates.
The sensory panelists did not notice significant differences in the chocolate hardness. The sample C-B10 had the fastest melting in the mouth when consumed, while the addition of both amounts of B did not affect the smoothness significantly.
The addition of both amounts of B to white chocolate had a significant impact (p < 0.05) on the chocolate aroma. The intensity of blueberry odor and taste increased (not significantly) with a higher amount of B. On the other hand, the intensity of sweetness significantly (p < 0.05) decreased with both amounts of B, where the sample C-B10 had significantly (p < 0.05) lower sweetness compared to C and C-B8.
4. Conclusions
The addition of 8% and 10% of blueberry juice encapsulated in whey to white chocolate significantly (p < 0.05) increased the content of proteins and total dietary fiber and significantly (p < 0.05) reduced total fats in enriched chocolates. Both amounts of encapsulates significantly (p < 0.05) reduced the value of the volume-weighted mean in enriched chocolates C-B8 and C-B10 and significantly (p < 0.05) increased Casson yield stress and Casson viscosity in accordance with the added amount. However, the increase in viscosity did not cause a major problem when dosing the chocolate mass into the molds. Encapsulates did not significantly affect the melting peak in C-B8 and C-B10 and significantly (p < 0.05) lowered the hardness in C-B10. Total polyphenols content and antioxidant capacity in enriched chocolates were significantly (p < 0.05) increased compared to white chocolate (up to 2.7-fold improvement of phenolic content and up to 5.2-fold increase in antioxidant activity). Oxidative stability was also significantly (p < 0.05) increased in fortified white chocolates in accordance with the added amount of blueberry juice encapsulated in whey. Blueberry juice encapsulated in whey did not impair the sensory characteristics of enriched chocolates; moreover, it reduced the sweetness of white chocolate and contributed to the pleasant blueberry flavor.
Author Contributions
Conceptualization: I.L., P.J., A.F. and B.P.; methodology: I.L., P.J., J.P. and A.L.; software: A.J.; formal analysis: I.L., V.T.Š. and J.P.; investigation: I.L., J.P. and V.T.Š.; data curation: Đ.A. and D.Z.; writing—original draft preparation: I.L., V.T.Š. and A.F.; writing—review and editing: I.L., A.L. and A.J.; visualization: B.P.; supervision: B.P. and D.Z. All authors have read and agreed to the published version of the manuscript.
Funding
This research received no external funding.
Institutional Review Board Statement
Ethical review and approval were waived for this study since the participation was voluntary. All data were anonymous.
Informed Consent Statement
Informed consent was obtained for from all subjects involved in the study.
Data Availability Statement
Data are contained within the article.
Acknowledgments
This research was supported by the Ministry of Education, Science, and Technological Development, Republic of Serbia program (451-03-9/2022-14/200134).
Conflicts of Interest
The authors declare no conflict of interest.
References
- Afoakwa, E.O.; Paterson, A.; Fowler, M. Factors influencing rheological and textural qualities in chocolate—A review. Trends Food Sci. Technol. 2007, 18, 290–298. [Google Scholar] [CrossRef]
- Shiina, Y.; Funabashi, N.; Lee, K.; Murayama, T.; Nakamura, K.; Wakatsuki, Y.; Daimon, M.; Komuro, I. Acute effect of oral flavonoid-rich dark chocolate intake on coronary circulation, as compared with non-flavonoid white chocolate, by transthoracic Doppler echocardiography in healthy adults. Int. J. Cardiol. 2009, 131, 424–429. [Google Scholar] [CrossRef] [PubMed]
- Ndhlala, A.; Chitindingu, K.; Mupure, C.; Murenje, T.; Ndhlala, F.; Benhura, M.A.; Muchuweti, M. Antioxidant properties of methanolic extracts from Diospyros mespiliformis (jackal berry), Flacourtia indica (Batoka plum), Uapaca kirkiana (wild loquat) and Ziziphus mauritiana (yellow berry) fruits. Int. J. Food Sci. Technol. 2008, 43, 284–288. [Google Scholar] [CrossRef]
- Muhammad, D.R.A.; Tuenter, E.; Darma Patria, G.; Foubert, K.; Pieters, L.; Dewettinck, K. Phytochemical composition and antioxidant activity of Cinnamomum burmannii Blume extracts and their potential application in white chocolate. Food Chem. 2021, 340, 127983. [Google Scholar] [CrossRef] [PubMed]
- Didar, Z. Characterization of White Chocolate Enriched with Free or Encapsulated Pomegranate Extract. J. Nutr. Fast. Health 2020, 8, 302–309. [Google Scholar]
- Altınok, E.; Kurultay, S.; Konar, N.; Toker, O.S.; Kopuk, B.; Gunes, R.; Palabiyik, I. Utilising grape juice processing by-products as bulking and colouring agent in white chocolate. Int. J. Food Sci. Technol. 2022, 57, 4119–4128. [Google Scholar] [CrossRef]
- Stevenson, D.; Scalzo, J. Anthocyanin composition and content of blueberries from around the world. J. Berry Res. 2012, 2, 179–189. [Google Scholar] [CrossRef]
- Chiabrando, V.; Giacalone, G. Anthocyanins, phenolics and antioxidant capacity after fresh storage of blueberry treated with edible coatings. Int. J. Food Sci. Nutr. 2015, 66, 248–253. [Google Scholar] [CrossRef]
- Li, J.; Wang, B.; He, Y.; Wen, L.; Nan, H.; Zheng, F.; Liu, H.; Lu, S.; Wu, M.; Zhang, H. A review of the interaction between anthocyanins and proteins. Food Sci. Technol. Int. 2020, 27, 470–482. [Google Scholar] [CrossRef]
- Lončarević, I.; Pajin, B.; Fišteš, A.; Tumbas Šaponjac, V.; Petrović, J.; Jovanović, P.; Vulić, J.; Zarić, D. Enrichment of white chocolate with blackberry juice encapsulate: Impact on physical properties, sensory characteristics and polyphenol content. LWT—Food Sci. Technol. 2018, 92, 458–464. [Google Scholar] [CrossRef]
- Madene, A.; Jacquot, M.; Scher, J.; Desobry, S. Flavour encapsulation and controlled release—A review. Int. J. Food Sci. Technol. 2006, 4, 1–21. [Google Scholar] [CrossRef]
- Lang, Y.; Li, B.; Gong, E.; Shu, C.; Si, X.; Gao, N.; Zhang, W.; Cui, H.; Meng, X. Effects of α-casein and β-casein on the stability, antioxidant activity and bioaccessibility of blueberry anthocyanins with an in vitro simulated digestion. Food Chem. 2021, 334, 127526. [Google Scholar] [CrossRef]
- Zhang, Z.; Chou, S.; Tian, J.; Lang, Y.; Shen, Y.; Ran, X.; Gao, N.; Li, B. Effect of whey protein isolate on the stability and antioxidant capacity of blueberry anthocyanins: A mechanistic and in vitro simulation study. Food Chem. 2021, 336, 127700. [Google Scholar] [CrossRef]
- Chung, C.; Rojanasasithara, T.; Mutilangi, W.; McClements, D.J. Enhanced stability of anthocyanins-based color in model beverage systems through whey protein isolate complexation. Food Res. Int. 2015, 76, 761–768. [Google Scholar] [CrossRef]
- He, Z.; Zhu, H.; Xu, M.; Zeng, M.; Qin, F.; Chen, J. Complexation of bovine beta-lactoglobulin with malvidin-3-O-glucoside and its effect on the stability of grape skin anthocyanin extracts. Food Chem. 2016, 209, 234–240. [Google Scholar] [CrossRef]
- Lang, Y.X.; Li, E.H.; Meng, X.J.; Tian, J.L.; Ran, X.L.; Zhang, Y.; Zang, Z.; Wang, W.; Li, B. Protective effects of bovine serum albumin on blueberry anthocyanins under illumination conditions and their mechanism analysis. Food Res. Int. 2019, 122, 487–495. [Google Scholar] [CrossRef]
- Dinika, I.; Utama, G.L. Cheese whey as potential resource for antimicrobial edible film and active packaging production. Foods Raw Mater. 2019, 7, 229–239. [Google Scholar]
- Zandona, E.; Blažić, M.; Režek Jambrak, A. Whey Utilization: Sustainable Uses and Environmental Approach. Food Technol. Biotechnol. 2021, 59, 147–161. [Google Scholar] [CrossRef]
- CaDiGroup Farmaceutici, CaDicioc: The Only “Functional Chocolate” that Combines the Beneficial Properties of Glucomannan Fiber (Type E425) with Those of Cocoa. Available online: http://cadigroup.eu/en/chi-siamo-cadigroup/ (accessed on 5 May 2011).
- Defense Nutrition. Whey Chocolate. Available online: http://www.defensenutrition.com/whey_chocolate_bites (accessed on 5 May 2011).
- Glaberson, H. New Multi-Vitamin Dark Chocolate Range. [News Headlines]. Available online: http://www.confectionerynews.com/Markets/New-multi-vitamin-dark-chocolate-range (accessed on 5 May 2011).
- Belščak-Cvitanović, A.; Komes, D.; Benoković, M.; Karlović, S.; Hečimović, I.; Ježek, D.; Bauman, I. Innovative formulations of chocolates enriched with plant polyphenols from Rubus idaeus L. leaves and characterization of their physical, bioactive and sensory properties. Food Res. Int. 2012, 48, 820–830. [Google Scholar] [CrossRef]
- Lončarević, I.; Pajin, B.; Tumbas Šaponjac, V.; Petrović, J.; Vulić, J.; Fišteš, A.; Jovanović, P. Physical, sensorial and bioactive characteristics of white chocolate with encapsulated green tea extract. J. Sci. Food Agric. 2019, 99, 5834–5841. [Google Scholar] [CrossRef]
- IOCCC. Viscosity of Cocoa and Chocolate Products. Anal. Method 2000, 46, 1–7. [Google Scholar]
- Baycar, A.; Konar, N.; Poyrazoglu, E.S.; Goktas, H.; Sagdic, O. Using white spread and compound chocolate as phenolic compound delivering agent: A model study with black carrot extract. J. Food Process. Preserv. 2021, 45, e15392. [Google Scholar] [CrossRef]
- ISO 8586; Sensory analysis—General Guidelines for the Selection, Training and Monitoring of Selected Assessors and Expert Sensory Assessors. ISO: Geneva, Switzerland, 2012.
- ISO 8589; Sensory Analysis-General Guidance for the Design of Test Rooms. ISO: Geneva, Switzerland, 2007.
- ISO 5492; Sensory Analysis—Vocabulary. ISO: Geneva, Switzerland, 2008.
- ISO 4121; Sensory Analysis—Methodology—Evaluation of Food Product by Methods of Using Scales. ISO: Geneva, Switzerland, 2002.
- AOAC—Association of Official Analytical Chemists. International, Official Methods of Analysis of the Association of Official Analytical Hemists International, 17th ed.; Association of Official Analytical Communities: Gaithersburg, MD, USA, 2000. [Google Scholar]
- Kassegn, H.H. Determination of proximate composition and bioactive compounds of the Abyssinian purple wheat. Cogent Food Agric. 2018, 4, 1421415. [Google Scholar] [CrossRef]
- Belščak-Cvitanović, A.; Komes, D.; Dujmović, M.; Karlović, S.; Biškić, M.; Brnčić, M.; Ježek, D. Physical, bioactive andsensory quality parameters of reduced sugar chocolates formulated with natural sweeteners as sucrose alternatives. Food Chem. 2015, 167, 61–70. [Google Scholar] [CrossRef]
- González-Molina, E.; Moreno, D.A.; García-Viguera, C. Genotype and harvest time influence the phytochemical quality of Fino lemon juice (Citrus limon (L.) Burm. F.) for industrial use. J. Agric. Food Chem. 2008, 56, 1669–1675. [Google Scholar] [CrossRef] [PubMed]
- Girones-Vilaplana, A.; Mena, P.; Moreno, D.A.; Garcia-Viguera, C. Evaluation of sensorial, phytochemical and biological properties of new isotonic beverages enrichedwith lemon and berries during shelf life. J. Sci. Food Agric. 2014, 94, 1090–1100. [Google Scholar] [CrossRef]
- Anton Paar. RapidOxy 100—Oxidation Stability of Cocoa Mass and Vanilla Extracts. Relevant for: Food Industry; Anton Paar: Graz, Austria, 2022. [Google Scholar]
- Afoakwa, E.O.; Paterson, A.; Fowler, M. Effects of particle size distribution and composition on rheological properties of dark chocolate. Eur. Food Res. Technol. 2008, 226, 1259–1268. [Google Scholar] [CrossRef]
- Bolenz, S.; Manske, A. Impact of fat content during grinding on particle size distribution and flow properties of milk chocolate. Eur. Food Res. Technol. 2013, 236, 863–872. [Google Scholar] [CrossRef]
- Glicerina, V.; Balestra, F.; Dalla Rosa, M.; Romani, S. Microstructural and Rheological Properties of White Chocolate During Processing. Food Bioprocess Technol. 2015, 8, 770–776. [Google Scholar] [CrossRef]
- Do, T.A.; Hargreaves, J.M.; Wolf, B.; Hort, J.; Mitchell, J.R. Impact of particle size distribution on rheological and textural properties of chocolate models with reduced fat content. J. Food Sci. 2007, 72, E541–E552. [Google Scholar] [CrossRef]
- Sokmen, A.; Gunes, G. Influence of some bulk sweeteners on rheological properties of chocolate. LWT—Food Sci. Technol. 2006, 39, 1053–1058. [Google Scholar] [CrossRef]
- Ostrowska-Ligęza, E.; Marzec, A.; Górska, A.; Wirkowska-Wojdyła, M.; Bryś, J.; Rejch, A.; Czarkowska, K. A comparative study of thermal and textural properties of milk, white and dark chocolates. Thermochim. Acta 2019, 671, 69. [Google Scholar] [CrossRef]
- Robert, P.; Frides, C. The Encapsulation of Anthocyanins from Berry-Type Fruits. Trends in Foods. Molecules 2015, 20, 5875–5888. [Google Scholar] [CrossRef]
- Baycar, A.; Nevzat, K.; Goktas, H.; Sagdic, O.; Polat, D.G. The effects of beetroot powder as a colorant on the color stability and product quality of white compound chocolate and chocolate spread. Food Sci. Technol. Camp. 2022, 42, e66220. [Google Scholar] [CrossRef]
- Lončarević, I.; Pajin, B.; Petrović, J.; Nikolić, I.; Maravić, N.; Ačkar, Ð.; Šubarić, D.; Zarić, D.; Miličević, B. White Chocolate with Resistant Starch: Impact on Physical Properties, Dietary Fiber Content and Sensory Characteristics. Molecules 2021, 26, 5908. [Google Scholar] [CrossRef]
- Kaur, M.; Kumar, S.; Fayaz Bhat, Z.; Naqvi, Z.; Jayawardena, R. The impact of raspberry and blueberry extract on the microbial and lipid oxidative stability of calcium and chicken protein fortified composite chocolate. J. Food Process. Preserv. 2022, 46, e16216. [Google Scholar] [CrossRef]
- Servent, A.; Boulanger, R.; Davrieux, F.; Pinot, M.N.; Tardan, E.; Forestier-Chiron, N.; Hue, C. Assessment of cocoa (Theobroma cacao L.) butter content and composition throughout fermentations. Food Res. Int. 2018, 107, 675–682. [Google Scholar] [CrossRef]


Publisher’s Note: MDPI stays neutral with regard to jurisdictional claims in published maps and institutional affiliations. |
© 2022 by the authors. Licensee MDPI, Basel, Switzerland. This article is an open access article distributed under the terms and conditions of the Creative Commons Attribution (CC BY) license (https://creativecommons.org/licenses/by/4.0/).