1. Introduction
In 2015, 196 countries adopted a new climate treaty:the Paris Agreement. This treaty provides guidelines for global efforts in addressing climate change [
1]. Since then, more and more countries have paid increasing attention to reducing carbon emissions, and some countries have introduced policies to promote the use of zero-carbon or low-carbon energy [
2,
3,
4]. Thus, there have been some changes in the global energy mix in recent years. In 2019, the share of natural gas and renewable energy increased significantly, and their growth accounts for three quarters of the growth in global energy consumption [
5]. In the share of electricity generation, renewables also provided the largest increment, and its shares rose to record levels. Among them, the share of solar energy in renewable energy generation has also been increasing, from 14% five years ago to 26% now. Photovoltaic (PV) energy is a type of solar energy, which is widely used due to its low cost and ease of installation.
Under economic globalization, the PV industry has formed a globalized industrial chain. In order to balance supply and demand, PV trade activities are carried out between countries. This forms a complex global trading system. However, many factors in recent years, such as international disputes [
6], have led to a complex international trade environment, which, together with the continued impact of the epidemic, has made the global PV industry more challenging. To strengthen cooperation between countries and promote the healthy and orderly development of the global PV industry, it is necessary to make an effective measurement of the current global PV trade pattern and its evolution features, as well as to explore the potential influencing factors. At the same time, many uncertainties can affect the trade of some countries (e.g., epidemics), which may have an impact on the global PV industry chain. To prevent the spread of local risks to the global level through international trade, it is necessary to identify the key countries and measure the cascade process of risk propagation in the PV trade system, to improve the response capacity of countries to the risks.
Accordingly, this paper studies the global PV trade from a complex network perspective. Firstly, we establish the global PV trade networks from 2000 to 2021. Secondly, we analyze the evolutionary features of the global PV trade network structure from several aspects. We then use the QAP method to explore the impact factors on the global PV trade network structure. Finally, we simulate the cascading process of risk propagation on the PV trade network based on the improved bootstrap percolation model.
2. Literature Review
For the study of global PV trade, some scholars have analyzed international disputes [
6], product competitive advantage [
7], and related policies [
8] from the perspective of traditional international trade study. However, international trade is a complex system with more countries involved. In the context of economic globalization, countries are trading more and more closely, and it is difficult to explain the overall pattern and evolution features of the trading system by analyzing the individual countries one by one. The complex network is an analytical method used to determine the interrelationships between individuals, which can provide different perspectives of the complex phenomenon of the trading system. Serrano et al. applied the complex network approach to the study of international trade and determined that the trade network has characteristics including small-world property and high-clustering coefficients [
9]. Geng et al. used the minimum spanning tree model to analyze the degree of integration in the international natural gas market [
10]. Duan et al. used the quadratic assignment procedure model to explore the driving factors of the global grain network [
11]. Yu et al. used the temporal exponential random graph model (TERGM) to analyze the influencing factors and evolution of the global rare earth trade [
12]. Liu et al. used complex networks and link prediction methods to predict the trends of trade structure and the global pattern of waste plastic by 2030 [
13]. Hao et al. constructed the steel international trade multiplex network and studied the supply risk transmission mechanism [
14].
Many scholars have also applied the complex network approach to the study of global PV trade. Guan et al. built the corresponding PV trade network and measured the role of each country in the network [
15]. They also compared the preferences of different energy commodities in their selection of trade partners [
16] and analyzed the impact of the local market on global PV trade under different patterns [
17]. Furthermore, they have introduced link prediction methods to identify countries with trade preferences [
16,
17]. Fu et al. compared the spatial and community structures of various renewable energy trade networks including PV [
18]. Wang et al. analyzed trade characteristics and competitive patterns from a static perspective and explored risk propagation on PV trade networks from a dynamic perspective based on the epidemic diseases model [
19]. In summary, previous research has touched on the topological characteristics of the global PV trade network, and this paper performs further analysis of the evolutionary features of the overall structure, individual importance, and community structure of the network using innovative methods. In addition, as global PV trade is a complex system with multiple actors involved, it may be influenced by many factors. While previous studies mainly focus on the influence of the network’s motifs on the overall trade network structure [
17], in this paper, the QAP method is applied to explore the potential impact factors of the PV trade network structure. It considers that the global PV trade network structure may be influenced by a country’s attributes, such as economic size and geographical location.
Furthermore, because of the current severe global epidemic impact, some countries may suspend or reduce their trade activities, which may lead to a chain of negative consequences worldwide, especially for PV trade—as a mature worldwide industry, the impact may be worse. Therefore, the cascade process of risk propagation in the PV trade system needs to be analyzed. For risk propagation, the epidemic diseases models (e.g., SIS, SIR, etc.) are commonly used analysis methods, and previous scholars have made some analyses on risk propagation on global PV trade networks based on this type of model [
19]. However, risk propagation between countries is not determined by probability, but by the risk when it exceeds certain conditions; this can be simulated by the bootstrap percolation model [
20]. Several scholars have applied this model to the study of international trade [
20,
21,
22] and proved the validity of the model. In this paper, we improve the bootstrap percolation model for the characteristics of the PV industry and simulate the cascading process of risk propagation on the global PV trade network from two perspectives: supply interruption and demand interruption.
3. Data Sources and Network Establishment
The PV trade data used in this paper are from the United Nations Commodity Trade Database (UN Comtrade) which contains all annual data for 215 countries and areas (hereinafter collectively referred to as countries) for the years 2000 to 2021, and the HS code for PV products is 854,140. For the trade flow from country to country , reported by as an export to (), and by as an import from (). For some objective reasons they are not equal, and this paper used the larger one as the trade flow which is represented by .
The classical method is applied to establish the global PV trade networks (PVTN) from 2000 to 2021. The nodes of the network are the individual countries, and the edges are the PV trade flows between countries. The network can be represented as:
where
4. The Evolution Features of the Global PV Trade Network Structure
This section analyzes the evolutionary features of the global PV trade network structure, which includes the overall network structure, node importance, and network community structure.
4.1. Methodology for Network Feature Analysis
4.1.1. Overall Network Structure
(a) Density
The density reflects the degree of development of the PV trade. The higher the numerical value, the more developed the trade. The equation is as follows [
23]:
where
is the density of the network,
is the number of edges in network, which represents the number of actual trade relations, and
is the number of nodes in the network.
(b) Reciprocity
Reciprocity indicates the ratio of two-way trade to all trade. The equation is as follows [
24]:
where
is the reciprocity of the network and
is the number of edges that have opposite edges.
(c) Average clustering coefficient
The clustering coefficient indicates the ratio of a country’s trading partners that have trade relations with each other. For the directed network, the equation is as follows [
23]:
where
is the clustering coefficient of node
,
is the number of directed triangles which go through
,
is the number of all the edges of
, and
is the number of two-way edges of
. The average clustering coefficient is the average of this indicator of all nodes, which indicates the degree of trades clustering. The higher the numerical value, the higher the degree of clustering.
(d) Average distance
The average distance represents the average of the distances between any two nodes in the network [
23] and represents the efficiency of commodity transfer in international trade networks. The smaller the numerical value, the higher the transfer efficiency.
4.1.2. Nodes Importance
(a) Degree centrality
The degree centrality reflects the number of trade relations in a country. In this paper, we analyze the export and import aspects, respectively. The out-degree centrality reflects the size of the country’s export market; the larger the value, the wider the export market. In-degree centrality reflects the degree of import diversification of the country; the larger the value, the more sources of imports. The equations are as follows [
23]:
Where and denote the out-degree centrality and in-degree centrality of node , respectively, and and denote the number of outgoing edges and incoming edges of node , respectively.
(b) Strength
The strength reflects the trade values of a country. In this paper, we analyze the export and import aspects, respectively. The out-strength reflects a country’s export trade values. In-strength reflects a country’s import trade values. The equations are as follows [
23]:
where
and
denote the out-strength and in-strength of node
, respectively, which is calculated by the sum of the weight of outgoing edges and incoming edges of node
, respectively.
(c) Betweenness centrality
The betweenness centrality reflects the importance of a country as a bridge for trade. The equation is as follows [
23]:
where
denotes the betweenness centrality of node
,
denotes the number of the shortest path between nodes
and
, and
denotes the number of times that
lies in their shortest path.
4.1.3. The Community Structure of Network
Since the focus of this paper is a global PV trade system with many countries involved, it is difficult to analyze the evolutionary pattern of trade relations between countries one by one. Therefore, we use the community structure as a simplified representation of the global PV trade network, to identify the trade subgroups in the global PV trade system and analyze the role each one plays.
The block-model is one of the ways to explore the community structure of the network [
24], and the main methods of division are the hierarchical cluster method [
25,
26,
27] and the CONCOR method (convergence of iterated correlation) [
28,
29]. In this paper, we use the CONCOR method which iteratively computes the correlation coefficients of the network’s adjacency matrix to divide the network. Based on the division results, we construct the density matrix which represents the density of blocks. We then transform the density matrix to an image matrix by comparing the elements of the density matrix to the density of the network; those greater than the network density are defined as one and the others as zero. The image matrix represents the main trade relations between block members. By analyzing the changes of the image matrix over the years, we can understand the evolutionary features of the mid-level structure in the global PV trade network.
4.2. The Result of Network Feature Analysis
4.2.1. Overall Network Structure Analysis
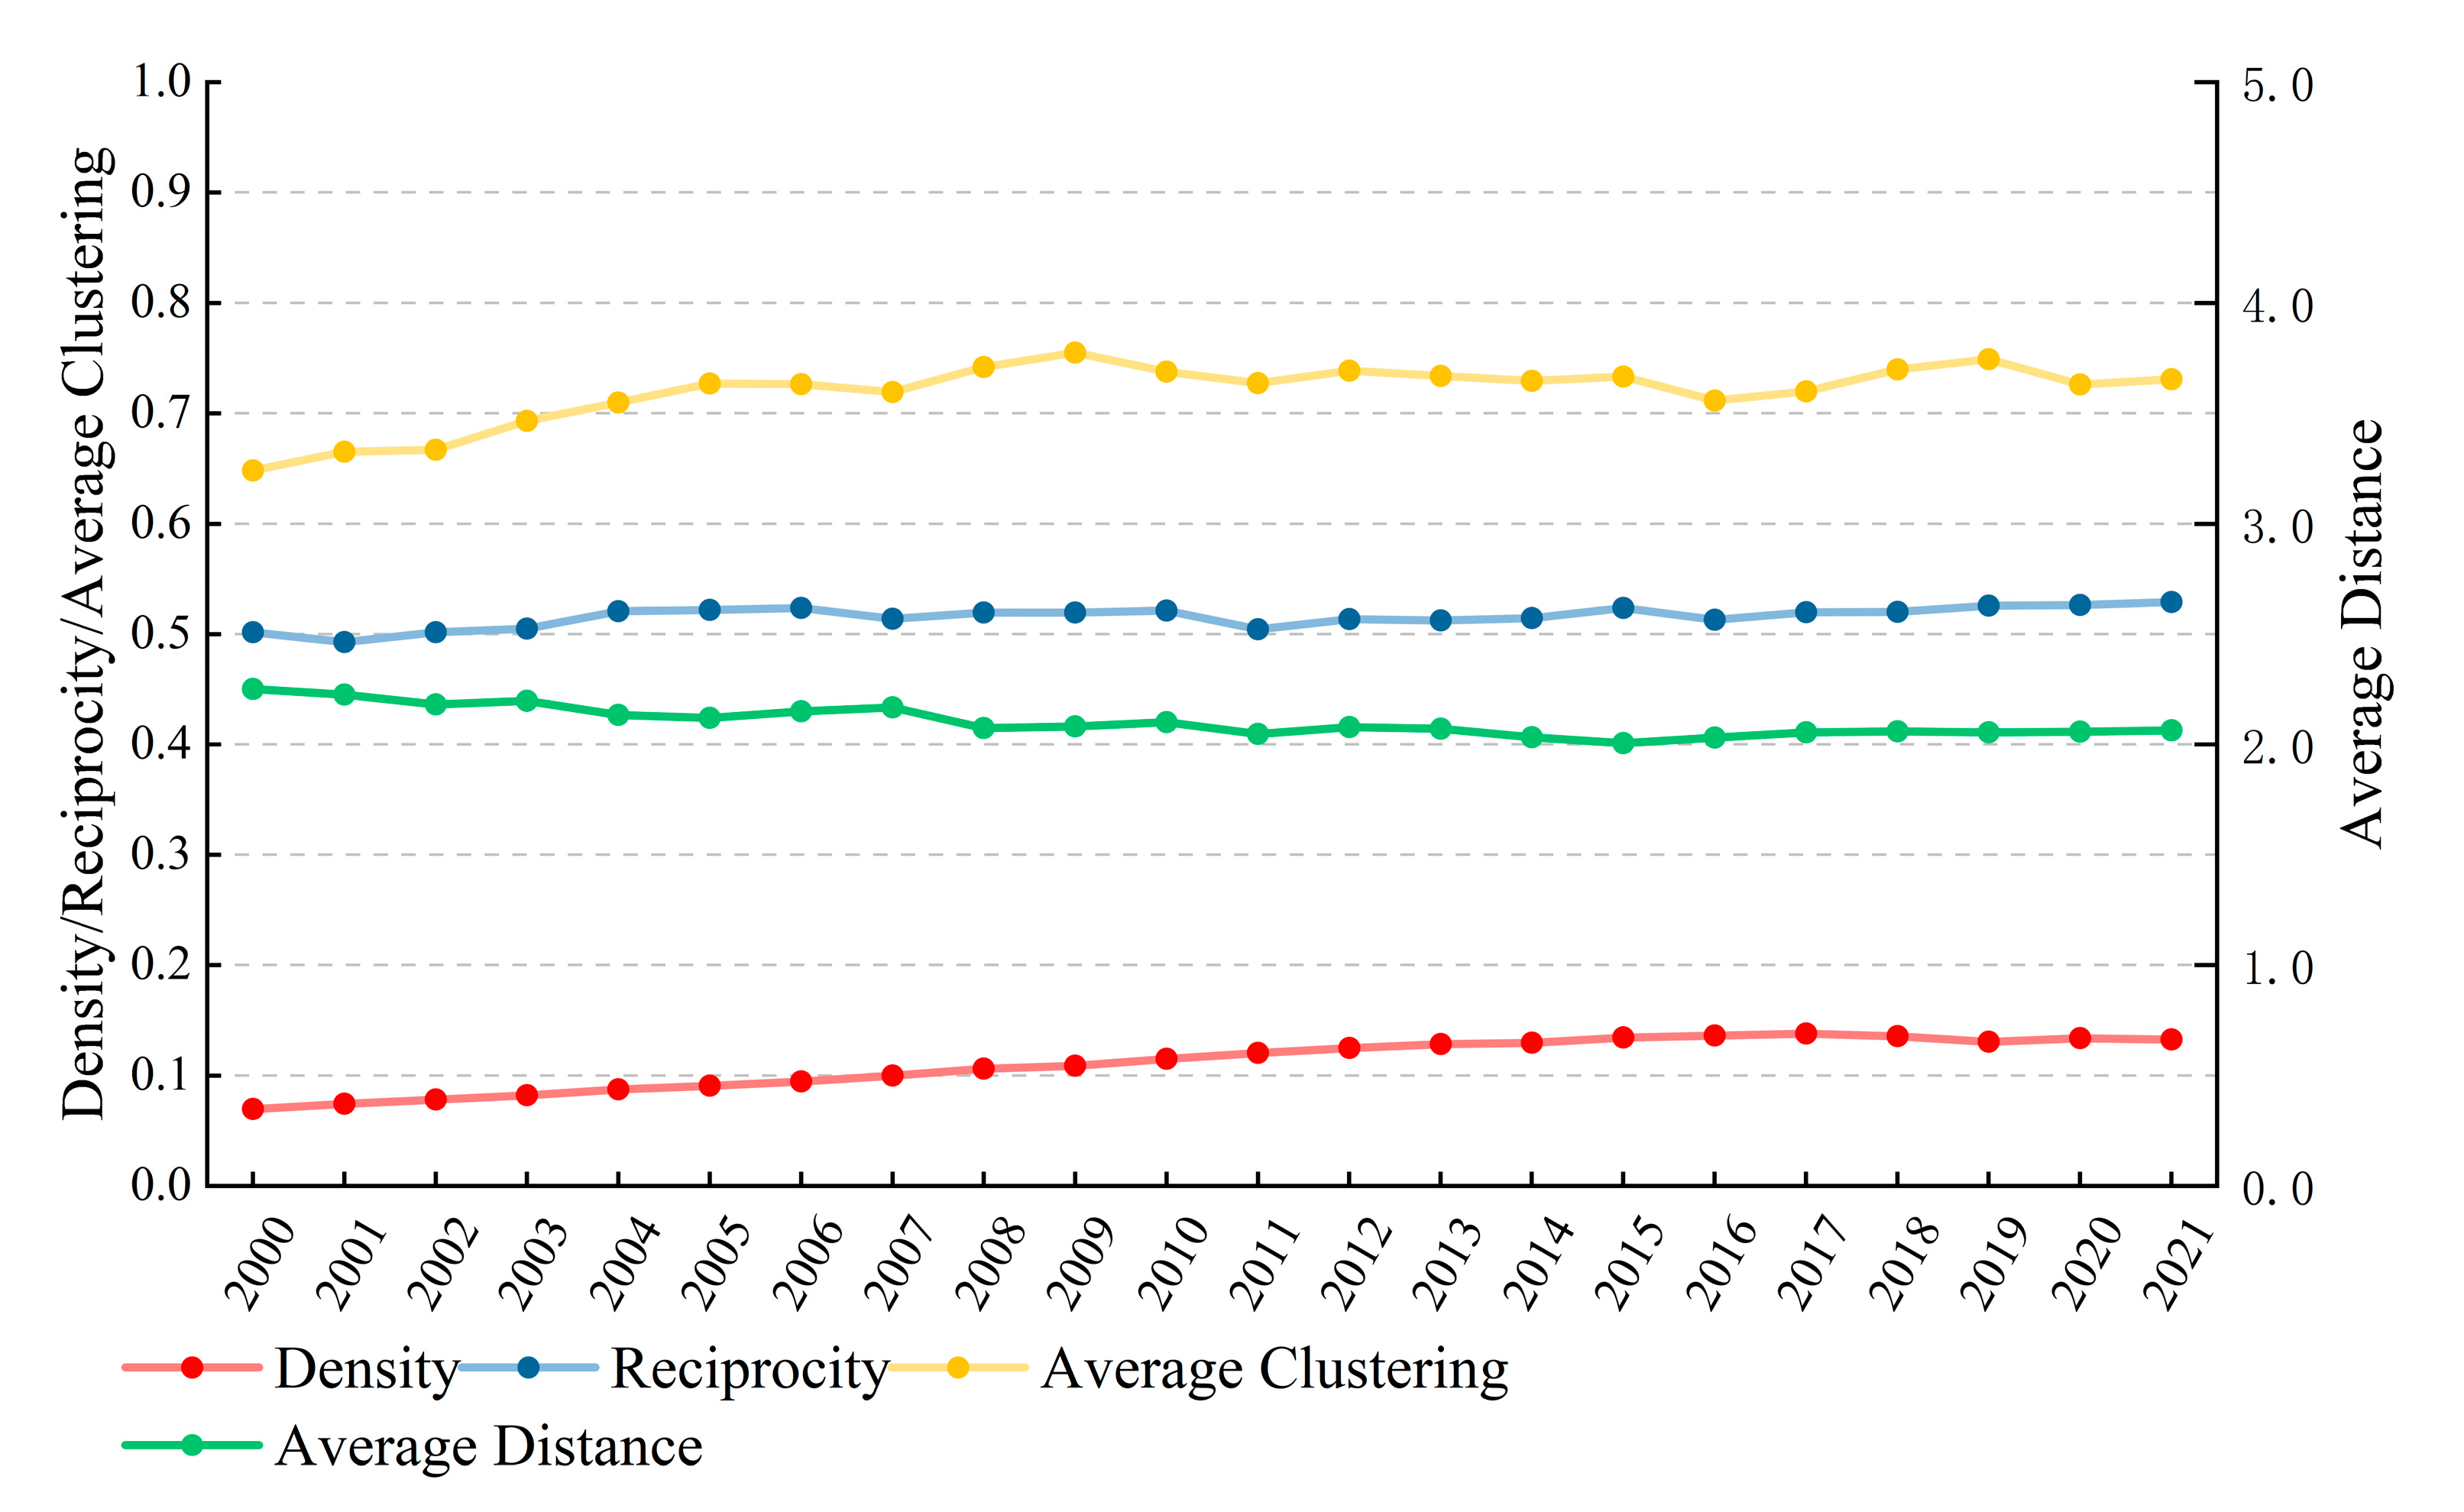
The results of the overall network structure analysis (see
Figure 1) show that the density has increased significantly, with a cumulative increase of 90%. This means that the scale of global PV trade is expanding, and the participation of countries continues to increase. However, it is still at a relatively low level as the maximum value is 0.138. Current trade relations are limited and there are huge development prospects. The reciprocity is relatively stable and half of the trade relations are two-way trade. The average clustering coefficient grows steadily and is currently at a high level, which indicates that the trade activities also exist between most of the cooperating countries involved in PV trade, and that PV trading activity tends to be clustered. The average distance is slowly decreasing, and the efficiency of commodity circulation is improving year by year. Remarkably, the average clustering coefficient is high, the average distance is small, and the global PV trade network presents obvious small-world characteristics.
4.2.2. Nodes Importance Analysis
The results of the nodes importance analysis are shown in
Figure 2,
Figure 3 and
Figure 4. For out-degree centrality, the values for many countries have been increasing since 2000. In 2021, China, Germany, and the U.S. all had an out-degree centrality greater than 0.7 and have relatively larger export markets, meaning their products have a strong competitive advantage. In Vietnam, due to lower production costs and the support of relevant policies, the out-degree centrality also shows a relatively significant rise, and its export markets continue to expand. For in-degree centrality, the values for many countries have also been increasing since 2000, indicating that countries continue to broaden their PV product import channels and safeguard PV product import diversification. Among them, countries such as Russia, Poland, and South Africa had a more significant rise. For out-strength, the top-ranking countries in 2021 were mostly Asian countries, occupying a larger share of the global PV export market. China’s out-strength has been increasing since 2007, and now occupies a relatively large share of exports, as its products have a greater competitive advantage. For in-strength, the values of many countries have increased year by year since 2000, indicating that the demand for PV products in each country has been increasing. Among them, Vietnam, Spain, Australia, and other countries have seen a more significant rise in recent years. For betweenness centrality, China and the U.S. ranked relatively high in 2021, which means they are relatively important intermediary countries. However, the values for intermediary centrality were low overall, and the network does not have significant intermediary nodes.
4.2.3. The Community Structure of Networks
The analysis results of the community structure of networks obtained by UCINET software (the maximum segmentation depth setting at two and other parameters using default values), and all countries were divided into four blocks. We selected the results with significant changes for the presentation. The density and image matrices for the corresponding years are shown in
Table 1, and the visualization of each block member and image matrix are shown in
Figure 5.
As the results show, in 2000, the global PV trade network did not form a clear community structure, and most of the countries involved in PV trade were divided into block four. Other countries were rarely involved in PV trade. As the PV industry was still in its early stages in 2000, countries attached less importance to PV production, and therefore trade relations were limited. After 2000, the number of countries involved in the PV trade gradually increased. In 2006, the global PV trade network formed a relatively simple community structure. Most African and Central Asian countries, as well as Malaysia and Laos, were classified into block three, and their main trade relations were imports from block four.
After 2006, the scale of global PV trade further expanded. From 2012 to the present, the global PV trade networks all show a clear core-periphery structure. Except for slight changes in the members of each block, the community structure of the network has generally remained stable. Taking 2019 as an example, Block 1 is the isolator as its members hardly participate in the PV trade. Block 2 is the receiver; most of its members are African countries that only have PV product demand, and their PV trade relations are relatively simple as the source of importing is largely Block 4. Block 3 is the broker; its members have both import demand and export capacity for PV products. They do not trade with each other and prime trading partners come from Block 4. Block 4 is the primary; in addition to trade relations with other blocks above, its members also have many trade relations with each other. Although it has the smallest number of members, it is involved in majority of trading activities. Most of its members are from North America, Asia, and Europe, where the best part of developed countries in the PV industry are located.
5. The Impact Factors of the Global PV Trade Network Structure
Considering that some factors, such as differences in economic size and geographical location of countries, may impact on international trade, we analyze the potential impact factors on the global PV trade network structure in this section.
This paper uses the unweighted PVTN and the weighted PVTN as dependent variables, respectively (i.e., exploring the effects of other independent variables on global PV trade relations and trade values between countries). Since the network data are not independent and the results of ordinary regression methods may be affected by multicollinearity, we use the QAP method (quadratic assignment procedure to randomize the rows or columns of the matrix in order for the regression results to be unbiased [
30]) for the purpose of analysis to calculate the regression relationship between the dependent variable matrix and the independent variable matrix and to evaluate the r-squared of significance.
5.1. Variable Selection and Model Construction
For the potential impact factors of the global PV trade network structure, we mainly consider the following aspects:
(a) Whether the countries belong to the same international economic organization
International economic organizations may have some influence on the trade preferences of their members [
31]. Considering that Europe is the region with the highest share of renewable energy generation [
5], and most of the countries are members of the European Union, we constructed the independent variable EU to determine whether there would be an impact on the global PV trade network structure if both countries belonged to the European Union. At the same time, considering that the establishment of the World Trade Organization has greatly impacted global trade, we constructed the corresponding independent variable WTO to determine whether there would be an impact on the global PV trade network structure if the two countries belonged the World Trade Organization.
(b) Difference in geographic location
The differences in the geographical location of countries may impact trade flows, trade costs, etc. We use the distance between two countries, and whether they are bordering each other, to measure the difference between geographical locations. Furthermore, we constructed the corresponding independent variables DIS and BOU to measure the impact of geographical location factors on the global PV trade network structure.
(c) Difference in economic development
This shows that in bilateral trade, the economic size of each country is positively correlated with the trade demand [
32]. We use each country’s Gross Domestic Product (GDP) as a measure of its economic size and construct the corresponding independent variable GDP to measure the impact of the economic size gap between countries on global PV trade network structure.
(d) Difference in basic electricity development
The main usage of PV products is for electricity generation, and therefore a country’s basic electricity development level may impact its PV trade. We use the electricity access rate to represent a country’s basic electricity development level and we construct the corresponding independent variable ELC to measure the impact of the gap in electricity access rate between countries on global PV trade network structure.
For the independent variables constructed in this paper, their data sources and processing are shown in
Table 2. Considering the availability of data, we only selected 189 countries from 2012–2018 for the analysis. The QAP regression model is shown as follows:
5.2. The Results of QAP Regression
In this paper, the simulation was performed using UCINET software (parameters using default values). The regression results of the unweighted and weighted networks are shown in
Table 3 and
Table 4, respectively, with the p-values corresponding to the regression coefficients in parentheses. In the overall view, all independent variables are significant at the
p = 0.01 level in the regression analysis of the unweighted network, which implies that they all have some effect on the trade relations between countries. However, the significance of some independent variables changes in the weighted network analysis. The detailed analysis is as follows.
For the international economic organization factor, the regression coefficients of both EU and WTO in the unweighted network analysis are positive and significant at the p = 0.01 level, indicating that the members of the European Union or the World Trade Organization are more likely to establish PV trade relations with each other. In particular, the regression coefficient of the EU is larger than that of the WTO, which means that PV trade is more frequent between European Union member states. In the analysis of the weighted network, the regression coefficients of the WTO are positive and significant at the p = 0.1 level, which means that PV trade values are more likely to grow between World Trade Organization member countries. However, the regression coefficient of the EU is significant only before 2014. This could be because European countries paid more attention to renewable energy and therefore their PV industry developed earlier, which promoted the growth of PV trade values between them. However, since 2014, more and more countries have grown concerned about the PV industry and have become involved in the related trade. A noticeable phenomenon is that the share of Asian countries in PV trade is increasing year by year. Therefore, the effects of the EU variable are no longer significant after 2014.
For the geographical location factor, the regression coefficients of the BOU are positive in both the unweighted and weighted networks. They are significant at the p = 0.01 level, implying that countries which border each other are more likely to establish PV trade relations and promote the growth of trade values. For the DIS, the regression coefficients are negative and significant at the p = 0.01 level in the unweighted network analysis, implying that if two countries are too far away, it will be detrimental to establish trade relations. However, in the weighted network analysis, only the regression coefficient for 2014 is significant at the p = 0.1 level, and its effect on PV trade values between countries is small, which may be due to the advantage of easy transportation of PV products.
For the economic development factor, the regression coefficients of the GDP are positive and significant at the p = 0.01 level in both the unweighted and weighted network analyses, indicating that if there is a gap in GDP between the two countries, it is easier to establish PV trade relations between them and more favorable to the growth of trade value. Furthermore, because the GDP variable has the largest regression coefficients, it is the largest promoter for global PV trade.
For the basic electricity development factor, the regression coefficient of ELC is negative and significant at the p = 0.01 level in the analysis of both unweighted and weighted networks. The relevant data show that most of the countries actively developing a PV industry have an electricity access rate of 100%; therefore, if there is a gap in the level of basic electricity development between the two countries, it will be detrimental for them to trade PV, i.e., PV trade is more likely to occur between countries with a high level of basic electricity development. This may be because PV trade treats the equipment as a commodity rather than directly available energy, and countries with a higher level of basic electricity development are more likely to optimize their energy consumption structure through the use and development of renewable energy, and thus participate in the corresponding trade.
6. The Cascading Process of Risk Propagation on a Global PV Trade Network
This section simulates the cascading process of risk propagation on the global PV network based on an improved bootstrap percolation model. It explores the impact of targeted and random risk on the global PV trade network.
6.1. The Bootstrap Percolation Model
6.1.1. The Basic Model
This paper extends the basic hypothesis [
20] proposed by previous scholars that countries have only two states: N-state (normal) and A-state (abnormal). When a country is in N-state, its trade activities are normal; otherwise, its relevant trade activities will be affected. All countries are initially in N-state. If a country is in N-state and affected by risk, it will change to A-state at the next moment. Each country will not change from A-state back to N-state. It is also assumed that the risk propagation is so fast that countries cannot make a response during the risk propagation process to immunize themselves from the risk. The process of risk propagation is as follows.
(1) At the initial moment (), the state of country is changed from N-state to A-state, indicating it as the source of risk propagation.
(2) At moment
, for each N-state country, compare the risk it received
with its risk tolerance
, if
then the state of the country changes to A-state at the next moment, where
is the given threshold.
(3) Repeat process (2) until no more countries in A-state appear, i.e., the risk stops propagating on the network. At this moment, the ratio of the number of countries in A-state to the number of all countries is noted as .
6.1.2. The Improved Model
In the context of economic globalization, PV has formed a globalized industry chain. If a country changes its supply or demand for any reason, and thus suspends the related trade activities, then the corresponding global industry chain may also be affected. Therefore, this paper simulates the cascading process of risk propagation from two aspects: supply interruption and demand interruption. Due to the characteristics of international trade, this paper assumes that countries are heterogeneous when facing risks, i.e., each country has a different risk tolerance. Therefore, this paper quantifies the risk tolerance of each country through its import or export trade value of PV products. Meanwhile, this paper assumes that if a country is in A-state, its trade of related goods will be completely suspended, i.e., the country will no longer import or export related products. The improved model is as follows.
For the supply interruption, Equation (9) can be expressed as:
where
denotes the abnormal trading partners of country
,
denotes the PV imports of
from its abnormal trading partners (i.e., the risk from supply interruption it received), and
denotes the PV imports of
from all its trading partners (i.e., its risk tolerance for supply interruption).
is a given threshold, and indicates that
becomes A-state if the risk it received from supply interruption to its risk tolerance exceeds
.
For demand interruption, Equation (9) can be expressed as:
where
denotes the abnormal trading partners of country
,
denotes the PV exports of
to its abnormal trading partners (i.e., the risk from demand interruption it received),
denotes the PV exports of
to all its trading partners (i.e., its risk tolerance for demand interruption), and
is a given threshold, which indicates that
becomes A-state if the risk it received from demand interruption to its risk tolerance exceeds
.
Finally, to avoid the interference of noisy data in the experiment, this paper averages the PV trade values between countries from 2015–2019 to construct a new trade network and simulate the cascading process of risk propagation on the current global PV trade network.
6.2. The Influence of Each Country in the Global PV Trade Network
This section analyzes the influence of each country on the global PV trade network by using each country in turn as a risk source. The range of
is set from 0.7 to 0.002 decreasing, and the interval is 0.002. Each country is tested as a risk source in turn, and the value of
when it is no longer increasing is recorded as
, that is, the maximum impact range when country
is the source of risk. The
at this point is noted as
, which reflects the influence of the country in the global PV trade network; the larger the value, the greater the influence. The top 15 countries in the
ranking are shown in
Table 5 and
Table 6.
The results show that the number of countries that can cause a widespread impact (i.e., ≥ 0.95) in the case of supply interruptions is 71, and for demand interruption the number is 192. This significant gap is due to the relatively concentrated supply and the more widespread demand for global PV products. Therefore, in the case of supply interruption, only one-third of the countries stand alone as a source of risk that can cause a widespread impact on the global PV trade network in a given situation. For demand interruption, most countries can cause a widespread impact on the global PV trade network in a given situation.
Specifically, in the case of supply interruption, China’s is higher than other countries, indicating that China occupies a relatively important position in the supply of global PV trade. Japan, Hong Kong (China), Singapore, Malaysia, and South Korea are next. There is a large gap in the value of , which also indicates that there are large gaps in the supply capacity of PV products and the size of the export market in each country. The top 15 countries are mainly Asian countries, indicating that Asian countries have taken a larger share of the supply of PV products in the last five years. In the case of demand interruption, the of Germany, China, and the U.S. are relatively large, indicating that they have a large demand for PV products. The difference between the values of is relatively small, which indicates that the demand for PV products in each country is relatively close. The top-ranked countries are mainly located in North America, Europe, and Asia.
6.3. Global PV Trade Network Robustness Analysis
In this part, we simulate the impact of different types of risks on the global PV trade network and analyze the robustness. Firstly, the countries with the top influence ranking are selected as risk sources to simulate the impact of targeted risks. Secondly, countries are randomly selected as risk sources to simulate the impact of the randomness risk. ranges from 1 to 21 with an interval of 1. ranges from 0.05 to 0.95 with an interval of 0.05. The experiments are repeated 2000 times under each parameter, and the average value of Sa is taken as the result.
The results in the supply interruption case (see
Figure 6) show that
under each parameter in
Figure 6b is much smaller than that in
Figure 6a, indicating that the global PV trade network has some resistance to randomness supply interruption risks and shows robustness, while it has weak resistance to targeted supply interruption risks and shows vulnerability. The results for the demand interruption case (see
Figure 7) show that
in
Figure 7b is larger when
≤ 0.15 and
≥ 7, and when
≥ 0.2,
under each parameter in
Figure 7b is much smaller than that in
Figure 7a. This is because most countries can have a large-scale impact on the global PV trade network in case of demand interruption and their
are small (the mean value is 0.087). Therefore, as shown in
Figure 7b, when
is small and
is large, the
is large, and there is a significant decrease in
as
increases. In general, the global PV trade network has some resistance to randomness demand interruption risk and shows robustness, and weak resistance to targeted demand interruption risk and shows vulnerability.
In summary, reducing or increasing will reduce the value of to a certain extent, which indicates that countries can improve their resistance to risk by controlling the number of countries that could be the risk source, or by improving their defense. In particular, for supply interruptions, since a few countries have greater influence, controlling the sources of risk is a more effective solution to stop the spread of supply interruption risks, and countries can pay more attention to countries with greater influence to respond at the initial stage of risk propagation. For demand interruptions, since most countries can cause a large-scale impact and their influence is low, improving defense is a more effective solution to stop the spread of demand interruption risks, and countries can expand their export markets to improve their resistance to demand interruption risks.
7. Conclusions and Discussion
In the context of the increasingly complex global trade environment and the continuing impact of COVID-19, global cooperation in renewable energy is facing great challenges. This paper focuses on global PV trade, and addresses the following questions: (1) what is the evolutionary trend of global PV trade? (2) what is the current pattern of global PV trade? (3) which factors will impact global PV trade? and (4) will the suspension of PV trade in some countries cause worldwide impacts? To address these questions, this paper establishes the global PV trade networks from 2000–2021, analyzes the evolutionary features and impact factors of the network structure, and explores the cascading process of risk propagation on the network. The main conclusions are as follows:
In terms of the current pattern of global PV trade, the scale of global PV trade continues to expand, and the participation of countries continues to increase. The evolution features of the overall structure of the network show that the density of the global PV trade network is increasing year by year, global PV trade relations continue to increase, and more and more countries are actively participating in PV trade. At the same time, the analysis of the importance of nodes shows that the number of import and export trade relations and trade values of many countries has increased year by year, especially in some Asian countries (such as Vietnam, etc.) which have grown more significantly in recent years. This may be related to lower production costs and the support of relevant policies.
In terms of the future of the global PV industry, there are considerable development prospects. On the one hand, the emphasis of many countries on reducing carbon emissions increases their demand for clean energy. Photovoltaic energy is a clean energy source with good development prospects and value, due to its advantages of easy installation and low cost. On the other hand, current PV products have a better environment in commodity circulation. The analysis of the overall structure of the network shows that the average clustering coefficient of the global PV trade network is high, and the average distance is small, indicating that the network presents obvious small-world characteristics and that the related industries have high circulation efficiency. Meanwhile, the analysis results of betweenness centrality and community structure show that there are no obvious intermediary countries in the network, and the relevant goods arrive at their destinations without multiple transshipments, thus the trade costs are low. All these advantages lay a good foundation for further cooperation in the global PV industry.
In terms of the evolution features of the community structure of the global PV trade network, the network gradually presents a core-periphery structure and the global PV industry is more concentrated. With more and more countries actively involved in global PV trade, the global PV trade network has formed a more obvious community structure since 2012. Countries are divided into four different blocks, which play four roles: primary, broker, receiver, and isolator. The primary is the core of the global PV trade; it has limited members, but it dominates most of the PV trade. These countries are at the forefront of the PV industry and lead overall development. The broker only has two-way trade relations with the primary, which means that its members may have an advantage in one part of the PV industry chain and the primary to some degree has a dependence on them. These countries can further develop relevant products and improve their competitiveness in the international market. The receiver only has a demand for the PV products of the primary. Its members are the largest in number and are mainly located in Africa. With advantages in vast land and abundant sunshine, Africa has an extremely favorable geographical environment for PV electricity generation. Therefore, the receiver is a very promising market.
In terms of the influencing factors of the global PV trade network structure, the gaps of economic size and basic electricity development level have the largest facilitating and hindering effects on the establishment of global PV trade relations and related commodity movement, respectively. The results of the impact factor analysis on the global PV trade network structure show that the GDP variable has the largest positive regression coefficient for both unweighted and weighted global PV trade networks. This indicates that the gap in economic size is the main factor which facilitates the establishment of PV trade relations and the related commodity movement between countries. The ELC variable has the largest negative regression coefficient for both the unweighted and weighted networks and is the biggest impediment to the establishment of PV trade relations and the related commodity movement. In addition, countries belonging to the same international economic organization or those in close geographic proximity will facilitate the establishment of PV trade relations and the related commodity movement. Among these countries, those with joint borders make a greater contribution to the relevant commodity movement, since the BOU variable has the second-largest positive regression coefficient for the weighted network. Therefore, to better participate in global PV trade, countries can accelerate their economic construction, improve the level of basic electricity facilities, and strengthen trade cooperation with neighboring countries.
In terms of the robustness of the global PV trade network, the network is vulnerable to targeted risk and is robust to randomness risk. In the analysis of the risk propagation cascade process on the global PV trade network, we found that trade interruptions due to targeted risks (e.g., war, trade policies, etc.) could cause widespread impacts on the global PV trade network, and the network exhibits vulnerability. Countries such as China, Japan, and Singapore are the main suppliers of global PV products, and are especially vulnerable to supply interruption as they have a large export market and occupy a larger share of exports. As such, it is extremely easy for their own local risk to spread to global markets. However, the global PV trade network is resilient to trade interruptions due to randomness risk (e.g., natural disasters, etc.). The impact on the network from randomness attacks in most cases is less than in the case of targeted attacks, and the network shows robustness. Furthermore, we also identified some ways to control the spread of risk. Controlling the number of risk sources or improving defense mechanisms are both effective ways to reduce the scope of risk impact. That is, countries should pay attention to those with significant influence in risk defense at the early stages of risk propagation. At the same time, countries should ensure the decentralization of their trading partners to diversify trade risks.
Finally, further study may consider the following aspects. (1) Explore more potential impact factors in the structure of the global PV trade network. Limited by the data, we only chose selected impact factors in the analysis, and other potential impact factors could be explored in future research. (2) Improve the risk propagation model. The analysis of risk propagation in this paper is a theoretical simulation, and the parameters of the model can be determined in the future based on actual COVID-19 data.
Author Contributions
Conceptualization, J.X. and G.Y.; methodology, J.X., C.X., and G.Y.; software, J.X. and G.Y.; validation, J.X., C.X., W.D., and G.Y.; formal analysis, J.X., C.X., and G.Y.; investigation, J.X., C.X., W.D., and G.Y.; resources, J.X., C.X., and G.Y.; data curation, J.X., C.X., W.D., and G.Y.; writing—original draft preparation, J.X., W.D., and G.Y.; writing—review and editing, J.X., W.D., and G.Y.; visualization, J.X.; supervision, G.Y.; project administration, G.Y. All authors have read and agreed to the published version of the manuscript.
Funding
This research was funded by National Natural Science Foundation of China (11861019), Guizhou Talent Development Project in Science and Technology (KY[2018]046), Natural Science Foundation of Guizhou ([2019]1047, [2020]1Z001, [2021]5609).
Institutional Review Board Statement
Not applicable.
Informed Consent Statement
Not applicable.
Data Availability Statement
The data were from the United Nations Commodity Trade Database (UN Comtrade) which contains all annual data for 215 countries and areas for the years 2000 to 2019, and the HS code for PV products is 854140.
Conflicts of Interest
The authors declare no conflict of interest.
References
- Wu, L. Paris Agreement: A roadmap to tackle climate and environment challenges. Natl. Sci. Rev. 2016, 3, 153. [Google Scholar] [CrossRef] [Green Version]
- Grünewald, P.; Cockerill, T.; Contestabile, M.; Pearson, P. The role of large scale storage in a GB low carbon energy future: Issues and policy challenges. Energy Policy 2011, 39, 4807–4815. [Google Scholar] [CrossRef]
- Shem, C.; Simsek, Y.; Hutfilter, U.F.; Urmee, T. Potentials and opportunities for low carbon energy transition in Vietnam: A policy analysis. Energy Policy 2019, 134, 110818. [Google Scholar] [CrossRef]
- Johnstone, P.; Rogge, K.S.; Kivimaa, P.; Fratini, C.F.; Primmer, E. Exploring the re-emergence of industrial policy: Perceptions regarding low-carbon energy transitions in Germany, the United Kingdom and Denmark. Energy Res. Soc. Sci. 2021, 74, 101889. [Google Scholar] [CrossRef]
- Statistical Review of World Energy 2020, 69th ed. Available online: bp.com/statisticalreview (accessed on 9 January 2022).
- Wang, Z.; Shuai, J.; Leng, Z.; Shuai, C.; Shi, Z. Is trade dispute a major factor influencing the complementarity of Sino-US solar PV products trade? Int. J. Energy Sect. Manag. 2020, 14, 935–952. [Google Scholar] [CrossRef]
- Kuik, O.; Branger, F.; Quirion, P. Competitive advantage in the renewable energy industry: Evidence from a gravity model. Renew. Energy 2019, 131, 472–481. [Google Scholar] [CrossRef]
- Ogura, Y. Policy as a “porter” of RE component export or import? Evidence from PV/wind energy in OECD and BRICS. Energy Econ. 2020, 86, 104630. [Google Scholar] [CrossRef]
- Serrano, M.A.; Boguñá, M. Topology of the world trade web. Phys. Rev. E 2003, 68, 015101. [Google Scholar] [CrossRef] [Green Version]
- Geng, J.B.; Ji, Q.; Fan, Y. A dynamic analysis on global natural gas trade network. Appl. Energy 2014, 132, 23–33. [Google Scholar] [CrossRef]
- Duan, J.; Nie, C.; Wang, Y.; Yan, D.; Xiong, W. Research on Global Grain Trade Network Pattern and Its Driving Factors. Sustainability 2022, 14, 245. [Google Scholar] [CrossRef]
- Yu, G.; Xiong, C.; Xiao, J.; He, D.; Peng, G. Evolutionary analysis of the global rare earth trade networks. Appl. Math. Comput. 2022, 430, 127249. [Google Scholar] [CrossRef]
- Liu, X.; Lei, T.; Boré, A.; Lou, Z.; Abdouraman, B.; Ma, W. Evolution of global plastic waste trade flows from 2000 to 2020 and its predicted trade sinks in 2030. J. Clean. Prod. 2022, 376, 134373. [Google Scholar] [CrossRef]
- Hao, X.; An, H. Comparative study on transmission mechanism of supply shortage risk in the international trade of iron ore, pig iron and crude steel. Resour. Policy 2022, 79, 103022. [Google Scholar] [CrossRef]
- Guan, Q.; An, H.; Hao, X.; Jia, X. The impact of countries’ roles on the international photovoltaic trade pattern: The complex networks analysis. Sustainability 2016, 8, 313. [Google Scholar] [CrossRef] [Green Version]
- Guan, Q.; An, H. The exploration on the trade preferences of cooperation partners in four energy commodities’ international trade: Crude oil, coal, natural gas and photovoltaic. Appl. Energy 2017, 203, 154–163. [Google Scholar] [CrossRef]
- Guan, Q.; An, H.; Wang, K.; Duan, Y.; Zhang, Y. Functional trade patterns and their contributions to international photovoltaic trade revealed by network motifs. Energy 2020, 195, 116989. [Google Scholar] [CrossRef]
- Fu, X.; Yang, Y.; Dong, W.; Wang, C.; Liu, Y. Spatial structure, inequality and trading community of renewable energy networks: A comparative study of solar and hydro energy product trades. Energy Policy 2017, 106, 22–31. [Google Scholar] [CrossRef]
- Wang, C.; Huang, X.; Hu, X.; Zhao, L.; Liu, C.; Ghadimi, P. Trade characteristics, competition patterns and COVID-19 related shock propagation in the global solar photovoltaic cell trade. Appl. Energy 2021, 290, 116744. [Google Scholar] [CrossRef]
- Ying, F.; Ren, S.; Cai, H.; Cui, X. The state’s role and position in international trade: A complex network perspective. Econ. Model. 2014, 39, 71–81. [Google Scholar]
- Cai, H.; Song, Y.; Fan, Y.; Wu, Z. International trade of agricultural products as analyzed by complex network method. J. Beijing Norm. Univ. (Nat. Sci.) 2018, 54, 191–197. [Google Scholar]
- Chen, Z.; An, H.; An, F.; Guan, Q.; Hao, X. Structural risk evaluation of global gas trade by a network-based dynamics simulation model. Energy 2018, 159, 457–471. [Google Scholar] [CrossRef]
- Wang, X.; Li, X.; Chen, G. Network Science: An Introduction; Higher Education Press: Beijing, China, 2012. [Google Scholar]
- Liu, J. Lectures on Whole Network Approach: A Practical Guide to UCINET; Truth & Wisdom Press: Shanghai, China, 2009. [Google Scholar]
- Burt, R.S. Positions in Networks. Soc. Forces 1976, 55, 93. [Google Scholar] [CrossRef]
- Burt, R.S. Positions in Multiple Network Systems, Part One: A General Conception of Stratification and Prestige in a System of Actors Cast as a Social Topology. Soc. Forces 1977, 56, 106–131. [Google Scholar] [CrossRef]
- Burt, R.S. Positions in Multiple Network Systems, Part Two: Stratification and Prestige Among Elite Decision- Makers in the Community of Altneustadt*. Soc. Forces 1977, 56, 551–575. [Google Scholar]
- White, H.C.; Boorman, S.A.; Breiger, R.L. Social Structure from Multiple Networks. I. Blockmodels of Roles and Positions. Am. J. Sociol. 1976, 81, 730–780. [Google Scholar] [CrossRef] [Green Version]
- Boorman, S.A.; White, H.C. Social Structure from Multiple Networks. II. Role Structures. Am. J. Sociol. 1976, 81, 1384–1446. [Google Scholar] [CrossRef]
- Krackhardt, D. Predicting with networks: Nonparametric multiple regression analysis of dyadic data. Soc. Netw. 1988, 10, 359–381. [Google Scholar] [CrossRef]
- Baccini, L.; Kim, S.Y. Preventing protectionism: International institutions and trade policy. Rev. Int. Organ. 2012, 7, 369–398. [Google Scholar] [CrossRef] [Green Version]
- Hasson, J.A.; Tinbergen, J. Shaping the world economy: Suggestions for an international cconomic policy. Economica 1964, 31, 327–330. [Google Scholar] [CrossRef]
| Publisher’s Note: MDPI stays neutral with regard to jurisdictional claims in published maps and institutional affiliations. |
© 2022 by the authors. Licensee MDPI, Basel, Switzerland. This article is an open access article distributed under the terms and conditions of the Creative Commons Attribution (CC BY) license (https://creativecommons.org/licenses/by/4.0/).


