
Environmental Contamination of a Biodiversity Hotspot—Action Needed for Nature Conservation in the Niger Delta, Nigeria

 , ,
, ,  and
and
Abstract
1. Introduction
- Which vegetation indices are most suitable to detect oil spills in the Niger Delta?
- Where are the hotspots (accumulation) of oil spills located in the Niger Delta?
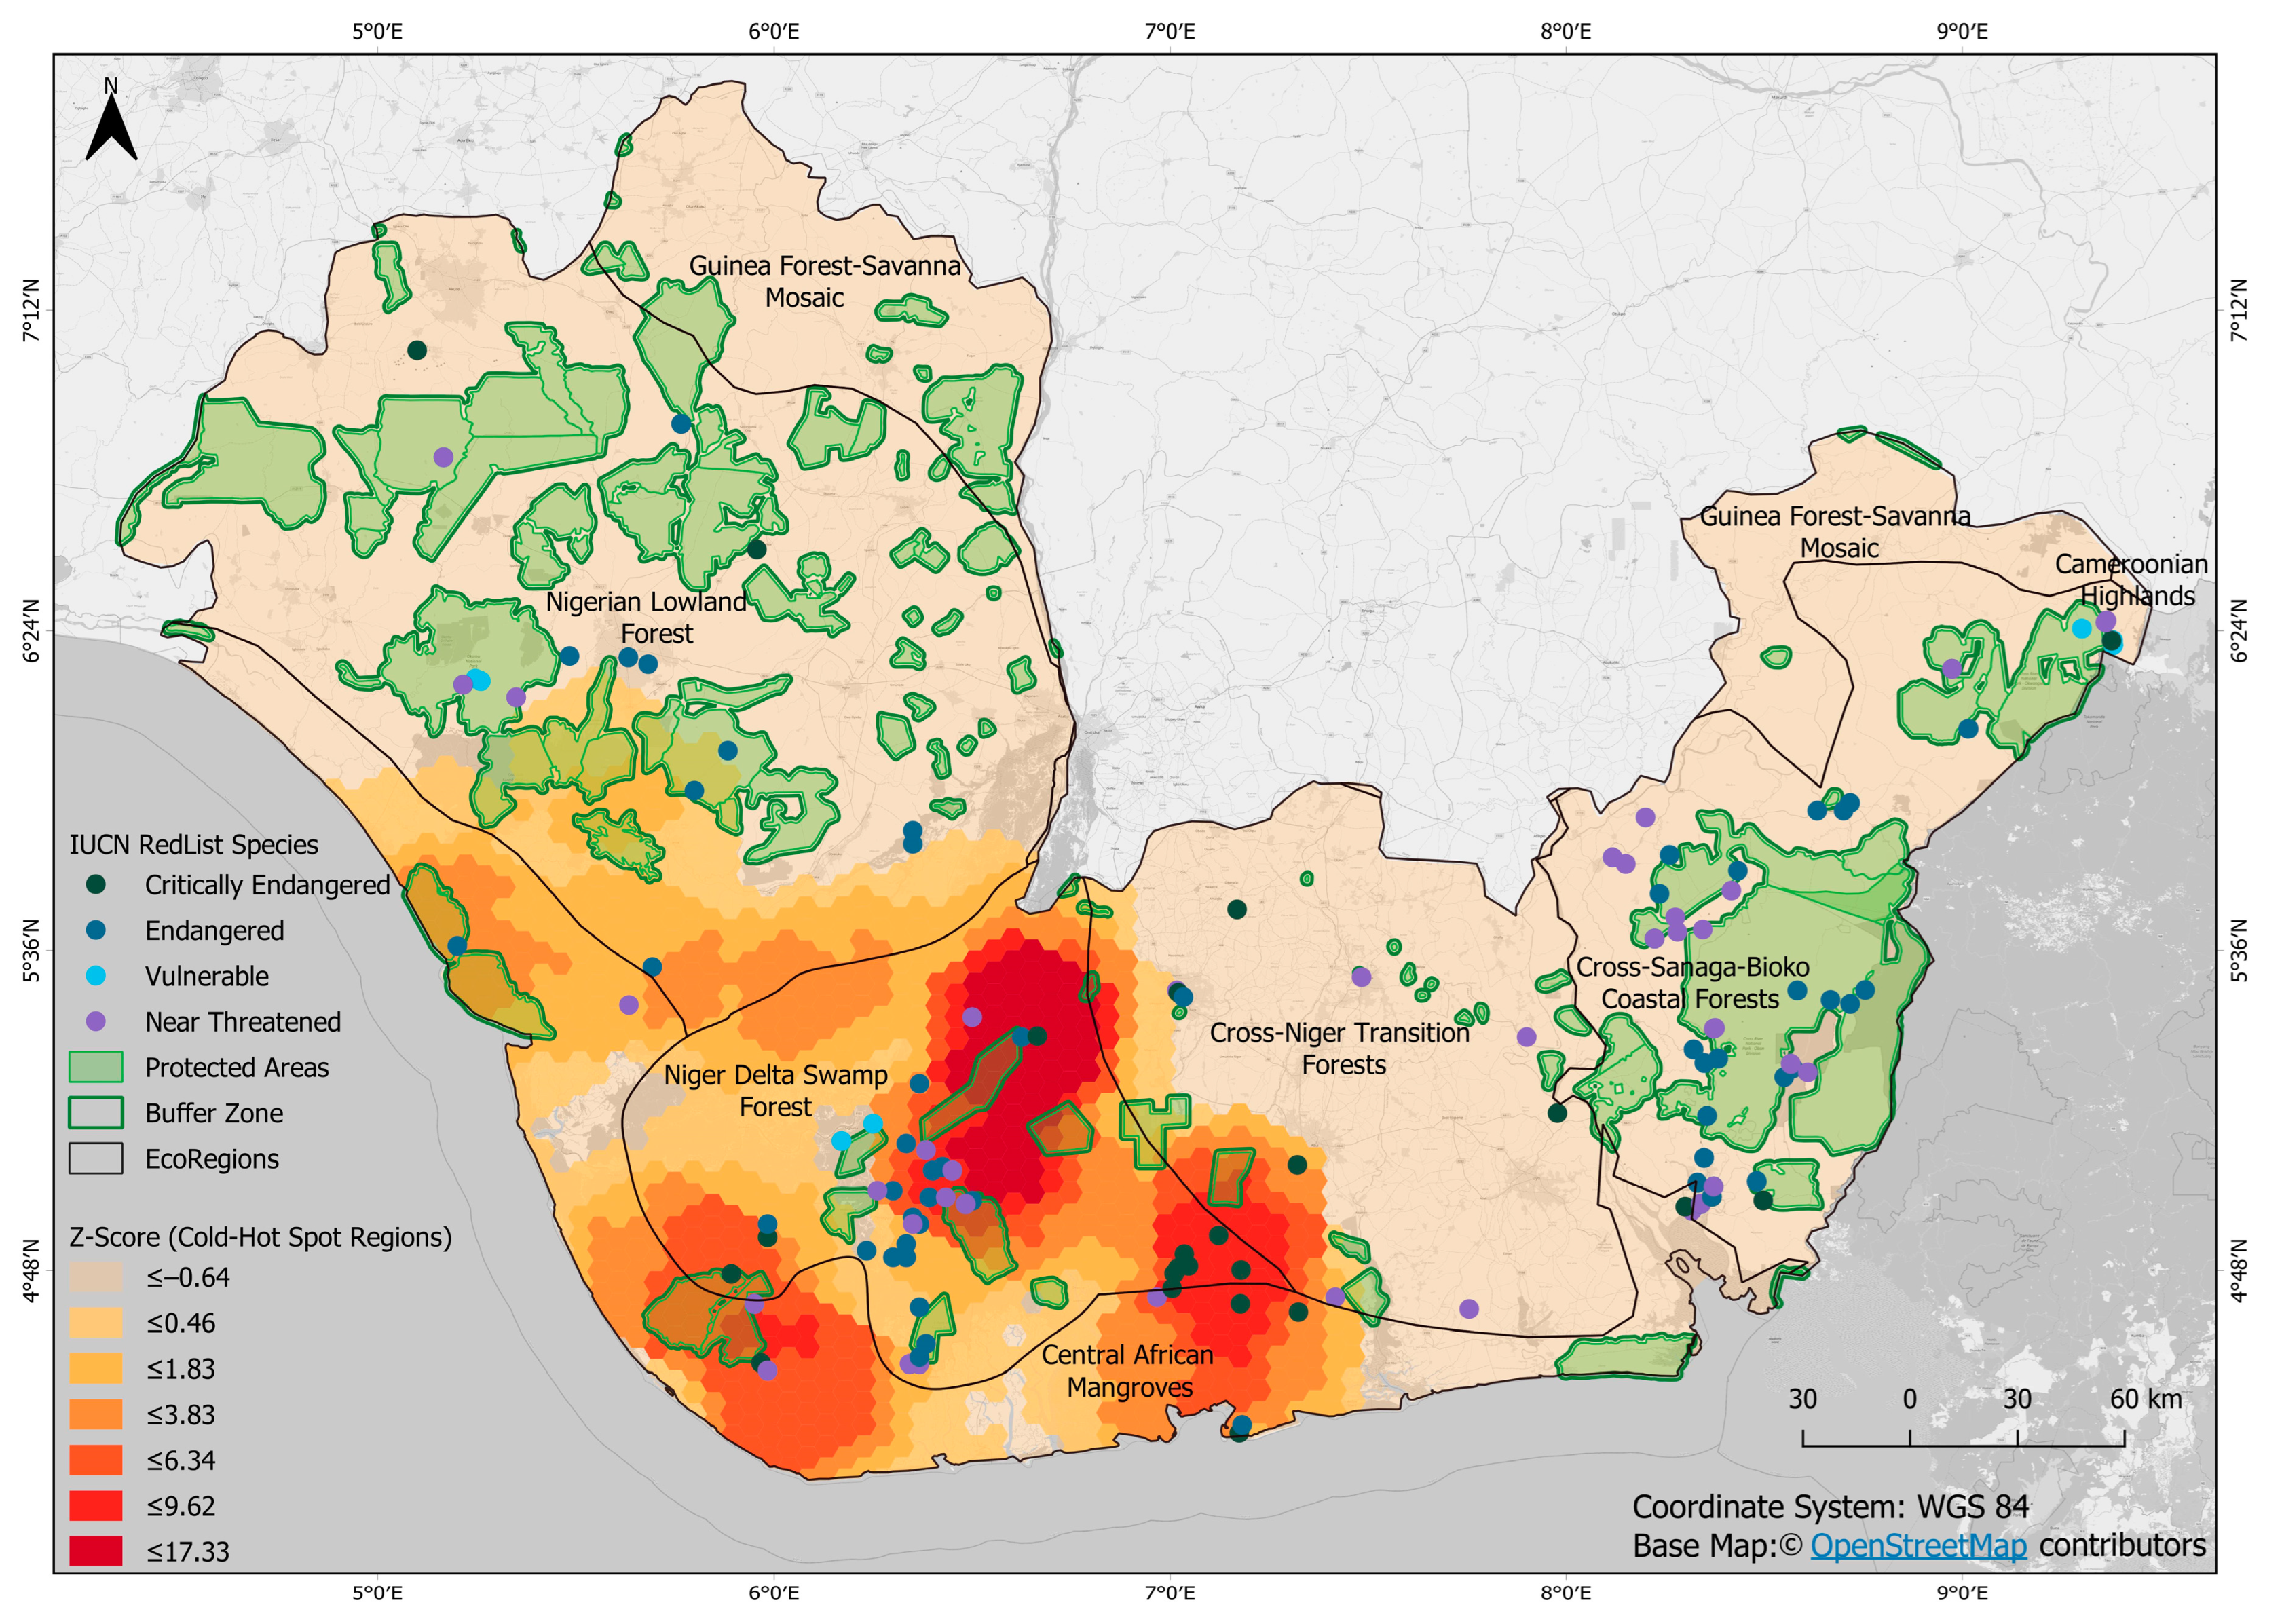
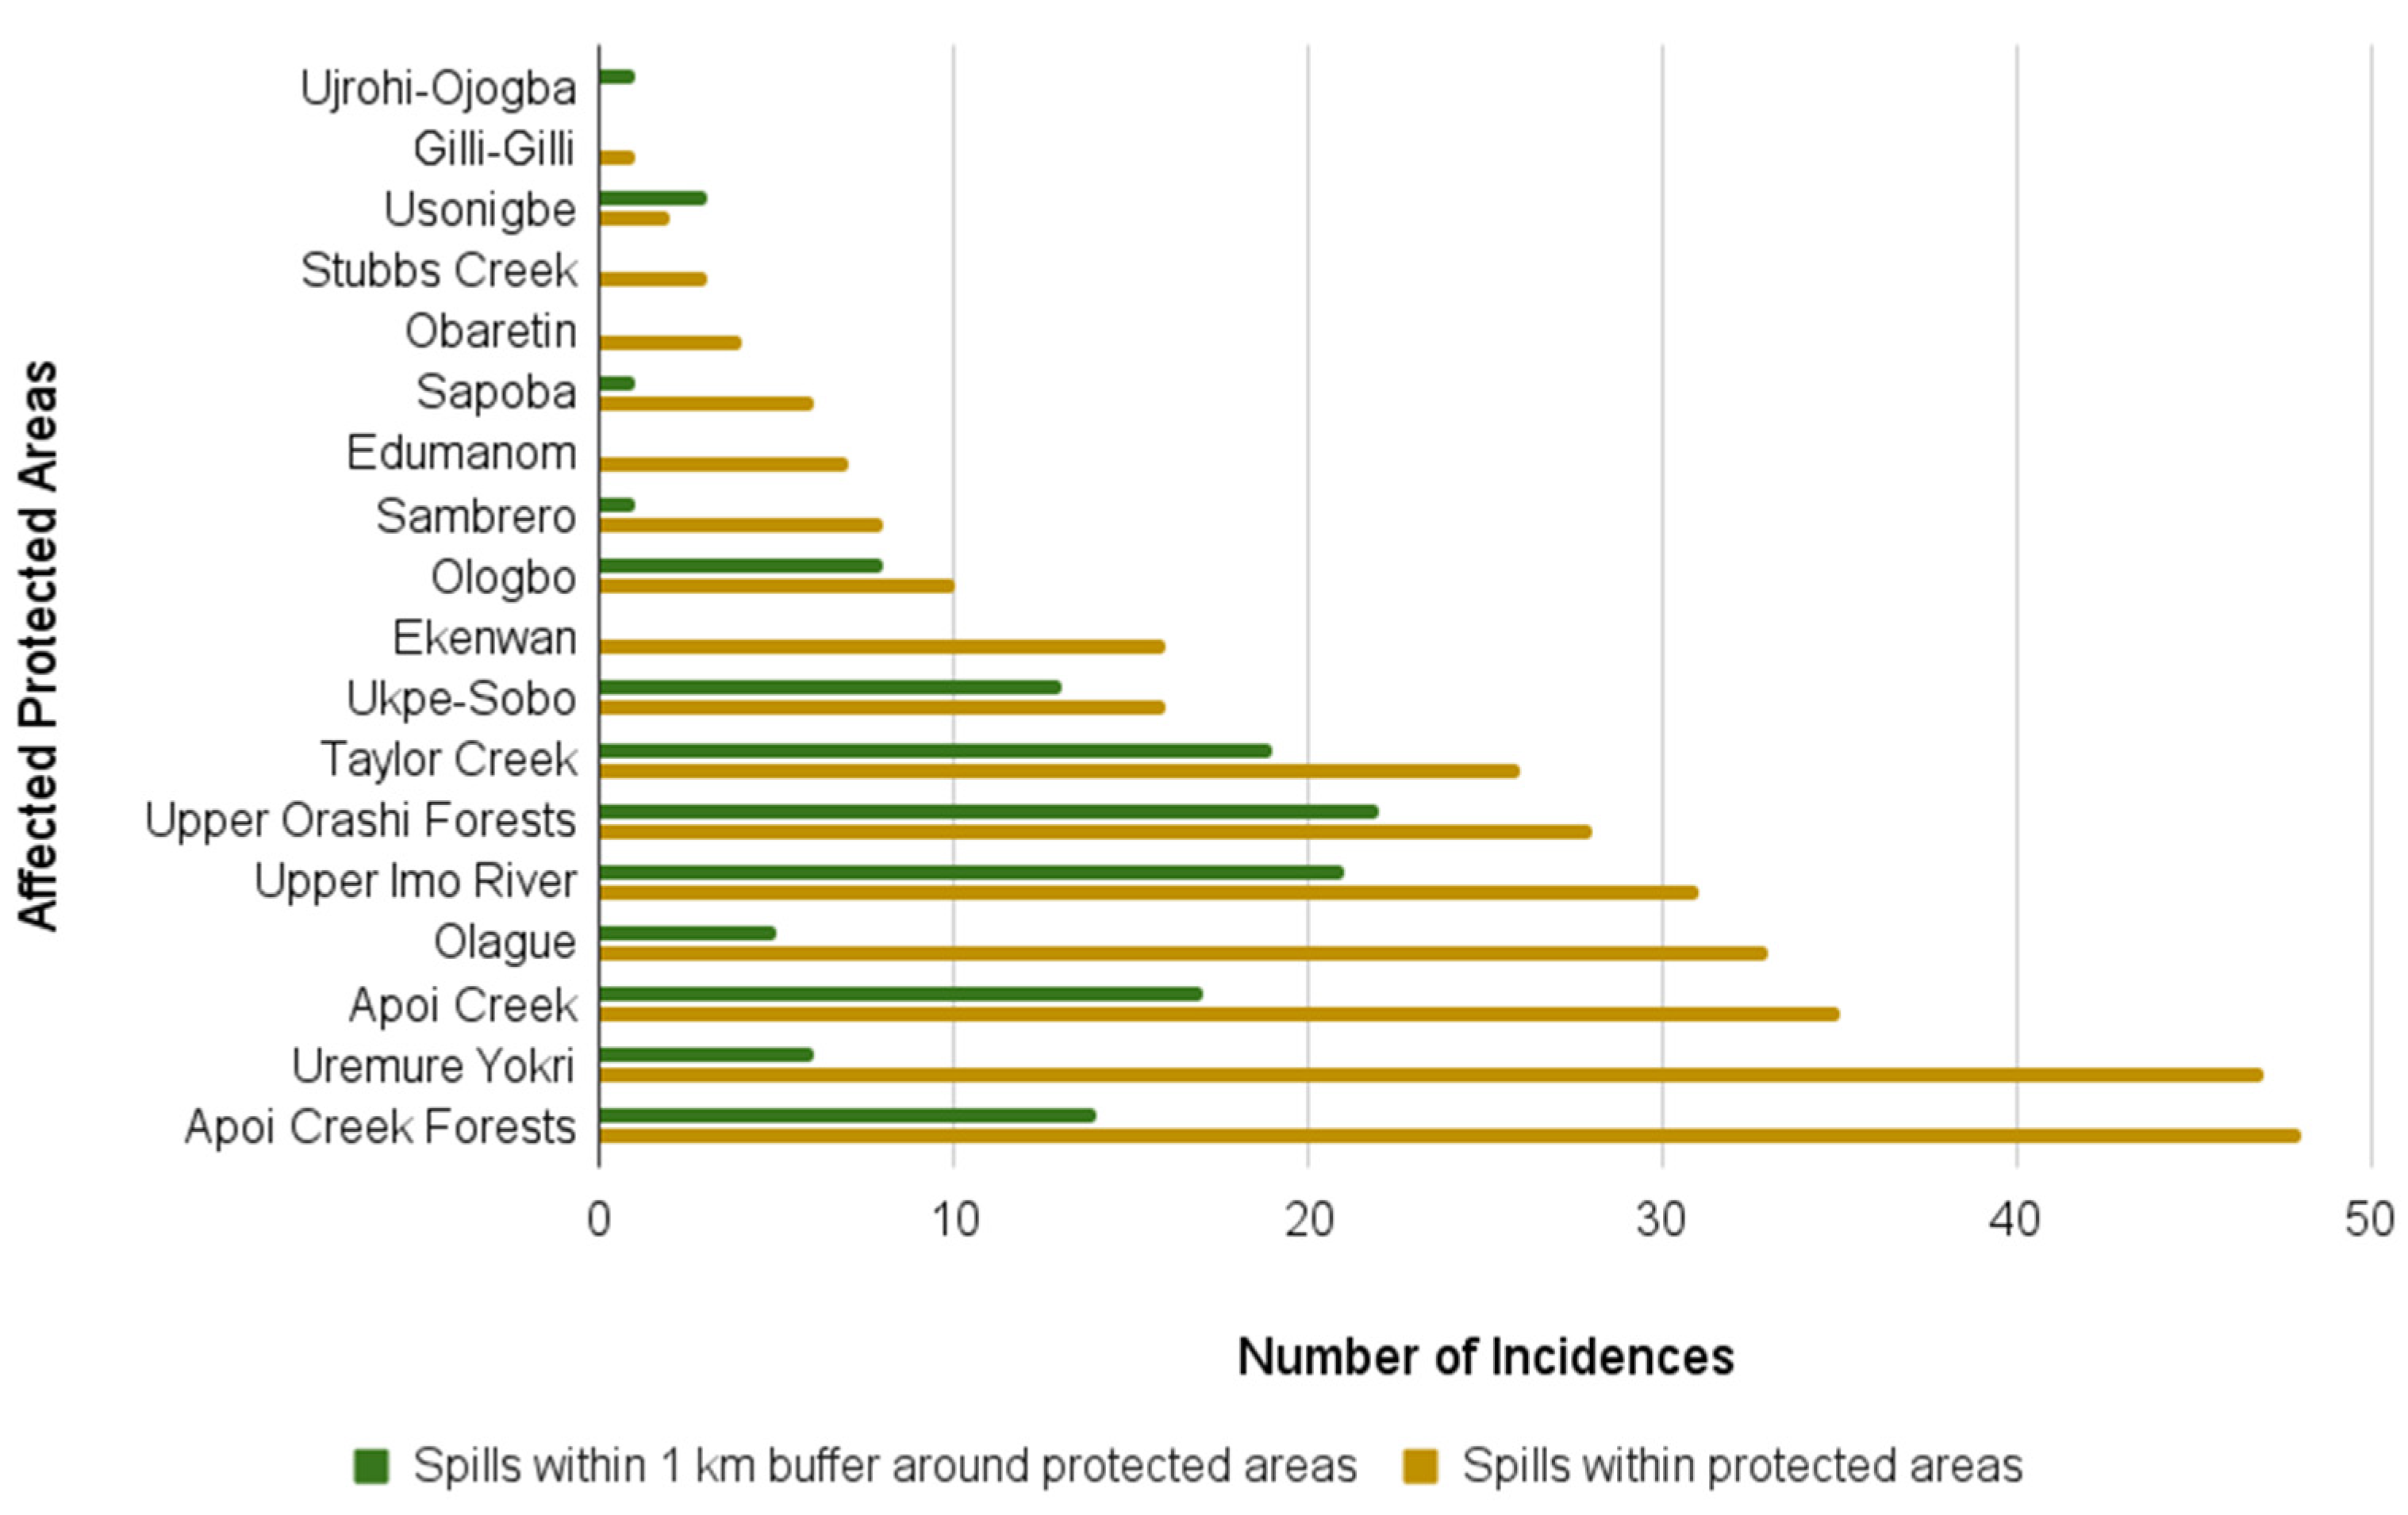
- Which species, land cover types and protected areas/ecosystems are most threatened by oil spills in the Niger Delta?
2. Materials and Methods
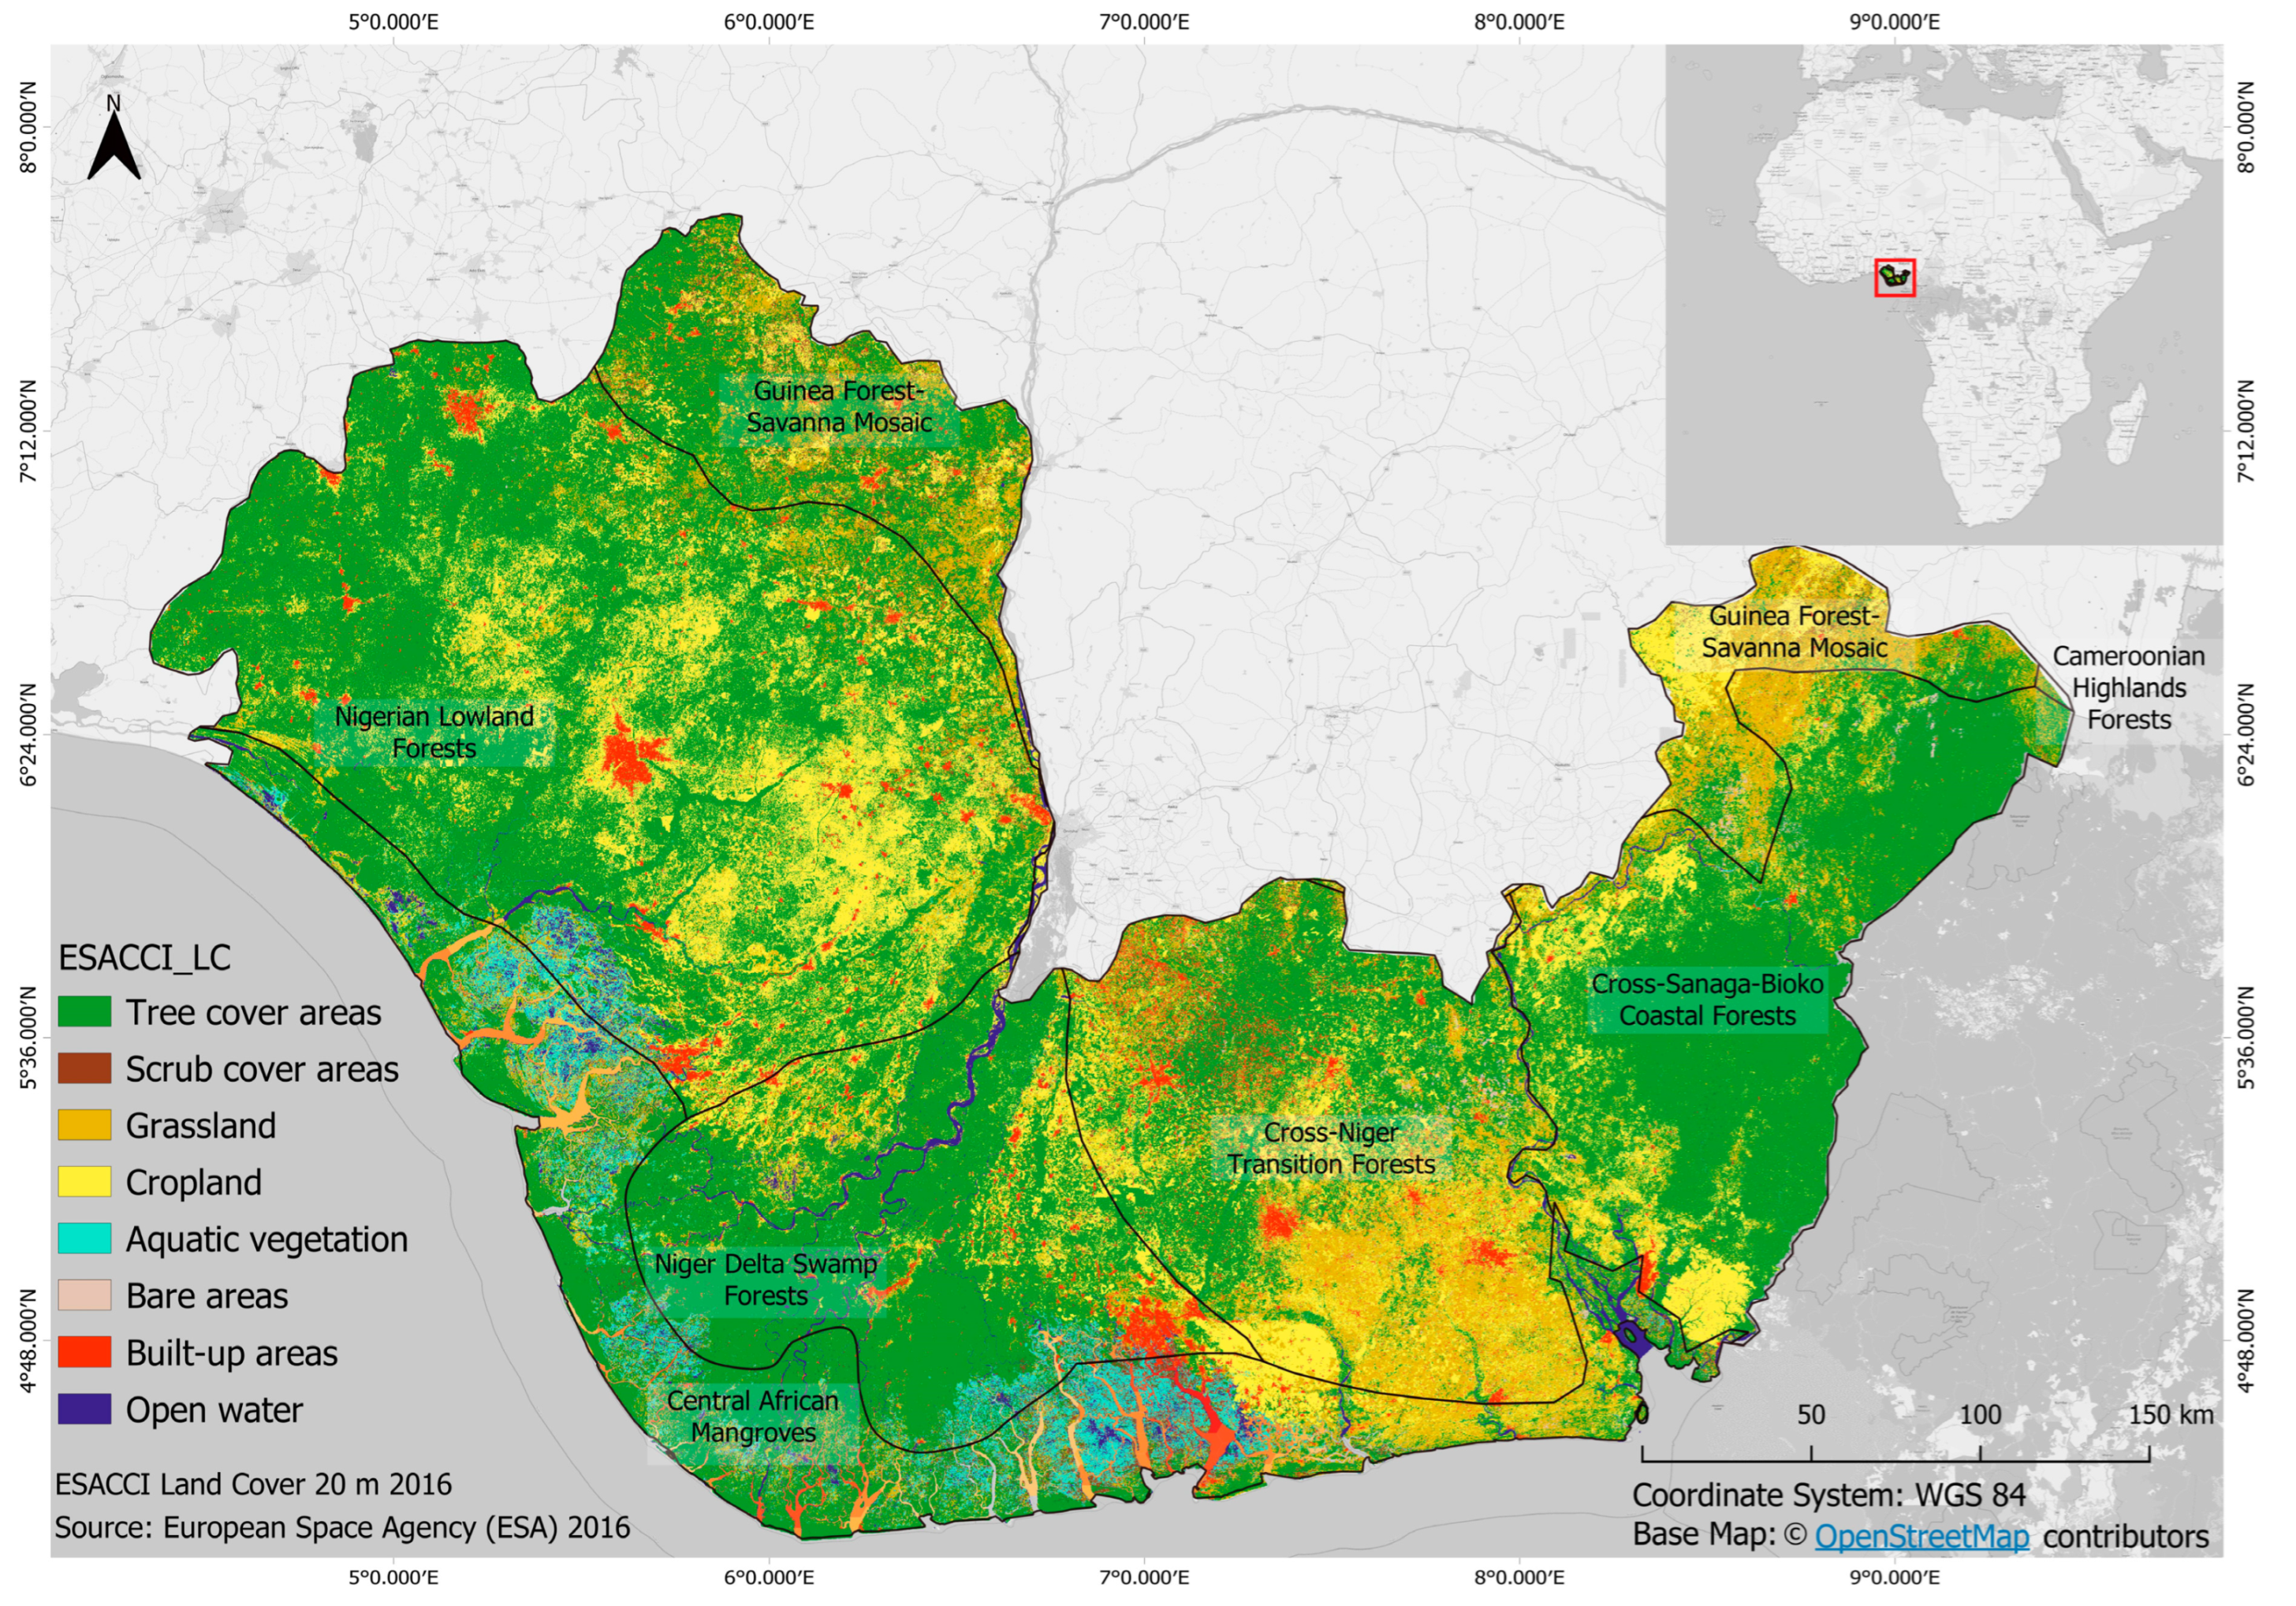
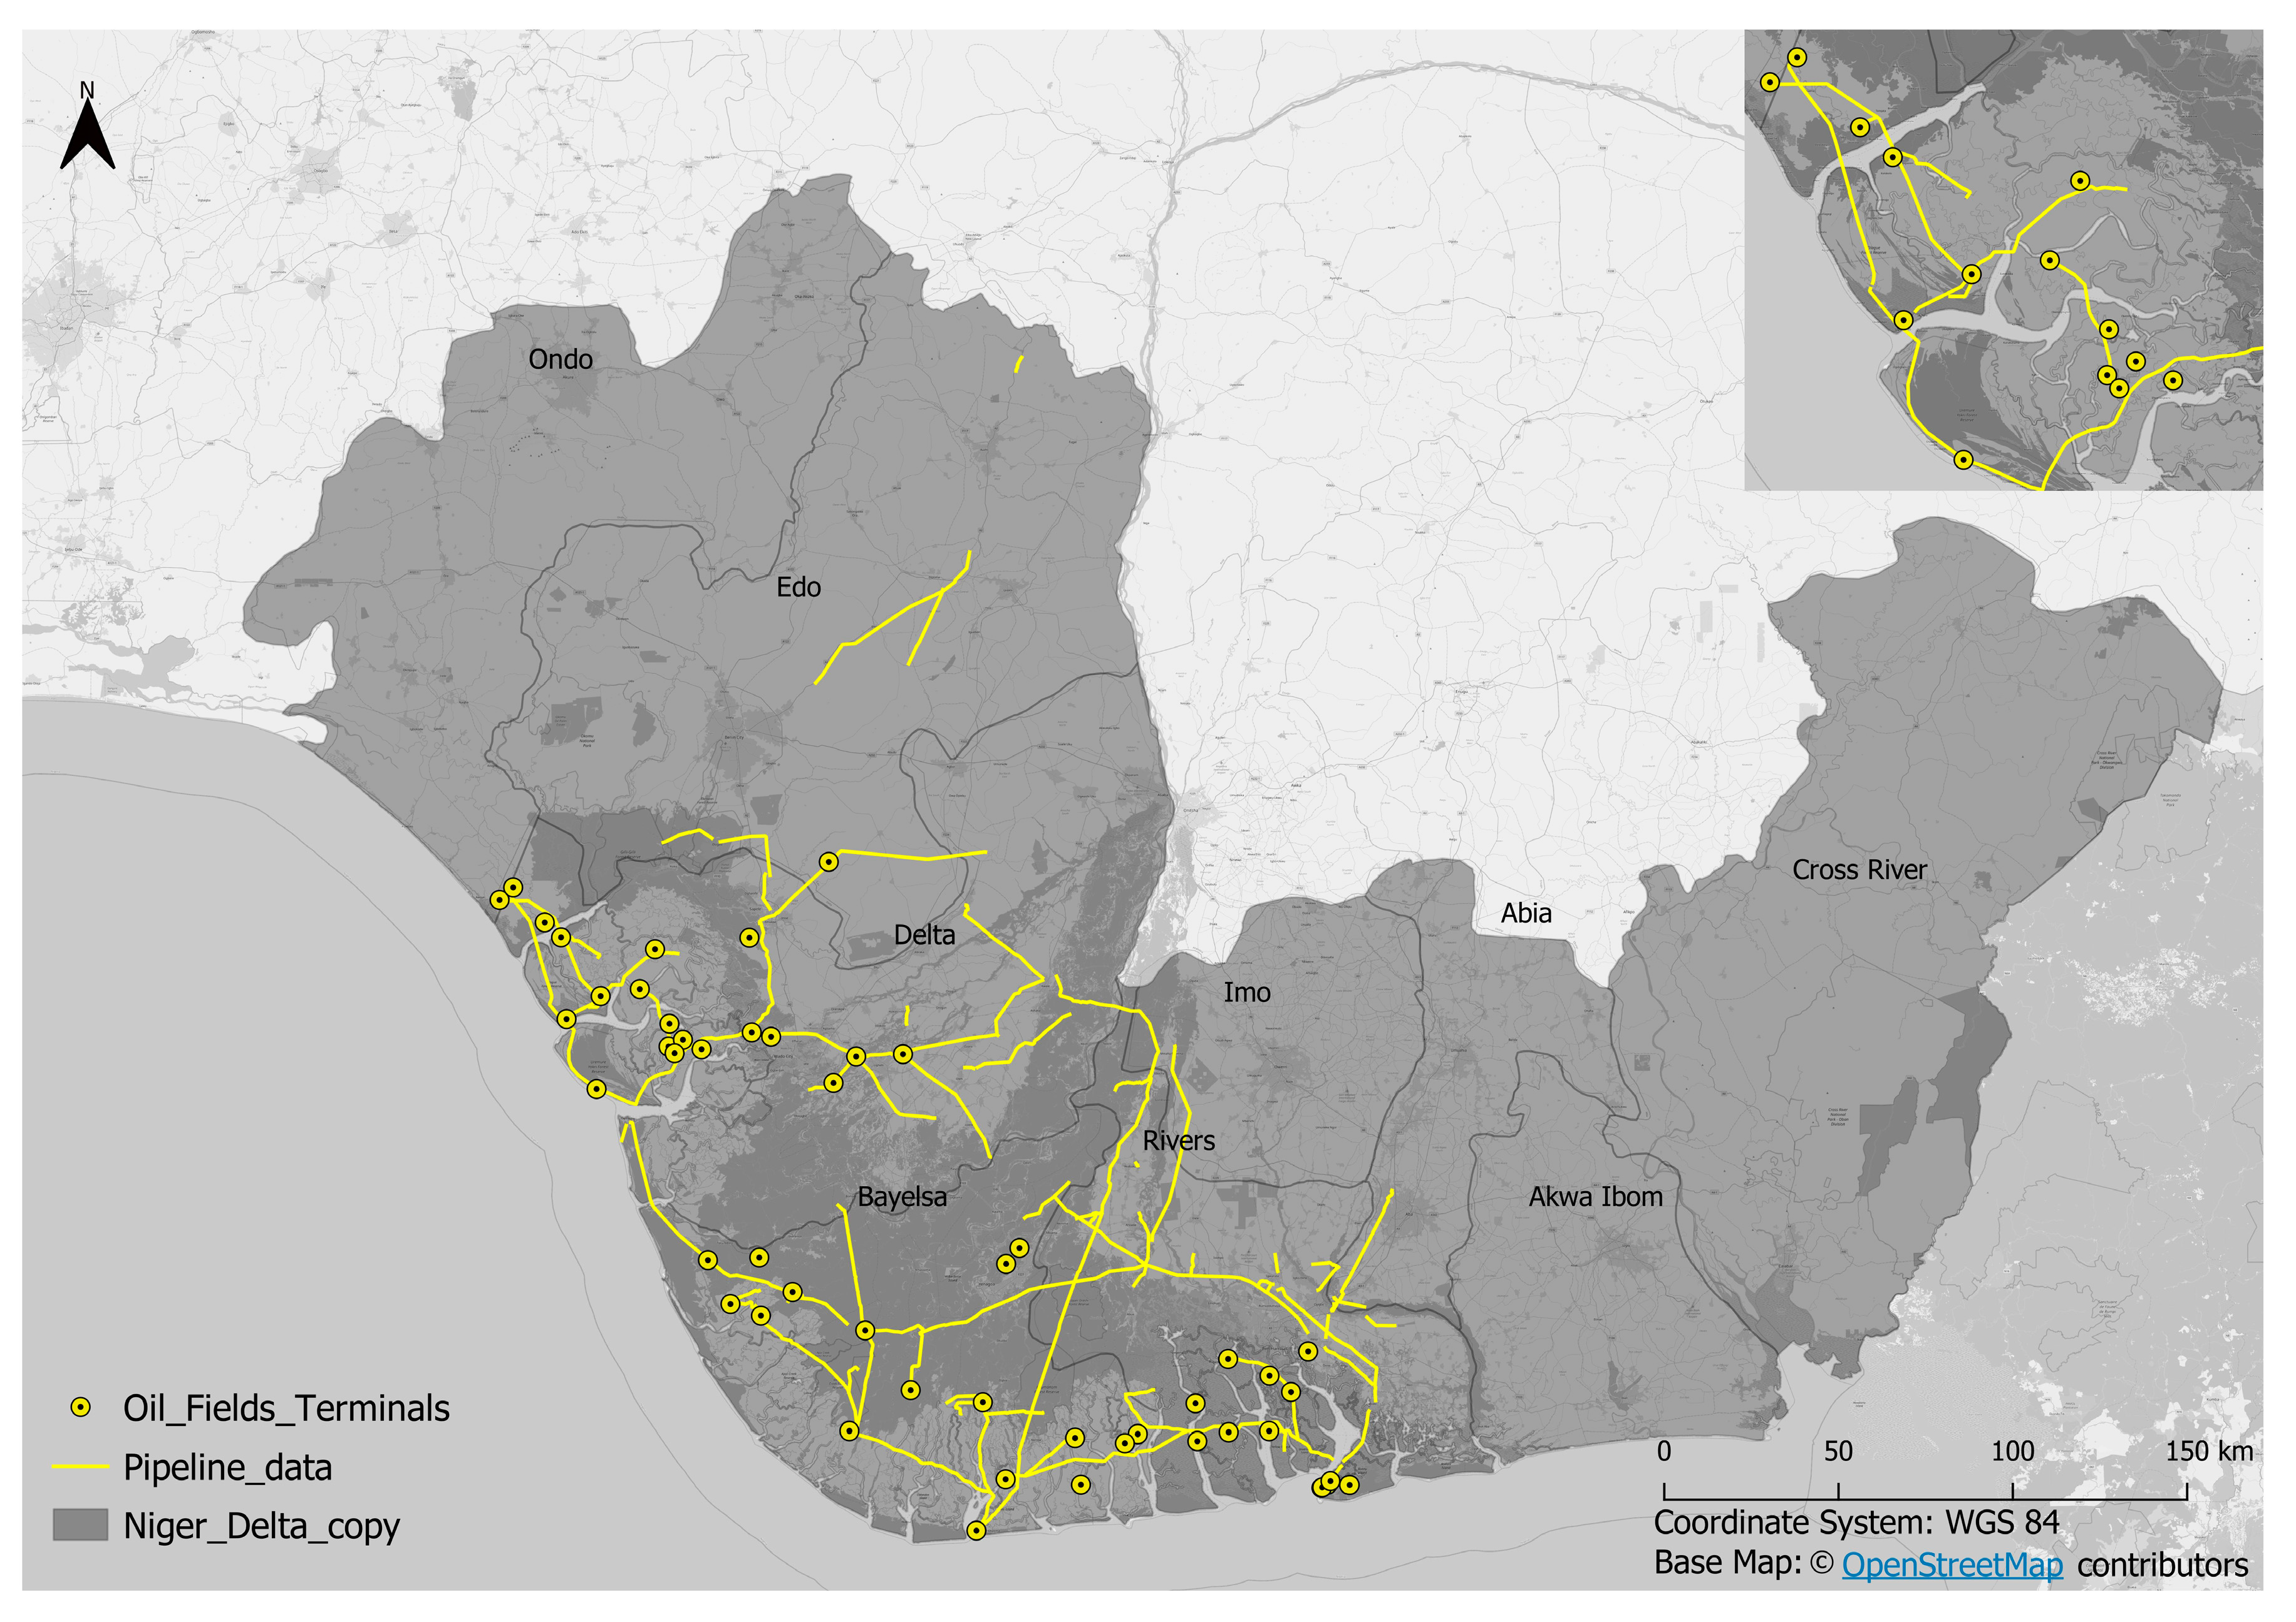
2.1. Study Area
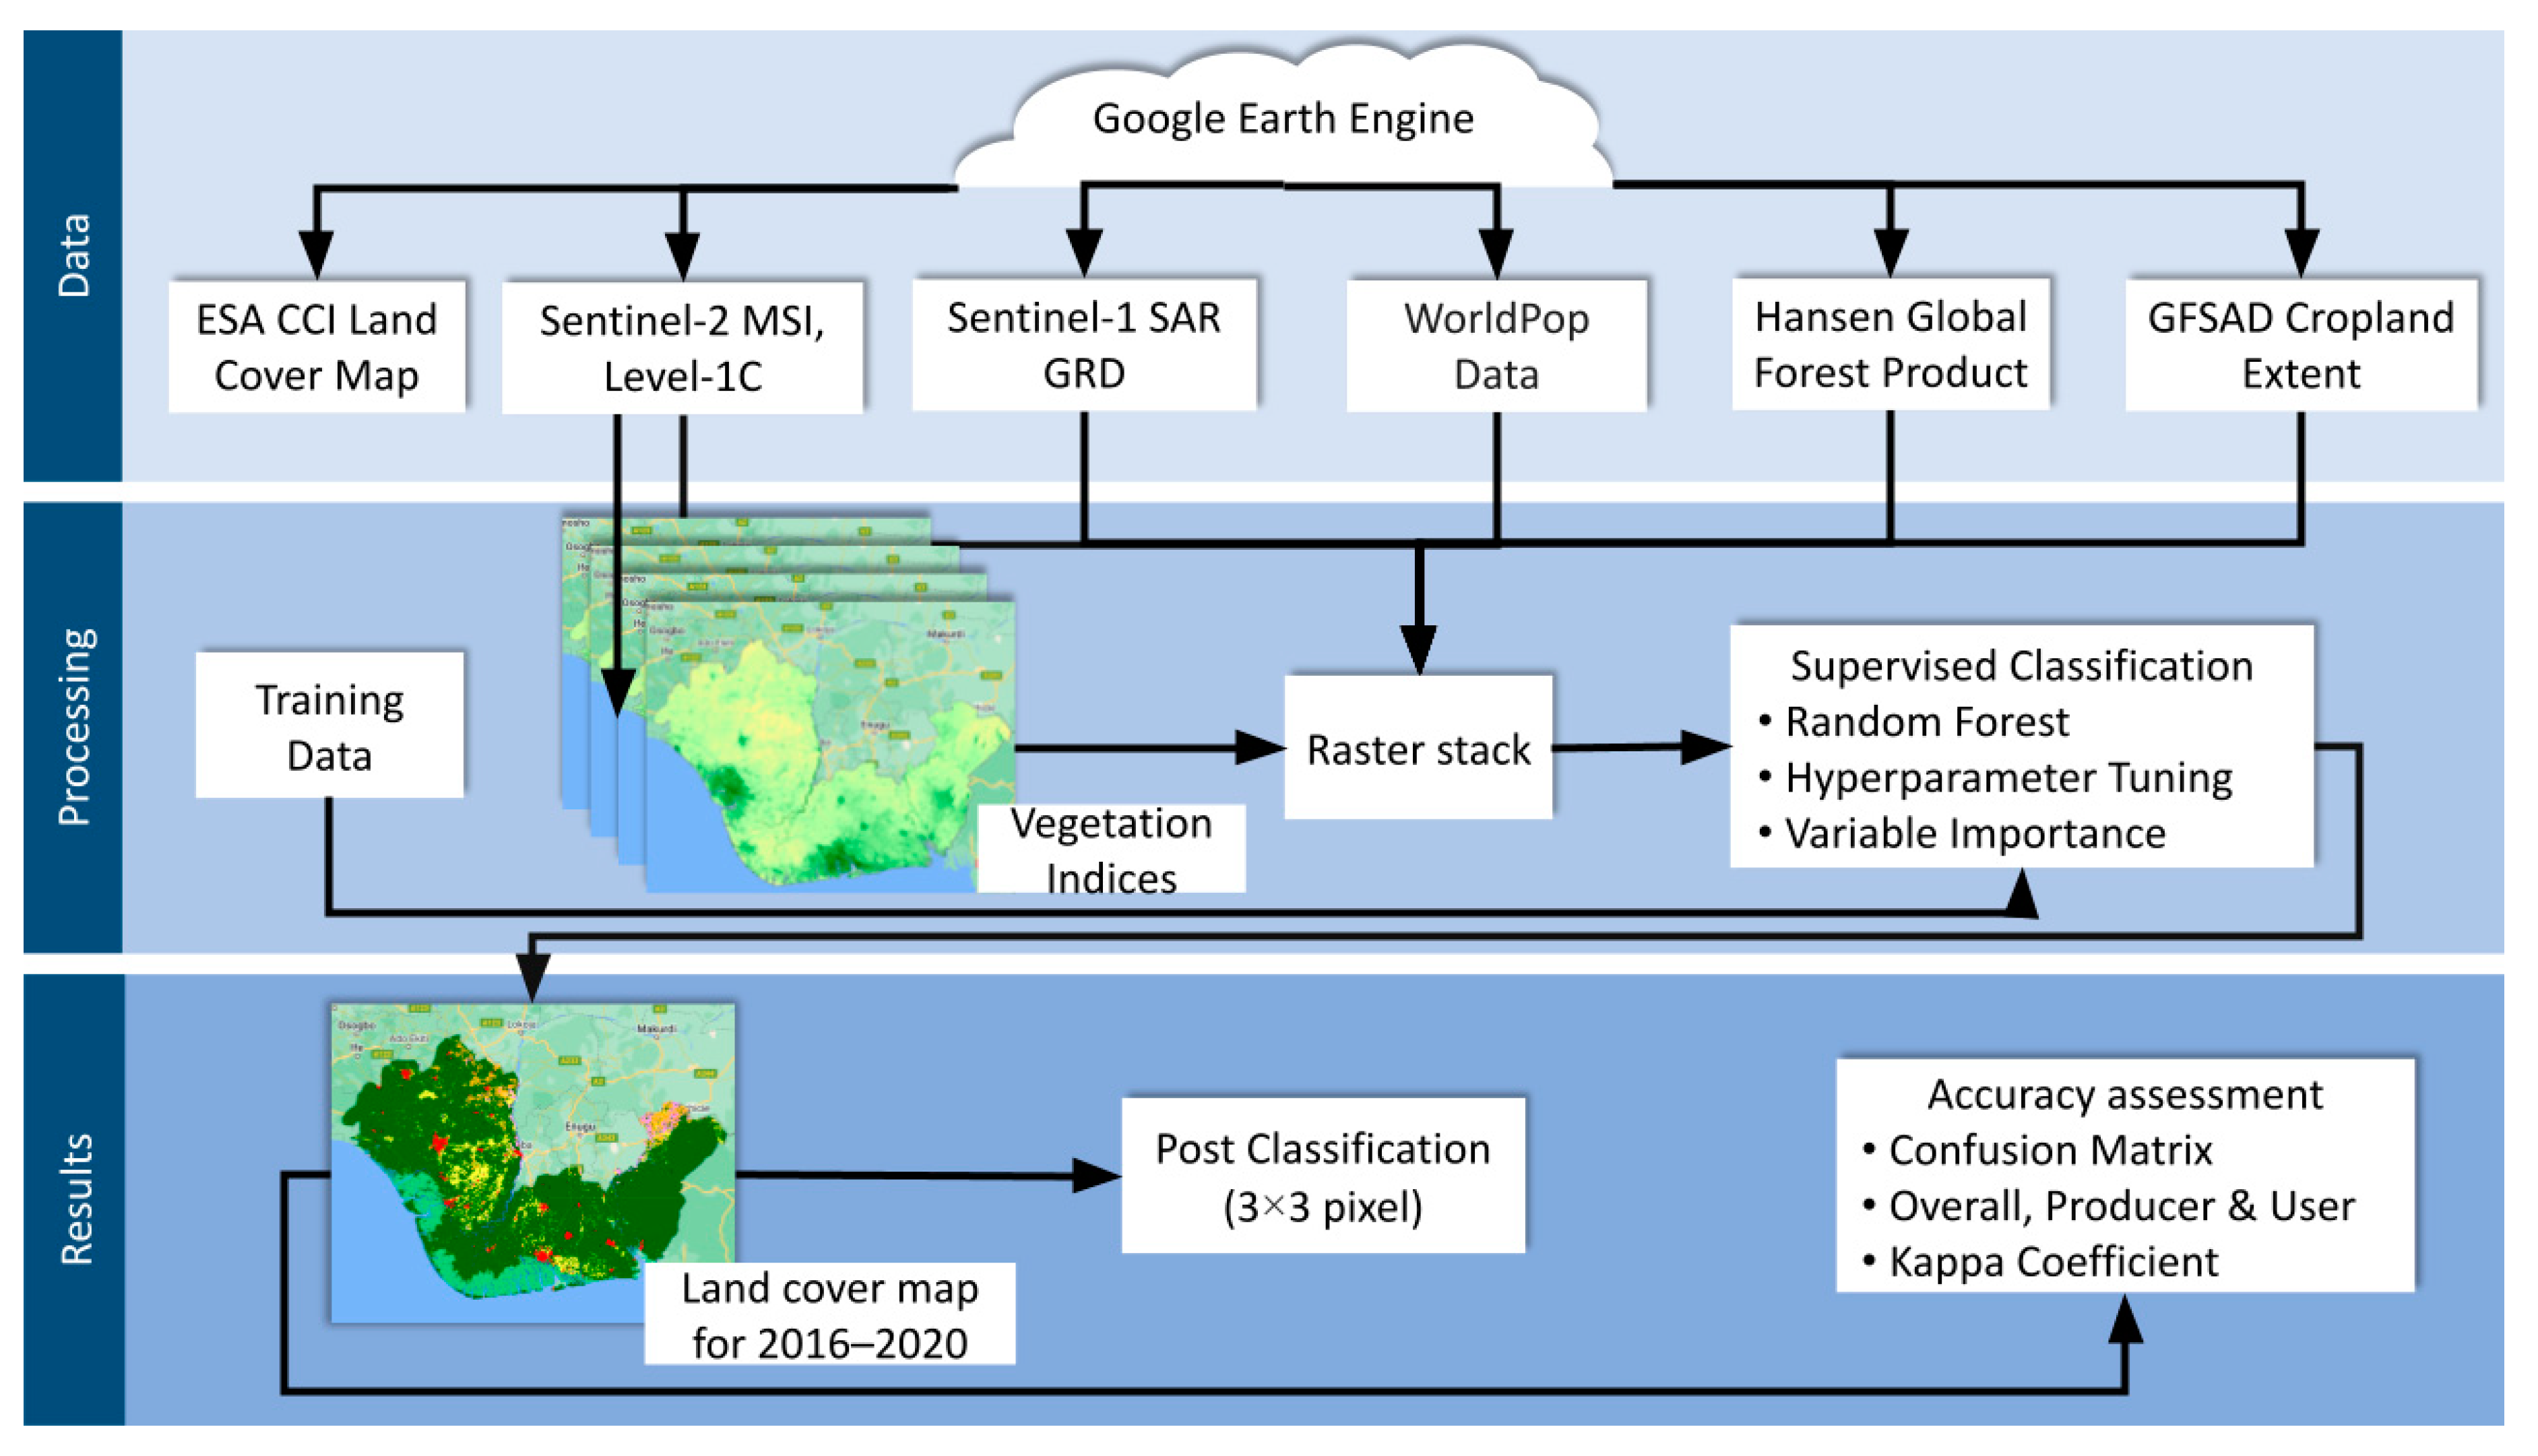
2.2. Data

| Data | Resolution | Year | Data Source |
|---|---|---|---|
| European Space Agency Climate Change Initiative Land Cover 20 m Map of Africa | 20 m | 2016 | [64] |
| Sentinel-2 MSI, Level-1C | 10 m | 2016–2020 | [74] |
| Sentinel-1 Synthetic Aperture Radar Ground Range Detected | 10 m | 2016–2020 | [75] |
| WorldPop Global Project Population Data | 100 m | 2016–2020 | [67] |
| Hansen Global Forest Change v1.8 | 30 m | 2016–2020 | [68] |
| Global Food Security-support Analysis Data Cropland Extent of Africa | 30 m | 2015 | [69] |
| RESOLVE Ecoregions | - | 2017 | [71] |
| World Database on Protected Areas | - | 2021 | [49] |
| Species occurrence data | - | 2010–2021 | [72] |
| Oil spill incident data | - | 2016–2020 | [73] |
2.3. Methods
2.3.1. Vegetation Indices for Remote Sensing
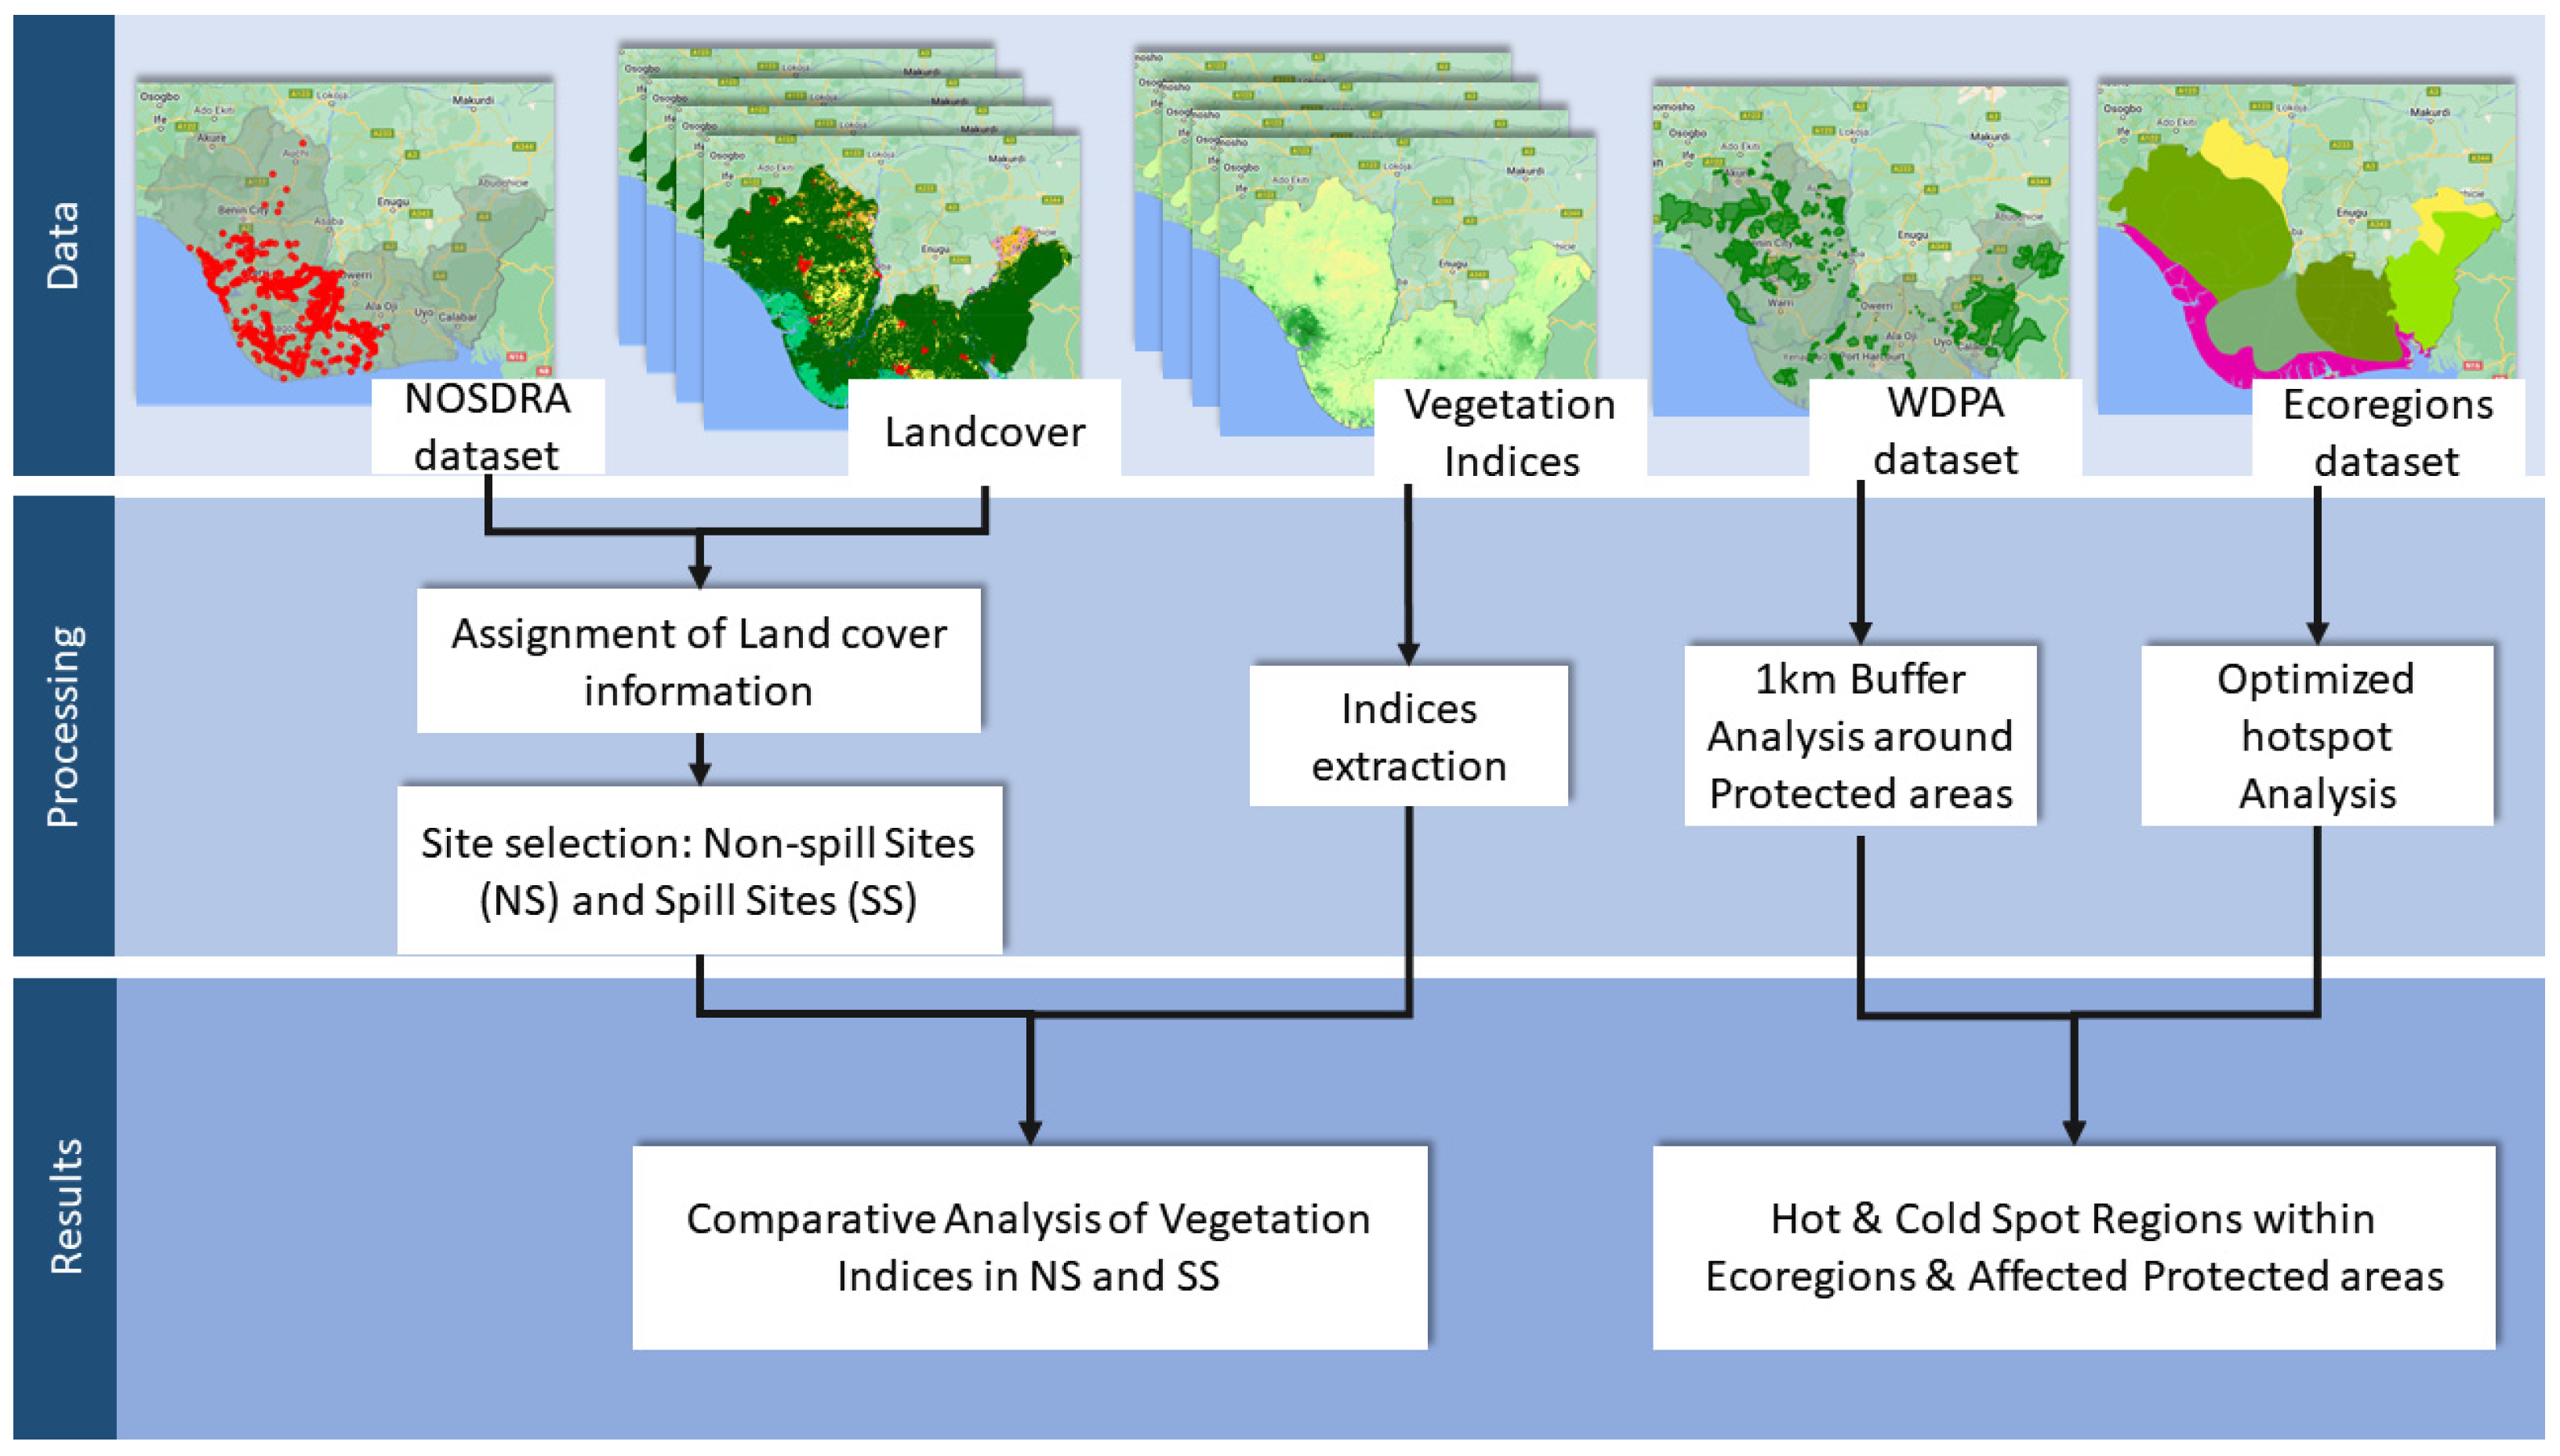
2.3.2. Assessing the Impact of Oil Spills on Land Cover
2.3.3. Assessing the Impact of Oil Spills on Biodiversity Areas
3. Results
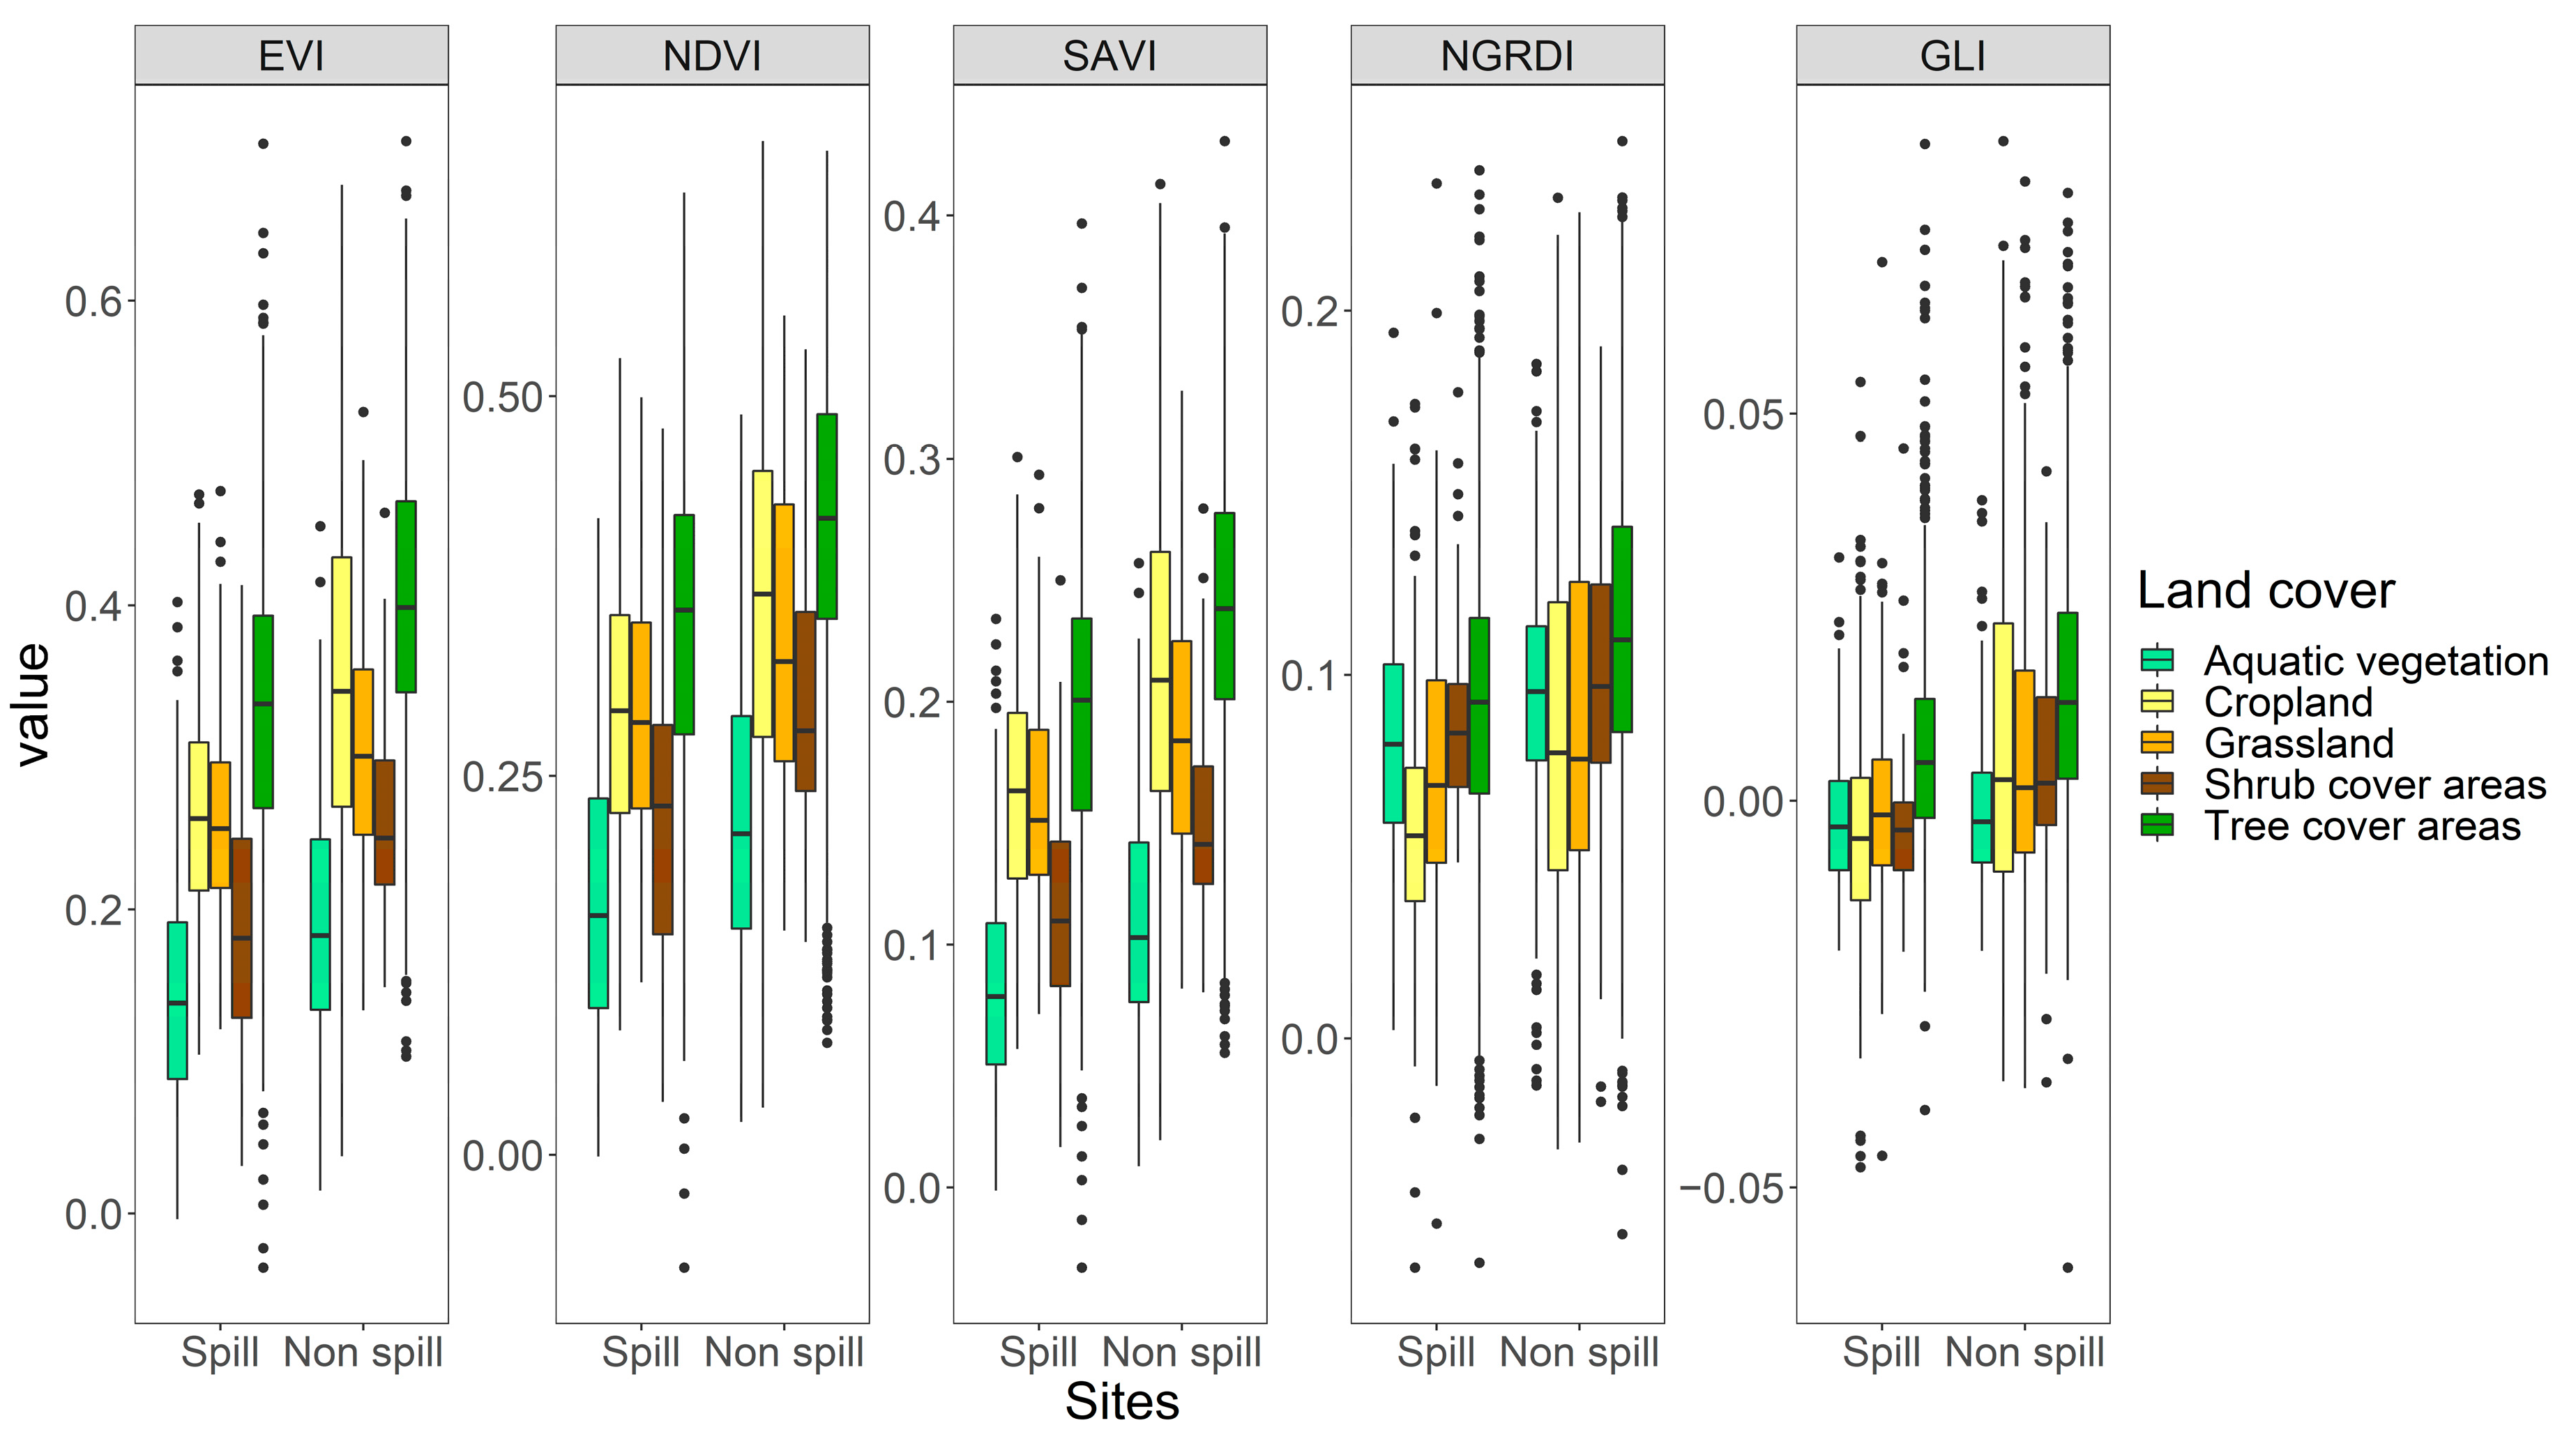
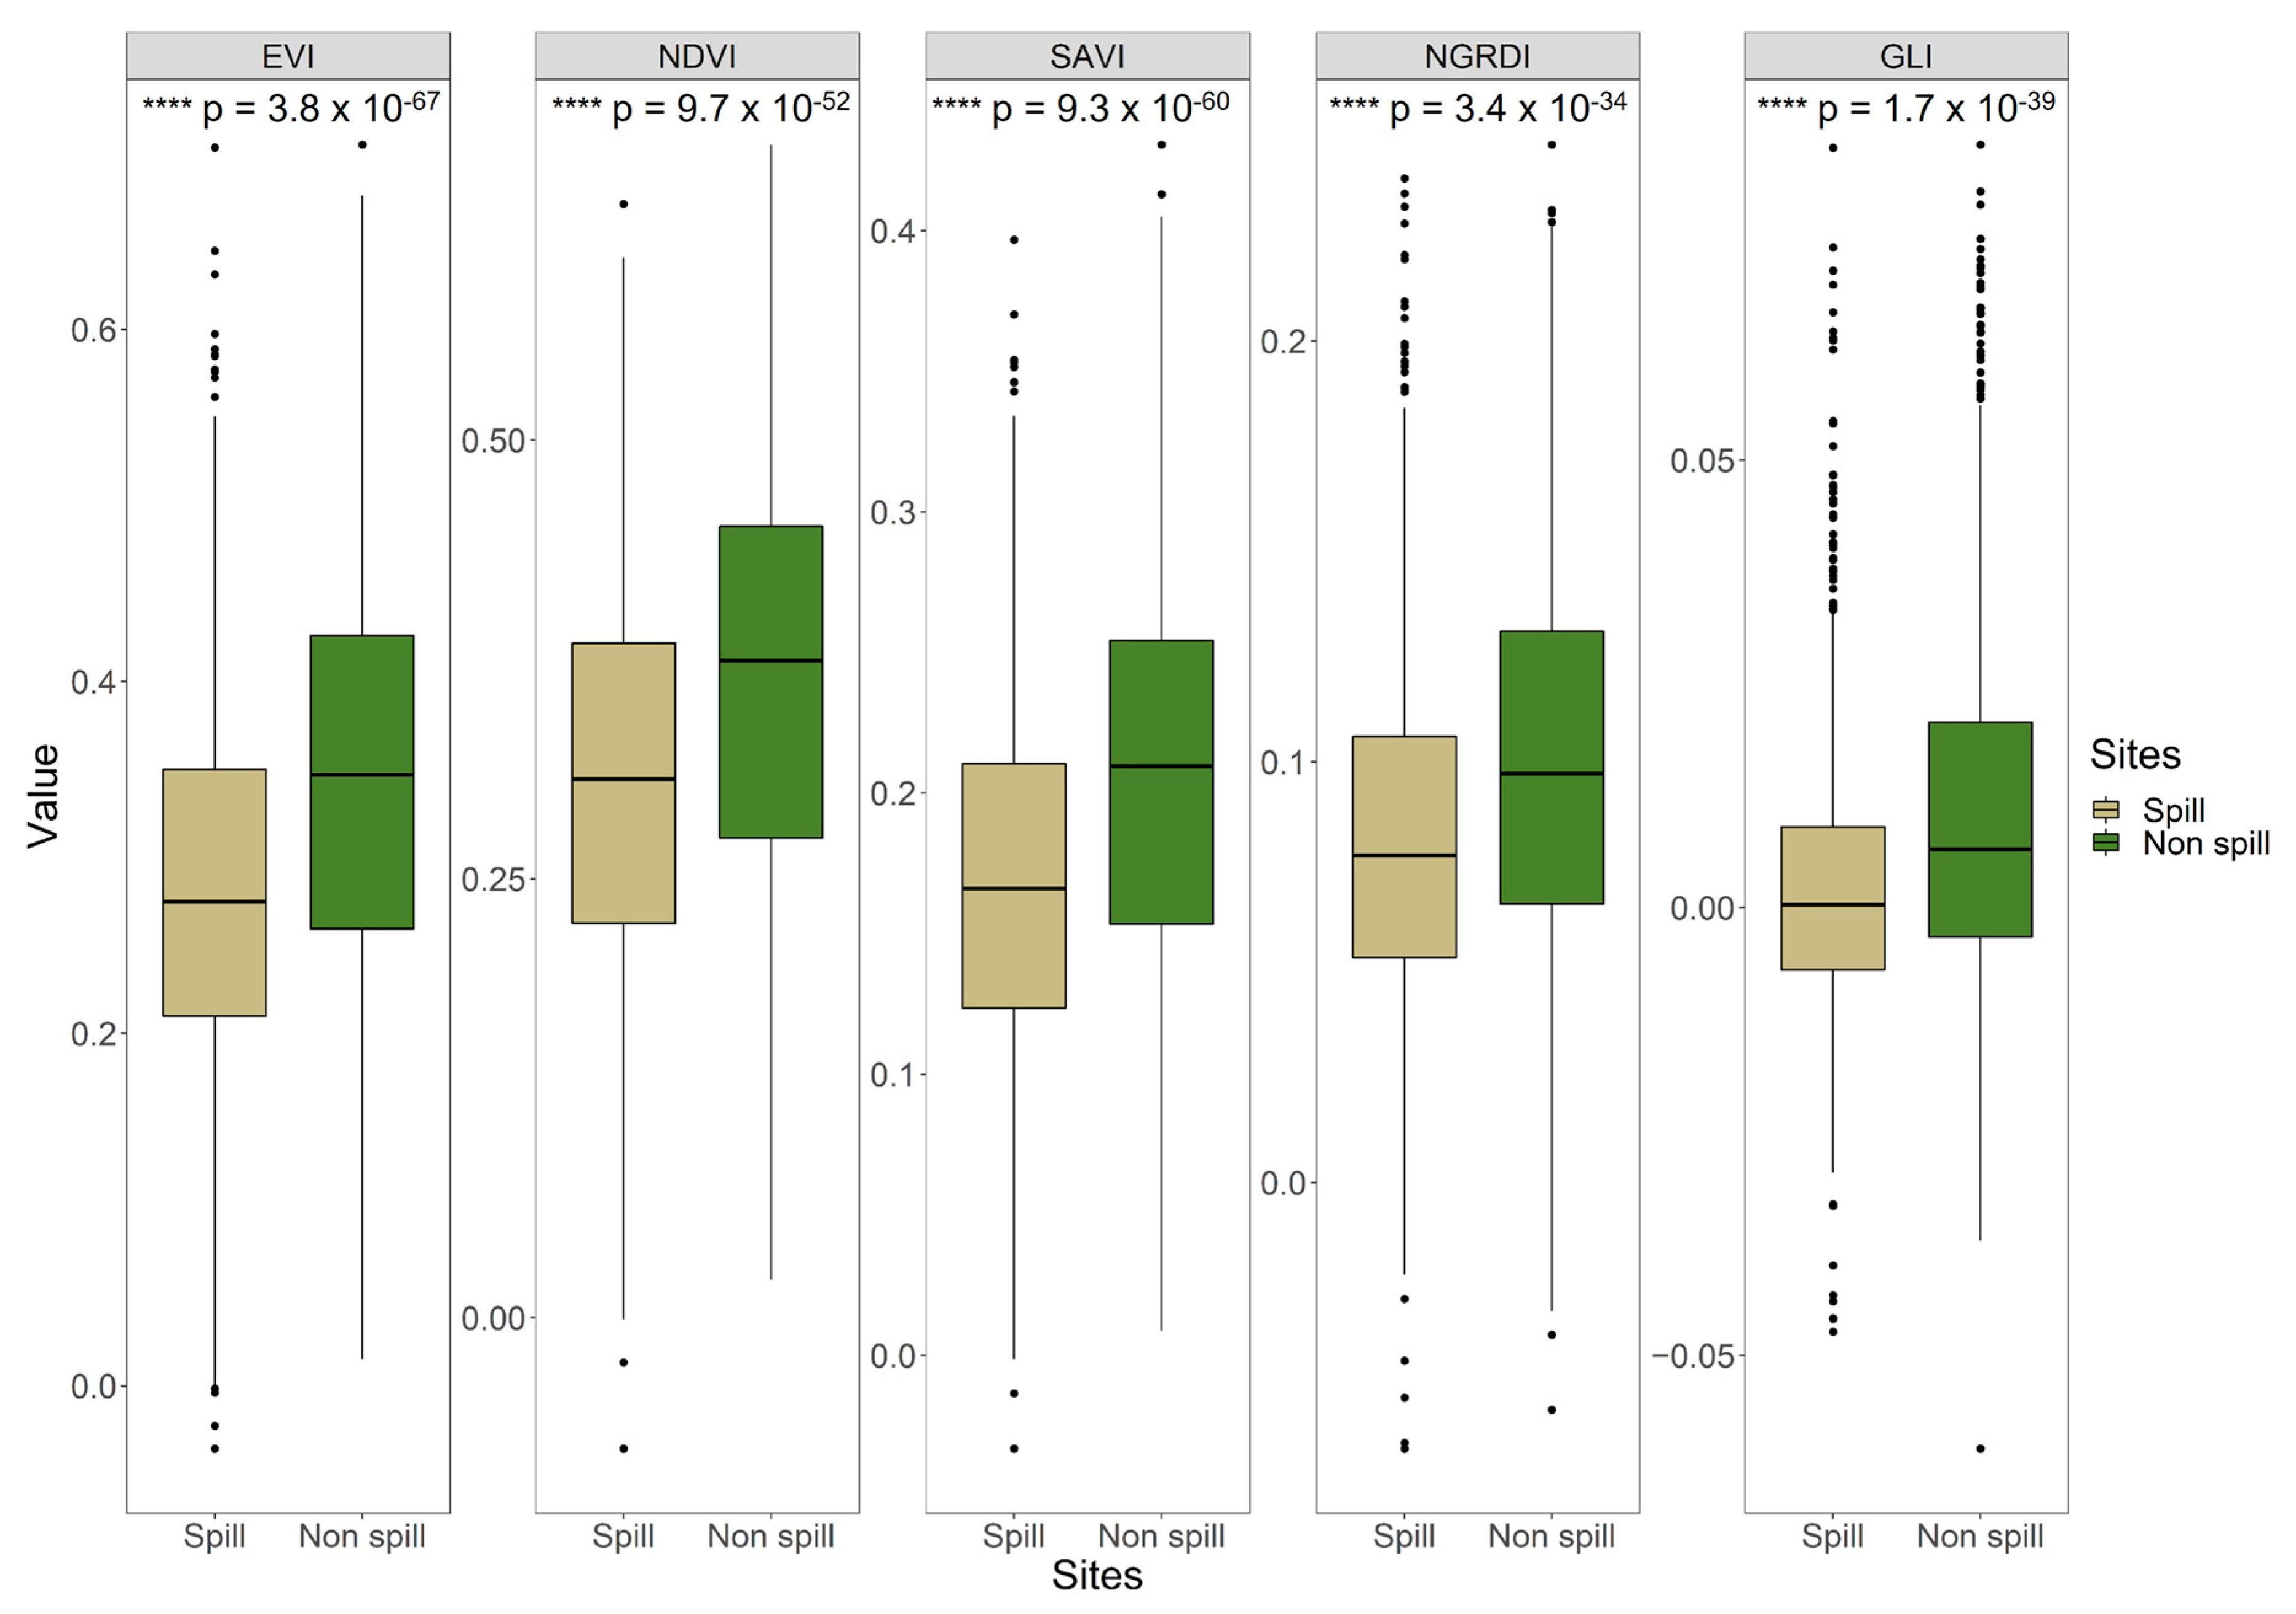
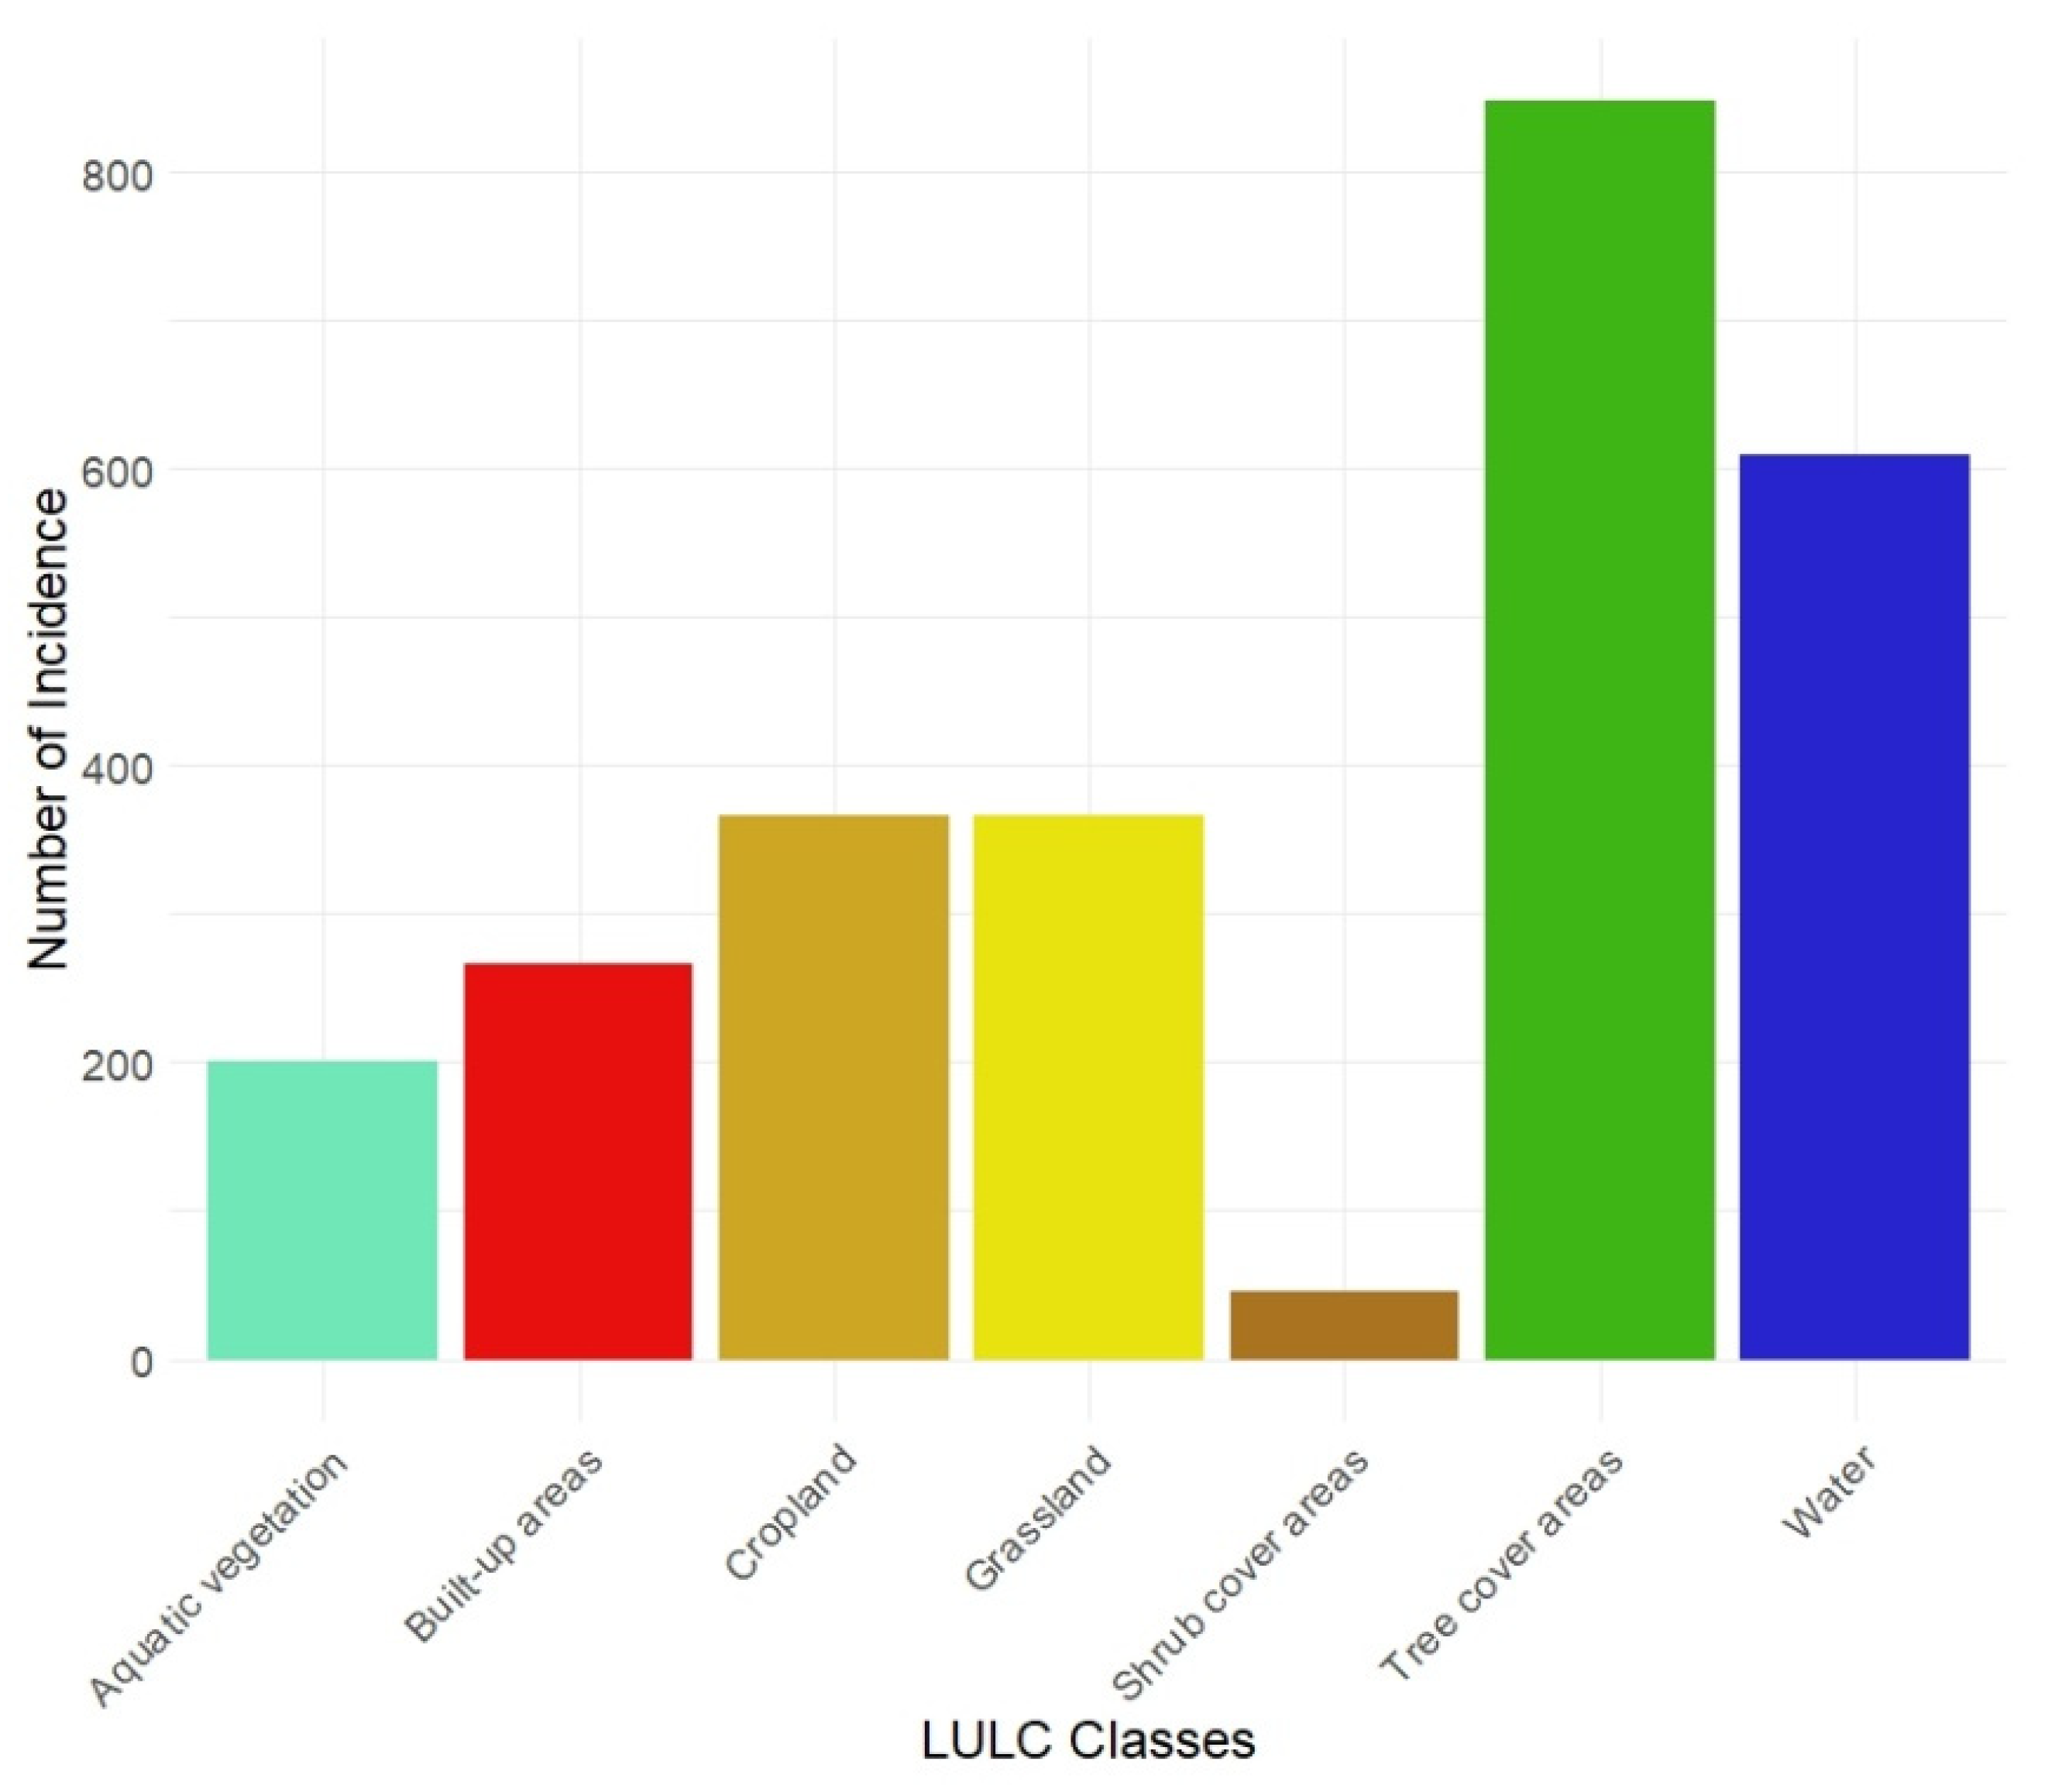
3.1. Vegetation Indices and Land Cover Types Affected by Oil Spills
3.2. Hotspots of Oil Spills and Threatened Biodiversity
4. Discussion
4.1. Performance of Vegetation Indices
4.2. Oil Spills as a Threat for a Biodiversity Hotspot
4.3. Implications for Nature Conservation and Environmental Policy
5. Conclusions
Author Contributions
Funding
Institutional Review Board Statement
Informed Consent Statement
Data Availability Statement
Acknowledgments
Conflicts of Interest
Appendix A


References
- IUCN Niger Delta Panel. Sustainable remediation and rehabilitation of biodiversity and habitats of oil spill sites in the Niger Delta: Main report including recommendations for the future. In A Report by the Independent IUCN–Niger Delta Panel (IUCN–NDP) to the Shell Petroleum Development Company of Nigeria (SPDC); IUCN: Gland, Switzerland, 2013. [Google Scholar]
- Uluocha, N.O.I. Implications of wetlands degradation for water resources management: Lessons from Nigeria. GeoJournal 2004, 61, 151–154. [Google Scholar] [CrossRef]
- Feka, N.Z.; Ajonina, G.N. Drivers causing decline of mangrove in West-Central Africa: A review. Int. J. Biodivers. Sci. Ecosyst. Serv. Manag. 2011, 7, 217–230. [Google Scholar] [CrossRef]
- Kuenzer, C.; van Beijma, S.; Gessner, U.; Dech, S. Land surface dynamics and environmental challenges of the Niger Delta, Africa: Remote sensing-based analyses spanning three decades (1986–2013). Appl. Geogr. 2014, 53, 354–368. [Google Scholar] [CrossRef]
- Onyena, A.P.; Sam, K. A review of the threat of oil exploitation to mangrove ecosystem: Insights from Niger Delta, Nigeria. Glob. Ecol. Conserv. 2020, 22, e00961. [Google Scholar] [CrossRef]
- Okeke, E.B.; Obodoefuna, S.M.; Uddin, M.M.; Huang, L. Using Stakeholders’ Perception to Evaluate the Prospects of Establishing Marine Protected Areas in the Niger Delta Coastal Ecosystem. Coast. Manag. 2022, 50, 106–123. [Google Scholar] [CrossRef]
- Collins, N.C. Ugochukwu, Jürgen Ertel. Negative impacts of oil exploration on biodiversity management in the Niger Delta area of Nigeria. Impact Assess. Proj. Apprais. 2008, 26, 139–147. [Google Scholar]
- International Union for Conservation of Nature (IUCN). A Guide to the Convention to the Biological Diversity: Environmental Policy and Law Paper No. 30; International Union for Conservation of Nature (IUCN): Gland, Switzerland, 1992.
- Adekola, O.; Mitchell, G. The Niger Delta wetlands: Threats to ecosystem services, their importance to dependent communities and possible management measures. Int. J. Biodivers. Sci. Ecosyst. Serv. Manag. 2011, 7, 50–68. [Google Scholar] [CrossRef]
- Phil-Eze, P.O.; Okoro, I.C. Sustainable biodiversity conservation in the Niger Delta: A practical approach to conservation site selection. Biodivers Conserv. 2009, 18, 1247–1257. [Google Scholar] [CrossRef]
- Ozigis, M.S.; Kaduk, J.D.; Jarvis, C.H. Mapping terrestrial oil spill impact using machine learning random forest and Landsat 8 OLI imagery: A case site within the Niger Delta region of Nigeria. Environ. Sci. Pollut. Res. Int. 2019, 26, 3621–3635. [Google Scholar] [CrossRef]
- Avielele, L.O. The Relationship between Changes in Oil Price and the Currency Volatility in Nigeria and South Africa between 2009 and 2019. Ph.D. Thesis, National College of Ireland, Dublin, Ireland, 2020. [Google Scholar]
- BP. BP Statistical Review of World Energy; British Petroleum Co.: London, UK, 2021. [Google Scholar]
- United States Energy Information Administration (EIA). Country Analysis Brief: Nigeria; United States Energy Information Administration (EIA): Washington, DC, USA, 2016.
- Organization of the Petroleum Exporting Countries (OPEC). OPEC Annual Statistical Bulletin 2019; Organization of the Petroleum Exporting Countries (OPEC): Vienna, Austria, 2020. [Google Scholar]
- Oyeranmi, O.S. Crisis and reform in the Nigerian oil industry, 1999–2015. KIU J. Soc. Sci. 2020, 6, 275–288. [Google Scholar]
- Nweze, N.P.; Edame, G.E. An Empirical Investigation of Oil Revenue and Economic Growth in Nigeria. ESJ 2016, 12, 271. [Google Scholar] [CrossRef]
- American Association for the Advancement of Science (AAAS). Eyes on Nigeria: Technical Report. 2011. Available online: https://www.aaas.org/sites/default/files/AAAS_EyesOnNigeria_Technical_Report.pdf (accessed on 26 September 2022).
- Obida, C.B.; Alan Blackburn, G.; Duncan Whyatt, J.; Semple, K.T. Quantifying the exposure of humans and the environment to oil pollution in the Niger Delta using advanced geostatistical techniques. Environ. Int. 2018, 111, 32–42. [Google Scholar] [CrossRef]
- Agbonifo, P. Oil spills injustices in the Niger Delta region: Reflections on oil industry failure in relation to the United Nations Environment Programme (UNEP) Report. Int. J. Pet. Gas Explor. Manag. 2016, 2, 26–37. [Google Scholar]
- Ajibade, F.O.; Adelodun, B.; Lasisi, K.H.; Fadare, O.O.; Ajibade, T.F.; Nwogwu, N.A.; Sulaymon, I.D.; Ugya, A.Y.; Wang, H.C.; Wang, A. Environmental pollution and their socioeconomic impacts. In Chapter 25—Environmental Pollution and Their Socioeconomic Impacts: Woodhead Publishing Series in Food Science, Technology and Nutrition; Microbe Mediated Remediation of Environmental Contaminants; Elsevier: Amsterdam, The Netherlands, 2021; pp. 321–354. [Google Scholar]
- Centers for Disease Control and Prevention. Facts About Benzene. 2019. Available online: https://emergency.cdc.gov/agent/benzene/basics/facts.asp (accessed on 3 April 2022).
- Bruederle, A.; Hodler, R. The Effect of Oil Spills on Infant Mortality: Evidence from Nigeria. CESifo Working Paper Series No. 6653. 2017, pp. 1–6. Available online: https://papers.ssrn.com/sol3/papers.cfm?abstract_id=3043605 (accessed on 26 September 2022).
- Jha, M.N.; Levy, J.; Gao, Y. Advances in Remote Sensing for Oil Spill Disaster Management: State-of-the-Art Sensors Technology for Oil Spill Surveillance. Sensors 2008, 8, 236–255. [Google Scholar] [CrossRef]
- Oulefki, A.; Trongtirakul, T.; Agaian, S.S.; Chiracharit, W. Mobile Image Exploitation and Learning. In Mobile Multimedia/Image Processing, Security, and Applications 2020; Agaian Sos, S., Del Marco Stephen, P., Asari Vijayan, K., Eds.; SPIE: Bellingham, WA, USA, 2020; Volume 11399, pp. 131–142. [Google Scholar] [CrossRef]
- Xue, J.; Su, B. Significant Remote Sensing Vegetation Indices: A Review of Developments and Applications. J. Sens. 2017, 2017, 1353691. [Google Scholar] [CrossRef]
- Pisano, A.; Bignami, F.; Santoleri, R. Oil Spill Detection in Glint-Contaminated Near-Infrared MODIS Imagery. Remote Sens. 2015, 7, 1112–1134. [Google Scholar] [CrossRef]
- Xing, Q.; Li, L.; Lou, M.; Bing, L.; Zhao, R.; Li, Z. Observation of Oil Spills through Landsat Thermal Infrared Imagery: A Case of Deepwater Horizon. Aquat. Procedia 2015, 3, 151–156. [Google Scholar] [CrossRef]
- De Kerf, T.; Gladines, J.; Sels, S.; Vanlanduit, S. Oil Spill Detection Using Machine Learning and Infrared Images. Remote Sens. 2020, 12, 4090. [Google Scholar] [CrossRef]
- Chenault, D.B.; Vaden, J.P.; Mitchell, D.A.; De Micco, E.D. Remote Sensing of the Ocean, Sea Ice, Coastal Waters, and Large Water Regions 2016; Bostater, C.R., Mertikas, S.P., Neyt, X.N., Caroline, A.O., Eds.; SPIE: Edinburgh, UK, 2016. [Google Scholar]
- Fingas, M.; Brown, C. Review of oil spill remote sensing. Mar. Pollut. Bull. 2014, 83, 9–23. [Google Scholar] [CrossRef]
- Brekke, C.; Solberg, A.H. Oil spill detection by satellite remote sensing. Remote Sens. Environ. 2005, 95, 1–13. [Google Scholar] [CrossRef]
- Achard, V.; Foucher, P.-Y.; Dubucq, D. Hydrocarbon Pollution Detection and Mapping Based on the Combination of Various Hyperspectral Imaging Processing Tools. Remote Sens. 2021, 13, 1020. [Google Scholar] [CrossRef]
- Correa Pabón, R.E.; de Souza Filho, C.R.; de Oliveira, W.J. Reflectance and imaging spectroscopy applied to detection of petroleum hydrocarbon pollution in bare soils. Sci. Total Environ. 2019, 649, 1224–1236. [Google Scholar] [CrossRef]
- Viallefont-Robinet, F.; Roupioz, L.; Caillault, K.; Foucher, P.-Y. Remote sensing of marine oil slicks with hyperspectral camera and an extended database. J. Appl. Remote Sens. 2021, 15, 024504. [Google Scholar] [CrossRef]
- Huete, A.R. Remote sensing for environmental monitoring. In Environmental Monitoring and Characterization; Elsevier: Amsterdam, The Netherlands, 2004; pp. 183–206. [Google Scholar]
- Sims, D.A.; Gamon, J.A. Relationships between leaf pigment content and spectral reflectance across a wide range of species, leaf structures and developmental stages. Remote Sens. Environ. 2002, 81, 337–354. [Google Scholar] [CrossRef]
- Balogun, A.-L.; Yekeen, S.T.; Pradhan, B.; Althuwaynee, O.F. Spatio-Temporal Analysis of Oil Spill Impact and Recovery Pattern of Coastal Vegetation and Wetland Using Multispectral Satellite Landsat 8-OLI Imagery and Machine Learning Models. Remote Sens. 2020, 12, 1225. [Google Scholar] [CrossRef]
- Lassalle, G.; Fabre, S.; Credoz, A.; Hédacq, R.; Borderies, P.; Bertoni, G.; Erudel, T.; Buffan-Dubau, E.; Dubucq, D.; Elger, A. Detection and discrimination of various oil-contaminated soils using vegetation reflectance. Sci. Total Environ. 2019, 655, 1113–1124. [Google Scholar] [CrossRef] [PubMed]
- Onyia, N.; Balzter, H.; Berrio, J.-C. Normalized Difference Vegetation Vigour Index: A New Remote Sensing Approach to Biodiversity Monitoring in Oil Polluted Regions. Remote Sens. 2018, 10, 897. [Google Scholar] [CrossRef]
- Ite, A.E.; Ibok, U.J.; Ite, M.U.; Petters, S.W. Petroleum Exploration and Production: Past and Present Environmental Issues in the Nigeria’s Niger Delta. ENV 2013, 1, 78–90. [Google Scholar] [CrossRef]
- National Bureau of Statistics. A Publication of Demographic Statistics Division. 2021. Available online: https://nigerianstat.gov.ng/elibrary/read/1241207 (accessed on 1 April 2022).
- UN Environment Program—World Conservation Monitoring Center (One Earth. UNEP-WCMC). Central African Mangroves. Available online: https://www.oneearth.org/ecoregions/central-african-mangroves (accessed on 3 April 2022).
- UN Environment Program—World Conservation Monitoring Center (One Earth. UNEP-WCMC). Cross Niger Transition Forests. Available online: https://www.oneearth.org/ecoregions/cross-niger-transition-forests (accessed on 3 April 2022).
- UN Environment Program—World Conservation Monitoring Center (One Earth. UNEP-WCMC). Cross-Sanaga-Bioko Coastal Forests. Available online: https://www.oneearth.org/ecoregions/cross-sanaga-bioko-coastal-forests (accessed on 3 April 2022).
- World Wildlife Fund (WWF). Gorillas—Cross River Gorillas. Available online: https://www.worldwildlife.org/species/cross-river-gorilla (accessed on 3 April 2022).
- UN Environment Program—World Conservation Monitoring Center (One Earth. UNEP-WCMC). Guinean Forest-Savanna. Available online: https://www.oneearth.org/ecoregions/guinean-forest-savanna (accessed on 3 April 2022).
- UN Environment Program—World Conservation Monitoring Center (One Earth. UNEP-WCMC). Nigerian Lowland Forests. Available online: https://www.oneearth.org/ecoregions/nigerian-lowland-forests (accessed on 3 April 2022).
- Protected Planet. Discover the World’s Protected Areas. Available online: https://www.protectedplanet.net/en (accessed on 3 April 2022).
- International Union for Conservation of Nature (IUCN). Guidelines For Applying Protected Area Management Categories; IUCN: Gland, Switzerland, 2008; ISBN 978-2-8317-1086-0. [Google Scholar]
- Ramsar. About the Convention on Wetlands. Available online: https://www.ramsar.org (accessed on 3 April 2022).
- Ramsar. Ramsar Sites Information Service. Apoi Creek Forests. Available online: https://rsis.ramsar.org/ris/1751 (accessed on 3 April 2022).
- United Nations Educational, Scientific and Cultural Organization (UNESCO). Man and the Biosphere (MAB) Programme. Available online: https://en.unesco.org/mab (accessed on 3 April 2022).
- United Nations Educational, Scientific and Cultural Organization (UNESCO). Biosphere reserves in Africa. Available online: https://en.unesco.org/biosphere/africa (accessed on 3 April 2022).
- Shittu, W.J.; Nahanail, C.P.; Abrahart, R.J. Generic mapping of human activity-based exposure scenarios to petroleum hydrocarbon contaminants in an oil producing area of the Niger Delta region of Nigeria. In Environmental Health and Biomedicine; Brebbia, C.A., Eglite, M., Knets, I., Miftahof, R., Popov, V., Eds.; WIT Press: Southampton, UK; Volume 15, pp. 79–80.
- National Petroleum Investment Management Services. Crude Oil Reserves/Production. Available online: https://napims.nnpcgroup.com/Pages/Crude-Oil-Reserves-Production.aspx (accessed on 3 April 2022).
- Edna Ateboh, P.; Raimi, M.O. Corporate Civil Liability and Compensation Regime for Environmental Pollution in the Niger Delta. Int. J. Recent Adv. Multidiscip. Res. 2018, 5, 3870–3893. [Google Scholar]
- Twum, A. Environmental Impact of Oil and Gas Exploration and Production on the Socio-Economic Life of Niger Delta. Ph.D. Thesis, African University of Science and Technology, Abuja, Nigeria, 2019. [Google Scholar]
- Onuoha, F.C. Oil pipeline sabotage in Nigeria: Dimensions, actors and implications for national security. Afr. Secur. Rev. 2008, 17, 99–115. [Google Scholar] [CrossRef]
- The Guardian. How Nigeria Lost $42b to Oil Theft in 10 Years. Available online: https://guardian.ng/news/how-nigeria-lost-42b-to-oil-theft-in-10-years (accessed on 2 September 2021).
- Akinwumiju, A.S.; Adelodun, A.A.; Ogundeji, S.E. Geospatial assessment of oil spill pollution in the Niger Delta of Nigeria: An evidence-based evaluation of causes and potential remedies. Environ. Pollut. 2020, 267, 115545. [Google Scholar] [CrossRef]
- Benedict, A.O. Tragedy of Commons: Analysis of Oil Spillage, Gas Flaring and Sustainable Development of the Niger Delta of Nigeria. JSD 2011, 4, 200–210. [Google Scholar] [CrossRef]
- International Union for Conservation of Nature (IUCN). The IUCN Red List of Threatened Species. Available online: https://www.iucnredlist.org (accessed on 16 November 2021).
- European Space Agency (ESA) Climate Change Initiative (CCI). Land Cover 20m Map of Africa. Available online: https://www.esa.int/ESA_Multimedia/Images/2017/10/African_land_cover (accessed on 3 April 2022).
- Ghorbanian, A.; Kakooei, M.; Amani, M.; Mahdavi, S.; Mohammadzadeh, A.; Hasanlou, M. Improved land cover map of Iran using Sentinel imagery within Google Earth Engine and a novel automatic workflow for land cover classification using migrated training samples. ISPRS J. Photogramm. Remote Sens. 2020, 167, 276–288. [Google Scholar] [CrossRef]
- Ja’afaru, S.W. Mapping Oil Spill Human Health Risk in Rivers State Niger Delta Nigeria. Ph.D. Thesis, University of Nottingham, Nottingham, UK, 2014. [Google Scholar]
- WorldPop. Open Spatial Demographic Data and Research. Available online: https://www.worldpop.org (accessed on 1 August 2021).
- Hansen, M.C.; Potapov, P.V.; Moore, R.; Hancher, M.; Turubanova, S.A.; Tyukavina, A.; Thau, D.; Stehman, S.V.; Goetz, S.J.; Loveland, T.R.; et al. High-resolution global maps of 21st-century forest cover change. Science 2013, 342, 850–853. [Google Scholar] [CrossRef]
- Teluguntla, P.; Thenkabail, P.; Xiong, J.; Gumma, M.K.; Giri, C.; Milesi, C.; Ozdogan, M.; Congalton, R.G.; Tilton, J.; Sankey, T.T.; et al. Global Food Security Support Analysis Data at Nominal 1 km (GFSAD1km) Derived from Remote Sensing in Support of Food Security in the Twenty-First Century: Current Achievements and Future Possibilities; CRC Press: Boca Raton, FL, USA, 2015. [Google Scholar]
- Xiong, J.; Thenkabail, P.; Tilton, J.; Gumma, M.; Teluguntla, P.; Congalton, R.; Yadav, K.; Dungan, J.; Oliphant, A.; Poehnelt, J.; et al. NASA Making Earth System Data Records for Use in Research Environments (MEaSUREs) Global Food Security-Support Analysis Data (GFSAD) Cropland Extent 2015 Africa 30 m V001. 2017. Available online: http://oar.icrisat.org/10981/ (accessed on 1 May 2022).
- Dinerstein, E.; Olson, D.; Joshi, A.; Vynne, C.; Burgess, N.D.; Wikramanayake, E.; Hahn, N.; Palminteri, S.; Hedao, P.; Noss, R.; et al. An Ecoregion-Based Approach to Protecting Half the Terrestrial Realm. Bioscience 2017, 67, 534–545. [Google Scholar] [CrossRef]
- Global Biodiversity Information Facility (GBIF). GBIF Home Page. Available online: https://www.gbif.org (accessed on 6 October 2021).
- National Oil Spill Detection and Response Agency (NOSDRA). Nigerian Oil Spill Monitor. Available online: https://oilspillmonitor.ng (accessed on 1 July 2021).
- European Space Agency. Google Earth Engine repository S2 MSI L-1C: The European Space Agency: Sentinel Online, User Guide. Available online: https://sentinels.copernicus.eu/web/sentinel/user-guides/sentinel-2-msi/product-types/level-1c (accessed on 6 October 2021).
- European Space Agency. S1 SAR GRD: The European Space Agency: Sentinel Online, User Guide. Available online: https://sentinels.copernicus.eu/web/sentinel/user-guides/sentinel-1-sar/overview (accessed on 6 October 2021).
- Fang, H.; Liang, S. Leaf Area Index Models. In Reference Module in Earth Systems and Environmental Sciences; Elsevier: Amsterdam, The Netherlands, 2014. [Google Scholar]
- Munnaf, M.A.; Haesaert, G.; van Meirvenne, M.; Mouazen, A.M. Site-Specific Seeding Using Multi-Sensor and Data Fusion Techniques: A Review; Elsevier: Amsterdam, The Netherlands, 2020; Volume 161, pp. 241–323. [Google Scholar]
- Mishra, D.R.; Cho, H.J.; Ghosh, S.; Fox, A.; Downs, C.; Merani, P.B.; Kirui, P.; Jackson, N.; Mishra, S. Post-spill state of the marsh: Remote estimation of the ecological impact of the Gulf of Mexico oil spill on Louisiana Salt Marshes. Remote Sens. Environ. 2012, 118, 176–185. [Google Scholar] [CrossRef]
- Susantoro, T.M.; Wikantika, K.; Saepuloh, A.; Harsolumakso, A.H. Utilization of Vegetation Indices to Interpret the Possibility of Oil and Gas Microseepages at Ground Surface. IOP Conf. Ser. Earth Environ. Sci. 2018, 145, 12012. [Google Scholar] [CrossRef]
- Cruden, B.A.; Prabhu, D.; Martinez, R. Absolute Radiation Measurement in Venus and Mars Entry Conditions. J. Spacecr. Rocket. 2012, 49, 1069–1079. [Google Scholar] [CrossRef]
- Bin Abdul Rahim, H.R.; Bin Lokman, M.Q.; Harun, S.W.; Hornyak, G.L.; Sterckx, K.; Mohammed, W.S.; Dutta, J. Applied light-side coupling with optimized spiral-patterned zinc oxide nanorod coatings for multiple optical channel alcohol vapor sensing. J. Nanophoton 2016, 10, 36009. [Google Scholar] [CrossRef]
- Adamu, B.; Tansey, K.; Ogutu, B. Using vegetation spectral indices to detect oil pollution in the Niger Delta. Remote Sens. Lett. 2015, 6, 145–154. [Google Scholar] [CrossRef]
- Mahajan, U.; Bundel, B.R. Drones for normalized difference vegetation index (NDVI), to estimate crop health for precision agriculture: A cheaper alternative for spatial satellite sensors. In Proceedings of the International Conference on Innovative Research in Agriculture, Food Science, Forestry, Horticulture, Aquaculture, Animal Sciences, Biodiversity, Ecological Sciences and Climate Change (AFHABEC-2016), Delhi, India, 31 October–1 November 2016. [Google Scholar]
- Shanmugapriya, P.; Rathika, S.; Ramesh, T.; Janaki, P. Applications of Remote Sensing in Agriculture—A Review. Int. J. Curr. Microbiol. App. Sci. 2019, 8, 2270–2283. [Google Scholar] [CrossRef]
- Zea, M.; Souza, A.; Yang, Y.; Lee, L.; Nemali, K.; Hoagland, L. Leveraging high-throughput hyperspectral imaging technology to detect cadmium stress in two leafy green crops and accelerate soil remediation efforts. Environ. Pollut. 2022, 292, 118405. [Google Scholar] [CrossRef] [PubMed]
- Pettorelli, N.; Vik, J.O.; Mysterud, A.; Gaillard, J.-M.; Tucker, C.J.; Stenseth, N.C. Using the satellite-derived NDVI to assess ecological responses to environmental change. Trends Ecol. Evol. 2005, 20, 503–510. [Google Scholar] [CrossRef] [PubMed]
- Huete, A. A soil-adjusted vegetation index (SAVI). Remote Sens. Environ. 1988, 25, 295–309. [Google Scholar] [CrossRef]
- Tucker, C.J. Red and photographic infrared linear combinations for monitoring vegetation. Remote Sens. Environ. 1979, 8, 127–150. [Google Scholar] [CrossRef]
- Louhaichi, M.; Borman, M.M.; Johnson, D.E. Spatially Located Platform and Aerial Photography for Documentation of Grazing Impacts on Wheat. Geocarto Int. 2001, 16, 65–70. [Google Scholar] [CrossRef]
- Huete, A.; Didan, K.; Miura, T.; Rodriguez, E.; Gao, X.; Ferreira, L. Overview of the radiometric and biophysical performance of the MODIS vegetation indices. Remote Sens. Environ. 2002, 83, 195–213. [Google Scholar] [CrossRef]
- Getis, A.; Ord, J.K. The Analysis of Spatial Association by Use of Distance Statistics. Geogr. Anal. 1992, 24, 189–206. [Google Scholar] [CrossRef]
- Ord, J.K.; Getis, A. Local Spatial Autocorrelation Statistics: Distributional Issues and an Application. Geogr. Anal. 1995, 27, 286–306. [Google Scholar] [CrossRef]
- Manepalli, U.R.R.; Bham, G.H.; Kandada, S. Evaluation of Hot-Spots Identification Using Kernel Density estimation and Getis-ord on I-630. In Proceedings of the 3rd International Conference on Road Safety and Simulation, Indianapolis, IN, USA, 14–16 September 2011. [Google Scholar]
- National Aeronautics and Space Administration (NASA). NASA Science: Reflected Near-Infrared Waves. Available online: https://science.nasa.gov/ems/08_nearinfraredwaves (accessed on 11 October 2022).
- Rieser, J.; Veste, M.; Thiel, M.; Schönbrodt-Stitt, S. Coverage and Rainfall Response of Biological Soil Crusts Using Multi-Temporal Sentinel-2 Data in a Central European Temperate Dry Acid Grassland. Remote Sens. 2021, 13, 3093. [Google Scholar] [CrossRef]
- United Nations Environment Programme (UNEP). Environmental Assessment of Ogoniland: Site Factsheets: Executive Summary and Full Report; United Nations Environment Programme (UNEP): Nairobi, Kenya, 2011. [Google Scholar]
- Bulgarelli, B.; Djavidnia, S. On MODIS Retrieval of Oil Spill Spectral Properties in the Marine Environment. IEEE Geosci. Remote Sens. Lett. 2012, 9, 398–402. [Google Scholar] [CrossRef]
- Adamo, M.; de Carolis, G.; de Pasquale, V.; Pasquariello, G. Detection and tracking of oil slicks on sun-glittered visible and near infrared satellite imagery. Int. J. Remote Sens. 2009, 30, 6403–6427. [Google Scholar] [CrossRef]
- Nwobi, C.; Williams, M.; Mitchard, E.T.A. Rapid Mangrove Forest Loss and Nipa Palm (Nypa fruticans) Expansion in the Niger Delta, 2007–2017. Remote Sens. 2020, 12, 2344. [Google Scholar] [CrossRef]
- International Union for Conservation of Nature (IUCN). Developing a Biodiversity Conservation Strategy for the Niger Delta: Integrating Biodiversity Considerations into SPDC’s Operations; International Union for Conservation of Nature (IUCN): Gland, Switzerland, 2018.
- Abdulaziz, H.; Johar, F.; Majid, M.R.; Medugu, N.I. Protected area management in Nigeria: A review. J. Teknol. 2015, 77, 6526. [Google Scholar] [CrossRef][Green Version]
- Linder, J.M.; Cronin, D.T.; Ting, N.; Abwe, E.E.; Davenport, T.R.B.; Detwiler, K.; Galat, G.; Galat-Luong, A.; Hart, J.; Ikemeh, R.A.; et al. Red colobus (Piliocolobus) Conservation Action Plan 2021–2026; IUCN: Gland, Switzerland, 2021.
- Ogunkoya, O.O. Information Sheet on Ramsar Wetlands (RIS)—2006-2008 Version; Upper Orashi Forests, Nigeria; Ramsar Convention Bureau: Gland, Switzerland, 2007. [Google Scholar]
- Aroh, K.N.; Ubong, I.U.; Eze, C.L.; Harry, I.M.; Umo-Otong, J.C.; Gobo, A.E. Oil spill incidents and pipeline vandalization in Nigeria. Disaster Prev. Manag. Int. J. 2010, 19, 70–87. [Google Scholar] [CrossRef]
- Jensen, J.R.; Halls, J.N.; Michel, J. A systems approach to Environmental Sensitivity Index (ESI) mapping for oil spill contingency planning and response. Photogramm. Eng. Remote Sens. 1998, 64, 1003–1014. [Google Scholar]


| Name | Abbreviation | Equation | Reference |
|---|---|---|---|
| Enhanced Vegetation Index | EVI | 2.5(NIR − Red)/(NIR + C1·Red − C2·Blue + LE) | [90] |
| Green Leaf Index | GLI | (2·Gren − Red − Blue)/(2·Green + Red + Blue) | [89] |
| Normalized Difference Vegetation Index | NDVI | (NIR − Red)/(NIR + Red) | [88] |
| Normalized Green Red Difference Index | NGRDI | (Green − Red)/(Green + Red) | [88] |
| Soil Adjusted Vegetation Index | SAVI | (1 + LS) (NIR − Red)/(NIR + Red + LS) | [87] |
| Hotspot Regions of Oil Spills | |||
|---|---|---|---|
| Species names | Highly Clustered Spills (9.62 < Z-Score ≤ 17.33) | Medium Clustered Spills (6.34 < Z-Score ≤ 9.62) | Low Clustered Spills (3.83 < Z-Score ≤ 6.34) |
| Sclater’s Monkey (Cercopithecus sclateri, EN) | Calabar Angwantibo (Arctocebus calabarensis, NT) | Western Red Colobus (Procolobus badius, CR) | |
| Hooded Vulture (Necrosyrtes monachus, CR) | Putty-Nosed monkey (Cercopithecus nictitans, NT) | Poto (Perodicticus potto, NT) | |
| Sclater’s Monkey (Cercopithecus sclateri, EN) | Red-Bellied Monkey (Cercopithecus erythrogaster, EN) | ||
| Red-Bellied Monkey (Cercopithecus erythrogaster, EN) | Sclater’s Monkey (Cercopithecus sclateri, EN) | ||
| Hooded Vulture (Necrosyrtes monachus, CR) | Mona Monkey (Cercopithecus mona, NT) | ||
| Poto (Perodicticus potto, NT) | |||
| Bioko Squirrel Galago (Sciurocheirus alleni, NT) | |||
Publisher’s Note: MDPI stays neutral with regard to jurisdictional claims in published maps and institutional affiliations. |
© 2022 by the authors. Licensee MDPI, Basel, Switzerland. This article is an open access article distributed under the terms and conditions of the Creative Commons Attribution (CC BY) license (https://creativecommons.org/licenses/by/4.0/).
Share and Cite
Ansah, C.E.; Abu, I.-O.; Kleemann, J.; Mahmoud, M.I.; Thiel, M. Environmental Contamination of a Biodiversity Hotspot—Action Needed for Nature Conservation in the Niger Delta, Nigeria. Sustainability 2022, 14, 14256. https://doi.org/10.3390/su142114256
Ansah CE, Abu I-O, Kleemann J, Mahmoud MI, Thiel M. Environmental Contamination of a Biodiversity Hotspot—Action Needed for Nature Conservation in the Niger Delta, Nigeria. Sustainability. 2022; 14(21):14256. https://doi.org/10.3390/su142114256
Chicago/Turabian StyleAnsah, Christabel Edena, Itohan-Osa Abu, Janina Kleemann, Mahmoud Ibrahim Mahmoud, and Michael Thiel. 2022. "Environmental Contamination of a Biodiversity Hotspot—Action Needed for Nature Conservation in the Niger Delta, Nigeria" Sustainability 14, no. 21: 14256. https://doi.org/10.3390/su142114256
APA StyleAnsah, C. E., Abu, I.-O., Kleemann, J., Mahmoud, M. I., & Thiel, M. (2022). Environmental Contamination of a Biodiversity Hotspot—Action Needed for Nature Conservation in the Niger Delta, Nigeria. Sustainability, 14(21), 14256. https://doi.org/10.3390/su142114256