Abstract
Understanding how vegetation growth responds to climate change is a critical requirement for predicting future ecosystem dynamics. Global warming causes significant changes in the vegetation characteristics of mountain ecosystems, particularly affecting vegetation phenology and net primary productivity (NPP). The Qilian Mountains are located in an arid and semiarid region, and the mechanisms of vegetation phenology in response to climate change still need to be further explored. We used MODIS data (2001–2020) to extract vegetation phenology and NPP, quantitatively evaluated their spatial–temporal dynamics, and analyzed the response mechanism of vegetation phenology–climate and vegetation phenology–NPP combined with meteorological data. The results showed that from southeast to northwest, the vegetation phenology changes significantly with the change in vegetation type, with SOS (start of the growing season) advancing at a rate of −0.415 d/year, EOS (end of the growing season) and LOS (length of the growing season) delaying at a rate of 0.20 d/year and 0.374 d/year, respectively, and NPP continues to increase. There was also an elevation gradient effect, with SOS delayed by 15.6 d/km, EOS advanced by 12.02 d/km and LOS shortened by 19.24 d/km. We found that the preseason temperature and SPEI (standardized precipitation evapotranspiration index) have a strong influence on the SOS and EOS, with the mean minimum temperature being the most significant and requiring attention, while the influence of precipitation cannot be ignored. We also found that the vegetation phenology is closely related to NPP, and SOS has the most significant effect. This study will provide a scientific basis for the response mechanisms of vegetation phenology in arid and semiarid regions under climate change. It will provide a reference for the implementation of effective ecosystem management.
1. Introduction
Climate is considered to be a major driver of biodiversity and ecosystem change [1]. The sixth IPCC report stated that global surface temperatures in the first two decades of the 21st century (2001–2020) are 0.99 °C higher than those in 1850–1900 [2]. As the main producer of terrestrial ecosystems, vegetation is the pivot of ecosystem material cycling and energy flow and plays an irreplaceable role in the carbon cycling of the biosphere and energy balance [3]. Vegetation phenology is a key indicator used to characterize the impact of climate change on ecosystems [4]. Numerous studies have shown that vegetation in the northern hemisphere at middle and high latitudes has experienced earlier vegetation growth start dates (SOS), later end dates (EOS) and longer growing seasons (LGS) due to increased temperatures [5,6], including Eurasia, Europe, North America, the Tibet Plateau [7], Xinjiang [8], the Inner Mongolia Steppe [9] and the Loess Plateau [10]. In particular, vegetation phenology in arid and semiarid ecosystems is more sensitive to climate change due to harsh environmental conditions [11,12]. Additionally, changes in vegetation phenology are closely linked to NPP. The duration of photosynthetic activity also increases as the plant growing season becomes longer, which will change the magnitude of plant productivity and affect carbon sequestration [13]. Therefore, understanding the dynamics of vegetation phenology is important in quantifying the impacts of climate change on terrestrial ecosystems at global and regional scales and in regulating the carbon balance of terrestrial ecosystems.
The current development of remote sensing technology provides an information platform for global and regional monitoring of phenological information [14]. Compared to traditional phenological observations, remote sensing has the advantages of large scope, a large amount of information and high spatial and temporal resolution. The most commonly used data sources are the normalized difference vegetation index (NDVI) [15,16,17], enhanced vegetation index (EVI) [18,19] and soil-adjusted vegetation index (SAVI) [20,21]. NDVI is widely used because it is sensitive to vegetation growth and cover type and can track the seasonal dynamics of vegetation [22]. While EVI has a better description of the difference in vegetation in different seasons in a specific climatic zone, SAVI has a more stable time series. The current method of extracting vegetation phenology from remotely sensed data mainly consists of two steps. First, the time series of vegetation indices were reconstructed using mathematical models such as the Savitzky–Golay (SG) filter, HANTS transform, Fourier transform, asymmetric Gaussian function and logistic function, among which the S–G filter method is more advantageous in fitting detailed information [23,24]. Second, vegetation phenology information was extracted by using sliding average, derivative and threshold methods. The advantage of the sliding average method is simple to apply, but it is sensitive to empirical parameters such as the choice of the sliding average window size, which increases the uncertainty of the results significantly. The advantage of the derivative method is that it does not require artificially set thresholds, but it is very sensitive to noise in the raw data. The dynamic threshold method can eliminate the influence of vegetation type and will significantly improve the accuracy of phenology extraction [25].
Due to global climate change, the dynamics and responses of vegetation growth to climate change are complex and uncertain. For example, the phenology of vegetation was different at different times in the same region. A survey of vegetation phenology in the arid zone of Central Asia found that the SOS and EOS between 1982 and 2014 were advanced by −0.143 and −0.363 days per year, respectively, and the LOS decreased by −0.442 days per year [26]. Later, some researchers extended the above work and found a much higher rate of change in comparison between 2000 and 2019, showing that the SOS in vegetation was gradually delayed at a rate of 0.16 d/year, the EOS was advanced at a rate of 0.69 d/year, and the LOS was gradually reduced at a rate of 0.89 d/year [27]. In addition, there are also differences in the phenology of different ecological zones or vegetation types in the same region, showing obvious spatial heterogeneity. It was found that preseason drought and high-temperature stress in the Tibetan Plateau usually advance EOS, while high temperatures and precipitation in agricultural and grassland zones delay EOS [28]. It was found that EOS is not the same as in most ecosystems such as broadleaf forests, coniferous forests, shrubs in deserts and grasslands in alpine areas, which is delayed with climate change when studying the phenology of temperate vegetation in China [29]. Current studies on the relationship between phenology and climate have focused on the response of spring and autumn phenology to preseason temperature and precipitation [30,31,32]. For example, increased preseason temperature is significantly negatively correlated with SOS and positively correlated with EOS in North American grasslands. In the Tibetan Plateau, rising temperatures in September can lead to delays in the EOS [33]. In addition, the effects of moisture conditions on vegetation phenology cannot be ignored, especially in arid zone ecosystems, where limited water can inhibit plant growth and photosynthesis, advance leaf senescence, and accelerate chlorophyll degradation and the risk of plant mortality [34]. For example, a decrease in winter precipitation led to an earlier SOS in the semiarid grasslands of the North American Rockie Mountains [35], while preseason moisture limitation caused precipitation in May and June to be negatively correlated with SOS in the Horqin Grassland [36]. Therefore, the dynamic mechanism of vegetation phenology and its relationship with climate change need to be further explored.
Phenology plays an important role in indicating vegetation productivity [37]. Changes in vegetation phenology can further enable changes in water, heat and carbon exchange in ecosystems, altering vegetation community conditions and productivity [38,39]. As a key link in the biogeochemical carbon cycle [40], NPP is widely used to evaluate ecosystems and ecosystem supply and can better reflect climate–vegetation interactions [41]. For example, some scholars analyzed the impact of global climate change on NPP from 1982 to 1999 for the first time, which found that global warming had increased the total amount of global NPP by more than 6% [42]. Additionally, the vegetation phenology–NPP is complicated. Some studies conducted inversion of vegetation phenology and NPP in the Qinghai-Tibet Plateau, and finally found that the SOS was advanced, the EOS was delayed and the LOS was prolonged, while NPP showed different degrees of increase [43]. A study of NPP of different vegetation types in the northern United States found that the longer LOS of woodland would increase annual carbon sequestration [44]. In addition, some researchers found that warm growing conditions prolonged the LOS and increased carbon storage by simulating four forest ecosystems [45]. However, hotter and drier climates in recent years have led to suppressed increases in vegetation productivity in some areas, even offsetting some of the increases due to longer growing seasons. As a result, long-term trends and interannual changes in vegetation phenology are unclear, and the mechanisms and processes of their impact on NPP remain highly uncertain in arid and semiarid regions. Therefore, a quantitative assessment of the direct effects of climate change on vegetation phenology and NPP in arid and semiarid regions can provide a scientific basis for monitoring vegetation dynamics and developing reasonable management plans in key regions [46].
As a typical arid mountain region in the temperate zone of the northern hemisphere, the warming and humidity trend in the Qilian Mountains is a significant and frequent climatic anomaly in recent years due to climate change, resulting in significant changes in vegetation greenness and growing season length [47,48]. Previous studies have mainly discussed the influence of temperature and precipitation on the phenology in the study areas or different vegetation types [49]. For example, the sensitivity of grasslands in the Qilian Mountains to climatic factors was higher than that of other vegetation types [50]. The responses of vegetation phenology to climatic factors and NPP in forest ecosystems of the arid and semiarid mountains have not been studied in an integrated manner, especially the impact of preseason drought on vegetation. Therefore, this study extracted vegetation phenology in the Qilian Mountains using a long series of MODIS NDVI data, clarified the temporal and spatial distribution of vegetation phenology over the last 20 years, and analyzed the relationships between the vegetation phenology and various climatic factors (mean temperature, mean maximum temperature, mean minimum temperature, precipitation, and SPEI). We explored the response mechanisms of vegetation phenology to climate change in the study area and its relationship with NPP, and proposed the following hypotheses: (1) The vegetation phenology of the Qilian Mountains, similar to that of the rest of the world, showed a trend towards earlier SOS, later EOS, longer LOS and accumulation of NPP. (2) Temperature remained an important climatic factor affecting phenology, and there were differences in climatic factors controlling phenology across vegetation types. (3) The relationships between SOS, EOS, LOS and NPP were close. The study will help predict the vegetation phenology–climate, estimate vegetation production and provide a scientific reference for effective ecosystem management and carbon balance in arid and semiarid areas.
2. Materials and Methods
2.1. Study Area
The Qilian Mountains (35°43′–39°36′ N, 93°30′–103°00′ E) are located in the hinterland of Asia and Europe and the northeast of the Tibetan Plateau, straddling the provinces of Qinghai and Gansu with a high northwest and low southeast terrain and an average elevation of 3523 m (Figure 1). The region is a transitional zone in the arid and semiarid regions of China with a continental climate and plateau climate, showing that the annual and daily difference in temperature is large, the average temperature −1.4 °C to 9.6 °C [51] and the total precipitation is 0–700 mm from 2000 to the present. According to the vegetation map of China at 1:1 million, the Qilian Mountains are rich in vegetation types, mainly meadows, grasslands, deserts, shrubs and alpine vegetation, which account for 30.14%, 25.94%, 14.61%, 9.29% and 7.90% of the total area, respectively, while other vegetation is scattered, such as broadleaf and coniferous forests [52].
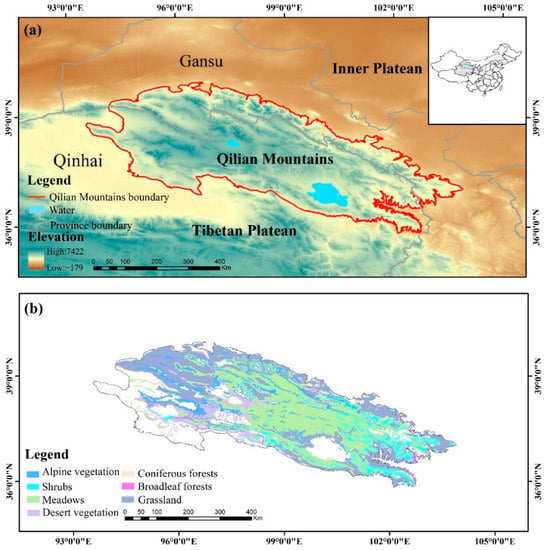
Figure 1.
Study area, (a) geographical location, (b) vegetation distribution.
2.2. Data Sources
2.2.1. MODIS Data
MOD13A1 NDVI data products for 2001–2020 were selected with 8 d and 500 m temporal and spatial resolutions for a total of 460 images. MOD17A3HGF NPP data were selected with 1year and 500 m temporal and spatial resolutions for a total of 20 images, and the data units were 10−4 kgC/m2/year, In addition, MRT and ArcGIS were used to preprocess and mask crop the raster images of the Qilian Mountains region (https://ladsweb.modaps.eosdis.nasa.gov/search/order/1, accessed on 20 July 2022).
2.2.2. Meteorological Data
Meteorological data, including the mean temperature (Tmean), mean minimum temperature (Tmin), mean maximum temperature (Tmax), potential evapotranspiration and total precipitation, were obtained from the 1 km resolution monthly dataset of China (1901–2020) included in the National Earth System Science Data Centre (http://auth.geodata.cn/, accessed on 22 July 2022). The potential evapotranspiration and total precipitation raster data are then used to calculate the SPEI at different time scales. Datasets are resampled to 500 m using a projection transformation and resampling tool, and a masking tool is used to extract the required dataset for the study area for subsequent analysis. Finally, the relationships between preseason climate factors and vegetation phenology, spring phenology (SOS) in relation to the current spring and previous year’s winter meteorological data, and autumn phenology (EOS) in relation to the current summer and autumn meteorological data were analyzed.
2.2.3. Vegetation Type Data
The Qilian Mountains vegetation type data were downloaded from the National Scientific Centre for Glacial Permafrost Desert Data (http://www.ncdc.ac.cn/, accessed on 24 July 2022), which is a vegetation distribution vector data based on an electronic version of the Vegetation Map of the People’s Republic of China (1:1,000,000).
2.3. Methods and Analysis
2.3.1. Vegetation Phenological Extraction
To further eliminate the influence of clouds and the atmosphere on the NDVI time series, it was necessary to filter and smooth the data. The S–G filter method is a least squares convolution fitting filter method proposed by Savitzky and Golay (1964), which is widely used for data denoising and smoothing, and the common formula is:
where t is a day of the year and is the fitted NDVI value on day t, is the coefficient of the filtered NDVI, and N is the number of convolution integers.
Based on the fitted smoothing data, three vegetation growing season parameters were extracted using the TIMESAT 3.0 software of SOS, EOS and LOS. The extraction method is the threshold method with the following:
where NDVI denotes the fitted NDVI value, denotes the maximum value of NDVI over a one-year period, denotes the minimum value of NDVI over a one-year period. When the value of is greater than the set threshold, the value corresponding to the horizontal coordinate of the point is the start of the growing season.
2.3.2. Theil–Sen Median and Mann–Kendall Test
Theil–Sen was used to analyze the trends of vegetation phenology and NPP from 2001 to 2020 on an image-by-image basis. The calculation equation is as follows:
where represents the value of Sen’s slope, and represent the value of the variable at i time and j time, respectively. When > 0, it indicates that the time series is on the rise, and when 0, it indicates that the time series is on the decrease.
Similarly, the Mann–Kendall test has similar merits to the Theil–Sen slope in that it effectively avoids outlier interference and the results have high reliability. The Mann–Kendall trend test defines the statistic S to quantify the expression of the trend, which for a given time series of data is calculated as follows:
where and denote the values in periods and of the time-series data, respectively, and takes the values:
when n > 8, the random sequence S approximately obeys the normal distribution, when S > 0, it indicates an upward trend, and when S < 0, it indicates a downward trend. The statistical test value Z is then obtained by standardizing the sequence S to determine whether the upward or downward trend of the time series data passes the significance level test, which is calculated by the following formula:
is calculated as:
Then, the M–K test is performed for the trend (confidence level was set at 95%), if T-sen > 0 and p < 0.05, it is significantly delayed or prolonged; if T-sen > 0 and p > 0.05, it is not significantly delayed or prolonged; if T-sen < 0 and p < 0.05, it is significantly advanced or shortened; and if T-sen < 0 and p > 0.05, it is not significantly advanced or shortened.
2.3.3. Relevance Analysis
To explore the relationship between climate change, vegetation phenology and NPP, spatial correlation analysis was used to characterize the degree of correlation between the variables through the correlation coefficient R, which was calculated as follows:
where denotes the correlation coefficient of x and y; and represent the values of these two variables of the i-th year; and and refer to the average values of and in 2001–2020, respectively.
2.3.4. SPEI Calculation
The SPEI standardizes the difference between precipitation and potential evapotranspiration on multiple time scales. The SPEI raster data from 2001 to 2020 were calculated using Gma (geographic and meteorological data analysis) in Python, and the effects of drought conditions on vegetation phenology were analyzed.
3. Results
3.1. Spatial Variation in Vegetation Phenology and NPP
From the southeast to the northwest, the vegetation types in the Qilian Mountains gradually changed from broadleaf forests, coniferous forests and shrubs to meadow grassland and then to alpine vegetation. The average SOS of the whole region was 150 d (early May), the average EOS was 276 d (early October), and the average LOS was 126 days. Figure 2 shows that the average SOS was gradually delayed, the EOS was gradually advanced, and the LOS was gradually shortened from southeast to northwest. Additionally, NPP also showed an obvious gradual decreasing trend with an average value of 2126 × 10−4 kgC/m2/year.
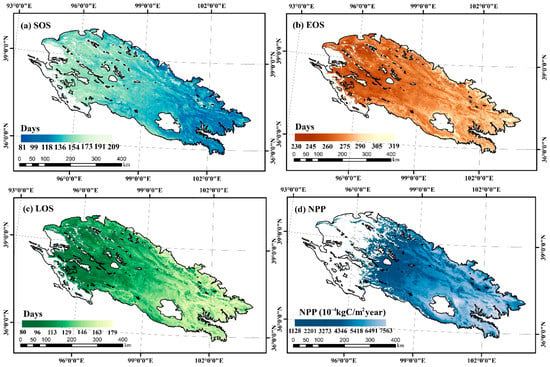
Figure 2.
Spatial distribution of annual mean values of vegetation phenology and NPP characteristics in the study area during 2001–2020.
In terms of specific vegetation types (Figure 3), the SOS was broadleaf forests (124 d) < coniferous forests (132 d) < shrub (135 d) < meadow (147 d) < grassland (149 d) < alpine vegetation (162 d), while the regional mean was concentrated approximately 149 d. The EOS was alpine vegetation (266 d) < meadow (275 d) < grassland (277 d) < shrub (282 d) < coniferous forests (285 d) < broadleaf forests (288 d), while the regional mean was concentrated at approximately 275 d. The LOS was alpine vegetation (108 d) < grassland (127 d) < meadow (129 d) < shrub (144 d) < coniferous forests (146 d) < broadleaf forests (157 d), while the regional mean was concentrated at approximately 126 d. NPP (Figure 4) was in the order of alpine vegetation (863 × 10−4 kgC/m2) < grassland (1454 × 10−4 kgC/m2) < meadow (3023 × 10−4 kgC/m2) < shrub (3406 × 10−4 kgC/m2) < coniferous forests (3456 × 10−4 kgC/m2) < broadleaf forests (4420 × 10−4 kgC/m2). The regional mean was concentrated at approximately 2270 × 10−4 kgC/m2.
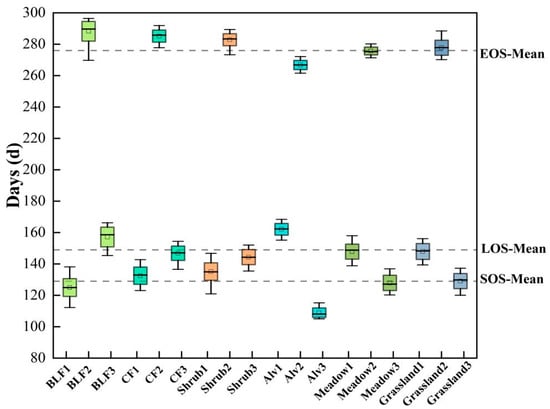
Figure 3.
Comparison of the phenological dynamics for different vegetation types in the Qilian Mountains (BLF: broadleaf forests, CF: coniferous forests, Alv: alpine vegetation, 1: SOS, 2: EOS, 3: LOS).
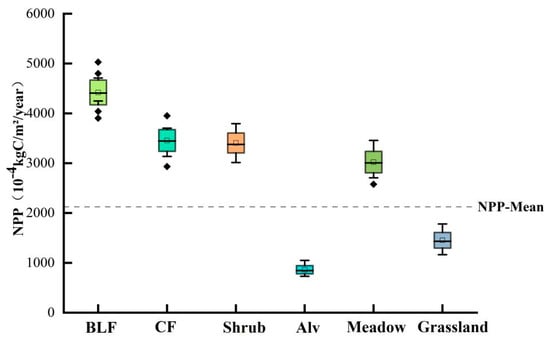
Figure 4.
Comparison of NPP values for different vegetation types in the Qilian Mountains.
3.2. Vertical Gradient Change in Vegetation Phenology
The vegetation phenology in the study area showed an elevation gradient effect (Figure 5). With the increase in elevation, the SOS showed an upwards trend, and the start time of the growing season was delayed with an amplitude of 15.67 d/km. The EOS showed a downward trend, and the end date of the growing season began to advance with a range of 12.02 d/km. Similar to the EOS, the LOS also showed a decreasing trend with increasing elevation, and the length of the growing season was shortened with an amplitude of 19.24 d/km.

Figure 5.
Characteristics of vegetation phenology with elevation. (a) SOS (b) EOS (c) LOS.
3.3. Temporal Variation in Vegetation Phenology and NPP
Figure 6 shows the temporal trends of vegetation phenology and net primary productivity in the Qilian Mountains from 2001 to 2020. The SOS showed an advanced trend, with 53.93% of the whole area showing a nonsignificant decrease, 11.07% showing a slight significant decrease, 14.50% showing a significant decrease (p < 0.05), 6.4% showing an extremely significant decrease (p < 0.01), and only 13.05% showing a nonsignificant increase.
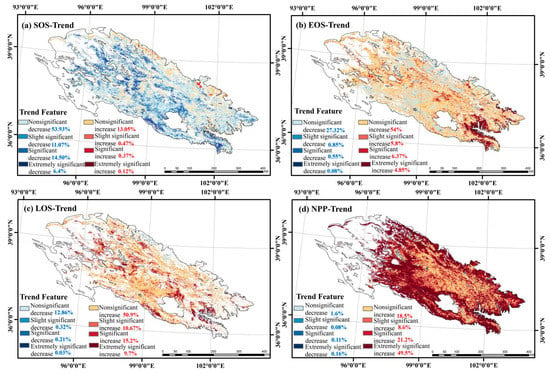
Figure 6.
Spatial distribution of vegetation phenology and NPP trend in the Qilian Mountains during 2001–2020.
EOS mainly showed a delay trend, with 54% of the whole area showing a nonsignificant increase, 5.8% showing a slight significant increase, 6.37% showing a significant increase (p < 0.05), 4.85% showing an extremely significant increase (p < 0.01), and only 27.32% showed a trend of a nonsignificant decrease. LOS showed an increasing trend, with 50.9% being nonsignificantly increasing, 10.67% being slightly significantly increasing, 15.2% being significantly increasing (p < 0.05), 9.7% being extremely significantly increasing (p < 0.01), and only 12.86% showing a nonsignificantly decreasing trend, sporadically distributed in the northwestern part of the study area. NPP showed an increasing trend, with 49.5% showing an extremely significant increase (p < 0.01), 21.2% showing a significant increase (p < 0.05), and only 1.6% showing a nonsignificant decreasing trend.
Figure 7 shows the interannual variation in vegetation phenology for the whole study area and different vegetation types. In 20 years, SOS showed the largest trend with an advance rate of −0.416 d/year, EOS showed a delayed trend with a delay rate of 0.201 d/year, and LOS maintained an increasing trend of 0.374 d/year. The interannual variations in different vegetation types in the region were different. For the SOS, each vegetation type exhibited an advancing trend, in the order of shrub (−0.482 d/year) > meadow (−0.445 d/year) > grassland (−0.414 d/year) > coniferous forests (−0.332 d/year) > broadleaf forests (−0.316 d/year) > alpine vegetation (−0.252 d/year), respectively. For EOS, each vegetation type showed a lengthening trend, in the order of broadleaf forests (0.492 d/year) > shrub (0.278 d/year) > grassland (0.275 d/year) > alpine vegetation (0.225 d/year) > coniferous forests (0.163 d/year) > meadow (0.146 d/year), respectively. For LOS, each vegetation type showed a lengthening trend, in the order of meadow (0.445 d/year) > shrub (0.442 d/year) > broadleaf forests (0.434 d/year) > grassland (0.422 d/year) > alpine vegetation (0.342 d/year) > coniferous forests (0.290 d/year).
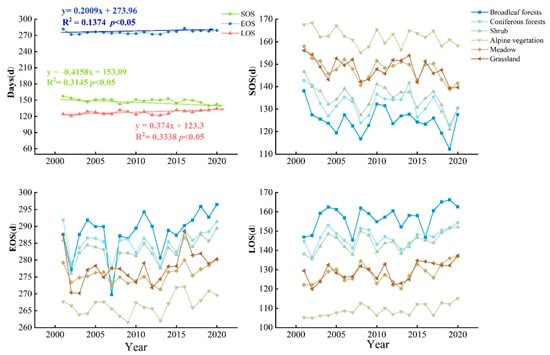
Figure 7.
Interannual variations of different vegetation type phenology in Qilian Mountains during 2001–2020.
3.4. Response of Vegetation Phenology to Climate Change
3.4.1. Response of Spring Phenology to Preseason Climate
Figure 8 shows the response of spring phenology (SOS) to climatic factors in the spring of the current year and winter of the previous year. In terms of temperature, the SOS had negative correlations with the Tmean, Tmax and Tmin of the current spring, with values of 85.1%, 76.6% and 86.3%, respectively, and 19.2%, 10.1% and 27.6% reached significant negative correlations (p < 0.05). The SOS and the previous winter temperature showed more positive correlations of 52.4%, 52.7%, and 42.6%, respectively, and reached significant positive correlations (p < 0.05) of 2.2%, 2.4% and 2.3%, respectively. Compared with the spring of the current year, the response of the SOS to winter temperature was weak, and there were no strong significant relationships. In terms of precipitation, the SOS mainly showed a negative correlation with the current spring and the previous winter with 61.1% and 54.9%, respectively, and a smaller proportion reached a significant negative correlation (p < 0.05) with 4.3% and 3.6%, respectively. Similarly, there was some negative correlation between the SOS and SPEI, with 60.3% in the current spring and 70.2% in the previous winter, and there were significant negative correlations of 4.0% and 3.3%, respectively.
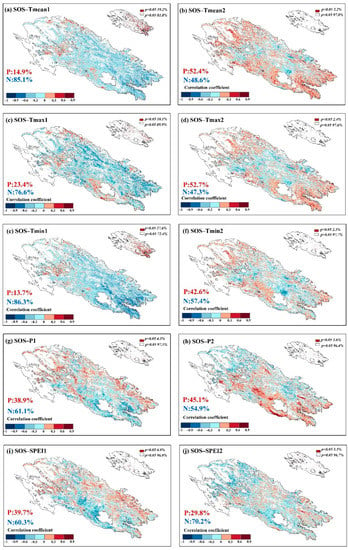
Figure 8.
Responses of spring phenology to preseason climatic factors (1: climatic factors of the current spring, 2: climatic factors of the previous winter, P indicates positive correlation, N indicates negative correlation).
In addition, the pattern of response to climatic factors varied between vegetation types. Firstly, Figure 9a shows that among the spring climate factors for the current year, the negative correlation between spring temperature (Tmean, Tmin) and SOS of all vegetation types was more obvious, especially for broadleaf forests and shrub. In contrast, for precipitation and SPEI, alpine vegetation, unlike other vegetation, showed a positive correlation with them. Figure 9b shows that in the previous winter climate factor, the response of SOS to temperature was not significant for each vegetation type, but SPEI had a more significant effect on SOS for each vegetation type, especially for alpine vegetation and meadows.
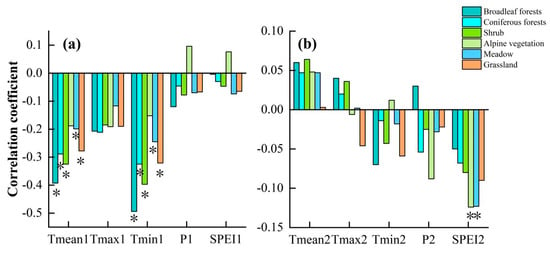
Figure 9.
Correlations between spring phenology of different vegetation types and preseason climatic factors. (a) Spring of current year, (b) Winter of previous year. * indicates significant correlation.
3.4.2. Response of Autumn Phenology to Preseason Climate
Figure 10 shows the response of autumn phenology (EOS) to climatic factors in the summer and autumn of the current year. In terms of temperature, the EOS had the positive correlations with the Tmean, Tmax and Tmin of the summer of 60.2%, 63.3%, and 46%, respectively, and reached a significant positive correlation (p < 0.05) of 4.2%, 5.5% and 3.2%, respectively. EOS and the temperature in the current autumn showed more positive correlations of 82.3%, 72.5%, and 84%, which reached a significant positive correlation (p < 0.05) of 11.5%, 6.2% and 16.8%, respectively. Compared with the current summer, the response of EOS to autumn temperature was more significant, especially for Tmin. In terms of precipitation, the EOS mainly showed a negative correlation with the current summer and autumn, with 56.6% and 55.9%, respectively, and reached a significant negative correlation (p < 0.05) of 0.6% and 3.7%, respectively. There was a positive correlation between the SOS and SPEI, with 74.9% in the current summer and 57.3% in autumn, and there was a significant positive correlation (p < 0.05) of 9.1% and 3.8%, indicating that drought in summer had a significant effect on the EOS.
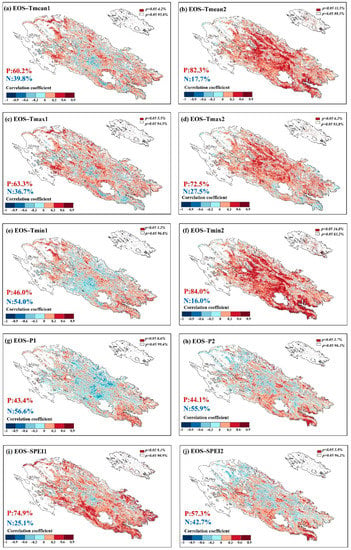
Figure 10.
Response of autumn phenology to preseason climatic factors (1: climatic factors of the current summer, 2: climatic factors of the current autumn, P indicates positive correlation, N indicates negative correlation).
Figure 11 shows the relationship between the EOS of each vegetation type and climate factors in the preseason. Among them, Figure 11a shows that the SPEI in the summer of the current year has a significant positive influence on the EOS of each vegetation type, except alpine vegetation and grassland. Temperature and precipitation have less influence. Figure 11b shows that among the climatic factors in the autumn of the current year, the EOS of each vegetation type showed a positive relationship with the temperature (Tmax, Tmin, and Tmean), with the most significant effect of the Tmin. In addition, alpine vegetation, unlike other vegetation types, showed a negative correlation with precipitation and SPEI.
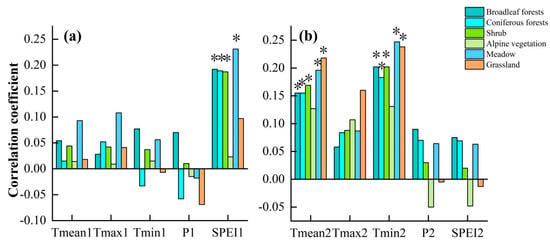
Figure 11.
Correlations between autumn phenology of different vegetation types and preseason climatic factors. (a) Summer of the current year, (b) Autumn of the current year. * indicates significant correlation.
3.5. Effects of Vegetation Phenomenon on NPP Changes
Figure 12 shows the correlations and the percentage of significant degrees between NPP and vegetation phenology. Among them, SOS showed a more significant negative correlation with NPP of 72% and a significant negative correlation (p < 0.05) of 16.2%, indicating that SOS had a more significant effect on the accumulation of NPP. The positive and negative correlations between the EOS and NPP were comparable at 45% and 55%, respectively, and the significant positive correlation (p < 0.05) was only 8.7%, indicating that NPP was less influenced by the EOS than by to the SOS. In contrast, LOS showed a more significant positive correlation with NPP at 62.7% and a significant positive correlation (p < 0.05) of 10.7%.
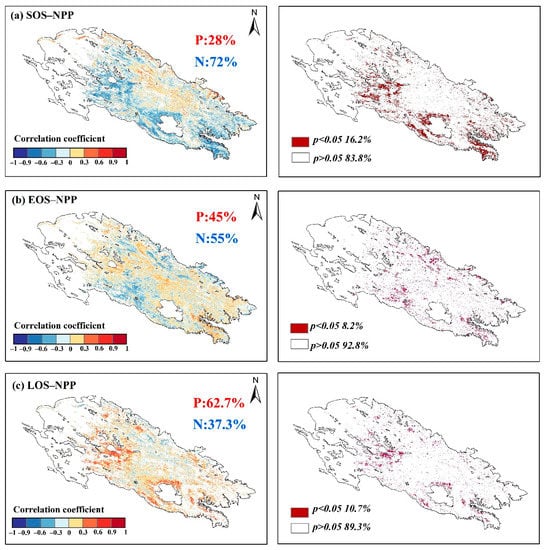
Figure 12.
Correlations between vegetation phenology and NPP (P indicates positive correlation, N indicates negative correlation).
4. Discussion
4.1. Spatial and Temporal Patterns of Phenological Metrics
In the complex context of climate change, vegetation phenology changes in the Qilian Mountains from 2001–2020 are highly variable in both spatial and temporal characteristics, which is consistent with studies that have found strong spatial heterogeneity in vegetation phenology in the mid-latitudes of the northern hemisphere [53]. Studies in recent decades have shown that vegetation SOS was advanced, EOS was delayed and LOS was extended in different areas of the northern hemisphere [54,55,56]. Lengthening the LOS of vegetation can increase the time to carbon assimilation and biomass growth of vegetation, thus increasing productivity [57]. Figure 6 showed the characteristics of temporal changes in the study area over a 20-year period, with a rate of SOS advanced by −0.4158 d/year; a rate of EOS delayed by 0.2009 d/year, and a rate of LOS increased by 0.374 d/year. In most terrestrial ecosystems, changes in vegetation phenology are clearly attributable to climate change [58], while influenced by terrain (high in the northwest and low in the southeast). The variation of temperature and precipitation in the study area showed spatial heterogeneity from northwest to southeast (Figure 2). ‘The Hopkins bioclimatic law’ indicates that the spring phenology of vegetation is steadily delayed with increasing elevation [59]. This is related to our study results. Figure 4 showed a delay in SOS of 15.67 d/1 km, an advance in EOS of 12.02 d/1 km and a decrease in LOS of 19.24 d/1 km with increasing altitude in the study area. Therefore, environmental factors have a significant effect on the phenology and the relationship between the two needs to be further explored.
4.2. Response of Vegetation Phenology to Climate Change
Overall, most of the vegetation phenology changes in the Qilian Mountains from 2001 to 2020 showed an early trend in the SOS, a delayed trend in the EOS, an increasing trend in the LOS, and an increasing accumulation of NPP. However, the phenological changes varied considerably among vegetation types (Figure 3 and Figure 7). This is consistent with the spatial heterogeneity in vegetation phenology at mid-latitudes in the northern hemisphere, which also reflects the complex influence of climatic conditions on vegetation phenology [60].
Climate change directly affects the spatial distribution of vegetation growth changes by altering plant respiration, photosynthesis, growth periods, and soil formation processes [61]. In terrestrial ecosystems experiencing global climate change, understanding the vegetation phenology–climate is essential for monitoring and managing vegetation dynamics. Several previous studies have shown that there was a time lag between vegetation growth and climate factors [62,63]. Therefore, we not only quantified the correlations between the physical parameters and climate factors in the same season but also explored the correlations in the previous season. Temperature and precipitation were the primary factors. First, the SOS of spring phenology was negatively correlated with a large proportion of the current spring temperatures and positively correlated with the previous year’s winter temperatures (Figure 8). This is similar to previous studies, some of which have shown that higher spring temperature was the dominant factor in earlier spring phenology [64,65]. For example, it was found that each 1 °C increase in Tmean in spring resulted in an earlier vegetation growing season of approximately 3 days in temperate areas of China [66]. The trees could undergo active growth earlier due to the higher temperatures allowing a rapid accumulation of heat and plants reach the critical threshold required for growth for a short period of time [67]. However, the SOS was more sensitive to elevated Tmin with a negative correlation of 86.3% and a percentage of 27.6% (p < 0.05), which was much higher than the percentage of the significance of Tmean and Tmax (Figure 8e). Leaf emergence is caused by Tmin in most temperate regions of the northern hemisphere because Tmin is more likely to reach biological zero, so that plant heat can be accumulated during preseason dormancy, while higher Tmin reduces low-temperature frost damage, promotes spring thaw and alters nutrient uptake and soil water effectiveness [68]. Therefore, this allows earlier initiation of SOS, which is consistent with our findings. In addition, spring phenology showed a larger proportion of positive correlation with the Tmean and Tmax in the previous year’s winter. In fact, winter warming reduced cold accumulation during plant dormancy, which increased plant heat demand in spring, served to delay spring phenology, and resulted in later SOS [69]. However, the effect of temperature in the previous year’s winter on spring phenology was smaller than that of spring temperature. In addition to temperature, precipitation is also an important driver of vegetation growth [70]. The results showed that spring phenology exhibited a negative correlation of 61.1% share with spring precipitation for the current year, and a lower negative correlation of 54.9% for winter precipitation (Figure 8), indicating that moisture can influence the SOS and suppress vegetation light and heat use [71]. In addition, drought implies a decrease in soil moisture and hydraulic conductivity, which usually leads to water stress in plants. These changes trigger an increase in plant xylem tension. Additionally, our results also showed that the SOS was positively correlated with the SPEI in spring and the previous winter by a large percentage of 60.3% and 70.2%, respectively (Figure 8). Therefore, the rise in temperature plays a dominant role in spring phenology, especially the Tmin in the spring of the current year, which needs to be closely monitored.
Secondly, both summer and autumn temperatures of the current year showed a large proportion of positive correlation with autumn phenology (EOS), especially the influence of autumn temperature (Tmean, Tmax, and Tmin) on EOS is more significant. The warmer temperatures in late summer and early autumn increased the activity of enzymes involved in photosynthesis within plant tissues and slowed the fading of chlorophyll in leaves, which delayed the end of the growing season of vegetation later [72]. It is also possible that the warmer temperatures in late summer and early autumn made frost appear later, greatly reducing the risk of vegetation being affected by natural disasters such as frost. It is worth noting that Tmin (autumn of the current year) was the most significant to EOS as with the effect of temperature on SOS. In addition, EOS showed a larger proportion of negative correlation with precipitation (Figure 10). EOS arrives earlier due to weakened photosynthesis by not receiving enough solar radiation with more rainfall and a corresponding increase in cloud thickness. Finally, drought was positively correlated with the EOS, suggesting that the SPEI increase could end the vegetation growth dates earlier. In particular, the positive correlation was 74.9% for summer drought and 9.1% for p < 0.05 (Figure 10), showing that drought caused by high summer temperatures accelerated ground evapotranspiration and increased transpiration of vegetation leaves, leading to an earlier end of the growing season in autumn due to lack of water. Therefore, increased temperatures and drought need to be closely monitored for autumn phenology.
The IPCC report indicated that global temperatures would increase further. Based on the results of this study, it is expected that temperatures will continue to be the main cause of vegetation phenology in the future, especially in relation to Tmin. In addition, the impact of the SPEI and precipitation on vegetation phenology should not be ignored. Therefore, it is necessary to pay close attention to the impact of climate change on vegetation growth and to take scientific and reasonable control measures for vegetation in response to specific response mechanisms.
4.3. Responses of Different Vegetation Types to Climate Change
Temperature, especially in the spring of the current year, is the main factor influencing the advancement of the SOS, which is a common feature of different vegetation types (Figure 8 and Figure 9). Alpine vegetation delayed the SOS with increasing elevation (Figure 5), so it does not significantly advance the SOS even with more precipitation in spring (Figure 9a). Second, alpine vegetation is located at low temperatures, and an increase in Tmin will break the vegetation’s dormancy in winter and delay the SOS (Figure 9b). Broadleaf and coniferous forests are mainly located on shady slopes with limited sunshine hours, but the high soil organic matter content gives forests a high water-holding capacity [73]. Therefore, forests are more sensitive to temperature than precipitation (Figure 9b). Herbaceous vegetation grows on sunny slopes and is often affected by drought stress due to high evapotranspiration and limited soil moisture [74], so drought contributes more to changes in SOS in grasslands and meadows (Figure 9b). In terms of autumn phenology, the temperature in the current autumn was the main factor that delayed EOS, a feature common to all vegetation types (Figure 11b), with minimum temperatures, in particular, having the most significant effect on EOS. Second, the correlation coefficient between the SPEI in summer and EOS was higher for all vegetation than for other climatic factors, especially meadows, because herbaceous plants in semiarid areas have shallow root systems and growth must respond quickly to water [75], while more precipitation can effectively alleviate drought stress and delay EOS. In addition meadows and grasslands also show a higher sensitivity of EOS to autumn temperatures compared to other vegetation types (Figure 11b).
The above results indicated that there is still complexity and uncertainty in the response mechanisms of the different vegetation types in the Qilian Mountains to climate factors. This is largely due to differences in the physiological adaptation and functional strategies of the different biota in each ecosystem. Therefore, specific management measures and maintenance programs need to be developed according to the growth adaptation mechanisms of different vegetation types in the context of climate change. In particular, the dynamic monitoring of grassland and meadow phenology should be strengthened.
4.4. Relationship between Vegetation Phenology and Productivity
As a major indicator of material production in vegetation communities, NPP is widely used to discuss the relationship between vegetation productivity and vegetation phenology [76]. Our results showed that the vegetation start date was earlier, the end date was later and the whole growing season was longer, while the NPP of the vegetation also increased significantly during the period 2001–2020 (Figure 6). This is consistent with the findings of most studies that an increase in the length of the vegetation growing season leads to a corresponding increase in the time for photosynthesis and material production, which in turn promotes an increase in vegetation productivity [77]. For example, researchers found that for each additional day of growth in deciduous broadleaf and coniferous forests in the northern USA, the NPP increased by 3.5 gC/m2 and 6.8 gC/m2, respectively. However, there were differences in the independent contributions of the three vegetation phenology indicators for SOS, EOS and LOS to NPP (Figure 12), which helps to understand the carbon balance relationship between photosynthesis and respiration enhancement under the extended growing season.
SOS was negatively correlated with NPP in a larger proportion (72%) with a significance of 16.2% at p < 0.05, EOS was negatively correlated with NPP in a larger proportion (55%) with a significance of 8.2%, while LOS was positively correlated with NPP by a larger margin of 62.7% with a significance of p < 0.05 at 10.7% (Figure 12). This is similar to other studies in northern hemisphere ecosystems, which also found that the specific situation of vegetation productivity varies with warming in spring, leading to greater photosynthesis than respiration and increased vegetation productivity, although the length of the vegetation growing season increases each year [78]. In contrast, warming in autumn causes respiration to be more intense than photosynthesis, resulting in a reduction in plant photosynthesis accumulation and carbon sequestration [79]. Therefore, the variation in the effect of vegetation phenology on productivity depends on the coupling between photosynthesis and respiration, and their sensitivity to climate.
The above results suggested that the SOS and LOS are key factors influencing the increase in NPP accumulation, and that the SOS is closely related to climate change. Therefore, we need to consider the response mechanisms of vegetation phenology to climate change and the relationships with productivity to understand the dynamics of carbon balance in terrestrial ecosystems (Figure 13).
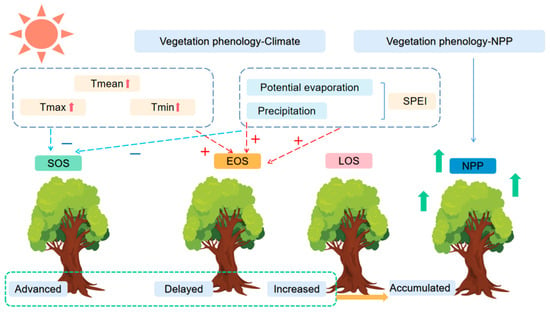
Figure 13.
Response mechanisms of vegetation phenology to climate and NPP in Qilian Mountains. Tmean: mean temperature, Tmin: mean minimum temperature, Tmax: mean maximum temperature.
5. Conclusions
Vegetation phenology and NPP from the Qilian Mountains were extracted based on MODIS data, and then their temporal trends and spatial distribution were quantified. The results showed that the vegetation phenology changed significantly from southeast to northwest, with a significantly earlier SOS, and later EOS and increased LOS and NPP accumulation. A spatial correlation was used to analyze the relationship between vegetation phenology and climatic factors, and it was found that temperature had a strong influence on the SOS, with particular attention to the Tmin in the spring of the year. However, the influence of precipitation and SPEI in the previous winter on the SOS should not be overlooked. For EOS, the influence of autumn temperature in the current year on EOS was more significant, especially Tmin. The influence of the summer SPEI on the EOS also needs to be closely monitored. The response of different vegetation types to climatic factors also varies. In addition, by exploring the relationship between vegetation phenology and NPP, it was found that the SOS had a more significant effect on the accumulation of vegetation productivity. The study results explore the spatiotemporal pattern and driving factors of vegetation phenology, which helps us to better understand the role of vegetation phenology in complex dryland ecosystems and its impact on global carbon cycle changes.
Author Contributions
Conceptualization, X.W. and L.J.; methodology, X.W.; software, X.W. and X.D.; validation, X.W., D.D., R.X., M.W. and P.Z.; formal analysis, X.W.; resources, X.D.; data curation, X.W. and D.D.; writing—original draft preparation, X.W.; writing—review and editing, X.W. and L.J.; supervision, M.W. and P.Z. All authors have read and agreed to the published version of the manuscript.
Funding
This research was supported by the CAS “Light of West China” Program (2020XBZG-XBQNXZ-A), Cultivation Program of 2022 Major scientific Research Project of Northwest Normal University (WNU-LKZD2022-04), and Natural Science Foundation of Gansu (No. 20JR10RA093).
Institutional Review Board Statement
Not applicable.
Informed Consent Statement
Not applicable.
Data Availability Statement
Not applicable.
Acknowledgments
We also thank the anonymous referees for their helpful comments on the manuscript.
Conflicts of Interest
The authors declare that they have no known competing financial interests or personal relationships that could have appeared to influence the work reported in this paper.
References
- Huang, L.; Shao, Q.; Liu, J. Assessing the conservation effects of nature reserve networks under climate variability over the northeastern Tibetan plateau. Ecol. Indic. 2019, 96, 163–173. [Google Scholar] [CrossRef]
- IPCC. Climate Change 2021: The Physical Science Basis. Contribution of Working Group I to the Sixth Assessment Report of the Intergovernmental Panel on Climate Change. 2021. Available online: https://elib.dlr.de/137584/2021.07.021 (accessed on 12 October 2022).
- Han, H.; Bai, J.; Gao, M.; Bai, J.; Yan, J.; Wang, X.; Ta, Z.; Wang, P. Seasonal Responses of Net Primary Productivity of Vegetation to Phenological Dynamics in the Loess Plateau, China. Chin. Geogr. Sci. 2022, 32, 340–357. [Google Scholar] [CrossRef]
- Chen, I.C.; Hill, J.K.; Ohlemüller, R.; Roy, D.B.; Thomas, C.D. Rapid range shifts of species associated with high levels of climate warming. Science 2011, 333, 1024–1026. [Google Scholar] [CrossRef]
- Han, Q.; Wang, T.; Jiang, Y.; Fischer, R.; Li, C. Phenological variation decreased carbon uptake in European forests during 1999–2013. For. Ecol. Manag. 2018, 427, 45–51. [Google Scholar] [CrossRef]
- Zhang, R.; Guo, J.; Yin, G. Response of net primary productivity to grassland phenological changes in Xinjiang, China. PeerJ 2021, 9, e10650. [Google Scholar] [CrossRef]
- Yu, H.; Luedeling, E.; Xu, J. Winter and spring warming result in delayed spring phenology on the Tibetan Plateau. Proc. Natl. Acad. Sci. USA 2010, 107, 22151–22156. [Google Scholar] [CrossRef]
- Zhang, R.; Guo, J.; Liang, T.; Feng, Q. Grassland vegetation phenological variations and responses to climate change in the Xinjiang region, China. Quat. Int. 2019, 513, 56–65. [Google Scholar] [CrossRef]
- Ren, S.; Yi, S.; Peichl, M.; Wang, X. Diverse responses of vegetation phenology to climate change in different grasslands in Inner Mongolia during 2000–2016. Remote Sens. 2017, 10, 17. [Google Scholar] [CrossRef]
- Kang, W.; Wang, T.; Liu, S. The Response of Vegetation Phenology and Productivity to Drought in Semi-Arid Regions of Northern China. Remote Sens. 2018, 10, 727. [Google Scholar] [CrossRef]
- Li, C.; Wang, R.; Cui, X.; Wu, F.; Yan, Y.; Peng, Q.; Qian, Z.; Xu, Y. Responses of vegetation spring phenology to climatic factors in Xinjiang, China. Ecol. Indic. 2021, 124, 107286. [Google Scholar] [CrossRef]
- Tang, G.; Arnone, J.A.; Verburg, P.S.J.; Jasoni, R.; Sun, L. Trends and climatic sensitivities of vegetation phenology in semiarid and arid ecosystems in the US Great Basin during 1982–2011. Biogeosciences 2015, 12, 6985–6997. [Google Scholar] [CrossRef]
- Dragoni, D.; Schmid, H.P.; Wayson, C.A.; Potter, H.; Grimmond, C.S.B.; Randolph, J.C. Evidence of increased net ecosystem productivity associated with a longer vegetated season in a deciduous forest in south-central Indiana, USA. Glob. Chang. Biol. 2011, 17, 886–897. [Google Scholar] [CrossRef]
- Beck, P.S.A.; Atzberger, C.; Høgda, K.A.; Johansenc, B.; Skidmoreb, A.K. Improved monitoring of vegetation dynamics at very high latitudes: A new method using MODIS NDVI. Remote Sens. Environ. 2006, 100, 321–334. [Google Scholar] [CrossRef]
- White, M.; Beurs, K.; Didan, K. Intercomparison, interpretation, and assessment of spring phenology in North America estimated from remote sensing for 1982–2006. Glob. Chang. Biol. 2009, 15, 2335–2359. [Google Scholar] [CrossRef]
- Zhou, L.; Tucker, C.; Kaufma, R.; Slayback, D.; Shabanov, N. Variations in northern vegetation activity inferred from satellite data of vegetation index during 1981 to 1999. J. Geophys. Res.-Atmos. 2001, 106, 20069–20083. [Google Scholar] [CrossRef]
- Zhang, X.; Friedl, M.; Schaaf, C.; Strahler, A.; Hodges, J.; Gao, F.; Reed, B.; Huete, A. Monitoring vegetation phenology using MODIS. Remote Sens. Environ. 2003, 84, 471–475. [Google Scholar] [CrossRef]
- Wang, C.; Wu, Y.; Hu, Q.; Hu, J.; Chen, Y.; Lin, S.; Xie, Q. Comparison of Vegetation Phenology Derived from Solar-Induced Chlorophyll Fluorescence and Enhanced Vegetation Index, and Their Relationship with Climatic Limitations. Remote Sens. 2022, 14, 3018. [Google Scholar] [CrossRef]
- Leng, S.; Huete, A.; Cleverly, J.; Yu, Q.; Zhang, R.; Wang, Q. Spatiotemporal Variations of Dryland Vegetation Phenology Revealed by Satellite-Observed Fluorescence and Greenness across the North Australian Tropical Transect. Remote Sens. 2022, 14, 2985. [Google Scholar] [CrossRef]
- Sun, C.; Li, J.; Cao, L.; Liu, Y.; Jin, S.; Zhao, B. Evaluation of Vegetation Index-Based Curve Fitting Models for Accurate Classification of Salt Marsh Vegetation Using Sentinel-2 Time-Series. Sensors 2020, 20, 5551. [Google Scholar] [CrossRef] [PubMed]
- Hu, P.; Sharifi, A.; Tahir, M.N.; Tariq, A.; Zhang, L.; Mumtaz, F.; Shah, S.H.I.A. Evaluation of Vegetation Indices and Phenological Metrics Using Time-Series MODIS Data for Monitoring Vegetation Change in Punjab, Pakistan. Water 2021, 13, 2550. [Google Scholar] [CrossRef]
- Zhang, F.; Wu, B.; Liu, C.; Luo, Z.; Zhang, S.; Zhang, G. A method to extract regional crop growth profile with time series of NDVI data. J. Remote Sens. 2004, 8, 515–528. [Google Scholar] [CrossRef]
- Cong, N.; Wang, T.; Nan, H.; Ma, Y.; Wang, X.; Myneni, R.; Piao, S. Changes in satellite–derived spring vegetation green–up date and its linkage to climate in China from 1982 to 2010: A multimethod analysis. Glob. Chang. Biol. 2013, 19, 881–891. [Google Scholar] [CrossRef] [PubMed]
- Shen, M.; Zhang, G.; Cong, N.; Wang, S.; Kong, W.; Piao, S. Increasing altitudinal gradient of spring vegetation phenology during the last decade on the Qinghai-Tibetan Plateau. Agric. For. Meteorol. 2014, 189, 71–80. [Google Scholar] [CrossRef]
- Suzuki, R.; Nomaki, T.; Yasunari, T. West-east contrast of phenology and climate in northern Asia revealed using a remotely sensed vegetation index. Int. J. Biometeorol. 2003, 47, 126–138. [Google Scholar] [CrossRef]
- Gao, X.; Zhao, D. Impacts of climate change on vegetation phenology over the Great Lakes Region of Central Asia from 1982 to 2014. Sci. Total Environ. 2022, 845, 157227. [Google Scholar] [CrossRef]
- Wu, L.; Ma, X.; Dou, X.; Zhu, J.; Zhao, C. Impacts of climate change on vegetation phenology and net primary productivity in arid Central Asia. Sci. Total Environ. 2021, 796, 149055. [Google Scholar] [CrossRef]
- Li, P.; Liu, Z.; Zhou, X.; Xie, B.; Li, Z.; Luo, Y.; Zhu, Q.; Peng, C. Combined control of multiple extreme climate stressors on autumn vegetation phenology on the Tibetan Plateau under past and future climate change. Agric. For. Meteorol. 2021, 308, 108571. [Google Scholar] [CrossRef]
- Yang, Y.; Guan, H.; Shen, M.; Liang, W.; Jian, L. Changes in autumn vegetation dormancy onset date and the climate controls across temperate ecosystems in China from 1982 to 2010. Glob. Chang. Biol. 2015, 21, 652–665. [Google Scholar] [CrossRef]
- Yuan, W.; Liu, S.; Zhou, G.; Zhou, J.; Tieszen, L.; Baldocchi, D.; Bernhofer, C.; Gholz, H.; Goldstein, A.; Goulden, M.; et al. Deriving a light use efficiency model from eddy covariance flux data for predicting daily gross primary production across biomes. Agric. For. Meteorol. 2007, 143, 189–207. [Google Scholar] [CrossRef]
- Potter, C.; Randerson, J.; Field, C.; Matson, P.; Vitousek, P.; Mooney, H.; Klooster, S. Terrestrial ecosystem production: A process model based on global satellite and surface data. Glob. Chang. Biol. 1993, 7, 811–841. [Google Scholar] [CrossRef]
- Li, Q.; Xu, L.; Pan, X.; Zhang, L.; Li, C.; Yang, N.; Qi, J. Modeling phenological responses of Inner Mongolia grassland species to regional climate change. Environ. Res. Lett. 2016, 11, 015002. [Google Scholar] [CrossRef]
- Che, M.; Chen, B.; Innes, J.; Wang, G.; Dou, X.; Hou, T.; Zhang, H.; Yan, J.; Xu, G.; Zhao, H. Spatial and temporal variations in the end date of the vegetation growing season throughout the Qinghai-Tibetan Plateau from 1982 to 2011. Agric. For. Meteorol. 2014, 189, 81–90. [Google Scholar] [CrossRef]
- Liu, Q.; Fu, Y.H.; Zeng, Z.; Huang, M.; Li, X.; Piao, S. Temperature, precipitation, and insolation effects on autumn vegetation phenology in temperate China. Glob. Chang. Biol. 2016, 22, 644–655. [Google Scholar] [CrossRef]
- Lesica, P.; Kittelson, P.M. Precipitation and temperature are associated with advanced flowering phenology in a semi-arid grasslad. J. Arid Environ. 2010, 74, 1013–1017. [Google Scholar] [CrossRef]
- Yu, F.; Price, K.P.; Ellis, J. Response of seasonal vegetation development to climatic variations in eastern central Asia. Remote Sens. Environ. 2003, 87, 42–54. [Google Scholar] [CrossRef]
- Wu, C.; Hou, X.; Peng, D.; Gonsamo, A.; Xu, S. Land surface phenology of China’s temperate ecosystems over 1999–2013: Spatial-temporal patterns, interaction effects, covariation with climate and implications for productivity. Agric. For. Meteorol. 2016, 216, 177–187. [Google Scholar] [CrossRef]
- Chang, C.; Wang, H.; Huang, C. Impacts of vegetation onset time on the net primary productivity in a mountainous island in Pacific Asia. Environ. Res. Lett. 2013, 8, 045030. [Google Scholar] [CrossRef]
- Sakuraba, Y.; Jeong, J.; Kang, M.Y.; Kim, J.; Paek, N.; Choi, G. Phytochrome-interacting transcription factors PIF4 and PIF5 induce leaf senescence in Arabidopsis. Nat. Commun. 2014, 5, 4636. [Google Scholar] [CrossRef]
- Yang, H.; Hu, D.; Xu, H.; Zhong, X. Assessing the spatiotemporal variation of NPP and its response to driving factors in Anhui province, China. Environ Sci. Pollut. Res. 2020, 27, 14915–14932. [Google Scholar] [CrossRef]
- Wang, S.; Zhang, B.; Yang, Q.; Chen, G.; Yang, B.; Liu, L.; Shen, M.; Peng, Y. Responses of net primary productivity to phenological dynamics in the Tibetan Plateau, China. Agric. For. Meteorol. 2017, 232, 235–246. [Google Scholar] [CrossRef]
- Nemani, R.; Keeling, C.; Hashimoto, H. Climate-driven increases in global terrestrial net primary production from 1982 to 1999. Science 2003, 300, 1560–1563. [Google Scholar] [CrossRef] [PubMed]
- Guo, B.; Zang, W.; Yang, F.; Han, B.; Chen, S.; Liu, Y.; Yang, X.; He, T.; Chen, X.; Liu, C. Spatial and temporal change patterns of net primary productivity and its response to climate change in the Qinghai-Tibet Plateau of China from 2000 to 2015. J. Arid Land. 2019, 12, 1–17. [Google Scholar] [CrossRef]
- Wu, C.; Gonsamo, A.; Chen, J.M.; Kurz, W.; Price, D.; Lafleur, P.; Jassal, R.; Dragoni, D.; Bohrer, G.; Gough, C.; et al. Interannual and spatial impacts of phenological transitions, growing season length, and spring and autumn temperatures on carbon sequestration: A North America flux data synthesis. Glob. Planet Change 2012, 92, 179–190. [Google Scholar] [CrossRef]
- Dymond, C.; Beukema, S.; Nitschke, C. Carbon sequestration in managed temperate coniferous forests under climate change. Biogeosciences 2016, 13, 1933–1947. [Google Scholar] [CrossRef]
- Yuan, Q.; Wu, S.; Dai, E.; Zhao, D.; Run, P.; Zhang, X. NPP vulnerability of the potential vegetation of China to climate change in the past and future. J. Geogr. Sci. 2017, 27, 131–142. [Google Scholar] [CrossRef]
- Geng, L.; Che, T.; Wang, X.; Wang, H. Detecting spatiotemporal changes in vegetation with the BFAST model in the Qilian Mountain region during 2000–2017. Remote Sens. 2019, 11, 103. [Google Scholar] [CrossRef]
- Du, J.; Li, K.; He, Z.; Chen, L.; Lin, P.; Zhu, X. Daily minimum temperature and precipitation control on spring phenology in arid–mountain ecosystems in China. Int. J. Climatol. 2020, 40, 2568–2579. [Google Scholar] [CrossRef]
- Li, C.; Zou, Y.; He, J.; Zhang, W.; Gao, L.; Zhuang, D. Response of Vegetation Phenology to the Interaction of Temperature and Precipitation Changes in Qilian Mountains. Remote Sens. 2022, 14, 1248. [Google Scholar] [CrossRef]
- Sun, Y.; Guan, Q.; Wang, Q.; Yang, L.; Pan, N.; Ma, Y.; Luo, H. Quantitative assessment of the impact of climatic factors on phenological changes in the Qilian Mountains, China. For. Ecol. Manag. 2021, 499, 119594. [Google Scholar] [CrossRef]
- Liu, L.; Song, W.; Zhang, Y.; Han, Z.; Li, H.; Yang, D.; Wang, Z.; Huang, Q. Zoning of Ecological Restoration in the Qilian Mountain Area, China. Int. J. Environ. Res. Public Health 2021, 18, 12417. [Google Scholar] [CrossRef]
- Zhou, J.; Cai, W.; Qin, Y.; Lai, L.; Guan, T.; Zhang, X.; Jiang, L.; Du, H.; Yang, D.; Cong, Z.; et al. Alpine vegetation phenology dynamic over 16 years and its covariation with climate in a semi-arid region of China. Sci. Total Environ. 2016, 572, 119–128. [Google Scholar] [CrossRef] [PubMed]
- Ren, S.; Peichl, M. Enhanced spatiotemporal heterogeneity and the climatic and biotic controls of autumn phenology in northerngrasslands. Sci. Total Environ. 2021, 788, 147806. [Google Scholar] [CrossRef] [PubMed]
- Ren, S.; Li, Y.; Peichl, M. Diverse effects of climate at different times on grassland phenology in mid–latitude of the northern hemisphere. Ecol. Indic. 2020, 113, 106260. [Google Scholar] [CrossRef]
- Zhang, Q.; Kong, D.; Shi, P.; Singh, V.; Sun, P. Vegetation phenology on the Qinghai-tibetan plateau and its response to climate change (1982–2013). Agric. For. Meteorol. 2018, 248, 408–417. [Google Scholar] [CrossRef]
- Wang, X.; Piao, S.; Xu, X.; Ciais, P.; MacBean, N.; Myneni, B.; Li, L. Has the advancing onset of spring vegetation green-up slowed down or changed abruptly over the last three decades? Glob. Ecol. Biogeogr. 2015, 24, 621–631. [Google Scholar] [CrossRef]
- Richardson, A.; Keenan, T.; Migliavacca, M.; Ryu, Y.; Sonnentag, O.; Toomey, M. Climate change, phenology, and phenological control of vegetation feedbacks to the climate system. Agric. For. Meteorol. 2013, 169, 156–173. [Google Scholar] [CrossRef]
- Li, Z.; Wang, R.; Liu, B.; Qian, Z.; Wu, Y.; Li, C. Responses of Vegetation Autumn Phenology to Climatic Factors in Northern China. Sustainability 2022, 14, 8590. [Google Scholar] [CrossRef]
- Hopkins, A.D. The bioclimatic law. J. Wash. Acad. Sci. 1920, 10, 34–40. [Google Scholar]
- Ren, S.; Qin, Q.; Ren, H. Contrasting wheat phenological responses to climate change in global scale. Sci. Total Environ. 2019, 665, 620–631. [Google Scholar] [CrossRef]
- Wang, X.; Zhou, Y.; Wen, R.; Zhou, C.; Xu, L.; Xi, X. Mapping Spatiotemporal Changes in Vegetation Growth Peak and the Response to Climate and Spring Phenology over Northeast China. Remote Sens. 2020, 12, 3977. [Google Scholar] [CrossRef]
- Guo, J.; Hu, Y. Spatiotemporal Variations in Satellite-Derived Vegetation Phenological Parameters in Northeast China. Remote Sens. 2022, 14, 705. [Google Scholar] [CrossRef]
- Venkatesh, K.; John, R.; Chen, J.; Xiao, J.; Amirkhiz, R.; Giannico, V.; Kussainova, M. Optimal ranges of social–environmental drivers and their impacts on vegetation dynamics in Kazakhstan. Sci. Total Environ. 2022, 847, 157562. [Google Scholar] [CrossRef] [PubMed]
- Chuine, I.; Morin, X.; Bugmann, H. Warming, photoperiods, and tree phenology. Science 2010, 329, 277–278. [Google Scholar] [CrossRef] [PubMed]
- Tao, Z.; Wang, H.; Liu, Y.; Dai, J. Phenological response of different vegetation types to temperature and precipitation variations in northern China during 1982–2012. Int. J. Remote Sens. 2017, 38, 3236–3252. [Google Scholar] [CrossRef]
- Chen, X.; Xu, L. Temperature controls on the spatial pattern of tree phenology in China’s temperate zone. Agric. For. Meteorol. 2012, 154, 195–202. [Google Scholar] [CrossRef]
- Zhang, R.; Qi, J.; Leng, S.; Wang, Q. Long-Term Vegetation Phenology Changes and Responses to Preseason Temperature and Precipitation in Northern China. Remote Sens. 2022, 14, 1396. [Google Scholar] [CrossRef]
- Shen, M.; Piao, S.; Chen, X.; An, S.; Fu, Y.; Wang, S.; Cong, N.; Janssens, I. Strong impacts of daily minimum temperature on the green–up date and summer greenness of the Tibetan Plateau. Glob. Chang. Biol. 2016, 22, 3057–3066. [Google Scholar] [CrossRef]
- Mirco, M.; Marta, G.; Edoardo, C. Using digital repeat photography and eddy covariance data to model grassland phenology and photosynthetic CO2 uptake. Agric. For. Meteorol. 2011, 151, 1325–1337. [Google Scholar] [CrossRef]
- Cleland, E.; Allen, J.; Crimmins, T.; Dunne, J.; Pau, S.; Travers, S.; Zavaleta, E.; Wolkovich, E. Phenological tracking enables positive species responses to climate change. Ecology 2012, 93, 1765–1771. [Google Scholar] [CrossRef]
- Liu, Q.; Fu, Y.H.; Zhu, Z.; Liu, Y.; Liu, Z.; Huang, M.; Janssens, I.; Piao, S. Delayed autumn phenology in the Northern Hemisphere is related to change in both climate and spring phenology. Glob. Chang. Biol. 2016, 22, 3702–3711. [Google Scholar] [CrossRef]
- Shi, C.; Sun, G.; Zhang, H.; Xiao, B.; Ze, B.; Zhang, N.; Wu, N. Effects of warming on chlorophyll degradation and carbohydrate accumulation of alpine herbaceous species during plant senescence on the Tibetan Plateau. PLoS ONE. 2014, 9, e107874. [Google Scholar] [CrossRef] [PubMed]
- Yang, J.; He, Z.; Du, J.; Chen, L.; Zhu, X.; Li, P.; Li, J. Soil water variability as a function of precipitation, temperature, and vegetation: A case study in the semiarid mountain region of China. Environ. Earth Sci. 2017, 76, 1–13. [Google Scholar] [CrossRef]
- Jin, X.; Wan, L.; Zhang, Y.K. Quantification of spatial distribution of vegetation in the Qilian Mountain area with MODIS NDVI. Int. J. Remote Sens. 2009, 30, 5751–5766. [Google Scholar] [CrossRef]
- Tezara, W.; Mitchell, V.J.; Driscoll, S.D. Water stress inhibits plant photosynthesis by decreasing coupling factor and ATP. Nature 1999, 401, 914–917. [Google Scholar] [CrossRef]
- Venkatesh, K.; John, R.; Chen, J.; Jarchow, M.; Amirkhiz, R.; Giannico, V.; Saraf, S.; Jain, K.; Kussainova, M.; Yuan, J. Untangling the impacts of socioeconomic and climatic changes on vegetation greenness and productivity in Kazakhstan. Environ. Res. Lett. 2022, 17, 095007. [Google Scholar] [CrossRef]
- Richardson, A.D.; Black, T.A.; Ciais, P.; Delbart, N.; Friedl, M.A.; Gobron, N.; Hollinger, D.Y.; Kutsch, W.L.; Longdoz, B.; Luyssaert, S.; et al. Influence of spring and autumn phenological transitions on forest ecosystem productivity. Philos. Trans. R. Soc. B Biol. Sci. 2010, 365, 3227–3246. [Google Scholar] [CrossRef] [PubMed]
- Piao, S.; Ciais, P.; Friedlingstein, P. Net carbon dioxide losses of northern ecosystems in response to autumn warming. Nature 2008, 451, 49–52. [Google Scholar] [CrossRef]
- Buermann, W.; Bikash, P.R.; Jung, M.; Burn, D.; Reichstein, M. Earlier springs decrease peak summer productivity in North American boreal forests. Environ. Res. Lett. 2013, 8, 024027. [Google Scholar] [CrossRef]
Publisher’s Note: MDPI stays neutral with regard to jurisdictional claims in published maps and institutional affiliations. |
© 2022 by the authors. Licensee MDPI, Basel, Switzerland. This article is an open access article distributed under the terms and conditions of the Creative Commons Attribution (CC BY) license (https://creativecommons.org/licenses/by/4.0/).