Abstract
In this paper, we investigate the impact of government subsidies on incubation services in incubators. Based on the use of the Generalized Propensity Score Matching (GPSM) method to effectively overcome the endogeneity problem, we find that there is an inverted U-shaped relationship between government subsidies and incubation services, and thus there is an optimal intensity of government subsidies. The inflection point of the inverted U shape for basic services is much smaller than that for value-added services and investment services. With a wider range of government subsidies, incubators will tend to provide better value-added and investment services rather than basic services. The inverted U-shaped relationship remains robust over time, and the range of appropriate subsidies to promote incubation services is tightening. The conclusions of this paper provide empirical evidence on the effectiveness of government subsidies in incubators, which is conducive to developing more effective industrial policies for future governments.
1. Introduction
We have tracked the development of incubators in various regions in recent years. In the US, according to the official InBIA website (https://impactindex.inbia.org/ecdata/ (accessed on 15 July 2022)), 10% of the revenue of shared office spaces, incubators, and other entrepreneurial service organizations comes from government subsidies. The European Business & Innovation Centre Network (EBN) survey on BICs in 2017–2019 shows that over 60% of BICs’ revenue comes from the EU and other public sectors–incubators are generally called BICs in Europe. Founded in 1984, EBN is the largest business innovation center (BICs) alliance in Europe, supporting the development and growth of innovative entrepreneurs, start-ups, large-scale enterprises, and SMEs. The official website is: https://ebn.eu/ (accessed on 15 July 2022) (see Figure 1). The Israeli government established the Public Technology Incubation Program (PTIP) in the 1990s, while giving huge financial support to high-tech industry incubation with a government venture capital fund as a guarantee [1,2,3]. In order to change the low rate of economic development in the African region, the government proposed to establish an innovation-based economic development program through technology business incubators in the early 21st century, most of which were supported by relevant government departments, such as the Department of Trade & Industry, the Department of Science & Technology, higher education institutions, and EU donors [4,5].
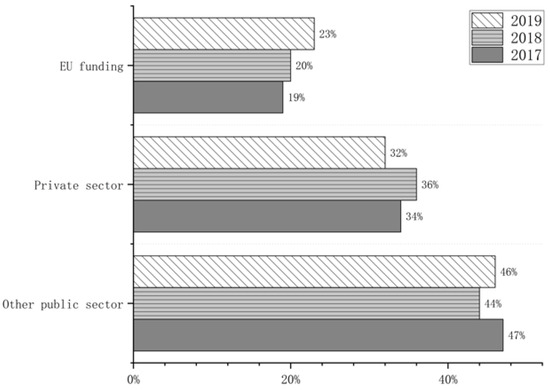
Figure 1.
(EU|BICs) sources of income.
China’s incubator industry was launched in 1987, and by 2019, the number had reached 5206—the highest number of incubators in the world. We have made a detailed review of incubators’ development history, as shown in Figure 2. Prior to 1998, the incubator industry in China developed slowly, with incubators receiving very little policy support from the central government and almost no policy concessions from local governments. Between 1999 and 2005, the central and local governments began to give special funding, financial investment, and other policy support to incubators, most of which were established with government funding and had a public interest character, and the number of incubators steadily increased to over 500. Since 2006, the Chinese government has been supporting the incubation industry with tax incentives, government subsidies, and other policies, and the support has been increasing, while the number of incubators has also increased significantly; especially after 2015, in the context of “mass entrepreneurship and innovation”, the number of incubators exploded due to the renewed inclination of government policies in the field of innovation and entrepreneurship. During its 30 years of development, the incubation industry has witnessed the historical trajectory of China’s economic transformation, social development, and technological take-off, and has become a key node and an important driving force in promoting the integration of science and technology with the economy. Central and local government policies have played a pivotal and appropriate role in this process.
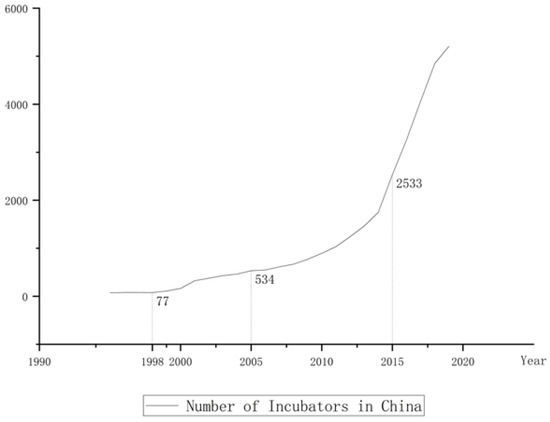
Figure 2.
Graph of changes in the number of incubators in China. Note: The data come from the incubators statistical yearbook of the Torch High Technology Industry Development Center of the Ministry of Science & Technology; incubators that do not report statistics are not counted.
In tracking the development of incubators around the world, we have found that in both developed and developing countries, governments have assumed an important role in the development of incubators, with government subsidies and funding becoming one of their main sources of income. Incubators generally operate on a firm-by-firm basis, and the effectiveness of the services provided by the incubator is the basis and prerequisite for promoting the growth of the incubatees. Different forms, contents, and levels of services may affect the performance of the incubates–such as survival and growth rates [6]. Therefore, whether subsidies help to improve the level of incubation services is an important criterion to objectively judge the effectiveness of government incubation subsidies. Based on these facts, we focus on the following questions: Do government subsidies actually promote the services provided by incubators, so that the development of start-ups benefits from them? Do the subsidies continue to provide incentives to improve the level of incubation services as their intensity increases? What is the difference in the impact of government subsidies on the different services provided by incubators? How has the impact of government subsidy intensity on the level of incubation services changed over time? How should government policies for incubators be optimized in the future? We will fill these gaps in current research based on the most authoritative microdata on Chinese incubators from 2015–2019, with a view to providing theoretical and empirical evidence on the implementation of government subsidies in the incubator industry so as to formulate and optimize government support policies in a more scientific and rational manner.
With regard to the research methodology, we chose generalized propensity score matching to effectively overcome endogeneity and reverse causality problems due to selectivity bias in government subsidies, and conducted a series of robustness tests. The GPSM is an extension of the PSM; while the PSM can deal with selectivity bias, it cannot describe the dynamics of the impact of different government subsidy intensities on incubation services. The GPSM, on the other hand can be used to treat variables on a continuum, explore the non-linear relationship between government subsidies and incubation services, and can examine threshold effects [7].
The paper is structured as follows. Section 2 is the literature review and research hypotheses. Section 3 provides a detailed introduction to the GPSM methodology and defines the relevant variables for this paper. Section 4 is the empirical section, describing the details of the data, demonstrating the existence of the selectivity bias problem, and using a fixed effects model and GPSM to obtain a non-linear relationship between government subsidies and incubation services, measuring the inflection point values for different services and exploring time trends. Section 5 summarizes the main findings of the paper and presents relevant policy recommendations and limitations of the paper.
2. Literature Review and Research Hypotheses
2.1. Literature Review
We have raised the above questions based on the analysis on the current development of the incubator industry around the world. To address these real-life issues, this paper summarizes the previous research literature in terms of the motivation and effectiveness of government subsidies, the classification of incubation services, and government subsidies and incubator development.
2.1.1. Motivation and Effectiveness of Government Subsidies
Government subsidy is an important policy tool for the government to regulate the national economy and social life, in which the motivation of subsidies become a hot issue studied by scholars. Summarizing the current research literature, the motives of government subsidies are as follows: (1) Supporting industrial development. The government usually subsidizes emerging industries or traditionally advantageous industries to promote their development and optimize the regional industrial structure. Aydin, Zhang Y, and Myojo et al. found that government subsidies play an important role in improving industrial dynamics and supporting emerging industries by studying the industrial development of different countries [8,9,10,11]. (2) Whitewashing of local government performance. Wittman, Cerqua, and Tang et al. found that although the direction of subsidies tilted differently in different countries, the motivation is to promote employment and improve the economic level to a large extent. Further, it has been shown that government subsidies have a positive impact on the goals of increasing employment and creating economic value [12,13,14]. (3) Fixing market failures. According to welfare economics, the “visible hand” of the government can, to a certain extent, improve problems that cannot be solved by the market mechanism and reduce efficiency losses. In this respect, scholars focus on the market failure caused by government subsidies in the field of “technological innovation”. Becker found that in order to increase enterprises’ spending on scientific and technological R&D, as well as improve market failure, the government will support enterprises through subsidies [15]. Silva, on the other hand, pointed out the sequential nature of firms’ R&D investments due to the risk of market failure. In order to reduce R&D costs, firms are more inclined to invest financial support from the government into R&D activities [16]. Hou et al. argue that a government subsidy is a form of financial support provided by the government to encourage the development of an industry or firm. The intention is to reduce the cost and risk of R&D investment and to motivate firms to increase their investment in innovation [17].
The effectiveness of government subsidies is another major research hotspot in academia, which has not reached a consensus due to different research objects, definitions of variables, and research methods. Some scholars believe that government subsidies bring positive signals, alleviate the pressure of external financing, stimulate enthusiasm for enterprise technology research and development, boost the innovation output of enterprises, and guide the direction of industrial development [18,19,20,21]; more innovation output wins market power for enterprises, significantly improves their profitability, and thus enhances their financial performance [22]. Some scholars have also found that government subsidies may cause some problems, such as rent-seeking behavior caused by enterprises taking advantage of information asymmetry or abuse of government subsidies [23]. These behaviors are not conducive to the improvement of enterprise production efficiency and will not significantly improve enterprise performance, or even lead to a decline in corporate performance [24]. There is also a small group of scholars who believe that government subsidies can only play a positive role if certain conditions are met, otherwise they will have negative effects [25].
2.1.2. Classification of Incubation Services
Incubators are generally operated by enterprises, and the effectiveness of the services provided by incubators is the basis and prerequisite for promoting the growth of incubates. Different forms, contents, and levels of services may affect the performance of incubates, such as survival and growth rates [7]. In terms of the classification of business incubation services, different scholars have classified them according to different criteria: (1) by function, such as basic services, management support, technical support, and intermediary services [26]; (2) by the material form of service performance, such as tangible services (facilities, office space and equipment, etc.) and intangible services (reputation and credibility, emotional support, etc.) [27,28]; or (3) by whether they add value, i.e., general services and value-added services, with general services mainly referring to physical space, facilities and equipment, property management, etc., and value-added services referring to education and training, management consulting, market development, etc. [29].
In recent decades, the operation model of incubators has been updated and iterated as the entrepreneurial environment and entrepreneurial needs have changed. The first generation of incubators provided only physical space services to tenants; the second generation provided some intangible and valuable services, such as financial services, business mentoring, and technical assistance; the third generation of incubators focused on providing resource links and networking services; and in recent years, the new generation of incubation and acceleration models that focus on direct investment in start-ups have started to emerge in various countries [30].
2.1.3. Government Subsidies and Incubator Development
Current studies have largely concluded that government policies play a key role in promoting incubator development. Adegbite (2001) suggests that the root cause of the failure of the Nigerian incubator industry to develop as desired is the failure of the government to provide reasonable attention and support to the industry in recent years and that the lack of financial subsidies and untimely guidance has hindered the development of incubator enterprises in many parts of the country [31]. Rice (2002) states that government support and guidance are crucial in the growth of the incubator industry and can be a significant catalyst [27]. Santos (2022) uses Coimbra, a medium-sized city in Portugal, as an example to explore how public policies such as government tax incentives for incubators promote the development of a regional innovation ecology and the cultivation of entrepreneurship [32]. Bruneel et al. argue that government subsidies make incubators tend to provide basic services for short-term gains [33]. Tang et al. find that policy support has limited the enhancement of investment and financing services but provides significant incentives for incubators to provide basic services, such as office space, management, and administrative services [34].
An examination of previous studies reveals that the research literature on the impact of government subsidies on incubation services lacks strong data support and scientific econometric methods for analysis. In this paper, based on the most authoritative microdata on Chinese incubators, we investigate this issue and adopt the generalized propensity score matching method–a frontier method in the field of causal inference–to effectively overcome selectivity bias and provide scientific and reliable empirical evidence on the relationship between government subsidies and incubation services based on the existing research.
2.2. Research Hypotheses
Incubation services are the products provided within the incubator and the main source of income for the incubator, and the rational construction of its own service system is the main goal of strategic management of the incubator. Existing research indicates that the main mechanism of enterprise strategic management is the overall arrangement of resource accumulation and allocation. With respect to the “stock” and “flow” of resources, enterprises not only need to maintain their resource base through internal development, external acquisition, or resource borrowing, but also to make continuous decisions on allocation and adjustment to maintain their competitive advantage and sustainability in market development [35]. The incubator–the main object of this paper–acts as a network active node in the business incubation ecosystem, which enables innovation- and entrepreneurship-related parties in the region–which are originally scattered and function independently–to be closely connected through an open and fluid incubation network, releasing huge clustering and synergistic effects, and promoting a more efficient and orderly operation of the whole ecosystem. In this way, incubators can be considered resource transfer stations occupying a central position in the entrepreneurial ecosystem. Compared with other business organizations, the ability to gather and allocate resources is precious and more sensitive to incubators.
Government subsidies as an external resource inflow can have a dual effect on the resource accumulation and allocation mechanisms of the recipient firms [36]. From the perspective of resource accumulation: first, public subsidies directly enrich the pool of available resources for recipients, and they will have direct access to government subsidies, which can cover cost expenditures and help enhance the supply of incubation services [37]. In addition, government subsidies influence the accumulation of resources for recipients through a bridging mechanism, and moderate government subsidies have a “halo effect” as a label of recognition for recipients, sending positive signals to other external stakeholders and enriching the recipients’ access to resources [38]. Incubators that receive government subsidies are more likely to attract research institutions, intermediaries, and investment institutions to join them, thus enriching their accumulated innovation and entrepreneurship resources and improving their incubation services. However, the resource accumulation mechanism predicts only part of the effect of government subsidies; beyond a certain level of government subsidies, the positive impact of resource accumulation may be gradually overshadowed by a loss of resource allocation efficiency. First, conceptually, government subsidies refer to funds allocated to firms by the government without compensation, which are external resources for firms. However, in contrast to other forms of external resources, subsidies operate based on nonmarket exchange mechanisms, i.e., there is no corresponding transfer of the value of the underlying resource, there are no residual use or rent requirements for the original resource holders, and most of the incentives embedded in traditional market exchanges are absent. Thus, the internal rules and efficiency of resource allocation change [39]. For example, government departments may use less stringent economic criteria for project selection, and excessive subsidies lead to strong dependence and inert behaviour of recipients. Many current studies have shown that organizations that rely heavily on public resources for survival are significantly less efficient [40,41]. Second, the government will formulate a series of relevant distribution restrictions and incentive mechanisms in the process of implementing subsidies to make up for the inhibitory effect of the non-market nature of government subsidies; however, due to the non-economic responsibilities between the holders of public resources and the recipients–such as the pursuit of political achievements by government departments and the rent-seeking behavior of the recipients–the efficiency of resource allocation in the implementation of government subsidies will be reduced [42,43].
Based on the above analysis, we first infer that government subsidies have an incentive effect on incubation services, while considering the combination of two sets of opposing effects; at low levels of subsidy intensity, the positive effects related to resource accumulation dominate and incubation services will improve with increasing subsidy intensity, but with increasing subsidy intensity, the negative effects from the loss of resource allocation efficiency will play a major role in offsetting the favorable impact of resource accumulation, thus leading to a decline in the level of incubation services. Therefore, this paper proposes the following hypothesis.
Hypothesis 1.
As the intensity of government subsidies increases from low to high, the relationship between government subsidies and incubation services shows an inverted U shape of rising first and then falling.
Traditional incubators mainly provide space management services, but with the improvement of the social entrepreneurial environment, the rapid growth of startups requires diversified services, and incubators will encounter a ceiling of development if they rely solely on the expansion of space. To achieve their own sustainable development, improve market competitiveness, and obtain sufficient cash flow and future medium- to long-term income, incubators need to continuously expand and enrich the products they can provide, including training, counselling, resource links, networking, financing intermediation, and other value-added services, as well as the internal establishment of incubation funds to provide direct investment services for incubatees, which requires more human and material costs. Government subsidies, as part of the incubator resource pool, are prioritized for expanding the scope of incubation space to obtain low-cost space service income [33], but to achieve their own sustainable development, decision-makers will not expand the scope indefinitely, and redundant resources are used to enhance value-added services and investment services to build and improve their own more complete incubation service system [34]. Therefore, under a wider range of government subsidies, incubators tend to provide better value-added and investment services rather than space-based services. Therefore, the following hypothesis is proposed in this paper.
Hypothesis 2.
The inverted U-shaped inflection point of value-added and investment services is greater than that of space-based services.
As time progresses, the government’s continuous support makes the incubator industry enter a period of rapid development. The data used in this paper are China’s incubator data from 2015 to 2019–which is a period of rapid development of China’s incubators–and the operational capacity of the incubators continues to improve, their ability to “build blood” increases, and the market competition in the entire incubator industry increases, at which time the market plays an enhanced role in resource allocation, and the efficiency of the allocation of resources in the market continues to improve. Excessive government intervention will disrupt the market rules. We infer that the moderate interval in which government subsidies have an incentive effect on incubation services will narrow with the advance of time [44]. Therefore, this paper proposes the following hypothesis.
Hypothesis 3.
The inflection point of the inverted U shape will shift to the left-over time.
3. Research Methodology
3.1. GPSM
Since the receipt of government subsidies by incubators is not a random event, the use of traditional ordinary least squares regressions cannot scientifically assess the effectiveness of government subsidies for incubators. For this reason, Rosenbaum and Rubin proposed the generalized propensity score matching model (GPSM) in 1983 to overcome the selectivity bias in policy implementation and to correctly assess the policy implementation effects. The GPSM is a supplement and extension of propensity score matching (PSM), and its greatest advantage lies in breaking the PSM constraint that the treatment variables must be binary selection variables while retaining the PSM property of eliminating the measurement error caused by the heterogeneity of the treatment and control groups before receiving the policy treatment–that is, the self-selection effect [45].
The basic principle of GPSM is as follows: assume that the continuous-type treatment variable T takes values in the interval and the outcome variable is Y. In this paper, the treatment variable is the intensity of government subsidies, i.e., the share of government subsidies in the total revenue of the incubator, and the outcome variable Y is the service provided by the incubator. Following Imbens (2000) and Hirano and Imbens (2004), the conditional independence in the case of binary treatment variables is extended to the case of continuous-type treatment variables [46,47] as follows.
where Y(t) is the resultant value when the treatment variable T takes the value t. In this paper, this is the corresponding incubator service level when the government subsidy intensity is t. Equation (1) indicates that the selective bias of treatment intensity and the resulting endogeneity problem can be effectively avoided after controlling for the covariate X. The choice of covariate X requires the consideration of factors that affect both treatment intensity T and output level Y. The generalized propensity score (GPS) of the treatment variable is estimated from the covariate X.
where r(t, x) is the conditional probability density of the treatment variable and the generalized propensity score GPS denotes the probability when the treatment variable T takes the value after controlling for the covariate X.
The matching effect of the GPSM also depends on whether the balancing property is satisfied, i.e., the event {T = t} is independent of the covariate X when the control r(T, X) is consistent, i.e.,
On the basis of the above, the GPSM evaluation is performed in three steps in this paper with reference to Hirano and Imbens [47].
In the first step, the conditional probability density of the treatment variable T is estimated based on the covariate X.
The treatment variable in this paper is the government subsidy intensity, which is highly biased in the actual sample; in the data we used, more than one-third of the incubators had zero subsidy intensity and the distribution of subsidy intensity was nonnormal. Based on this particular distributional characteristic of the subsidy intensity data in this paper, we use the fractional logit model proposed by Papke and Wooldridge (1993) to estimate the conditional probability density of subsidy intensity [48]. Papke and Wooldridge assume that for all observed samples i, given the covariate Xi, the conditional probability density of the treatment and the expected value of the variable Ti is
and for all , there is . Assume that the function is a cumulative distribution function of the logistic distribution, expressed as follows.
Clearly, this is a nonlinear model, and we plan to use the quasi-maximum likelihood estimator (QMLE) to estimate β. Following McCullagh and Nelder (1989) [49], the Bernoulli log-likelihood equation is maximized in the framework of a generalized linear model with the following equation.
After estimating β from the above equation, the probability density of the ith observed sample can be calculated, i.e., GPS.
In the second step, the conditional expectation model for the output variable Yi is constructed based on the treatment intensity Ti and the generalized propensity score obtained in the previous step. Again, drawing on Hirano and Imbens (2004) [47], they point out that the specific functional form can be flexible and generally does not exceed a third-order polynomial. In this paper, we choose the third-order polynomial to fit the results more robustly, which can cover the results of first-order or second-order polynomials. In addition, other forms of fitting functions are also tried in this paper, which do not change the conclusions of this study.
In the third step, the expected value of the outcome variable with the treatment variable t is estimated by substituting the regression results obtained in the previous step into the following equation:
where N is the number of sample firms when the treatment variable T takes the value . The range of values of the treatment variable is divided into s subintervals , and then the causal effect of government subsidy intensity on the change in incubator service level is estimated in each subinterval. The causal effects for different ranges of values are connected by lines to obtain a picture of the dose-response function for the whole interval. The treatment effect (since μ(0) is a constant, TE(t) is a translation up and down of the image of the μ(t) function) is given by
3.2. Accounting and Definition of Variables
- Treatment of variables.
The extent of incubators’ utilization of government subsidies is closely related to the incubators’ own strength, and the same number of subsidies occupies different importance in different samples of incubators. Therefore, the treatment variable in this paper is the strength of government subsidies, which is measured by the amount of government subsidies received at each level divided by the total revenue of the incubator.
- 2.
- Outcome variables.
Combining previous studies and the development characteristics of incubators in different generations, this paper divides incubator services into three categories: first, basic services, which mainly refer to space and property management; second, value-added services, which mainly include training, entrepreneurial counselling, resource links, financing intermediary services, network services, etc.; and third, investment services, which mainly refer to the services of incubators that set up incubation funds internally and invest directly in the incubated enterprises.
- 3.
- Covariates.
The selection of covariates needs to consider both the factors affecting the incubator’s access to government subsidies and the factors affecting the services provided by the incubator. In this paper, after referring to the declaration documents issued by the Chinese government and consulting with relevant operators of incubators, the covariates selected are as follows: (i) administrative level of the incubator: the Chinese government annually selects national-level incubators based on their operations in the previous year, and national-level incubators have stronger operational strength and are more likely to receive government subsidies; (ii) nature of the incubator: generally, state-owned incubators have better resource endowment than nonstate-owned incubators; (iii) whether the investor of the incubator has government participation: incubators with a government investment background are more likely to receive government subsidies; (iv) total operating income of the incubator in the previous year: incubators need to declare the operating data of the previous year when declaring government subsidies; and (v) age of the incubator: in order to promote the development of the incubation industry, the government tends to subsidize younger incubators. The selection of variables is shown in Table 1.

Table 1.
Accounting and definition of variables.
4. Empirical Results and Analysis
4.1. Sources of Data and Descriptive Statistical Analysis
This paper uses Chinese incubators from 2015 to 2019 as the sample for analysis, and the research data come from the Torch High Technology Industry Development Centre of the Ministry of Science and Technology of China, which is responsible for the detailed management of business incubators, startup spaces, university science and technology parks, and other entrepreneurial service organizations, and also responsible for the construction and operation of the China Innovation and Entrepreneurship Data Resource Centre, which contains the most comprehensive and authoritative microdata on Chinese incubators to date.
The government measures whether to grant subsidies to incubators based on the previous year’s operating data, so the covariates in this paper are matched with the previous year’s data from the base period. During the data processing, we first eliminated data on key variables such as total revenue, the amount of government subsidies, and the year of establishment of the incubator that were missing and not factually correct, and then matched the data. The final matching was successful for 1517 incubators from 2015–2016, 2399 from 2016–2017, 3372 from 2017–2018, and 3778 from 2018–2019, for a total of 11,066 incubator data.
The number of incubators receiving government subsidies in the sample of 11,066 incubators was 7162, accounting for 64.7%. From the descriptive statistics of the variables in Table 2, some preliminary conclusions can be analysed: (1) The mean value of subsidy intensity, i.e., the amount of government subsidies as a proportion of the total revenue of the incubators, was 16.7% in the full sample. (2) In the sample with Sub > 0, the intensity of subsidies was divided into four intervals, namely, (0,0.026], (0.026,0.236], (0.236,0.507], and(0.507,1], to examine the “self-selection effect” of government subsidies [37,50] and to obtain preliminary evidence of differences in the impact of different subsidy intensities on incubation services. The mean results of the covariates in each interval show that state-owned incubators, incubators with government investment, and incubators with lower revenues in the previous year are more likely to receive government subsidies, suggesting that there is significant sample selectivity in the implementation of government subsidies. Furthermore, from the mean value of the result variable in each interval, we can observe that with the increase of subsidy, the change trend of basic services, value-added services, and investment provided by the incubator is an inverted U-shape.
Table 2.
Descriptive statistics of variables.
4.2. Baseline Regressions
The paper begins with a benchmark regression analysis using an unbalanced short panel dataset from 2015–2019. We conducted a Hausman test on whether to use a fixed effects model or a random effects model, and the results showed the presence of unobserved effects associated with the explanatory variables (p < 0.001), suggesting that using a random effects model would produce inconsistent estimates. Given that omitted effects change with individuals and over time, we ultimately chose a two-way fixed effects model for the baseline regression [36].
We added a quadratic term, sub squared, to test for curve effects, and we included province dummy variables to control for regional effects, considering the different economic development bases of each province. The results of the baseline regression are shown in Table 3. As shown, we obtained that the coefficients of Sub squared are all significantly negative at the 1% level, and the coefficients of Sub are all significant at the 5% level. The results support Hypothesis 1: the relationship between subsidy intensity and incubation services shows an inverted U-shaped relationship as the intensity of subsidies increases from low to high. It is interesting to note that the coefficient of the variable age is positive in the first column and negative in the other columns, which is in line with the rule of intergenerational development of incubators. Traditionally, older incubators have focused more on space-based services, while with the changing needs of the entrepreneurial market, newer and younger incubators are more inclined to establish a service system with emphasis on value-added services and investment services.
Table 3.
Baseline regression results.
4.3. Selective Bias Problem–GPSM
In the previous baseline regressions, we obtained preliminary evidence of an inverted U-shaped relationship between subsidy intensity and incubation services. However, since government subsidies to incubators are not a random event, the endogenous problem of the ‘self-selection effect’ makes the baseline regression results above subject to some error. Therefore, we use the Generalized Propensity Score Matching (GPSM) method, a cutting-edge method in the field of causal inference, to effectively overcome the selectivity bias and scientifically evaluate the impact of government subsidy levels on incubation services. In addition, the GPSM approach can also obtain the optimal government subsidy intensity from the results compared to the traditional PSM method.
4.3.1. Fractional Logit Regression of Subsidy Intensity
We examined the kernel density distribution for the total sample and the subsample of sub > 0, as shown in Figure 3; it is intuitive to see that the government subsidy intensity shows a clear skewed distribution and is mainly concentrated on the left-hand side, which does not conform to a normal distribution, so this paper uses the fractional logit estimation (6) equation mentioned earlier. We first conducted the analysis using the total sample of 11,066 data from 2015–2019, after controlling for time and region effects, and explored the results for each sub-year to ensure robustness. The regression results are shown in Table 4.
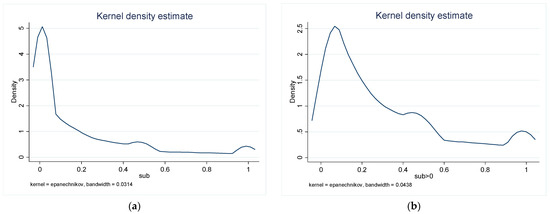
Figure 3.
Graph of kernel density distribution. (a) Kernel density distribution for the total sample; (b) Kernel density distribution for the subsample of sub > 0.
Table 4.
Fractional logit regression results.
We can observe that the positive or negative regression coefficients of each variable in the different columns are the same, except for the coefficient of the national variable in the regression results for 2016–2017, which does not pass the significance test. All other regression coefficients are significant at the 5% level, which shows that the estimation results of the fractional logit model are stable.
From the results, the coefficients of the variables level, national, and Gov_invest are positive, indicating that national incubators, state-owned incubators, and incubators with a background of government investment received more government subsidies than other incubators, while the negative coefficients on the variables revenue and age suggest that the lower the income of the incubator and the younger it is, the greater the intensity of government subsidies it received. This is consistent with some of the initial conclusions drawn from the statistical description of the variables, which suggest that the decision of government subsidies is somewhat “protective of the weak”. This is partly because incubators have a significant impact on the transformation of technological achievements and the development of SMEs in the region. The government, in pursuit of political goals, supports incubators that are less well developed; on the other hand, incubators tend to ex ante adverse selection when applying for subsidies, and false signals from incubators may be used to deceive policymakers. Therefore, the existence of sample selection bias is further confirmed.
4.3.2. Results of the “Dose-Response” Function
Figure 4, Figure 5 and Figure 6 show the “dose-response” function between government subsidy intensity and basic, value-added, and investment services, respectively, with the dotted lines representing the upper and lower 95% confidence lines for this function. The results show that traditional basic service, as the intensity of the incubation subsidy increases, shows an inverted U-shaped relationship that rises and then falls. Among the value-added and investment services, there are obvious “N”-shaped relationships between the intensity of government subsidies and the services, i.e., the level of services “rises, then falls, then rises” as the intensity of subsidies increases from nonexistent to low to high. However, it is worth noting that at policy intensities above 0.80, the upper and lower 95% confidence intervals of the ‘dose-response’ function are inflated, and the statistical significance of the effect of subsidy intensity on service levels is not guaranteed. This is due to the small sample of incubators at higher ‘subsidy’ intensities, accounting for only 5% of the total sample, resulting in statistically insignificant results. Therefore, on a consolidated basis, the relationship between the level of subsidy and the services provided by the incubator can be seen as ‘inverted U’-shaped, verifying H1. This means that when the subsidy is small, the marginal impact of the government subsidy on the incubation service is positive, there is an incentive effect. However, when the subsidy intensity is large, the incentive effect will disappear, and the marginal impact of the subsidy intensity on the incubation service become negative.
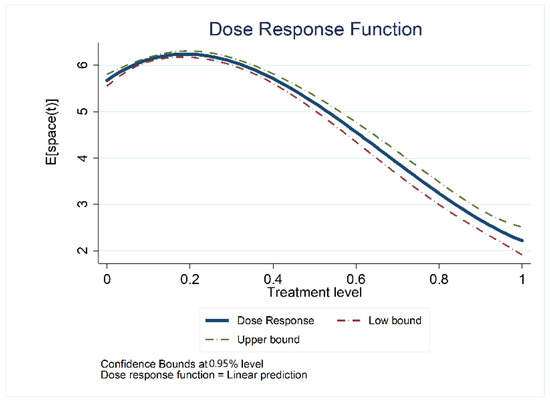
Figure 4.
The “dose-response” function for basic services.
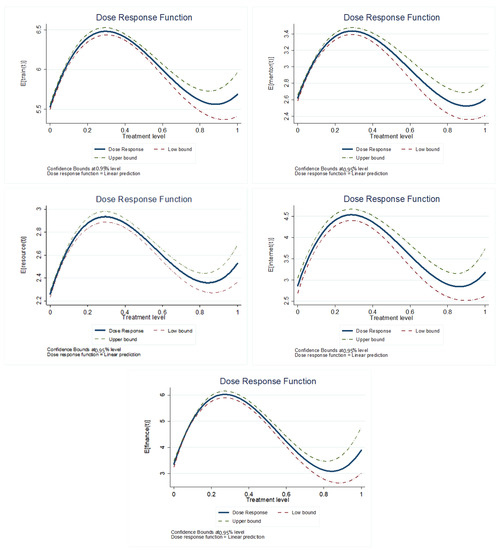
Figure 5.
The “dose-response” function for value-added services.
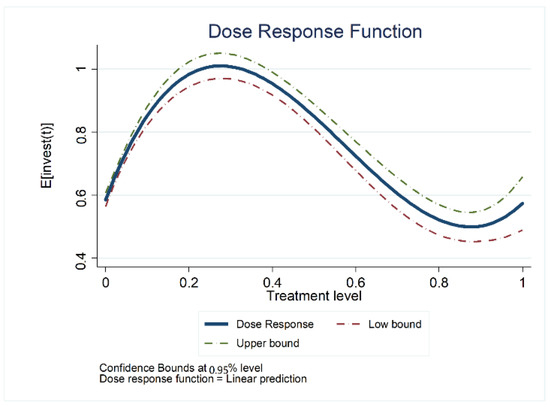
Figure 6.
The “dose-response” function for investment services.
The inflection points for each service in the dose-response function are shown in Table 5, which shows that the inflection point for basic spatial services is 0.18, for value-added services lies between [0.26, 0.29], and for investment services is 0.28. In comparison, the optimal subsidy intensity for basic services is much smaller than for value-added and investment services, which validates Hypothesis 2. It can be noted that as subsidies increase, there is a negative marginal impact on space services when the intensity exceeds a certain limit, but at this point, government subsidies still provide incentives for incubators to provide higher levels of value-added and investment services.
Table 5.
Inflection points for each service in the inverted U-shaped relationship.
4.4. Robustness and Time Trend
To test whether the conclusions of this paper remain robust across the various subsamples or whether new findings emerge, this paper also distinguishes incubators into state-owned and private incubators according to their properties, into comprehensive incubators and professional incubators (professional incubators focus on serving start-ups in a specific field) according to their types, and into eastern and non-eastern regions according to the location of the incubators. We conduct GPSM tests on the subsamples divided by the above three dimensions, and the above conclusions remain robust across all subsamples tested. The detailed results are shown in Appendix A.
To test the stability of the inverted U-shaped relationship between subsidy intensity and incubation services over time, the paper estimates a “dose-response” function for each year, the results of which are presented in Appendix B. The results show that the shape of the “dose-response” function is similar for each year, which indicates that this particular inverted U-shaped relationship is stable and that the results of Hypothesis 1 are robust.
However, the points of inflection vary from year to year. As shown in Table 6, the range of subsidy intensity with a positive marginal impact on incubation services, whether basic services, value-added services, or investment services, narrows over time, and H3 is verified. Such a finding seems to give us a signal that as the government continues to pay attention, more socioeconomic resources are concentrated in the incubation industry, which promotes the positive development of the incubators, enhances the overall market competition, and increases the efficiency of the market in regulating the allocation of resources, while excessive government support is not conducive to the development of the industry. Therefore, in subsequent development, the government may need to consider changing its role from that of a “supporter” to that of a “coordinator”, and adjust its industrial support policies for incubators.
Table 6.
Time trends in the impact of government subsidies on incubation services.
5. Conclusions and Insights
In the new era, the vigorous development of science and technology is an important initiative for countries to break through the bottleneck of economic development, and incubators have received key attention from governments as a hotbed for nurturing technology-based SMEs. The focus of this paper is to discuss the impact of government industrial policy on the development of the incubation sector–government subsidies–on the services provided by incubators to SMEs. We explore causality using a frontier approach in the field of causal inference, Generalized Propensity Score Matching, which has the advantage of addressing selectivity bias in the implementation of government subsidies, weakening the endogeneity and reverse causal effects of the model, and enabling more stable and reliable conclusions to be drawn.
5.1. Conclusions
Using the most authoritative microdata on incubators in China from 2015–2019, this paper investigates the impact of subsidy intensity on incubation services using a Generalized Propensity Score Matching method. It is concluded that government subsidies do significantly stimulate the improvement of incubation services; however, this relationship holds only within a certain range of government subsidy intensity. More specifically, there is an inverted U-shaped relationship between subsidy intensity and incubation services, with an optimal level of government subsidies. This means that as the intensity of subsidies increases, the marginal effect of government subsidies on incubation services changes from positive to negative. In terms of the type of service, the optimal level of subsidies for basic services is much smaller than that for value-added services and investment services. In the time dimension, the inflection point of the inverted U-shaped relationship for each service–the optimal level of government subsidies–trended to the left as time went on, i.e., the moderate range where subsidies had a marginal positive effect on all services narrowed. The shape of the “dose-response” function did not change for each year from 2015 to 2019, and the results of group tests by property, type, and location of incubators all proved the robustness of the paper’s findings.
5.2. Policy Insights
Industrial policy is rich in connotations, and in the real economy, government subsidies are preferred because they have the advantage of “short treatment and quick results” and can bring the government dazzling achievements in a short period of time. However, in the process of subsidies, there is also rent-seeking behaviour, resulting in a reduction in the efficiency of government subsidies, and excessive government subsidies can cause some enterprises to get “cartilage disease”, grabbing government subsidies as a life-saving straw to keep transfusing blood, thus constantly losing the ability to develop themselves. As the incubator industry is still in its early stages of development in many countries and is important for science and technology, it is necessary for the government to support the industry. However, more government subsidies are not necessarily better. The findings of this paper have the following policy implications.
- (1)
- Capturing the right amount of subsidy policy intensity. This paper, after overcoming selectivity bias, arrives at an inverted U-shaped relationship between the intensity of government subsidies and incubation services. The government should not be blind in its subsidies; it is not always the case that more generous input will result in higher performance. The key is to grasp the intensity of the policy to achieve the ‘win–win’ goal of improving performance and optimizing incubation services. From the findings of the full sample in this paper, it is generally appropriate for government subsidies to account for less than 30% of incubator revenues.
- (2)
- Improving the regulatory mechanism after government subsidies. From the results of this paper, it appears that the range of subsidies that have a marginal positive impact on the basic services of the space is much smaller than that of value-added services and investment services. However, in reality, most incubators tend to pursue short-term benefits after receiving government subsidies and thus blindly expand the scope of their space. The government should assess the amount of subsidies given to incubators on a regular basis to avoid incubators being reduced to “second home owners” in the market, resulting in a waste of government resources.
- (3)
- Enriching incubator industry support policies. From a time-dimensional point of view, the moderate range of marginal positive impacts of government subsidies on incubation services is gradually shrinking, which may also be a signal to remind the government of the need to adjust its industrial support policies for the incubator industry. In addition to short, fast, and direct government subsidies, there are various forms of industrial support. Compared to government subsidies–which have many communication costs, running costs, supervision costs, and even the challenge of corruption and other problems in the process, from planning, implementation, evaluation to supervision–a universal tax incentive policy can reduce these unnecessary losses. The government should flexibly combine different industrial policies based on different policy features to achieve 1 + 1 > 2 policy effects. In the future, it would be a better option for the government to set up incubation funds to support incubators and start-ups.
5.3. Limitations
As this paper creatively explores the relationship between the strength of government subsidies and different incubation services, it demonstrates the existence of the problem of selective bias in the implementation of government subsidies, and robustness tests are conducted on the non-linear relationship between government subsidies and incubation services using fixed effects models and GPSM. However, it has not been feasible to explore the cross-sectional determination of the boundary of the U-shaped relation. In other words, under which circumstances the U-shaped relation would be strong or weak, or even become monotonic? This will help the government to introduce more precise and differentiated policies, and is a direction in which future research can be deepened.
Author Contributions
Conceptualization, J.L. and Z.Y.; methodology, J.L. and Z.Y.; validation, J.L.; investigation, J.L., Z.Y and B.L.; writing—original draft preparation, J.L. and B.L.; writing—review and editing, J.L. and B.L.; supervision, Z.Y.; funding acquisition, Z.Y. All authors have read and agreed to the published version of the manuscript.
Funding
This research was funded by Beijing Municipal Government Advisory Committee decision consulting topic “Research on International Benchmarking and Ability Improvement of Beijing Entrepreneurship-Incubation System”, grant number-Z201100009519011.
Institutional Review Board Statement
Not applicable.
Informed Consent Statement
Not applicable.
Data Availability Statement
The data presented in this study are available on request from the corresponding author. The data are not publicly available due to privacy.
Conflicts of Interest
The authors declare no conflict of interest.
Appendix A
“Dose-response” functions for various subsamples (As before, we focus only on cases where the subsidy intensity is less than 0.8. This is because when the subsidy intensity is greater than 0.8, statistical significance is not met due to the small study sample.).

Figure A1.
The “dose-response” functions of state-owned and private incubators.
Figure A1.
The “dose-response” functions of state-owned and private incubators.


Figure A2.
The “dose-response” functions of comprehensive and professional incubators.
Figure A2.
The “dose-response” functions of comprehensive and professional incubators.


Figure A3.
The “dose-response” functions of eastern and non-eastern incubators.
Figure A3.
The “dose-response” functions of eastern and non-eastern incubators.

Appendix B
Time trends in dose-response functions (As before, we focus only on cases where the subsidy intensity is less than 0.8. This is because when the subsidy intensity is greater than 0.8, statistical significance is not met due to the small study sample.).

Figure A4.
Time trends in dose-response functions.
Figure A4.
Time trends in dose-response functions.

References
- Avnimelech, G.; Schwartz, D.; Bar-El, R. Entrepreneurial high-tech cluster development: Israel’s experience with venture capital and technological incubators. Eur. Plan Stud. 2007, 15, 1181–1198. [Google Scholar] [CrossRef]
- Frenkel, A.; Shefer, D.; Miller, M. Public versus private technological incubator programmes: Privatizing the technological incubators in Israel. Eur. Plan Stud. 2008, 16, 189–210. [Google Scholar] [CrossRef]
- Avnimelech, G.; Teubal, M. Creating venture capital industries that co-evolve with high tech: Insights from an extended industry life cycle perspective of the Israeli experience. Res. Policy 2006, 35, 1477–1498. [Google Scholar] [CrossRef]
- Ndabeni, L.L. The contribution of business incubators and technology stations to small enterprise development in South Africa. Dev. South. Afr. 2008, 25, 259–268. [Google Scholar] [CrossRef]
- Mothibi, G. The Influence of Business Incubation Services on the Performance of Small Medium Enterprises in the South African Tourism Industry. In 10th European Conference on Management Leadership and Governance (ECMLG); Academic Conferences International Limited: Reading, UK, 2014; pp. 569–576. [Google Scholar]
- Wang, H.; Lin, D.; Yin, H.; Lu, Q.; Cheng, H. IEEE Linking Incubator Services to the Performance of Incubated Firms: A Review. In IEEE International Conference on Management of Innovation and Technology; IEEE: New York, NY, USA, 2008; p. 894. [Google Scholar]
- Zhang, G.; Guan, R.; Wang, H. The Nonlinear Causal Relationship Between Environmental Regulation and Technological Innovation-Evidence Based on the Generalized Propensity Score Matching Method. Sustainability 2020, 12, 352. [Google Scholar] [CrossRef]
- Aydin, U. Promoting industries in the global economy: Subsidies in OECD countries, 1989 to 1995. J. Eur. Public Policy 2007, 14, 115–131. [Google Scholar] [CrossRef]
- Zhang, Y.; Han, Q. Development of electric vehicles for China’s power generation portfolio: A regional economic and environmental analysis. J. Clean Prod. 2017, 162, 71–85. [Google Scholar] [CrossRef]
- Myojo, S.; Ohashi, H. Effects of consumer subsidies for renewable energy on industry growth and social welfare: The case of solar photovoltaic systems in Japan. J. Jpn. Int. Econ. 2018, 48, 55–67. [Google Scholar] [CrossRef]
- Buravleva, Y.; Tang, D.; Bethel, B.J. Incentivizing Innovation: The Causal Role of Government Subsidies on Lithium-Ion Battery Research and Development. Sustainability 2021, 13, 8309. [Google Scholar] [CrossRef]
- Wittman, D. Competitive governments: An economic theory of politics and public finance. South. Econ. J. 1998, 64, 1011–1012. [Google Scholar] [CrossRef]
- Cerqua, A.; Pellegrini, G. Do subsidies to private capital boost firms’ growth? A multiple regression discontinuity design approach. J. Public Econ. 2014, 109, 114–126. [Google Scholar] [CrossRef]
- Tang, Q.; Luo, D. An Empirical Study on the Motivation and Effect of Government Subsidy. Financ. Stud. 2007, 6, 149–163. [Google Scholar]
- Becker, B. Public R&D policies and private R&D investment: A survey of the empirical evidence. J. Econ. Surv. 2015, 29, 917–942. [Google Scholar]
- Silva, F.; Carreira, C. Do financial constraints threat the innovation process? Evidence from Portuguese firms. Econ. Innov. New Technol. 2012, 21, 701–736. [Google Scholar] [CrossRef]
- Hou, P.; Zhou, M.; Xu, J.; Liu, Y. Financialization, Government Subsidies, and Manufacturing R&D Investment: Evidence from Listed Companies in China. Sustainability 2021, 13, 12633. [Google Scholar]
- Zhan, J.; Shao, X.; Xu, M. Influence of government subsidies on agricultural firms R&D investment. Sci. Res. Manag. 2019, 40, 103–111. [Google Scholar]
- Hu, J.; Huang, Q.; Pan, X. Environmental Regulation, Government Subsidies and Innovation Quality: Quasi-Natural Experiment Based on China’s Carbon Emissions Trading Pilot. Sci. Sci. Manag. S. T. 2020, 41, 50–65. [Google Scholar]
- Wu, J.; Shang, J. Green Credit Financing Equilibrium under Government Subsidy and Supply Uncertainty. Sustainability 2021, 13, 12917. [Google Scholar] [CrossRef]
- Jia, L.; Nam, E.; Chun, D. Impact of Chinese government subsidies on enterprise innovation: Based on a three-dimensional perspective. Sustainability 2021, 13, 1288. [Google Scholar] [CrossRef]
- Zuniga-Vicente, J.A.; Alonso-Borrego, C.; Forcadell, F.J.; Galan, J.I. Aassessing the effect of public subsidies on firm R&D investment: A survey. J. Econ. Surv. 2014, 28, 36–67. [Google Scholar]
- Boldrin, M.; Levine, D.K. Rent-seeking and innovation. J. Monet. Econ. 2004, 51, 127–160. [Google Scholar] [CrossRef]
- Tzelepis, D.; Skuras, D. The effects of regional capital subsidies on firm performance: An empirical study. J. Small Bus. Enterp. Dev. 2004, 11, 121–129. [Google Scholar] [CrossRef]
- Gao, W.; Wang, D. Will Increasing Government Subsidies Promote Open Innovation? A Simulation Analysis of China’s Wind Power Industry. Sustainability 2021, 13, 13497. [Google Scholar] [CrossRef]
- Bergek, A.; Norrman, C. Incubator best practice: A framework. Technovation 2008, 28, 20–28. [Google Scholar] [CrossRef]
- Rice, M.P. Co-production of business assistance in business incubators—An exploratory study. J. Bus Ventur. 2002, 17, 163–187. [Google Scholar] [CrossRef]
- Bollingtoft, A.; Ulhoi, J.P. The networked business incubator—Leveraging entrepreneurial agency? J. Bus Ventur. 2005, 20, 265–290. [Google Scholar] [CrossRef]
- Sung, T.K.; Gibson, D.V.; Kang, B.S. Characteristics of technology transfer in business ventures: The case of Daejeon, Korea. Technol Forecast. Soc. 2003, 70, 449–466. [Google Scholar] [CrossRef][Green Version]
- Pauwels, C.; Clarysse, B.; Wright, M.; Van Hove, J.U. Understanding a new generation incubation model: The accelerator. Technovation 2016, 50–51, 13–24. [Google Scholar] [CrossRef]
- Adegbite, O. Business incubators and small enterprise development: The Nigerian experience. Small Bus. Econ. 2001, 17, 157–166. [Google Scholar] [CrossRef]
- Santos, D. Building entrepreneurial ecosystems: The case of Coimbra. J. Sci. Technol. Policy Manag. 2022, 13, 73–89. [Google Scholar] [CrossRef]
- Bruneel, J.; Ratinho, T.; Clarysse, B.; Groen, A. The Evolution of Business Incubators: Comparing demand and supply of business incubation services across different incubator generations. Technovation 2012, 32, 110–121. [Google Scholar] [CrossRef]
- Tang, M.F.; Lee, J.; Liu, K.; Lu, Y. Assessing government-supported technology-based business incubators: Evidence from China. Int. J. Technol. Manag. 2014, 65, 24–48. [Google Scholar] [CrossRef]
- Dierickx, I.; Cool, K. Asset Stock Accumulation And The Sustainability of Competitive Advantage—Reply. Manag. Sci. 1989, 35, 1514. [Google Scholar] [CrossRef]
- Jourdan, J.; Kivleniece, I. Too much of a good thing? The dual effect of public sponsorship on organizational performance. Acad. Manag. J. 2017, 60, 55–77. [Google Scholar] [CrossRef]
- Xu, Z.; Cai, E.; Chen, C. Does Incubation Subsidies Improve Incubation Services?: Empirical Study on Incubator Data of Guangdong Province. Sci. Sci. Manag. S. T. 2021, 42, 20–31. [Google Scholar]
- Feldman, M.P.; Kelley, M.R. The ex-ante assessment of knowledge spillovers: Government R&D policy, economic incentives and private firm behavior. Res. Policy 2006, 35, 1509–1521. [Google Scholar]
- Alchian, A.A.; Demsetz, H. Production, Information Costs, And Economic Organization. Am. Econ. Rev. 1972, 62, 777–795. [Google Scholar]
- Boardman, A.E.; Vining, A.R. Ownership and performance in competitive environments—A comparison of the performance of private, mixed, and state-owned enterprises. J. Law Econ. 1989, 32, 1–33. [Google Scholar] [CrossRef]
- Williamson, O.E. Public and private bureaucracies: A transaction cost economics perspective. J. Law Econ. Organ. 1999, 15, 306–342. [Google Scholar] [CrossRef]
- Ramaswamy, K.; Li, M.F.; Veliyath, R. Variations in ownership behavior and propensity to diversify: A study of the Indian corporate context. Strateg. Manag. J. 2002, 23, 345–358. [Google Scholar] [CrossRef]
- Shleifer, A. State versus private ownership. J. Econ. Perspect. 1998, 12, 133–150. [Google Scholar] [CrossRef]
- Restuccia, D.; Rogerson, R. Policy distortions and aggregate productivity with heterogeneous establishments. Rev. Econ. Dynam. 2008, 11, 707–720. [Google Scholar] [CrossRef]
- Rosenbaum, P.R.; Rubin, D.B. The central role of the propensity score in observational studies for causal effects. Biometrika 1983, 70, 41–55. [Google Scholar] [CrossRef]
- Imbens, G.W. The role of the propensity score in estimating dose-response functions. Biometrika 2000, 87, 706–710. [Google Scholar] [CrossRef]
- Hirano, K.; Imbens, G.W. The Propensity Score with Continuous Treatments. In Applied Bayesian Modelling and Causal Inference from Incomplete-Data Perspectives; Wiley Online Librar: New York, NY, USA, 2004; pp. 73–84. [Google Scholar]
- Papke, L.E.; Wooldridge, J.M. Econometric Methods for Fractional Response Variables with an Application to 401(k) Plan Participation Rates; National Bureau of Economic Research, Inc.: Cambridge, MA, USA, 1993. [Google Scholar]
- McCullagh, P.; Nelder, J.A. Generalized Linear Model; Chapman & Hall/CRC: New York, NY, USA, 1989. [Google Scholar]
- Kang, Z.; Zhang, Y.; Tang, X.; Liu, X. Does the Policy of “Reducing Carbon” Restrict the Export of Chinese Enterprises. China Ind. Econ. 2018, 9, 117–135. [Google Scholar]


Publisher’s Note: MDPI stays neutral with regard to jurisdictional claims in published maps and institutional affiliations. |
© 2022 by the authors. Licensee MDPI, Basel, Switzerland. This article is an open access article distributed under the terms and conditions of the Creative Commons Attribution (CC BY) license (https://creativecommons.org/licenses/by/4.0/).