Article

Spatiotemporal Changes in Waterfowl Habitat Suitability in the Caohai Lake Wetland and Responses to Human Activities

1
School of Ecological Engineering, Guizhou University of Engineering Science, Bijie 551700, China
2
Guizhou Province Key Laboratory of Ecological Protection and Restoration of Typical Plateau Wetlands, Bijie 551700, China
*
Author to whom correspondence should be addressed.
Sustainability 2022, 14(21), 14409; https://doi.org/10.3390/su142114409
Submission received: 4 October 2022 / Revised: 23 October 2022 / Accepted: 28 October 2022 / Published: 3 November 2022

Abstract

:
The Caohai Lake wetland is one of the most important wetlands in China and is also one of the most important overwintering areas for waterfowl. However, the spatiotemporal changes in the waterfowl habitat’s suitability and its response patterns to human activities are still unclear. Understanding these patterns is key to plateau wetland biodiversity conservation. In this study, remote sensing, the geographic information system, and global positioning system (3S) technology were employed, and the water source status, disturbance, shelter, and food availability were used as evaluation factors for waterfowl habitat selection. A suitability evaluation model was constructed to evaluate the spatiotemporal characteristics of the Caohai Lake wetland habitat’s suitability in 2000, 2010, and 2022, and to evaluate the response mechanisms of the waterfowl toward human activities. The results show the following: (1) there were frequent changes in the suitability grade of the study area from 2000 to 2022, and there was an overall trend toward improvement as the areas of suitable regions continuously increased. This was due to the continuous improvements in water source status, food availability, and shelter. (2) Human disturbances gradually increased from 2000 to 2022, and the human disturbance index was negatively correlated with the waterfowl habitat suitability. (3) There were significant spatial differences in the suitable waterfowl habitats. The marshlands near the banks of the lake were the regions with optimum and good suitability, while the areas of poor suitability and unsuitable regions were the deep-water areas, roads, and residential areas with high human disturbance, along with the regions near these areas. It is vital to further decrease human disturbances, in order to increase the habitat suitability of the study area.

1. Introduction

Waterfowl are a valuable natural resource [1] that can help to promote and maintain material cycles and energy flow in ecosystems [2]. Wetlands are important habitats for resident birds and migratory birds [3] and are important sites for foraging, breeding, raising offspring, and as migration stopovers [4]. Waterfowl are extremely sensitive to habitat structure and quality [5]. Irrational structural changes and the decreased quantity and quality of habitats will threaten the survival of waterfowl that are dependent on wetlands [6]. However, the area and quality of many wetlands in the world have drastically decreased [7], causing around 20% of the waterfowl that are dependent on wetlands for survival to become endangered [8]. Climate change [9,10], food production [11], urbanization, and industrial development [12,13] are the natural and human factors that are considered to be the main reasons for the decrease in wetland quantity and quality. Therefore, the rapid and accurate evaluation of the spatiotemporal changes in waterfowl habitat suitability and determining the response mechanisms of habitat suitability under human activities have important significance for formulating scientific and effective biodiversity conservation measures and sustainable land use policies.
Recently, many researchers have conducted extensive studies on habitat suitability at different spatial scales, such as nature reserves, river basins, and regions, and the generalized linear model (GLM) [14], ecological-niche factor analysis (ENFA) [15], multi-criteria analysis model [16], resource model [17], fuzzy comprehensive assessment model [18], vulnerability index [19], K-means cluster analysis [20], mechanistic model [21], and maximum entropy model (MaxEnt) [22] have been widely used in species habitat suitability studies. These methods all require information about the species’ spatial distribution and the surrounding habitat characteristics for the model construction, while the differences in the models represent the methods of measuring the relationship between species distribution and habitat characteristics. It can be seen that the acquisition of species distribution data and the determination of the habitat factors affecting habitat selection are key when using these models. Field surveys are the most commonly used method for obtaining species habitat site information. This method requires experienced investigative staff and consumes a great deal of time and resources [23]. In addition, it is difficult to obtain distribution data for rare and endangered species in restricted areas and remote areas [24], and these regions are unsuitable for long-term monitoring. Satellite remote sensing and unmanned aerial vehicles can be used to identify canopy nests [25] and feces [26] can be used to indirectly determine the distribution and quantity of species sites, which can compensate for the shortcomings of onsite surveys, to some extent [27,28]. However, there are several problems, such as a high identification error and low precision, particularly in regions with abundant vegetation. The selection of the habitat characteristics is mostly based on the physiological needs and preferences of the study subjects [16,29]. The hydrological conditions [30], food sources [31], and human disturbances [32] are considered to be important environmental factors that affect the distribution and abundance of waterfowl species. The geographic information system (GIS) and remote sensing (RS) techniques possess strong spatial analysis and monitoring advantages and are most commonly used to obtain and analyze the habitat factors [33]. The normalized difference vegetation index (NDVI), based on RS calculations, can reflect the vegetation growth status and vegetation cover and is often used as a characterization factor for waterfowl food availability [34]. The slope data obtained from digital elevation models (DEMs) are often used for shelter evaluation [35]. The water area, density, and depth affect waterfowl abundance [36]. Human disturbances are an important factor that affects waterfowl habitat selection [37] since the expansion of human activities is represented by residential areas and roads, which shrink waterfowl breeding grounds, habitats, and foraging sites [38], thereby affecting their survival and development. Residential area and traffic network data are mostly obtained from interpreting the remote sensing images [39]. It can be seen that GIS and RS can be used to monitor the changes in habitat caused by natural and/or human activities [40].
Existing studies on waterfowl habitat suitability are important for conserving endangered animals, but there are some shortcomings. First, the difficulty in obtaining the species’ spatial distribution information limits the use of models, and it is especially difficult to perform long time-series evaluations. Second, previous studies only conducted simple estimations of potential species distributions, and previous analyses of the response mechanisms of species habitat selection toward human activities are insufficient, resulting in the limited mitigation of human–bird conflicts. Finally, most of the previous studies conducted analyses on an endangered species, but few studies have carried out comprehensive analyses of common life habits and the environmental needs of multiple species. The Caohai Lake wetland is a classic and complete karst plateau wetland ecosystem that represents a habitat and overwintering site for important waterfowl on the Yunnan-Guizhou Plateau, and it has abundant bird resources. Recently, we conducted the third integrated scientific survey of Caohai Lake [41] and recorded 17 orders, 53 families, and 246 species of birds. There were 132 migratory birds, of which 46 were listed in the International Union for the Conservation of Nature (IUCN) Red List of threatened species. Based on incomplete statistics, the total number of migratory birds that overwintered at this lake was 90,000, as of 30 May. However, the Caohai Lake wetland is close to the county seat and land cover changes have been rapid, resulting in significant human–bird conflicts, urbanization, and lake degradation problems [42]. In order to rapidly and effectively monitor and assess the spatiotemporal changes to the waterfowl habitat suitability and determine the waterfowl response mechanisms to human activities, we employed remote sensing, the geographic information system, and global positioning system (3S) technology, along with waterfowl life habits and habitat needs, to construct a habitat suitability evaluation method that is not dependent on spatiotemporal information about the species. This model was used to evaluate the spatiotemporal characteristics of the Caohai Lake wetland waterfowl habitat suitability in 2000, 2010, and 2020, and the response mechanisms of the waterfowl toward human activities were examined to provide support for formulating scientific and effective biodiversity conservation measures for limited land resources.

2. Materials and Methods

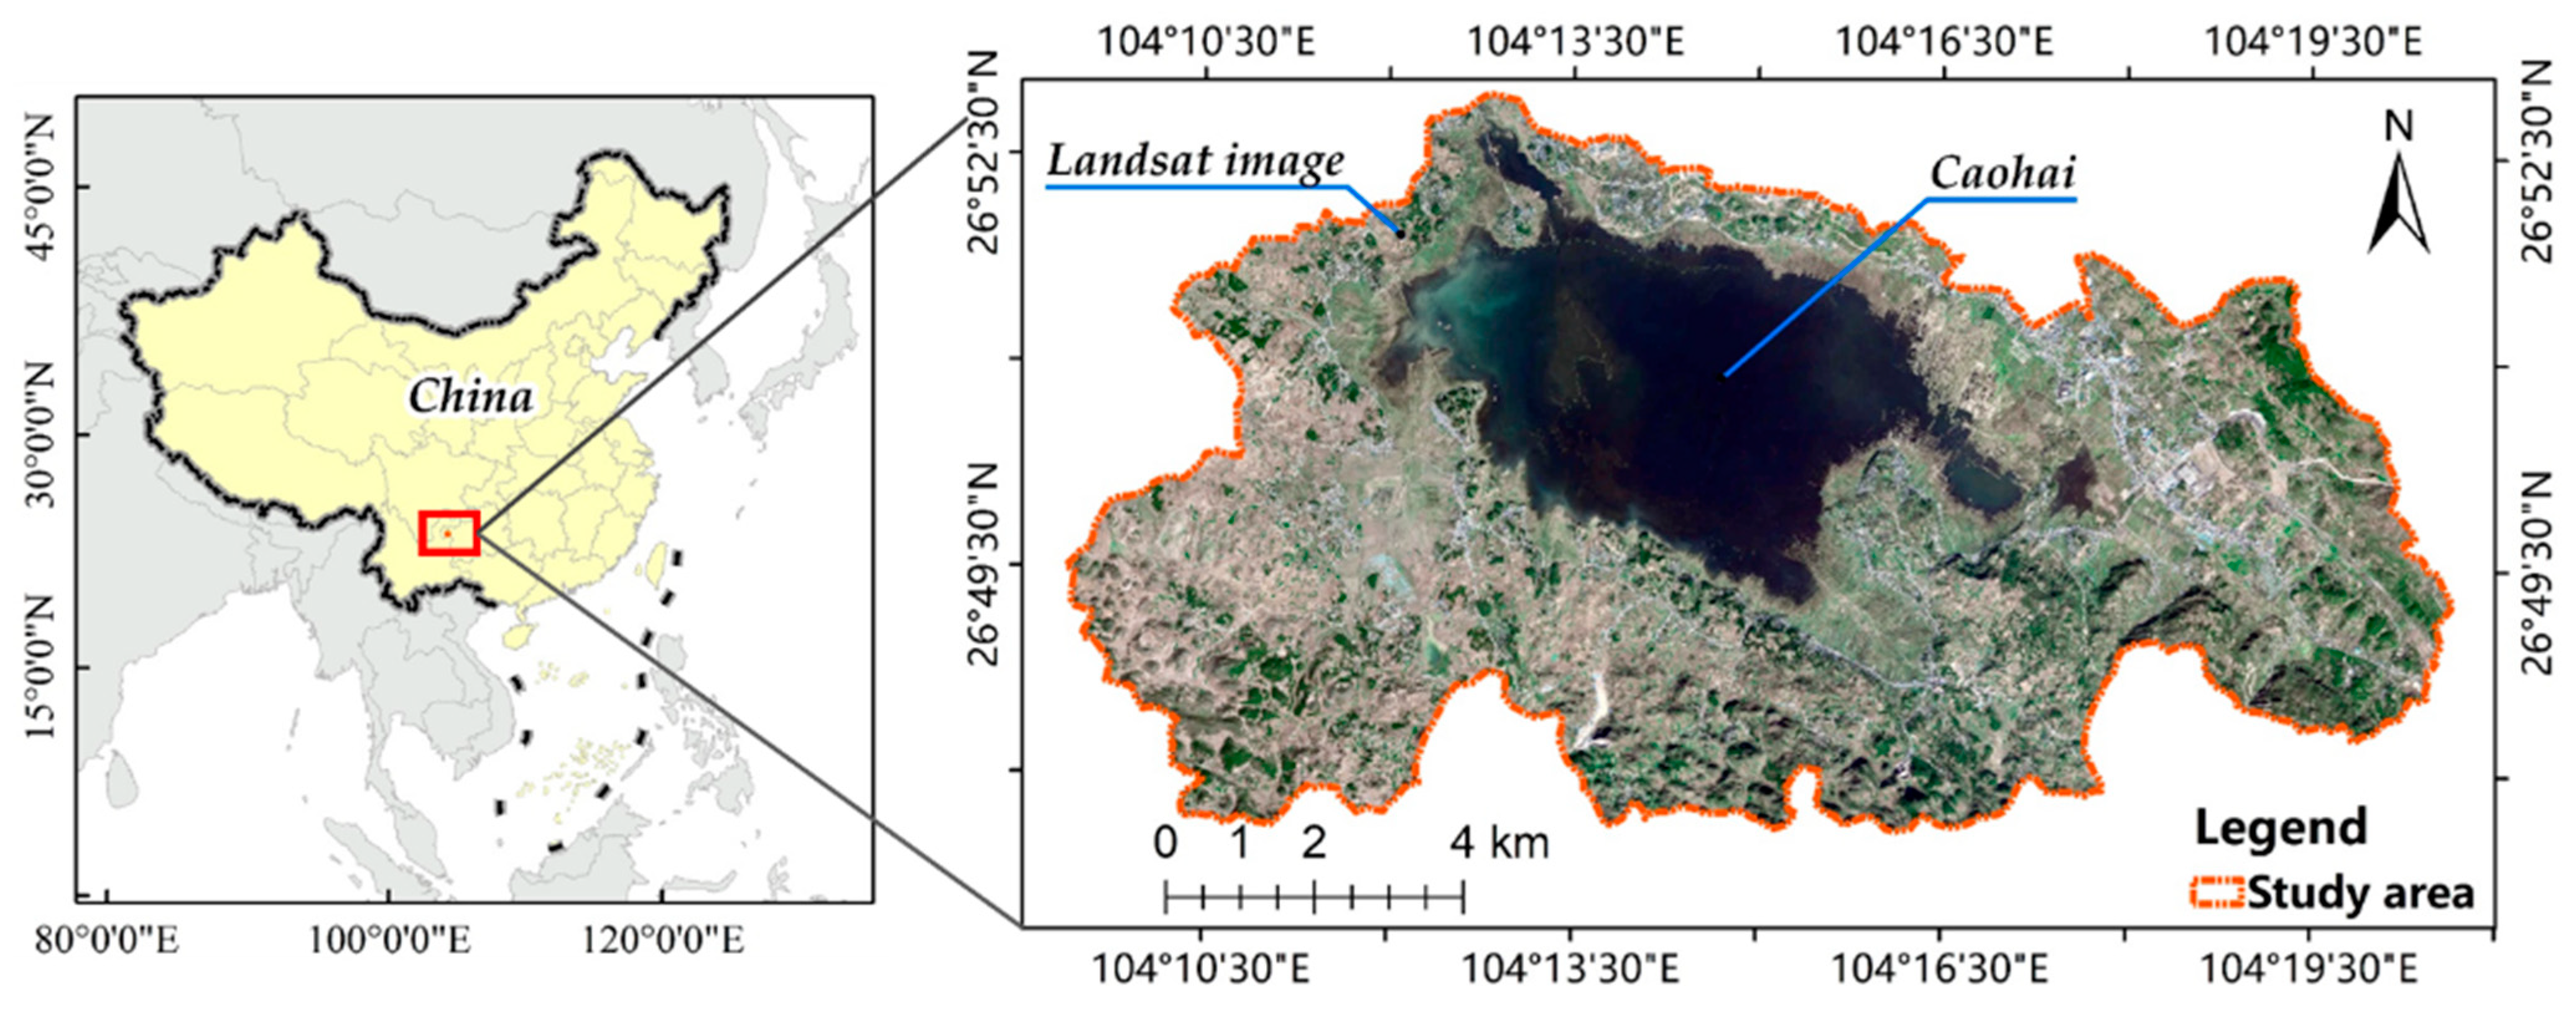
2.1. Overview of the Study Area

The Caohai Lake wetland is located in the hinterland of the Wumeng Mountains on the Yunnan-Guizhou Plateau in southwestern China (Figure 1). The Caohai Lake wetland has a total area of 120 km2, has flat and open terrain, and has a subtropical plateau monsoon climate. As a complete and typical plateau wetland ecosystem, it has abundant animal and plant resources. From November 2016 to October 2017, we conducted the third integrated scientific survey of Caohai Lake and recorded 59 orders, 222 families, and 918 species of animals. Of these, 17 orders, 53 families, and 246 species of birds were recorded, including 132 migratory birds. The number of bird species that were listed as critically endangered (CR), endangered (EN), vulnerable (VU), or near-threatened (NT) in the IUCN were 1, 5, 12, and 28, respectively. In addition, this inventory also included species that are unique to China, such as the Chinese thrush (Turdus mupinensis), Elliot’s laughing thrush (Garrulax elliotii), and the grey-hooded parrotbill (Paradoxornis zappeyi). This wetland habitat is an extremely important ecological niche, is listed as a category-1 important wetland in the Chinese Biodiversity Conservation Action Plan, and is regarded as one of the top 10 bird-watching bases in the world. However, as the lake is close to the county seat, urbanization and socioeconomic development have resulted in urbanization, lake degradation, and human-bird land conflicts, which have severely threatened the safety of the plants and animals that rely on the wetland for survival. The management and department scheme has included decreasing urbanization, controlling the scale of villages and cultivated land, lake reclamation, and afforestation measures in order to promote the integrated management of Caohai Lake and address these problems.

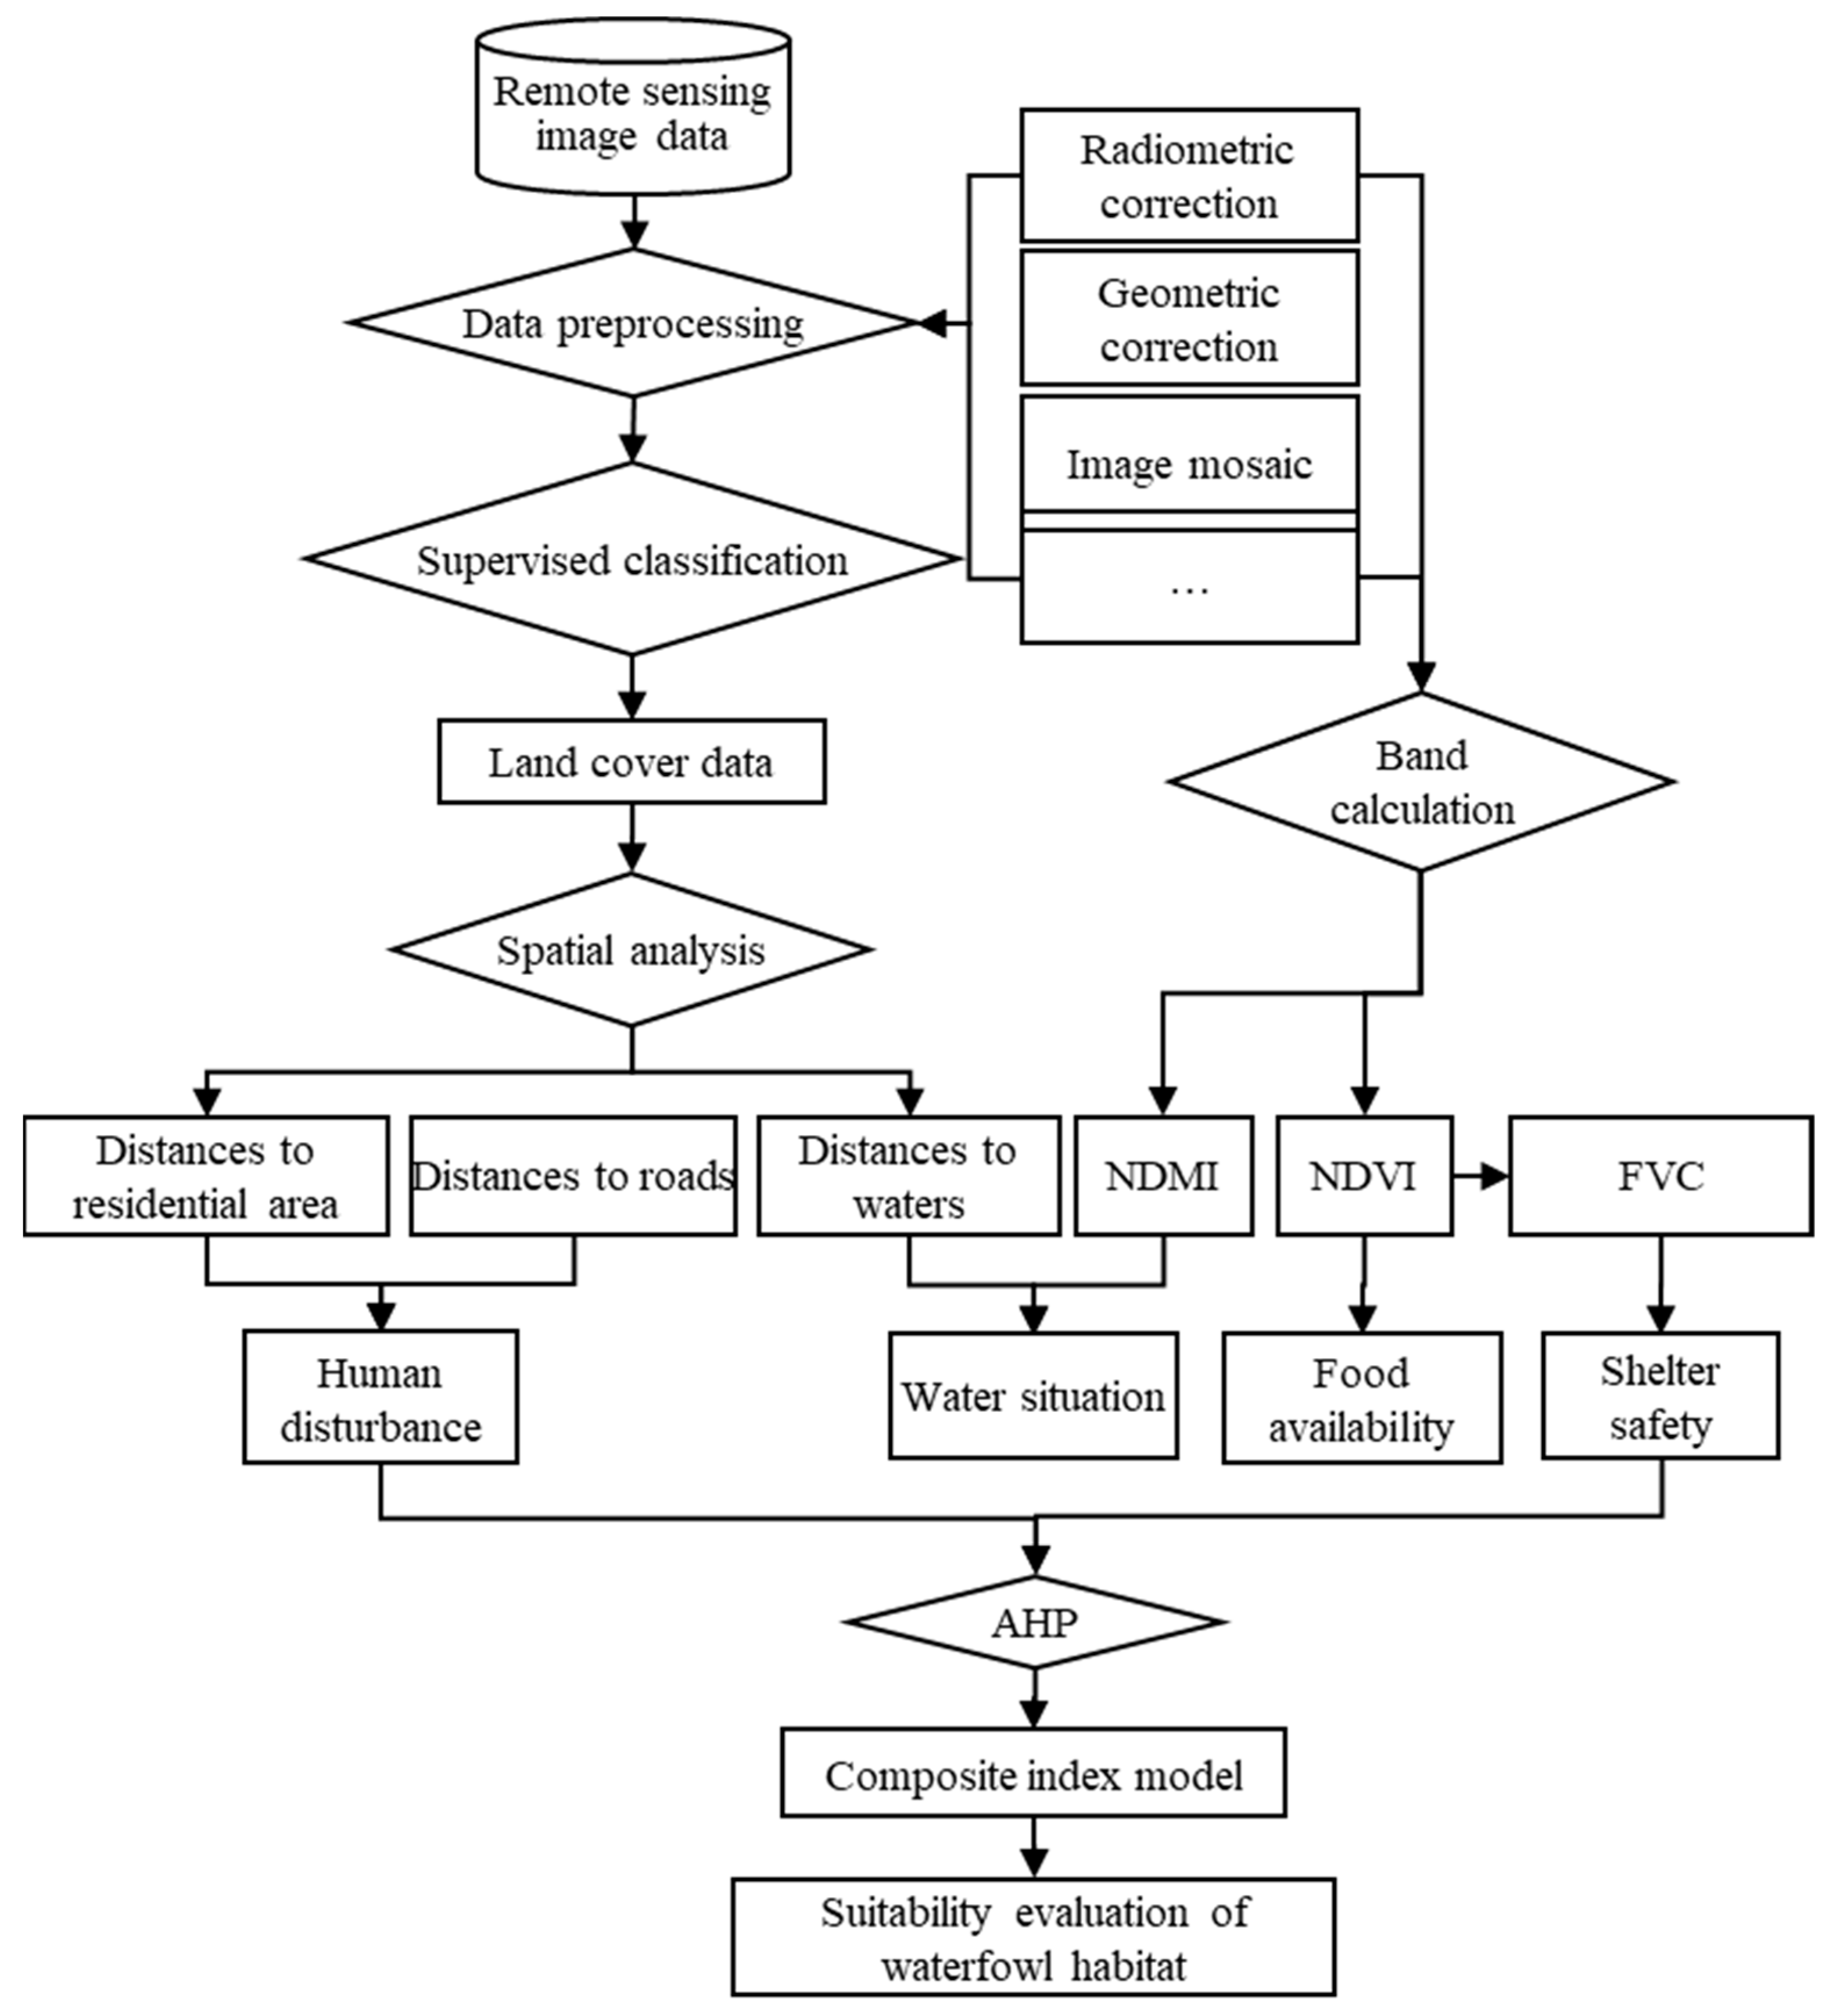
2.2. Data Sources and Processing

The data required for this study included land use, NDVI, and the normalized difference moisture index (NDMI) data for 2000, 2010, and 2022; these data were obtained from the interpretation and waveband calculations of remote sensing images. First, Landsat images of the study site for the three time periods were obtained (Table 1), then radiometric correction, geometric correction, and projection transformation were carried out. After this, supervised classification and visual interpretation were used to classify the land as residential areas, roads, water bodies, forestland, grassland, marshland, cultivated land, and bare land. Finally, the kappa coefficient was calculated to measure the interpretation precision. The NDVI and NDMI were calculated from the waveband data of the preprocessed remote sensing images, as follows:
NDVI = (NIRR)/(NIR + R)
NDMI = (NIRSWIR)/(NIR + SWIR)
where NIR is the near-infrared waveband, R represents the red waveband, and SWIR is the shortwave infrared waveband.

2.3. Habitat Suitability Evaluation Model

In this study, GIS and RS were used to develop a habitat suitability evaluation method that does not require waterfowl spatial information. The evaluation process is illustrated in Figure 2. First, interpretation and waveband calculations were performed on the remote sensing images to obtain the data required for the evaluation. After this, the suitability evaluation marker system was constructed. Finally, suitable mathematical methods were selected to construct an integrated evaluation model, to evaluate the waterfowl habitat’s suitability.
The selection of evaluation markers is important to the accuracy of the evaluation results. Food is a basic requirement for waterfowl survival, and plant seeds, roots, stems, and leaves are their main food sources. Invertebrates that depend on aquatic grasses are also an important food source for waterfowl [43]. The water area and net water density have important effects on the quality and quantity of waterfowl food sources and the selection of nesting sites, so they are important environmental factors that affect the waterfowl’s distribution and abundance. Shelter can protect the waterfowl from invasion by other species and is an indispensable environmental factor. In addition, human activities have important effects on the quantity and quality of waterfowl habitats. In view of these factors, in this study, the actual situation of the study site and the common factors for waterfowl habitat selection, based on related studies, were considered [44,45] and the food availability, water source status, disturbance conditions, and shelter were used as the evaluation markers for assessing the Caohai Lake wetland waterfowl habitat suitability (Table 2). The NDVI was used as the factor for determining food availability, the NDMI was used to characterize the soil moisture content [46], and the water density (including rivers, lakes, and ponds) was used to reflect the water source status. The distances from roads and residential areas were used as an evaluation marker for human disturbances. Since Caohai Lake is relatively flat and the protective effects of the terrain were weak, the surface cover was mainly used as a shelter. There were large differences in the shielding effects of cultivated land and forested land. In addition, NDVI mainly reflects the growth state and spatial distribution of vegetation. The fractional vegetation cover (FVC) is the ratio of the vertical projection area of vegetation on the ground to the total area of the statistical area, which quantifies the dense degree of vegetation and better reflects the shielding effect of vegetation. Therefore, the FVC and differences in land cover were used as the evaluation factors for shelter. The calculation method of FVC is as follows:
F V C = N D V I N D V I s o i l / N D V I v e g N D V I s o i l
where N D V I s o i l is the NDVI value of the bare soil or the area without vegetation cover, and N D V I v e g is the NDVI value of the area that is completely covered by vegetation. FVC with a value of 0 to 1 indicates the level of vegetation cover, whereby a larger value indicates better vegetation cover.
After the marker system was constructed, the most commonly used composite index model was used to comprehensively analyze the factors. This model was divided into the additive model, multiplicative model, and mixed additive-multiplicative model [47]. Assuming that the factors were independent of each other, the additive model was used to conduct an integrated evaluation of the various factors. The suitability evaluation model is as follows:
H S I = i = 1 n W i f i
where HSI is the habitat suitability index, and n is the number of evaluation factors. Wi and fi are the weight and value of evaluation factor i, respectively, which are determined using the analytic hierarchy process (AHP). AHP is a combination of qualitative and quantitative methods that are often used to solve complex and unstructured geospatial decision-making problems. The AHP calculation method is as follows:
A = a 11 a 1 r a r 1 a r r
w i = 1 r j = 1 r a i j k = 1 r a k j             i ,   j ,   k = 1 ,   2 ,   ,   r
C R = λ max r r 1 R I
λ max = 1 r i = 1 r A W i w i
where A is the judgment matrix, a i j represents the importance of factor i compared with factor j, i represents the row number of the judgment matrix, j, and k represents the column number, RI represents the average random consistency index, which can be obtained by looking up the table, and A W i denotes the i-th component of the vector AW. Table 2 shows the weight of each factor based on the expert score and the actual situation in the study area; the weights were calculated using the AHP. The consistency ratio of the criterion layer CR = 0.007, while the CR values of water source status, disturbance factor, and shelter and food availability in the decision layer are 0.003, 0.008, and 0.002, respectively. The factor weights all passed the random consistency ratio CR < 0.10 test. In the shelter evaluation, since land cover is a qualitative factor, the various suitability evaluation markers were classified into five grades (unsuitable, poor suitability, fair suitability, good suitability, and optimum suitability) to enable the quantitative calculations and to ensure uniformity. The five grades were assigned values of 2, 4, 6, 8, and 10, respectively. Studies have been conducted on the ranges of each suitability marker grade [44,45,46]; based on their results, expert opinion, and the actual study area boundaries, suitable ranges were determined (Table 3).
After obtaining the Caohai Lake wetland waterfowl habitat suitability evaluation spatial grade data for the three periods, pixel-by-pixel tracking (Equation (9)) was used to calculate the spatial grade data for the three time periods, to obtain the Caohai Lake wetland waterfowl habitat dynamic change graph for the last 20 years:
F(2000–2022) = (K2000 × 100) + (K2010 × 10) + (K2022 × 1)
where K2000, K2010, and K2022 are the habitat suitability grades in 2000, 2010, and 2022, respectively. The values of the five grades are 2 (unsuitable), 4 (poor suitability), 6 (fair suitability), 8 (good suitability), and 10 (optimum suitability). F(2000–2022) represents the variation trend of the habitat suitability in each pixel of the Caohai Lake wetland, from 2000 to 2022. For example, F(2000–2022) = 248 indicates that the habitat suitability of that pixel exhibited a gradual improvement trend.

2.4. The Response of Habitat Suitability to Human Activities

The Caohai Lake wetland is located close to the county seat, and there are frequent human activities in this area. In order to quantitatively analyze the correlation between habitat suitability and human activities, a scatter plot of the human activity disturbance index versus the suitability score was plotted in this study, and the correlation coefficients were obtained, to examine the effects of human activities on waterfowl habitat selection. In order to satisfy their own development needs, humans will often change the land cover type and utilization intensity, based on their own needs and preferences. The human disturbance index, based on land cover, can reflect the degree of disturbance caused by human activities. The study area was divided into a 100 m × 100 m grid; then, the human disturbance index was calculated using Equation (10):
P = i = 1 m A i × C i A
where P is the human disturbance index, Ai is the area of the ith type of land cover, and A is the area of the grid unit. Ci is the disturbance index of the ith type of land cover, with a value of 0 to 1; a larger value indicates a greater degree of disturbance. Ci values from previous studies [48,49,50] were combined with the Delphi method and the actual study area situation for determination (Table 4).

3. Results

3.1. Variation Characteristics of the Caohai Lake Wetland Land Cover over the Last 20 Years

The land cover in the study area can be used as an important representation of the effects of the habitat factors (food availability, water source status, disturbance conditions, and shelter) on waterfowl habitat selection. After the interpretation of the pre-processed images, 200 samples were randomly selected, and historical Google Earth images were used to validate the 2000 and 2010 land-use classification results. An onsite survey of 200 samples was used to validate the 2022 results. The kappa coefficients of the three periods were 88%, 90%, and 94%, respectively, which satisfied the usage requirements. Figure 3 shows the spatial distribution map of the land-cover types after the interpretation was completed. It can be seen that there are significant spatial differences in the different land cover types in the study area. The dominant land cover type, cultivated land, was widely distributed in the study area. Most of the forestland was scattered as patches of different sizes in the eastern and southern parts of the study area; it gradually expanded in various regions of the study area with time, with the most significant expansion occurring in the north. The water mainly consisted of the lake, which was distributed in the central part of the study area and near the northern boundary, and gradually expanded over time. The built-up land was concentrated in the north, in areas near the county seat, and as scattered patches of different sizes in the other regions. The marshland was mainly distributed along the banks of the lake and gradually expanded around the lake over time. The bare land and grassland exhibited a patchy distribution and a significantly decreasing spatial trend.
Based on the quantity (Figure 4), the land cover types in the study area mainly consisted of cultivated land, followed by water bodies, and the areas of forestland, built-up land, marshland, grassland, and bare land were smaller. A large area of cultivated land and the numerous forestland patches and water bodies provided good shelter and water resources for the waterfowl. The residential areas, roads, and other built-up land were direct representations of human activities and showed that there was severe human disturbance in the study area. Although the marshland and grassland areas were small, they were extremely important in terms of food sources and shelter. Regarding the temporal changes, the forestland, marshland, water bodies, and built-up land areas exhibited overall increasing trends from 2000 to 2022, with increases of 4.81, 3.35, 2.72, and 2.46 km2, respectively. The areas of cultivated land, bare land, and grassland decreased by 9.01, 6.76, and 0.86 km2, respectively. The increases in the areas of forestland, marshland, water bodies, and built-up land were mainly due to conversion from cultivated land, bare land, and grassland (Figure 5). This conversion mainly occurred at the expense of the cultivated land, followed by bare land and grassland.

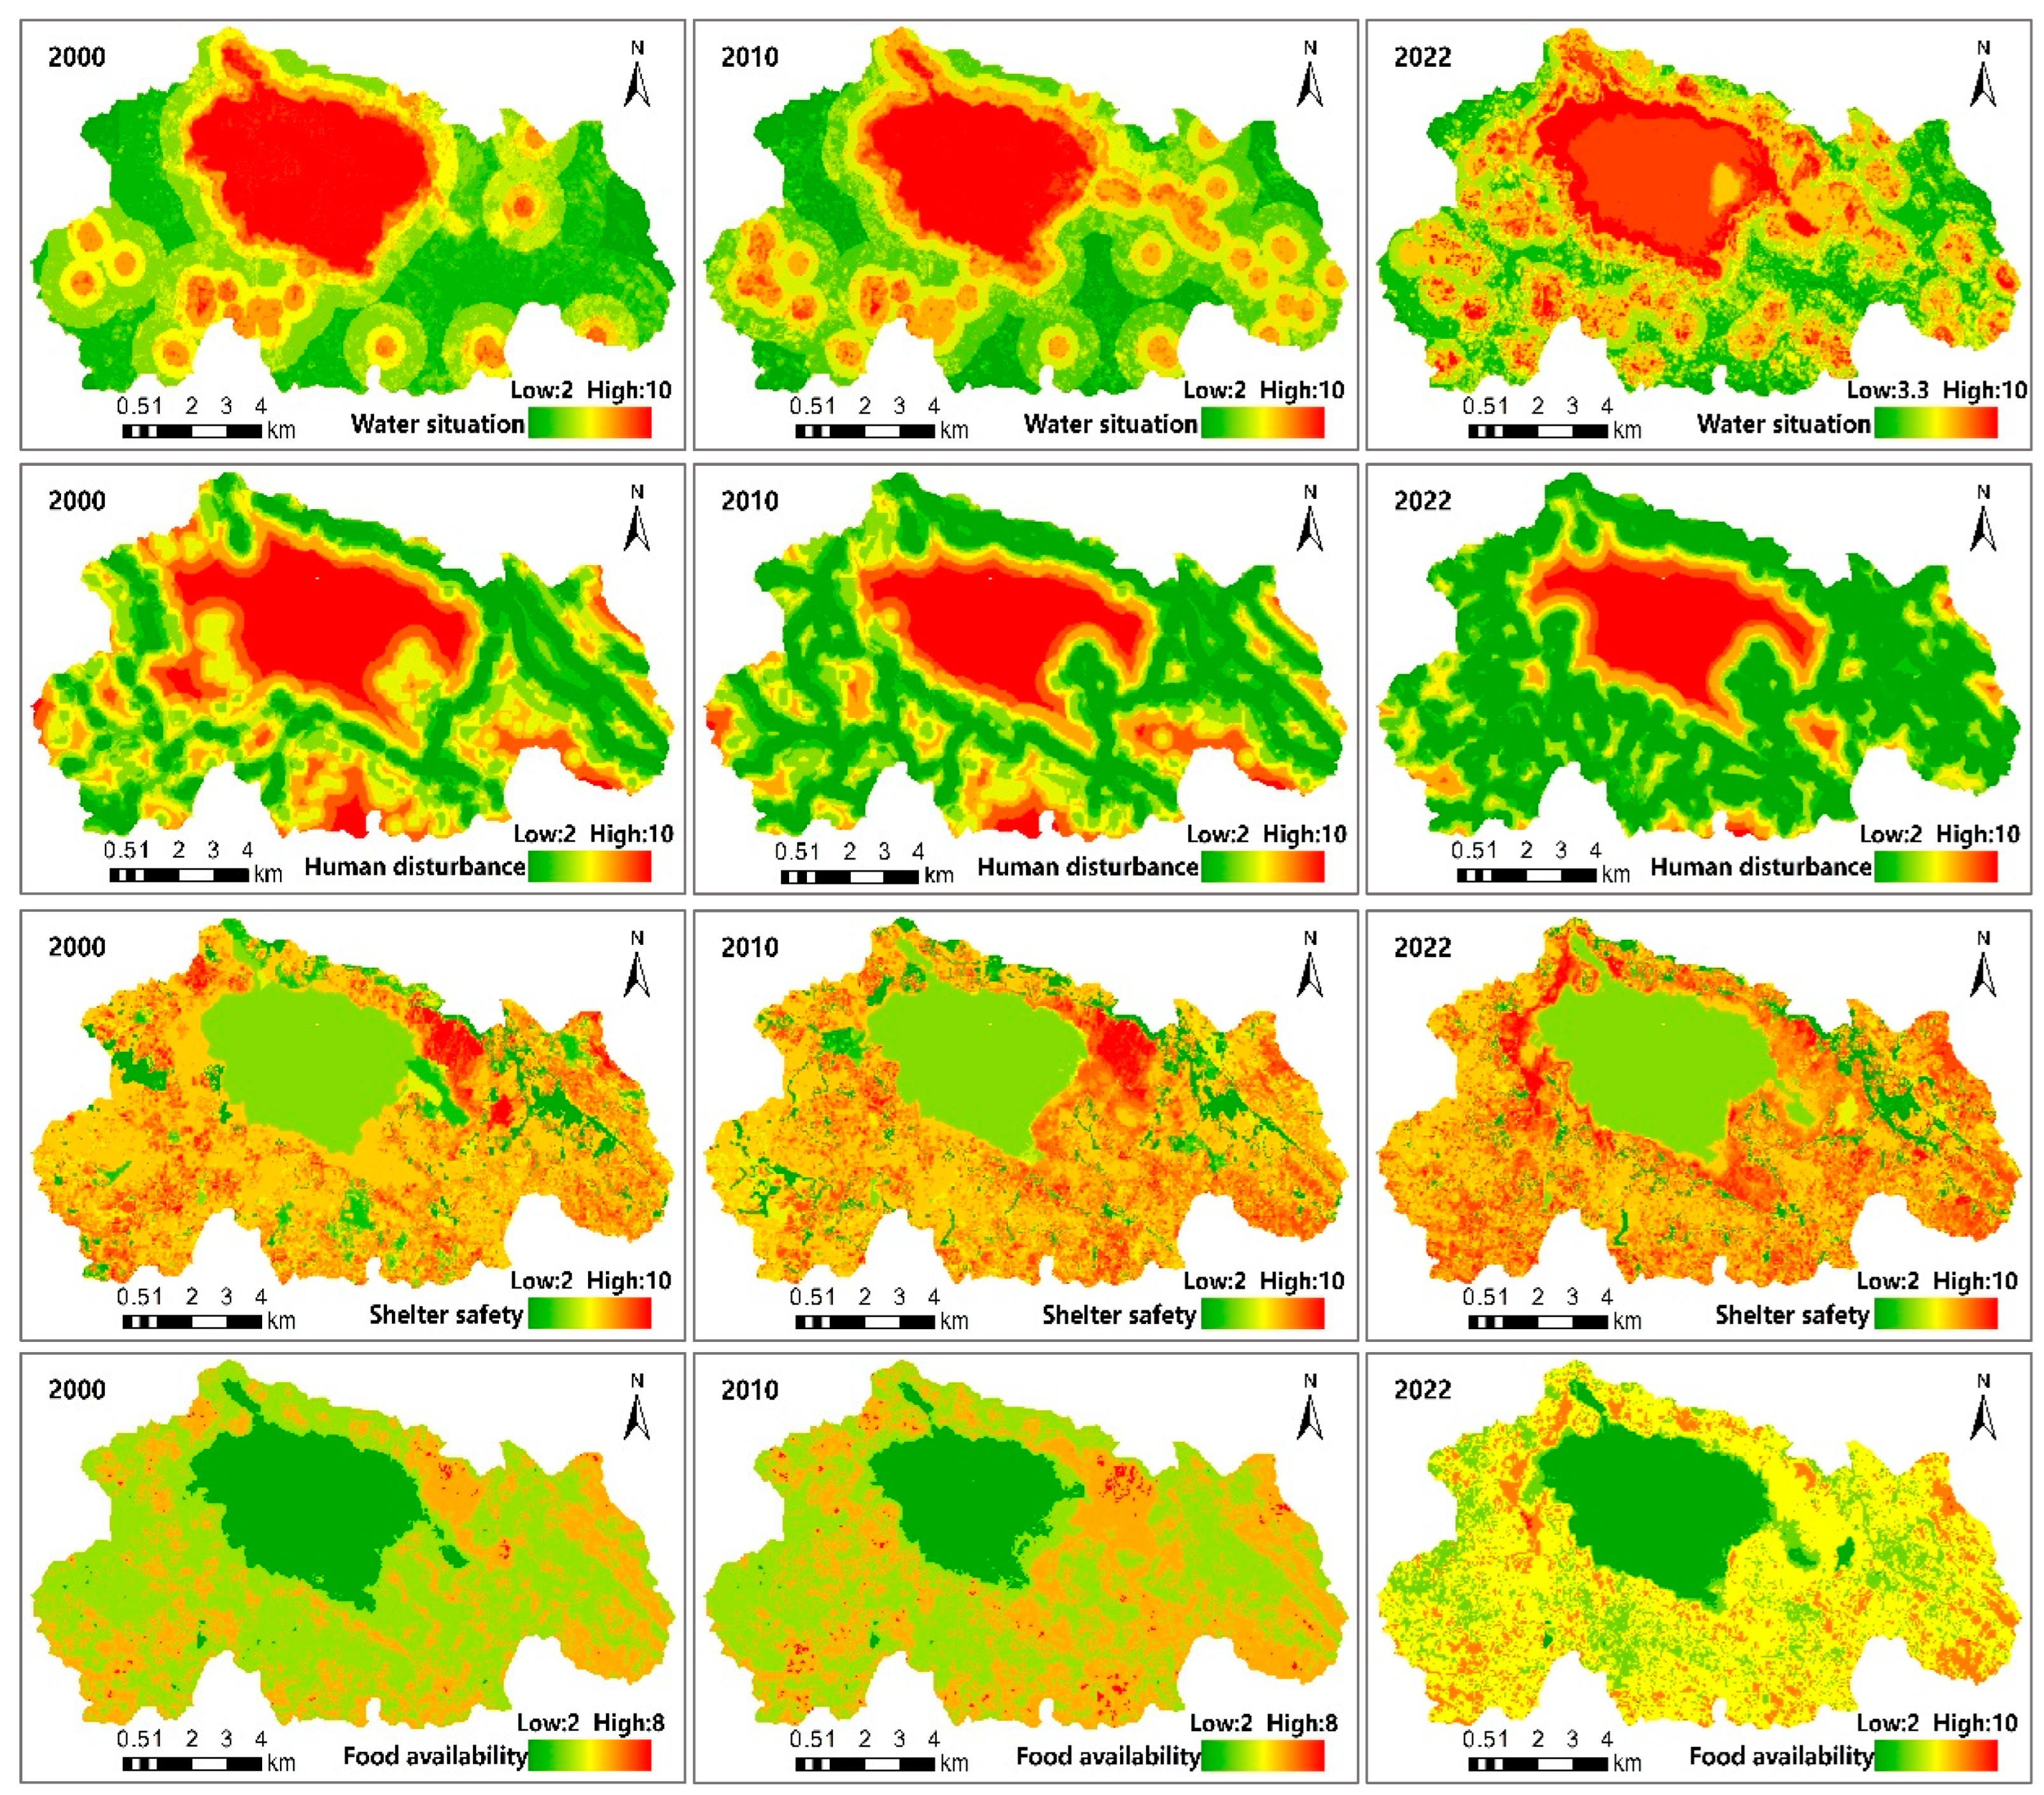
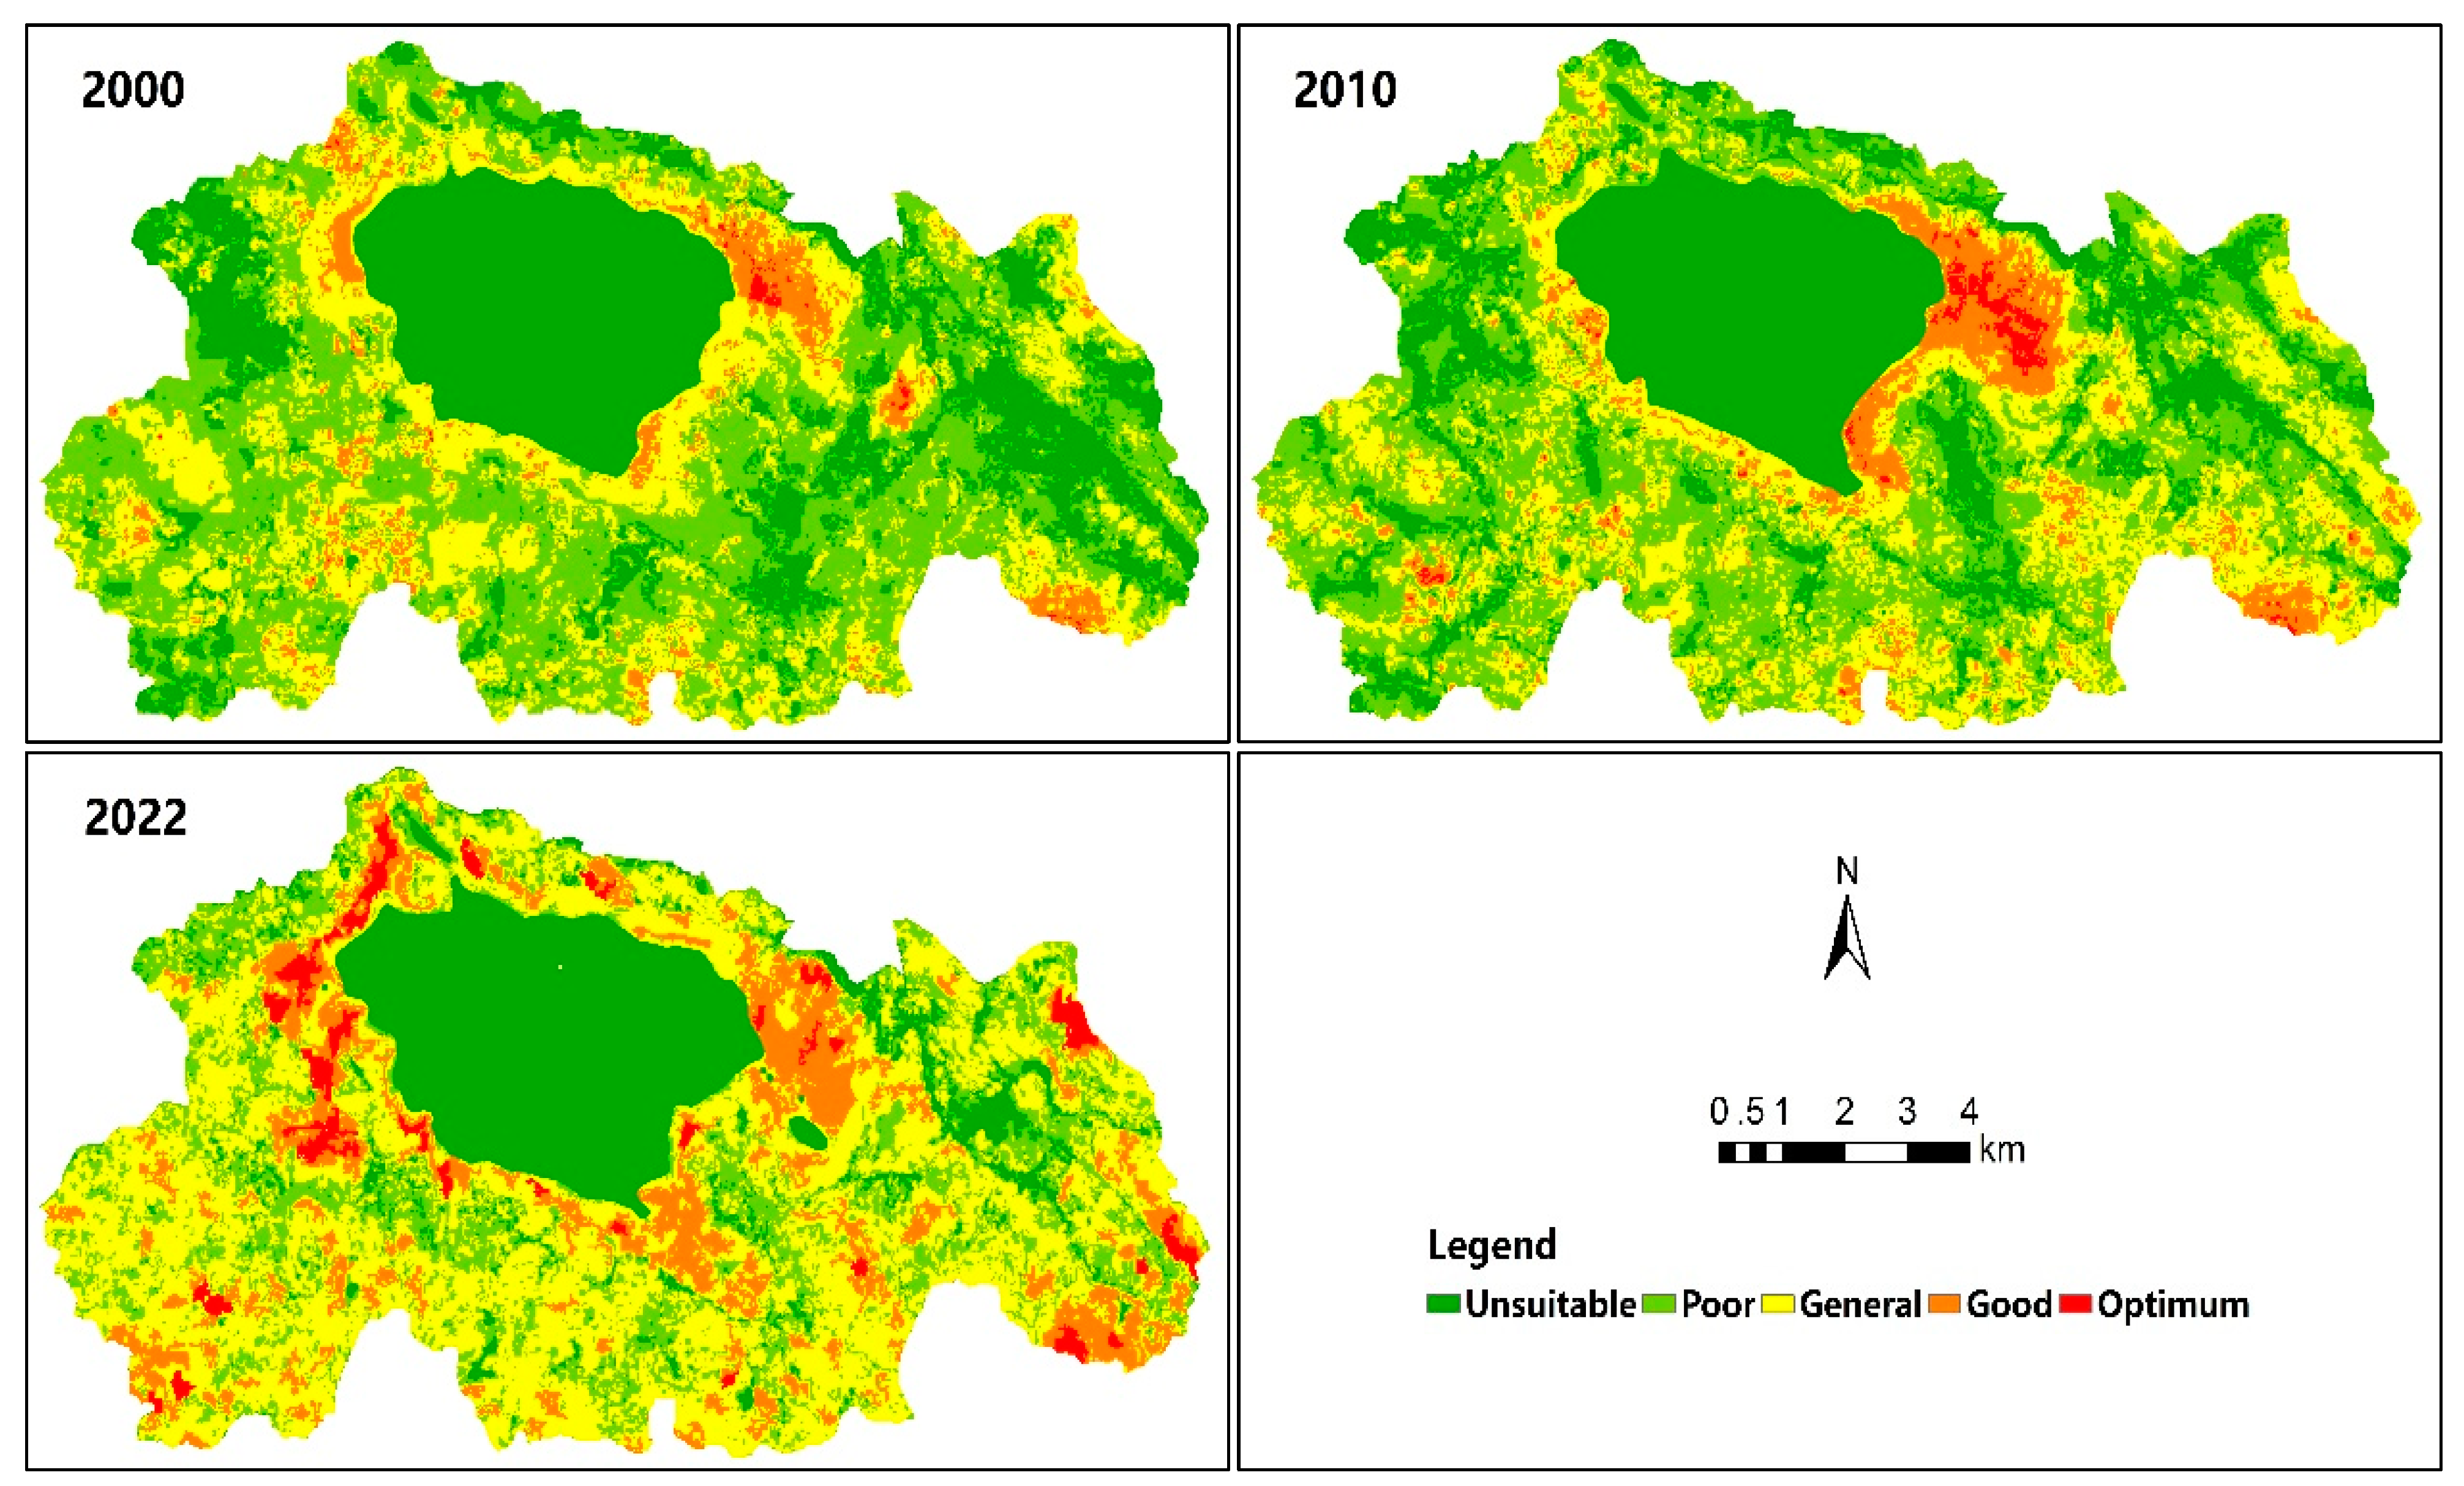
3.2. Habitat Suitability Evaluation

GIS and RS were used to obtain the suitability scores for the critical habitat factors for waterfowl habitat selection in the study area (Figure 6). The greater the value was, the better the suitability was. As can be seen from Figure 6, the suitability scores were the highest for the lake in the northern region and the water resources around the scattered ponds, due to significant water and humidity advantages and the strong water supply, which made them suitable as waterfowl habitats. From 2000 to 2020, the high water-resource suitability score areas in the study area gradually increased, and the waterfowl water resources continuously improved. Increases in roads and residential areas caused increased the disturbance of waterfowl foraging and breeding, thereby decreasing their suitability. In the last 20 years, human disturbances such as roads and residential areas significantly increased in most areas, except for the water bodies, which decreased the suitable waterfowl spaces. Regarding shelter, the spatial suitability score changes were large and exhibited an overall improvement. The areas with optimum shelter conditions gradually expanded, from the northeastern part of the study area and the areas around the lake in 2000, to the banks of the lake in 2022. Over the last 20 years, food availability exhibited significant improvement overall, which was due to increases in the forestland and marshland areas and a decrease in the bare land area. The leasing of cultivated land by the management department for the cultivation of food crops for waterfowl also greatly increased the food availability. Overall, except for the increased human disturbances, the other habitat selection factors all exhibited improvement trends.
Waterfowl suitability data (habitat suitability score (HSI)) for the different years were obtained based on the suitability evaluation model. The HSI scores were classified as optimum suitability (>7.5), good suitability (6.5–7.5), fair suitability (5.5–6.5), poor suitability (4.5–5.5), and unsuitable (<4.5), based on the Jenks method [51], expert opinions [44,46,52], and the actual situation in the study area (Figure 7). Table 5 shows the suitability grade area statistical results for the different years. It can be seen that the area of the suitable regions (fair suitability and above) increased drastically, while the areas of the unsuitable and poor suitability regions significantly decreased from 2000 to 2020. The area of the suitable regions increased from 36.44 to 69.73 km2, of which the regions with fair suitability exhibited the greatest increase of 20.61 km2. This was followed by the regions with good suitability, which increased by 9.62 km2. The regions with optimum suitability experienced the smallest increase of 3.06 km2. The increase in the suitable area was due to the conversion of unsuitable and poor suitability regions, which decreased by 10.88 and 22.41 km2, respectively.
Based on the spatial distribution (Figure 7), the optimum waterfowl habitat suitability regions were mainly located on the banks of the lake. The regions of good suitability were mainly located near the optimum suitability regions. In addition, there were small patches with good suitability scattered throughout the region. The fair suitability regions were widely distributed and almost covered the entire study area. Most of the poor suitability areas were regions near roads and residential areas, and these areas were widely distributed. The unsuitable regions were mainly the deep-water regions of the lakes and the roads and residential areas, which were areas showing a high level of human disturbance. As can be seen from Figure 8, there were frequent spatial changes in the suitability grades in the study area over the last 20 years, and most of the regions changed by at least one suitability grade (Figure 8b). The grade changes did not occur only in the deep-water regions of the lake and in the built-up areas, and the overall trend was an improvement (Figure 8a). The regions with benign suitability changes were mainly distributed in the peripheral areas that were some distance away from the lake; these areas were more concentrated in the eastern, southwestern, and western regions. The areas with malignant changes were mainly located on the east and west banks of the lake and in the southern part of the study area. This was due to the large increase in lake area within the study area over the last 20 years [53], which caused the areas on the banks of the lake with high suitability to become deep-water areas and resulted in a drastic reduction in or disappearance of vegetation in these regions, thereby decreasing their suitability. The malignant changes in the southern part of the lake were mainly due to the increase in residential areas and roads.

3.3. Response of Habitat Suitability to Human Activities

Human activities have important effects on waterfowl habitat quality and quantity. In this study, Equation (10) was mainly used to obtain the human disturbance index of the study area. After this, a random sample of 5% of the pixels across the study area was obtained, then the correlation coefficient of the human disturbance index and the suitability score were calculated, and a scatter plot of these two factors was plotted (Figure 9) to enable quantitative analysis of the response of the waterfowl habitat suitability to human activities. The correlation coefficients for 2000, 2010, and 2022 were −0.43, −0.62, and −0.58, respectively, and they all passed the 0.01 significance test. This shows that there was a significant negative correlation between these two factors, i.e., the greater the level of human disturbance, the lower the suitability score. As can be seen from Figure 9, the human disturbance index and suitability scores exhibited significant linear trends, and the mean goodness of fit for the three time periods was 0.31, demonstrating that the fitting curve can somewhat reflect the relationship between the two, but this relationship was not very significant. In the year 2000, the human disturbance index shows an obvious column when the human disturbance index was nearly 0.60. This is due to the high proportion of cultivated land and bare land evident in 2000 (Figure 4); as a result, the proportion of cultivated land and bare land was high in the random sample of 5% pixels, and the human disturbance index for the pixels of cultivated land and bare land was very close to 0.60, so there are obvious columns near 0.6 on the Figure. From 2000 to 2022, with the gradual decrease in the proportions of cultivated land and bare land, the cluster distribution trend of the human disturbance index near 0.6 gradually disappeared. As shown in Figure 4, we found that the built-up land area of the study area in 2000 was less than that in other years. Therefore, in the random sample of 5% pixels, there was a low probability of their being chosen, so the mean goodness of fit for the suitability score and human disturbance index was smaller.

4. Discussion

4.1. Strengths and Shortcomings of the Suitability Evaluation Methods

In this study, 3S technology and the life habits and habitat needs of waterfowl were employed to construct a habitat suitability evaluation method, based on food availability, water source status, disturbance conditions, and shelter. We evaluated the Caohai Lake wetland waterfowl habitat suitability over the last 20 years and examined the responses of the waterfowl to human activities. This method overcomes the heavy dependence on spatial information about the species for model construction that is seen in previous studies [14,15,16,17,18,19,20,21,22,54,55,56] and the difficulties in obtaining information about the species’ spatial distribution [23,24,27,28]. Furthermore, many previous studies used the net water density to reflect the water resources and ignored the surface water [44,45], which is intimately associated with waterfowl nesting sites and food availability [57]. In this study, we used Landsat waveband calculations to obtain the NDMI, which characterizes the soil moisture content [46]. This was used, together with the distance from water bodies, to comprehensively reflect the water source status in different dimensions and to provide more accurate and comprehensive hydrological information. The suitability evaluation results for 2022 were compared with the results of Wu et al. [58], based on an onsite survey of the Caohai Lake wetland from 2016 to 2018. Wu et al. used spatial point pattern analysis and buffer overlay analysis to identify the spatial distribution of the most suitable foraging sites for crane flocks and their families, and their results are similar to those of this study. The results of our study are also consistent with the results of Ruan et al., who obtained occurrence point data for black-headed cranes in the winter of 2018 and used the maximum entropy (MaxEnt) model for habitat suitability evaluation [59]. This shows that our evaluation results are reliable and can provide a reference for biodiversity conservation in the Caohai Lake wetland. The selection of the evaluation factors affects the accuracy of the evaluation results, and the use of more abundant and comprehensive evaluation markers may allow us to obtain more accurate evaluation results. Furthermore, the waterfowl in this area include many Natatores and Charadriiformes species, and the evaluation factors may not be able to take into account the specific habits of every population. This may result in a larger error in the evaluation results for certain populations. The water depth, water temperature, and specific habits of the different species of waterfowl will be the focus of future studies.

4.2. Waterfowl Habitat Suitability Changes and Influencing Factors

From 2000 to 2020, the area of the suitable regions (fair suitability and above) increased drastically, while the areas of the unsuitable and poor suitability regions significantly decreased. The area of the suitable regions increased by 33.29 km2, of which the increases in the areas of the optimum suitability, good suitability, and fair suitability regions accounted for 9.19%, 28.90%, and 61.91% of the total increase, respectively. Spatially, the optimum suitability and good suitability areas were the marshlands near the eastern and western banks of the lake in 2000, and these areas gradually expanded in all directions. Most of the fair suitability regions were cultivated land. In 2012, before the 18th National Congress of the Chinese Communist Party, the study area mainly focused on socioeconomic development and overlooked ecological environmental conservation. After the 18th National Congress of the Chinese Communist Party, ecology was prioritized, and green development became the new consensus. In recent years, in order to better conserve the ecology of the study area, the relevant departments have divided the study area into a core region, a buffer region, and a test region for graded classification conservation, based on the ecological value. Decreasing the level of urbanization, reducing the spread of villages and cultivated land, and lake reclamation and afforestation measures were employed to promote the comprehensive remediation of Caohai Lake, for which significant results have been obtained. This has resulted in the continuous improvement of the water source status, food availability, and shelter, which greatly affect waterfowl habitat selection. This is also the reason why the suitability grades underwent frequent benign changes during the study period. Although the areas of suitable regions in the study area continuously increased, the ratio was still relatively low. This was particularly true for the optimum and good regions, which only accounted for 2.78% and 13.14% of the total area, respectively. Human disturbances are considered to be an important factor affecting waterfowl foraging sites and habitat selection [60] because they decrease the foraging success rate [61] and breeding success rate [62], thereby changing the waterfowl distribution [63], quantity [64], and community structure [65]. However, the results of this study revealed that although the human disturbances represented by residential areas and roads exhibited an increasing trend, their effects on the waterfowl habitat suitability were limited. The low correlation coefficients between the human disturbance index and the suitability score in 2000, 2010, and 2022, and the mean goodness of fit values also showed that the effects of the human disturbances were limited. Similar conclusions were obtained in previous studies conducted in the study area [58,59]. This may be because there are many residential buildings in the study area, the area of cultivated land is large, and some rural roads were constructed to facilitate cultivation and movement. However, these human activities were mostly concentrated in the test zones at the periphery of the study area and have had limited effects on the core and buffer zones, where the waterfowl are mainly active. Moreover, the cultivated land also represents an important foraging site for some waterfowl [66], and the local management department has leased some land to cultivate the foods preferred by waterfowl to solve the problem of food shortages for winter birds. In addition, strict bird conservation measures were implemented locally. This caused residents to not actively try to harm the birds or to affect their behavior, even when their foraging sites were near roads and residential areas. Although human activities have had some limited impact on the waterfowl habitats, the poor suitability and unsuitable regions were mainly the deep-water regions in the lake, as well as the roads, residential areas, and other areas with strong human disturbances, along with regions in the vicinity of these areas. These land-use types cannot be overlooked when improving waterfowl habitat quality.

4.3. The Implications of Effective Waterfowl Conservation

In this study, it was found that although the area of suitable waterfowl habitat continuously increased in the study area over the last 20 years, the area of the suitable regions (of fair suitability and above) remained relatively small, particularly the optimum suitability and good suitability areas. The continuous increase in human disturbances was also a problem and cannot be overlooked. Hence, measures should be adopted to limit the growth of human activities and to strictly limit the construction of new roads and residential buildings, and the original residential areas should be moved. Cultivated land is the most dominant land-cover type in the study area; the continuous revert cultivated land to wetland to improve the quality and quantity of the suitable regions in the study area. The suitable cultivated land should be leased to cultivate those crops preferred by birds to alleviate the food shortages caused when the soil is frozen during winter, and chemical fertilizer application should be strictly restricted or prohibited. In addition, the study area is close to the county seat and human activities are unavoidable. Therefore, advocacy and education should be strengthened to improve the ecological protection awareness of the public.

5. Conclusions

In this study, the spatiotemporal changes in waterfowl habitat suitability in the Caohai Lake wetland and the responses to human activities were examined. The results revealed that from 2000 to 2020, the area of suitable regions (fair suitability and above) increased continuously, but this accounted for a very small proportion of the total study area. This was also true for the optimum suitability and good suitability areas, which only accounted for 2.78% and 13.14% of the total area, respectively. This was due to the continuous improvement of the water source status, food availability, and shelter. Although human disturbances increased, their effects on waterfowl habitat selection were limited. The correlation coefficients between the human disturbance index and suitability scores in 2000, 2010, and 2022 were −0.43, −0.62, and −0.58, respectively, and the mean goodness of fit was 0.31. Marshlands near the banks of the lake were the preferred waterfowl habitats, and the regions with optimum and good suitability were mainly located around the lake. The fair suitability areas were mainly cultivated land, while the poor suitability and unsuitable regions were the deep-water areas of the lake, the roads, and residential areas with high levels of human disturbance, along with the regions near these areas.

Author Contributions

Data curation, X.L.; methodology and visualization, X.L. and Y.Q.; project administration and supervision, Q.C.; investigation and validation, Z.Z., Q.H., Y.Z., Q.Q. and B.W.; writing—original draft, X.L.; writing—review and editing, Q.C. and Y.Q. All authors have read and agreed to the published version of the manuscript.

Funding

This work was funded by the Science and Technology Project of Bijie City (G [2019] 16), the Project for Youth Science and Technology Talents of Guizhou Provincial Education Department (KY [2020] 147), the Bijie Talent Team of Biological Protection and Ecological Restoration in Liuchong River Basin, the Guizhou Province Key Laboratory of Ecological Protection and Remediation of Typical Plateau Wetlands ([2020] 2002), The Regional First-class Discipline of Ecology in Guizhou Province (XKTJ [2020] 22), The Major Research Project of Innovative Groups of Department of education of Guizhou Province (KY [2017] 050).

Institutional Review Board Statement

Not applicable.

Informed Consent Statement

Not applicable.

Data Availability Statement

Not applicable.

Conflicts of Interest

The authors declare no conflict of interest.

References

  1. Mistry, J.; Berardi, A.; Simpson, M. Birds as indicators of wetland status and change in the North Rupununi, Guyana. Biodivers. Conserv. 2008, 17, 2383–2409. [Google Scholar] [CrossRef] [Green Version]
  2. MacPherson, M.P.; Webb, E.B.; Raedeke, A.; Mengel, D.; Nelson, F. A review of Bayesian belief network models as decision-support tools for wetland conservation: Are water birds potential umbrella taxa. Biol. Conserv. 2018, 226, 215–223. [Google Scholar] [CrossRef] [Green Version]
  3. Dixon, M.J.R.; Loh, J.; Davidson, N.C.; Beltrame, C.; Freeman, R.; Walpole, M. Tracking global change in ecosystem area: The Wetland Extent Trends index. Biol. Conserv. 2016, 193, 27–35. [Google Scholar] [CrossRef]
  4. Cumming, G.S.; Paxton, M.; King, J.; Beuster, H. Foraging guild membership explains variation in waterbird responses to the hydrological regime of an arid-region flood-pulse river in Namibia. Freshw. Biol. 2012, 57, 1202–1213. [Google Scholar] [CrossRef]
  5. Reid, J.R.W.; Colloff, M.J.; Arthur, A.D.; McGinness, H.M. Influence of Catchment Condition and water resource development on waterbird assemblages in the Murray-Darling Basin, Australia. Biol. Conserv. 2013, 165, 25–34. [Google Scholar] [CrossRef]
  6. Fardila, D.; Kelly, L.T.; Moore, J.L.; McCarthy, M.A. A systematic review reveals changes in where and how we have studied habitat loss and fragmentation over 20 years. Biol. Conserv. 2017, 212, 130–138. [Google Scholar] [CrossRef]
  7. Hu, S.; Niu, Z.; Chen, Y.; Li, L.; Zhang, H. Global wetlands: Potential distribution, wetland loss, and status. Sci. Total Environ. 2017, 586, 319–327. [Google Scholar] [CrossRef]
  8. Program, M. Ecosystems and Human Well-Being: Wetlands and Water Synthesis: A Report of the Millennium Ecosystem Assessment; World Resources Institute: Washington, DC, USA, 2005. [Google Scholar]
  9. Davis, C.L.; Miller, D.A.W.; Campbell Grant, E.H.; Halstead, B.J.; Kleeman, P.M.; Walls, S.C.; Barichivich, W.J. Linking variability in climate to wetland habitat suitability: Is it possible to forecast regional responses from simple climate measures. Wetl. Ecol. Manag. 2019, 27, 39–53. [Google Scholar] [CrossRef]
  10. Fu, B.; Pollino, C.A.; Cuddy, S.M.; Andrews, F. Assessing climate change impacts on wetlands in a flow regulated catchment: A case study in the Macquarie Marshes, Australia. J. Environ. Manag. 2015, 157, 127–138. [Google Scholar] [CrossRef]
  11. Naugle, D.E.; Johnson, R.R.; Estey, M.E.; Higgins, K.F. A landscape approach to conserving wetland bird habitat in the Prairie Pothole Region of eastern South Dakota. Wetlands 2000, 20, 588–604. [Google Scholar] [CrossRef]
  12. Heintzman, L.J.; McIntyre, N.E. Quantifying the effects of projected urban growth on connectivity among wetlands in the Great Plains (USA). Landsc. Urban Plan. 2019, 186, 1–12. [Google Scholar] [CrossRef]
  13. Mondal, B.; Dolui, G.; Pramanik, M.; Maity, S.; Biswas, S.S.; Pal, R. Urban expansion and wetland shrinkage estimation using a GIS-based model in the East Kolkata Wetland, India. Ecol. Indic. 2017, 83, 62–73. [Google Scholar] [CrossRef]
  14. Brotons, L.; Thuiller, W.; Araújo, M.B.; Hirzel, A.H. Presence-absence versus presence-only modelling methods for predicting bird habitat suitability. Ecography 2004, 27, 437–448. [Google Scholar] [CrossRef] [Green Version]
  15. Strubbe, D.; Broennimann, O.; Chiron, F.; Matthysen, E. Niche conservatism in non-native birds in Europe: Niche unfilling rather than niche expansion. Glob. Ecol. Biogeogr. 2013, 22, 962–970. [Google Scholar] [CrossRef]
  16. Reza, M.I.H.; Abdullah, S.A.; Nor, S.B.M.; Ismail, M.H. Integrating GIS and expert judgment in a multi-criteria analysis to map and develop a habitat suitability index: A case study of large mammals on the Malayan Peninsula. Ecol. Indic. 2013, 34, 149–158. [Google Scholar] [CrossRef] [Green Version]
  17. Cardador, L.; De Cáceres, M.; Bota, G.; Giralt, D.; Casas, F.; Arroyo, B.; Brotons, L. A Resource-Based Modelling Framework to Assess Habitat Suitability for Steppe Birds in Semiarid Mediterranean Agricultural Systems. PLoS ONE 2014, 9, e92790. [Google Scholar] [CrossRef] [Green Version]
  18. Kuang, R.Y.; Zhou, Y.X.; Xing, L.I.; Tian, B. Spatial fuzzy comprehensive assessmentof bird habitat suitability in Chongming Dongtan. Resour. Environ. Yangtze Basin 2009, 18, 229–233. [Google Scholar] [CrossRef]
  19. Royan, A.; Hannah, D.M.; Reynolds, S.J.; Noble, D.G.; Sadler, J.P. River birds’ response to hydrological extremes: New vulnerability index and conservation implications. Biol. Conserv. 2014, 177, 64–73. [Google Scholar] [CrossRef] [Green Version]
  20. Liao, C.; Mao, Q.; Shi, H.; Bai, H.; Li, J. Study on Habitat suitability evaluation for wetland Birds in Dianchi Lake Wetland. J. Southwest For. Univ. 2021, 41, 78–84. [Google Scholar] [CrossRef]
  21. Rahmani, R.; Neji, M.; Belgacem, A.O.; Debouba, M. Potential distribution and the habitat suitability of the African mustard (Brassica tournefortii) in Tunisia in the context of climate change. Arab. J. Geosci. 2020, 13, 512. [Google Scholar] [CrossRef]
  22. Kumar, S.; Stohlgren, T.J. Maxent Modeling for Predicting Suitable Habitat for Threatened and Endangered Tree Canacomyrica monticola in New Caledonia. J. Ecol. Nat. Environ. 2018, 154, 94–98. [Google Scholar]
  23. Wen, D.; Su, L.; Hu, Y.; Xiong, Z.; Liu, M.; Long, Y. Surveys of Large Waterfowl and Their Habitats Using an Unmanned Aerial Vehicle: A Case Study on the Siberian Crane. Drones 2021, 5, 102. [Google Scholar] [CrossRef]
  24. Bakó, G.; Tolnai, M.; Takács, Á. Introduction and Testing of a Monitoring and Colony-Mapping Method for Waterbird Populations That Uses High-Speed and Ultra-Detailed Aerial Remote Sensing. Sensors 2014, 14, 12828–12846. [Google Scholar] [CrossRef] [PubMed]
  25. Weissensteiner, M.H.; Poelstra, J.W.; Wolf, J.B.W. Low-budget ready-to-fly unmanned aerial vehicles: An effective tool for evaluating the nesting status of canopy-breeding bird species. J. Avian Biol. 2015, 46, 425–430. [Google Scholar] [CrossRef]
  26. Sun, Y. Population Ecological Characteristics and Habitat Assessment of Asian Elephant (Elephas maximus) in Nangunhe National Nature Reserve, China. Master’s Thesis, Beijing Forestry University, Beijing, China, 2021. [Google Scholar] [CrossRef]
  27. Kerr, J.T.; Ostrovsky, M. From space to species: Ecological applications for remote sensing. Trends Ecol. Evol. 2003, 18, 299–305. [Google Scholar] [CrossRef]
  28. Zlinszky, A.; Heilmeier, H.; Balzter, H.; Czúcz, B.; Pfeifer, N. Remote Sensing and GIS for Habitat Quality Monitoring: New Approaches and Future Research. Remote Sens. 2015, 7, 7987–7994. [Google Scholar] [CrossRef] [Green Version]
  29. Cardoni, D.A.; Favero, M.; Isacch, J.P. Recreational activities affecting the habitat use by birds in Pampa’s wetlands, Argentina: Implications for waterbird conservation. Biol. Conserv. 2008, 141, 797–806. [Google Scholar] [CrossRef]
  30. Xia, S.; Liu, Y.; Chen, B.; Jia, Y.; Zhang, H.; Liu, G.; Yu, X. Effect of water level fluctuations on wintering goose abundance in Poyang Lake wetlands of China. Chin. Geogr. Sci. 2016, 27, 248–258. [Google Scholar] [CrossRef] [Green Version]
  31. Dronova, I.; Beissinger, S.; Burnham, J.; Gong, P. Landscape-Level Associations of Wintering Waterbird Diversity and Abundance from Remotely Sensed Wetland Characteristics of Poyang Lake. Remote Sens. 2016, 8, 462. [Google Scholar] [CrossRef] [Green Version]
  32. Cardador, L.; Cáceres, M.D.; Giralt, D.; Bota, G.; Aquilué, N.; Arroyo, B.; Brotons, L. Tools for exploring habitat suitability for steppe birds under land use change scenarios. Agric. Ecosyst. Environ. 2015, 200, 119–125. [Google Scholar] [CrossRef]
  33. Tian, Y.; Luo, L.; Mao, D.; Wang, Z.; Li, L.; Liang, J. Using Landsat images to quantify different human threats to the Shuangtai Estuary Ramsar site, China. Ocean. Coast. Manag. 2017, 135, 56–64. [Google Scholar] [CrossRef]
  34. Liang, J.; Hua, S.; Zeng, G.; Yuan, Y.; Lai, X.; Li, X.; Yu, X. Application of weight method based on canonical correspondence analysis for assessment of Anatidae habitat suitability: A case study in East Dongting Lake, Middle China. Ecol. Eng. 2015, 77, 119–126. [Google Scholar] [CrossRef]
  35. Dong, Z.; Wang, Z.; Liu, D.; Li, L.; Ren, C.; Tang, X.; Liu, C. Assessment of habitat suitability for waterbirds in the West Songnen Plain, China, using remote sensing and GIS. Ecol. Eng. 2013, 55, 94–100. [Google Scholar] [CrossRef]
  36. Jitariu, V.; Dorosencu, A.; Ichim, P.; Ion, C. Severe Drought Monitoring by Remote Sensing Methods and Its Impact on Wetlands Birds Assemblages in Nuntași and Tuzla Lakes (Danube Delta Biosphere Reserve). Land 2022, 11, 672. [Google Scholar] [CrossRef]
  37. Harrison, P.A.; Berry, P.M.; Henriques, C.; Holman, I.P. Impacts of socio-economic and climate change scenarios on wetlands: Linking water resource and biodiversity meta-models. Clim. Chang. 2008, 90, 113–139. [Google Scholar] [CrossRef]
  38. Regmi, G.R.; Huettmann, F. (Eds.) Hindu Kush-Himalaya Watersheds Downhill: Landscape Ecology and Conservation Perspectives; Springer Nature Switzerland AG: Cham, Switzerland, 2020. [Google Scholar] [CrossRef]
  39. Hirzel, A.H.; Helfer, V.; Metral, F. Assessing habitat-suitability models with a virtual species. Ecol. Model. 2001, 145, 111–121. [Google Scholar] [CrossRef] [Green Version]
  40. Bradley, B.A.; Olsson, A.D.; Wang, O.; Dickson, B.G.; Pelech, L.; Sesnie, S.E.; Zachmann, L.J. Species detection vs. habitat suitability: Are we biasing habitat suitability models with remotely sensed data? Ecol. Model. 2012, 244, 57–64. [Google Scholar] [CrossRef]
  41. Chen, Y.; Chen, Q.; Feng, T. Comprehensive Scientific Investigation Report on Caohai Nature Reserve in Guizhou; China Forestry Publishing House: Beijing, China, 2021. [Google Scholar]
  42. The Total Investment of 27 Projects in Seven Categories of Caohai Comprehensive Treatment Project in Weining Autonomous County Was 6.674 Billion Yuan. Available online: https://www.guizhou.gov.cn/home/sxdt/202109/t20210913_70277690.html (accessed on 2 August 2022).
  43. Qiu, X.; Yin, X.; Liu, H.; Qin, J.; Wang, Y. Optimized scheme for planting aquatic plants to protect waterfowl habitat in Hongze Lake Wetland. J. Hydroecol. 2020, 41, 107–114. [Google Scholar] [CrossRef]
  44. Dong, Z.; Liu, D.; Wang, Z.; Ren, C. Assessment of the habitat suitability for waterfowls in the Panjin, Liaoning with GIS and remote sensing. Acta Ecol. Sin. 2014, 34, 1503–1511. [Google Scholar] [CrossRef]
  45. Du, B.; Wu, Y.; Liu, Y.; Ru, W.; Li, Y.; Gao, R.; Hong, J. Assessment of habitat suitability for whooper swan in Sanmenxia swan lake national urban wetland park. J. Cap. Norm. Univ. 2020, 41, 45–51. [Google Scholar] [CrossRef]
  46. Tian, Y.; Wang, Z.; Mao, D.; Li, L.; Liu, M.; Jia, M.; Lu, C. Remote Observation in habitat suitability changes for waterbirds in the West Songnen Plain, China. Sustainability 2019, 11, 1552. [Google Scholar] [CrossRef] [Green Version]
  47. Wang, C. Comparison and selection of comprehensive evaluation index models. Stat. Educ. 2008, 4, 17–18. [Google Scholar]
  48. Tian, P.; Li, J.; Jiang, Y.; Shi, X. Ecological vulnerability of the bay landscape and its response to human activities: A case study of the East China Sea. Acta Ecol. Sin. 2019, 39, 1463–1474. [Google Scholar] [CrossRef]
  49. Chen, P.; Fu, S.; Wen, C. Assessment of impact on coastal wetland of Xiamen Bay and response of landscape pattern from human disturbance from 1989 to 2010. J. Appl. Oceanogr. 2014, 33, 167–174. [Google Scholar] [CrossRef]
  50. Xiao, C.; Xie, X.; Wu, T.; Jiang, G. Dynamic changes of landscape pattern and hemeroby in Ximen Island wetland, Zhejiang Province, China. Chin. J. Appl. Ecol. 2014, 25, 3255–3262. [Google Scholar] [CrossRef]
  51. Qi, Z.; Liao, J.; Xu, W.; Ni, Y. Suitability analysis of mountain settlements in Qinling using a GIS system. Acta Ecol. Sin. 2015, 35, 1274–1283. Available online: http://dx.chinadoi.cn/10.5846/stxb201305020899 (accessed on 16 July 2022).
  52. Fan, X.; Gu, X.; Yu, H.; Long, A.; Tiando, D.S.; Ou, S.; Li, J.; Rong, Y.; Tang, G.; Zheng, Y.; et al. The Spatial and Temporal Evolution and Drivers of Habitat Quality in the Hung River Valley. Land 2021, 10, 1369. [Google Scholar] [CrossRef]
  53. Song, S.; Li, H.; Huang, L.; Shi, Y.; Li, X. Remote sensing monitoring of water area changes of Caohai National Nature Reserve in Weining, Guizhou in the past 35 years. Guizhou Sci. 2021, 39, 76–82. [Google Scholar]
  54. Osborne, P.E.; Alonso, J.C.; Bryant, R.G. Modelling landscape-scale habitat use using GIS and remote sensing: A case study with great bustards. J. Appl. Ecol. 2001, 38, 458–471. [Google Scholar] [CrossRef] [Green Version]
  55. Yang, R.; Zhang, Y.; Feng, J. Habitat suitability analysis in live releasing of two butterflies Papilio polytes Linnaeus and Stichophthalma howqua (Westwood) in China using ENFA. Acta Entomol. Sin. 2008, 3, 290–297. [Google Scholar] [CrossRef]
  56. Li, X.; Cheng, R.; Xiao, W.; Sun, G.; Ma, T.; Liu, F.; Pan, K. Assessment of the Suitability of Wintering Anatidae Habitats before and after Impoundment in the Three Gorges Reservoir Region. Sustainability 2021, 13, 4743. [Google Scholar] [CrossRef]
  57. Zhang, Y.; Wang, Z.; Ren, C.; Yu, H.; Dong, Z.; Lu, C.; Mao, D. Changes in habitat suitability for waterbirds of the Momoge Nature Reserve of China during 1990–2014. J. Environ. Eng. Landsc. Manag. 2017, 25, 367–378. [Google Scholar] [CrossRef]
  58. Wu, D.; Hu, C.; Zhang, M.; Li, H. Spatial relevancy between foraging sites of overwintering Black-necked Cranes and farming lands in Caohai Wetland, Guizhou, China. Acta Ecol. Sin. 2021, 41, 3238–3247. [Google Scholar] [CrossRef]
  59. Ruan, O.; Liu, S.; Chen, F.; Luo, J.; Hu, H. Habitat suitability evaluation of black-necked cranes based on multi-source remote sensing in Caohai National Nature Reserve, Gguizhou. Acta Ecol. Sin. 2022, 42, 1947–1957. [Google Scholar] [CrossRef]
  60. Sica, Y.V.; Quintana, R.D.; Radeloff, V.C.; Gavier-Pizarro, G.I. Wetland loss due to land use change in the Lower Paraná River Delta, Argentina. Sci. Total Environ. 2016, 568, 967–978. [Google Scholar] [CrossRef]
  61. Rees, E.C.; Bruce, J.H.; White, G.T. Factors affecting the behavioural responses of whooper swans (Cygnus c. cygnus) to various human activities. Biol. Conserv. 2005, 121, 369–382. [Google Scholar] [CrossRef]
  62. Beale, C.M.; Monaghan, P. Behavioural responses to human disturbance: A matter of choice. Anim. Behav. 2004, 68, 1065–1069. [Google Scholar] [CrossRef]
  63. Thiollay, J.-M. Raptor Communities in French Guiana: Distribution, Habitat Selection, and Conservation. J. Raptor Res. 2007, 41, 90–105. [Google Scholar] [CrossRef] [Green Version]
  64. Bolduc, F.; Afton, A.D. Relationships between Wintering Waterbirds and Invertebrates, Sediments and Hydrology of Coastal Marsh Ponds. Waterbirds 2004, 27, 333–341. Available online: http://www.jstor.org/stable/1522511 (accessed on 22 August 2022). [CrossRef]
  65. Palomino, D.; Carrascal, L.M. Habitat associations of a raptor community in a mosaic landscape of Central Spain under urban development. Landsc. Urban Plan. 2007, 83, 268–274. [Google Scholar] [CrossRef]
  66. Kim, H.; Lee, E.; Park, C.; Lee, K.; Lee, D.; Lee, W.; Kim, J.-U. Modeling the Habitat of the Red-Crowned Crane (Grus japonensis) Wintering in Cheorwon-Gun to Support Decision Making. Sustainability 2016, 8, 576. [Google Scholar] [CrossRef]
Figure 1. Overview of the study area.
Sustainability 14 14409 g001
Figure 2. Evaluation procedure.
Sustainability 14 14409 g002
Figure 3. Spatial distribution of the Caohai Lake wetland cover from 2000 to 2022.
Sustainability 14 14409 g003
Figure 4. Histogram of the different land-cover areas of the Caohai Lake wetland from 2000 to 2022.
Sustainability 14 14409 g004
Figure 5. Conversion map showing the different land-cover areas in the Caohai Lake wetland from 2000 to 2022.
Sustainability 14 14409 g005
Figure 6. Spatial distribution map of the Caohai Lake wetland waterfowl habitat suitability evaluation factor scores.
Sustainability 14 14409 g006
Figure 7. Distribution map of the Caohai Lake wetland waterfowl habitat suitability spaces.
Sustainability 14 14409 g007
Figure 8. Distribution map of the Caohai Lake wetland waterfowl habitat suitability changes: (a) indicates the changing trend of habitat suitability, (b) indicates the number of changes of habitat suitability level.
Sustainability 14 14409 g008
Figure 9. Scatter plot of the Caohai Lake wetland waterfowl habitat suitability score, versus the human disturbance index.
Sustainability 14 14409 g009
Table 1. Details of data sources.
YearData SourceFrame Number-TimeAcquisition Source
2000landsat5 TM129041-00-02, 129041-00-03, 129041-00-04National Aeronautics and Space Administration
2010landsat8 OLI129041-10-02, 129041-10-03, 129041-10-04
2022landsat8 OLI129041-22-02, 129041-22-03, 129041-22-04
Table 2. Caohai Lake wetland waterfowl habitat evaluation factor weights.
Target LayerCriterion LayerDecision Layer
FactorWeightFactorWeight
Waterfowl habitat suitability evaluationWater source status0.3Distance from water bodies0.65
NDMI0.35
Disturbance factor0.2Distance from roads0.45
Distance from residential areas0.55
Shelter0.2Land cover0.60
Fractional vegetation cover0.40
Food availability0.3NDVI1
Table 3. Caohai Lake wetland waterfowl habitat evaluation grade classification criteria.
Evaluation MarkersOptimal SuitabilityGood SuitabilityFair SuitabilityPoor SuitabilityUnsuitable
Distance from water bodies0–300300–600600–12001200–2400>2400
NDMI>0.30.2–0.30.1–0.20–0.1<0
Distance from roads>800400–800200–400100–2000–100
Distance from residential areas>1200600–1200300–600150–3000–150
Land coverMarshland, cultivated landForestland, grasslandWater bodiesBare landBuilt-up land
Fractional vegetation cover (FVC)0.8–1.00.6–0.80.4–0.60.2–0.40–0.2
NDVI>0.60.4–0.60.2–0.40–0.2<0
Assigned grade108642
Table 4. Disturbance coefficients of the different land cover types in the Caohai Lake wetland.
Type of Land CoverForestlandGrasslandWaterMarshlandBare LandCultivated LandBuilt-Up Land
Disturbance index0.30.40.20.10.70.60.95
Table 5. Habitat suitability area statistics for the Caohai Lake wetland over different years.
Suitability Grade200020102022
Area (km2)Proportion (%)Area (km2)Proportion (%)Area (km2)Proportion (%)
Unsuitable36.4930.5134.7429.0425.6121.40
Poor suitability46.6839.0344.5237.2224.2720.29
Fair suitability30.0925.1630.7125.6850.7042.39
Good suitability6.095.098.627.2115.7113.14
Optimum suitability0.260.221.020.853.322.78
Publisher’s Note: MDPI stays neutral with regard to jurisdictional claims in published maps and institutional affiliations.

