Article

An Effective Force-Temperature-Humidity Coupled Modeling for PEMFC Performance Parameter Matching by Using CFD and FEA Co-Simulation

1
School of Automotive Studies, Tongji University, Shanghai 201804, China
2
School of Intelligent Manufacturing, Weifang University of Science and Technology, Weifang 262700, China
3
College of Mechanical and Vehicle Engineering, Chongqing University, Chongqing 400044, China
4
School of Information Science and Electrical Engineering, Shandong Jiaotong University, Jinan 250357, China
*
Author to whom correspondence should be addressed.
Sustainability 2022, 14(21), 14416; https://doi.org/10.3390/su142114416
Submission received: 12 October 2022 / Revised: 25 October 2022 / Accepted: 1 November 2022 / Published: 3 November 2022

Abstract

:
High-performance proton exchange membrane fuel cell (PEMFC) vehicles are important for realizing carbon neutrality in transportation. However, the optimal power density of the fuel cell performance is difficult to achieve due to the internal complex operating conditions of a fuel cell stack. Moreover, there is a lack of effective models to solve the coupled multi-physical fields (force, temperature and humidity, etc.) in the PEMFC, particularly considering the gas diffusion layer (GDL) compression. Thus, a force-temperature-humidity coupled modeling method is introduced to evaluate the effects of key operating conditions for the fuel cell performance parameter matching. Firstly, the interfacial contact resistance and GDL porosity are obtained by a force-temperature coupled simulation using a finite element analysis (FEA) modeling, then the obtained results are introduced into a temperature-humidity coupled simulation using a computational fluid dynamics (CFD) modeling. An iteration algorithm is proposed to realize the force-temperature-humidity coupled simulation for the PEMFC performance. The main characteristics of the PEMFC performance parameters are revealed and the optimum matching criteria of the main performance parameters (temperature, stoichiometric ratio and relative humidity) are determined. The presented co-simulation method is significant and effective for realizing the PEMFC performance parameter matching condition, and it provides a design direction for an optimal power density of a fuel cell stack.

1. Introduction

1.1. The Need for the Performance Parameter Matching in Fuel Cells

Nowadays, the increasing attraction of carbon neutrality and global warming is a motivation for solving the challenge between economic growth and a sustainable environment for human beings [1]. Because the transportation industry is responsible for a prominent part of the CO2 emissions [2,3], it must take up the challenge and find new ways of becoming environmentally friendly. Compared to the battery electric vehicle (BEV) and internal combustion engine (ICE)-based hybrid electric vehicle (HEV), the hydrogen fuel cell electric vehicle (FCEV) technology embodies a foreseeable hope of coping with the different issues of reducing carbon pollution [4,5]. Particularly, high-performance proton exchange membrane fuel cell (PEMFC) vehicles are important to realize carbon neutrality in transportation [6]. Since the FCEV is suitable for long-time, long-range transportation with zero carbon emission, which can nearly cover one thousand kilometers, refuel in a few minutes and maintain a high energy conversation efficiency [7,8], it is considered to be the most potential full electric technology to replace the ICE of the whole transportation sector to reduce carbon emissions [9].
The fuel cell stack is the energy conversation core of the FCEV to generate the required driving power [10,11], which is composed of hundreds of cells in a series and clamped together by enough large assembly force. The fuel cell stack and its components endure complex and serious vehicular dynamic loads, which cause the difference in the internal operating parameters (temperature, humidity and reactant gas concentration, etc.) and their redistribution. The primary challenge for the FCEV’s large-scale commercialization is the performance parameter matching and controlling of a fuel cell stack, which are important for lowering the fuel consumption at the high current density during a long driving range [12]. This is mainly restricted due to the complex coupled behaviors of the fuel cell performance parameters, hindering the PEMFC in the application of the automotive sector [13]. Specifically, at first, the fuel cell stack needs to be assembled with a certain assembly force to ensure that the components are in good contact with each other, to reduce the resistance of the ion and electron transport. Secondly, the electrochemical reaction inside the fuel cell stack also needs to be maintained at a certain temperature and humidity to make the electrochemical reaction more efficient, so it needs to ensure that the operating conditions are appropriate. In addition, the heat generated by the electrochemical reaction will change the contact behavior between the components, which in turn will affect the electrochemical reaction, and the internal temperature and humidity will be redistributed [14]. Therefore, by effectively utilizing the multi-coupling process, the fuel cell power density can be increased and suitable to automotive applications. In a fuel cell stack, each cell is composed of one proton exchange membrane (PEM), catalyst layers (CL), gas diffusion layers (GDL) and bipolar plates (BPP). Under the assembly force of the fuel cell stack, the fuel cell components are compressed and deformed, which causes certain changes in the contact pressure on the multi-contact interfaces and the GDL porosity [15]. The contact pressure directly affects the interfacial contact resistance between the BPPs and GDLs, which in turn affects the output fuel cell voltage [16]. The GDL is a key component to the fuel cell performance, which plays a dual-transportation function of the supply fuel and water removal. When the GDLs are compressed by the assembly force, their small porosity under the ribs of the BPP will affect the electrochemical reaction rate by affecting the diffusion of hydrogen and oxygen concentration to the CLs, especially at a high current density, where the required reactive gases concentration is relatively higher [17,18].
Moreover, the operating temperature and the relative humidity of the fuel cell will cause the fuel cell components to expand, swell and cause thermal stress in the components, which also affects the initial contact pressure and the GDL porosity [19]. Meanwhile, the operating temperature and the relative humidity have a direct influence on the electrochemical reaction of the fuel cells [20]. Therefore, the fuel cell performance is subjected to the main working conditions such as the assembly force (i.e., component deformation) as well as the operating temperature and relative humidity, etc., which will be significant to the performance parameters (water content, hydrogen/oxygen concentration and current density, etc.). These working conditions involve multiple physical fields such as thermal, fluid, electric and structural force. It is extremely essential to reveal or utilize a more accurate multi-field coupled model for performance parameter matching at a high current density of the PEMFC. Considering the multi-coupled behaviors in the fuel cell, the FEM and CFD are con-simulated for this situation. The FEM is an efficient and commonly used computational method that discretizes a continuous structure into several finite-sized elements to solve continuum mechanics problems [21]. The CFD is an approximate representation of the integral and differential terms in the control equations of the fluid dynamics into discrete algebraic form, making it a system of algebraic equations, and then solving these discrete systems of algebraic equations to obtain numerical solutions at discrete time/space points. Furthermore, the FEM and CFD can be used to obtain parameters that are difficult to measure by experiment and to accurately simulate the internal behaviors of the fuel cell performance.

1.2. Review of the Performance Parameters Studies for PRMFCs

The applied assembly force, which affects the porosity of the GDLs and contact resistance, has a significant influence on the ohmic loss and concentration loss of the fuel cell performance. In general, the GDLs and BPPs are assembled and integrated by a certain assembly force of the fuel cell stacks, which is applied in point loads by the clamping bolts and surface loads by the clamping steel belts [22]. A large number of experimental studies have been conducted on the effects of assembly force on fuel cell performance and most studies are online tests [23,24,25]. Due to the limitations of experimental methods and technologies, it is difficult to measure the details, such as the GDL porosity and its permeability, the local water content and the current density inside the fuel cell stack. With the development of calculation algorithms and computer technologies, numerical simulation is helpful to analyze complex coupled problems, which are applied to the fuel cell performance parameter matching [26,27].
The GDL plays an important role in the fuel cell performance because it directly determines the mass, charge and heat transfer rates, resulting in the ohmic and concentration losses at high current density, which in turn affect the fuel cell performance and stability [28]. In recent studies, the GDL porosity is always normally considered to be constant, which means that the compression deformation being subjected to assembly forces is ignored in the fuel cell performance optimization. Thus, the study on the GDL porosity distribution according to the deformation distribution is one of the effective ways to enhance fuel cell performance. Abraham et al. [29] established a CFD model with a Taguchi-based optimization of the GDL porosity. It was found that the fuel cell performance with optimized porosity of the GDL was improved by 12.5% compared to the fuel cell with consistent GDL porosity, which can be attributed to the increased water content in the fuel cell membrane.
The current density of the PEMFC is mainly dependent on the GDL porosity, which directly affects the permeability of the GDL. Son et al. [30] investigated the effect of the GDL permeability on the fuel cell performance using a CFD model with three types of cathode flow fields (serpentine, parallel and interdigitated) and the GDL permeability are different in three directions, i.e., x (in-plane), y (in-plane) and z (through-plane). The results showed that the permeability in the x direction has the greatest effect on the fuel cell performance at high current density for the serpentine flow field. This is because the in-plane GDL deformation due to the assembly force is smaller than the through-plane deformation as the assembly force applied; thus, it may be more appropriate to focus on the GDL porosity or permeability in the z-direction and to take into the inconsistency of the GDL deformation. Toghyani et al. [31] studied the effect of the GDL porosity affected by the assembly force on the fuel cell performance using a CFD model. Similarly, the GDL deformation was simulated using a finite element analysis model (FEA). The results showed that the GDL intruded into the gas flow channel while the GDL thickness and porosity were reduced. Therefore, a PEMFC performance parameter matching model is important to consider the GDL deformation and its porosity.
In addition to the GDL deformation, some recent studies have also taken into account the performance parameters of the water content in the membrane. Dong et al. [21] built a coupled FEM and CFD model, and the structural deformation of the fuel cell membrane and the PEMFC performance were all investigated with different water contents of the membrane. The results showed that the PEM deformation increased with the water content, which resulted in an uneven GDL surface under the BPP channels and ribs. This swelling deformation due to the membrane water content has little effect on the PEMFC performance at low current density, while its effect is significant at high current density.
Similarly, Shi et al. [32] developed a structural model and CFD models to analyze the effect of the assembly force on the diameters of various GDL with different channel widths and channel depths to simulate the fuel cell performance. The results showed that the GDL deformation under the BPP rib is more obvious than that under the flow channel, which is favorable to water removal during the electrochemical reaction at the high current density.
The above studies do not provide a realistic simulation of the consistency problems in a fuel cell stack caused by the assembly force, particularly the GDL deformation under the BPP ribs and the channels. While the GDL deformation will lead to a more significant change in the thermal and electrical properties of the fuel cell, thus affecting the consistency and the overall performance of a fuel cell stack. For example, Yan et al. [24] investigated the effect of assembly force on the PEMFC performance, considering the different physical properties of GDL (thickness, porosity, permeability, thermal conductivity, electrical conductivity and contact resistance, etc.). It turned out that there existed a proper assembly force that allowed the stack power output to be maximized and the consistency of the fuel cells can be improved.
The above studies are based on a co-simulation of FEM and CFD to investigate the PEMFC performance subjected to certain assembly forces. However, there still exist some problems. For instance, some co-simulation models above usually perform only one iteration, i.e., the results of the FEM simulation are directly adopted as the real deformation of the GDL, while the effect of the operating temperature and relative humidity on the redistribution of the GDL deformation during the PEMFC electrochemical reaction should be considered. In addition, the mechanism of multi-field coupling in PEMFC is necessary to accurately provide the optimal matching solutions that can improve the output power of the fuel cells. Therefore, to accurately describe the effect of the GDL deformation of the fuel cell, a force-temperature coupled model is firstly established and then a temperature-humidity coupled simulation is carried out, in which the force-temperature coupled simulation effects are introduced by user-defined functions (UDFs). The key point is that an iteration method is developed to realize the simulation of the coupled force-temperature-humidity multi-field effects. Furthermore, the effects under the different working conditions on the fuel cell performance parameters (temperature, hydrogen/air stoichiometric ratio, relative humidity and the current density) are investigated. The co-simulation PEMFC multi-field coupled model with an iteration algorithm in this study can better ensure the accurate prediction of the fuel cell performance model, which also helps to reveal the internal force-thermal-humidity multi-physical field coupled effects on the PEMFC performance. This study can provide a new way for the fuel cell operating condition parameter matching and control.

2. Model Description of Force-Temperature-Humidity Coupled Model

2.1. Force-Temperature and Temperature-Humidity Coupled Model

A 3-D PEMFC performance model is developed as shown in Figure 1, which includes GDLs, CLs, PEM and BPP (anode BPP and the cathode BPP) with straight flow channels. In Figure 1, the anode side is on the top of the developed model and the cathode side is on the bottom of the model. The dimensions are shown in Table 1.
The following assumptions are illustrated to establish the force-temperature coupled model: (1) the contact resistance between the BPPs and GDLs is mainly considered; (2) the effect of thermal expansion of CL and PEM is ignored due to its thin thickness; (3) the GDL deformation is elastic. According to the symmetry of the fuel cell structure, a symmetric constraint is applied on the GDL support surface 1 and the two sides of boundary 2. The assembly force is applied by the displacement load on the upper surface of the BPP to represent the movement of the endplate during the assembly as shown in Figure 2. The material properties of the GDL are shown in Table 2.
The PEMFC is a multi-physics system, which contains complex coupled phenomena. Numerical modeling of these phenomena involves differential equations of the PEMFC performance, which are expressed in Table 3, and the relevant parameters are shown in detail in Table 4.

2.2. Force-Temperature-Humidity Multi-Field Coupled PEMFC Model

The GDL porosity after compression ε z can be calculated from the GDL deformation after compression [24]:
ε z = 1 ( 1 ε 0 ) δ 0 δ z
ε 0 and δ 0 are the initial thickness and porosity of the GDL, respectively; δ z are the thickness after compression. The relationship between contact resistance and contact pressure between the BPP and GDL can be obtained by fitting the results after the experimental measurement as [36]:
ρ c = K p m
ρ c is the interfacial contact resistance; p is the contact pressure; K and m are the fitted parameters, and the fitting results are 29.39 and 0.60, respectively.
Firstly, the force-temperature coupled model is carried out in ANSYS® when the initial room temperature is set to 20 °C. The deformation of the component at the initial temperature is obtained as shown in Figure 3, the main deformation exists at the GDL due to its low Young modulus. Then the GDL thickness and contact pressure on the contact area are extracted and based on Equations (1) and (2), the GDL porosity and contact resistance distribution are added to the temperature-humidity coupled performance model in FLUENT® by UDFs to find the temperature field for the first iteration.
The steady-state temperature field under the force-temperature-humidity coupled simulation, as shown in Figure 4, is conducted to the presented force-temperature coupled model, and the GDL contact pressure and deformation under the temperature field can be obtained. Then, the contact pressure and contact resistance of each unit are compared with the previous results. If the difference is not less than 1%, the next iteration is carried out, i.e., the contact resistance and porosity distribution are conducted into the FLUENT® model by UDFs, and the modified steady-state temperature field is obtained by simulation, which is then loaded on the force-temperature coupled model again until the differences are less than 1%, and then the co-simulation is converged.

3. Results and Discussions

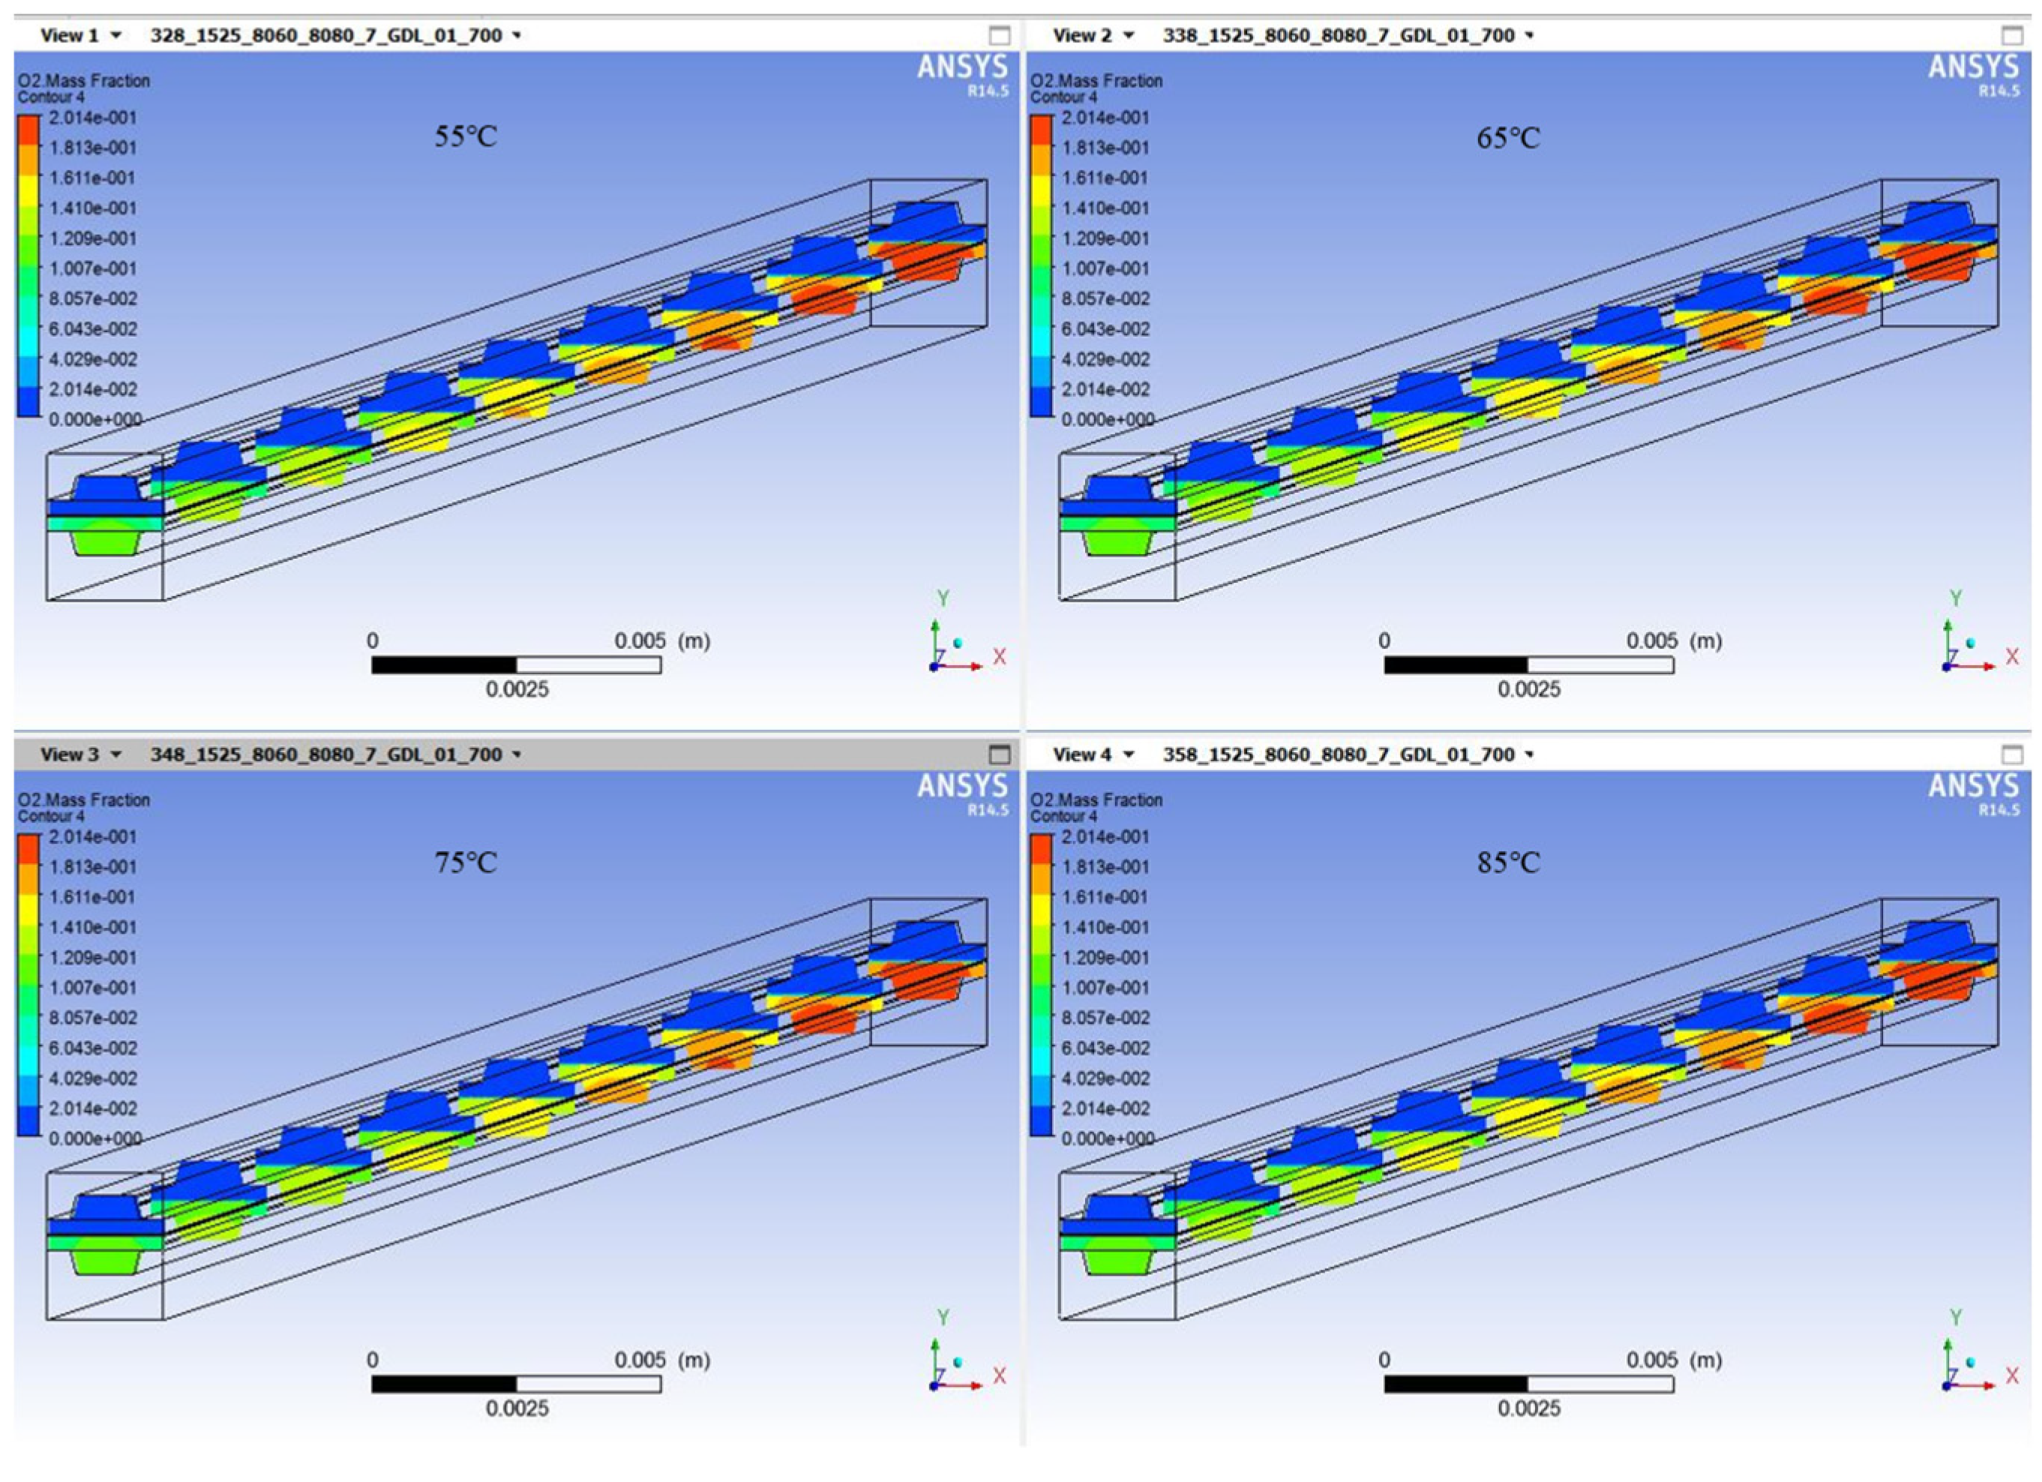
3.1. Effects of Operating Temperature on the Performance Parameters

The effects of the different operating temperatures (55 °C, 65 °C, 75 °C, and 85 °C) on the performance parameters in the fuel cell with the following working conditions are the following: hydrogen/air stoichiometry ratio 1.5/2.5, hydrogen/air relative humidity 80%/60%, current density 1.2 A/cm2, and displacement load 0.07 mm. The following cross sections are perpendicular to the flow channel direction and equally spaced along the hydrogen inlet to the air inlet direction, i.e., z-axis negative direction.
Figure 5 shows the water content in the fuel cell with different operating temperatures. It can be seen that the membrane water content under both the flow channels and ribs at the anode (the top part of the model as shown in Figure 1) gradually increases with the operating temperature, which is due to the enhanced water diffusion capacity at the high temperatures. Moreover, with the increase in operating temperature, the water contents in the membrane under both the flow channels and ribs of the BPP at the cathode (the bottom part of the model as shown in Figure 1) increase and then decrease from 55 °C to 85 °C. This is because the high temperature will facilitate the electrochemical reaction rate, then more water is generated on the cathode side. On the other hand, the operating temperature will increase the water diffusion capacity, which results in the water diffusion through the membrane to the anode side. The enhanced electrochemical reaction rate produces water more significantly, so the water content rises from 55 °C to 75 °C. As the temperature continues to rise to 85 °C, the effect of the water diffusion is enhanced, and the water content at the cathode decreases.
Figure 6 shows the hydrogen concentration in the fuel cell with different operating temperatures. It can be found that the concentration of hydrogen in the anode GDL gradually decreases with the operating temperature. The porosity of the GDL has little effect on the hydrogen concentration due to the small hydrogen diffusion coefficient that is insensitive to the GDL porosity.
Figure 7 shows the oxygen concentration with the different operating temperatures. The diffusion coefficient of the gas increases with the operating temperature since the oxygen diffuses into the GDL more easily and the effect is more pronounced under the flow channel because of a larger GDL porosity compared to the GDL porosity under the ribs.
Figure 8 shows the average and maximum current density distribution of the different cross sections along the flow channel in the fuel cell with the different operating temperatures. It can be seen from Figure 8 that the operating temperature has an important influence on the distribution of the current density. The average and maximum current density distribution are all relatively uniform and high at 55 °C and 65 °C compared to the high operating temperature (75 °C and 85 °C); this is because the increase in the operating temperature is favorable to the electrochemical reaction and also the electrical conductivity of the membrane. However, too high temperature (75 °C and 85 °C) will lead to a non-uniform water concentration distribution along the flow channel, and current density distribution along the flow channel and the current density at the inlet and outlet is low.

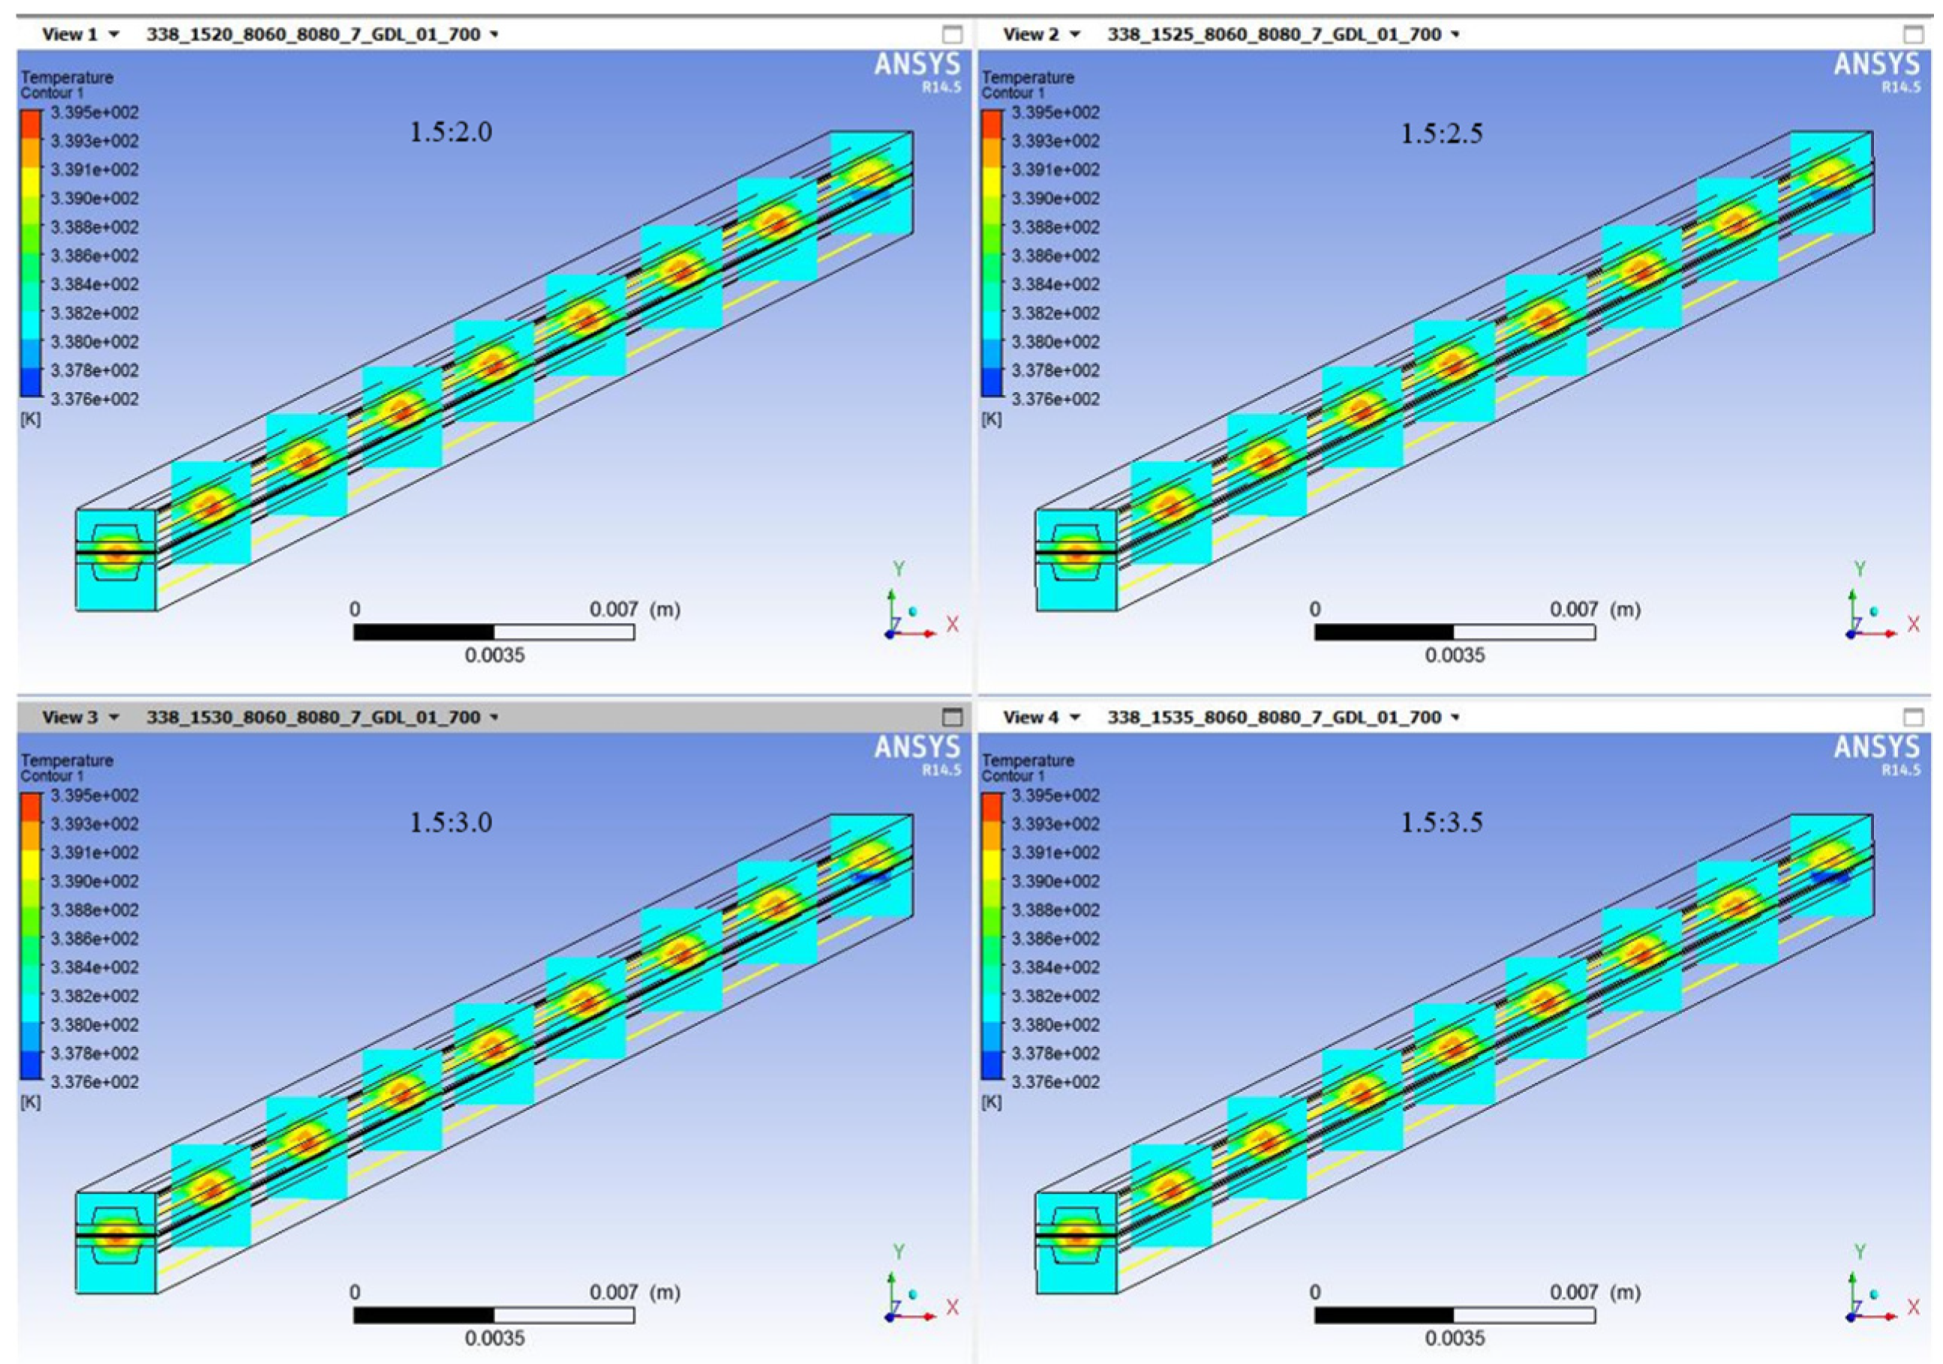
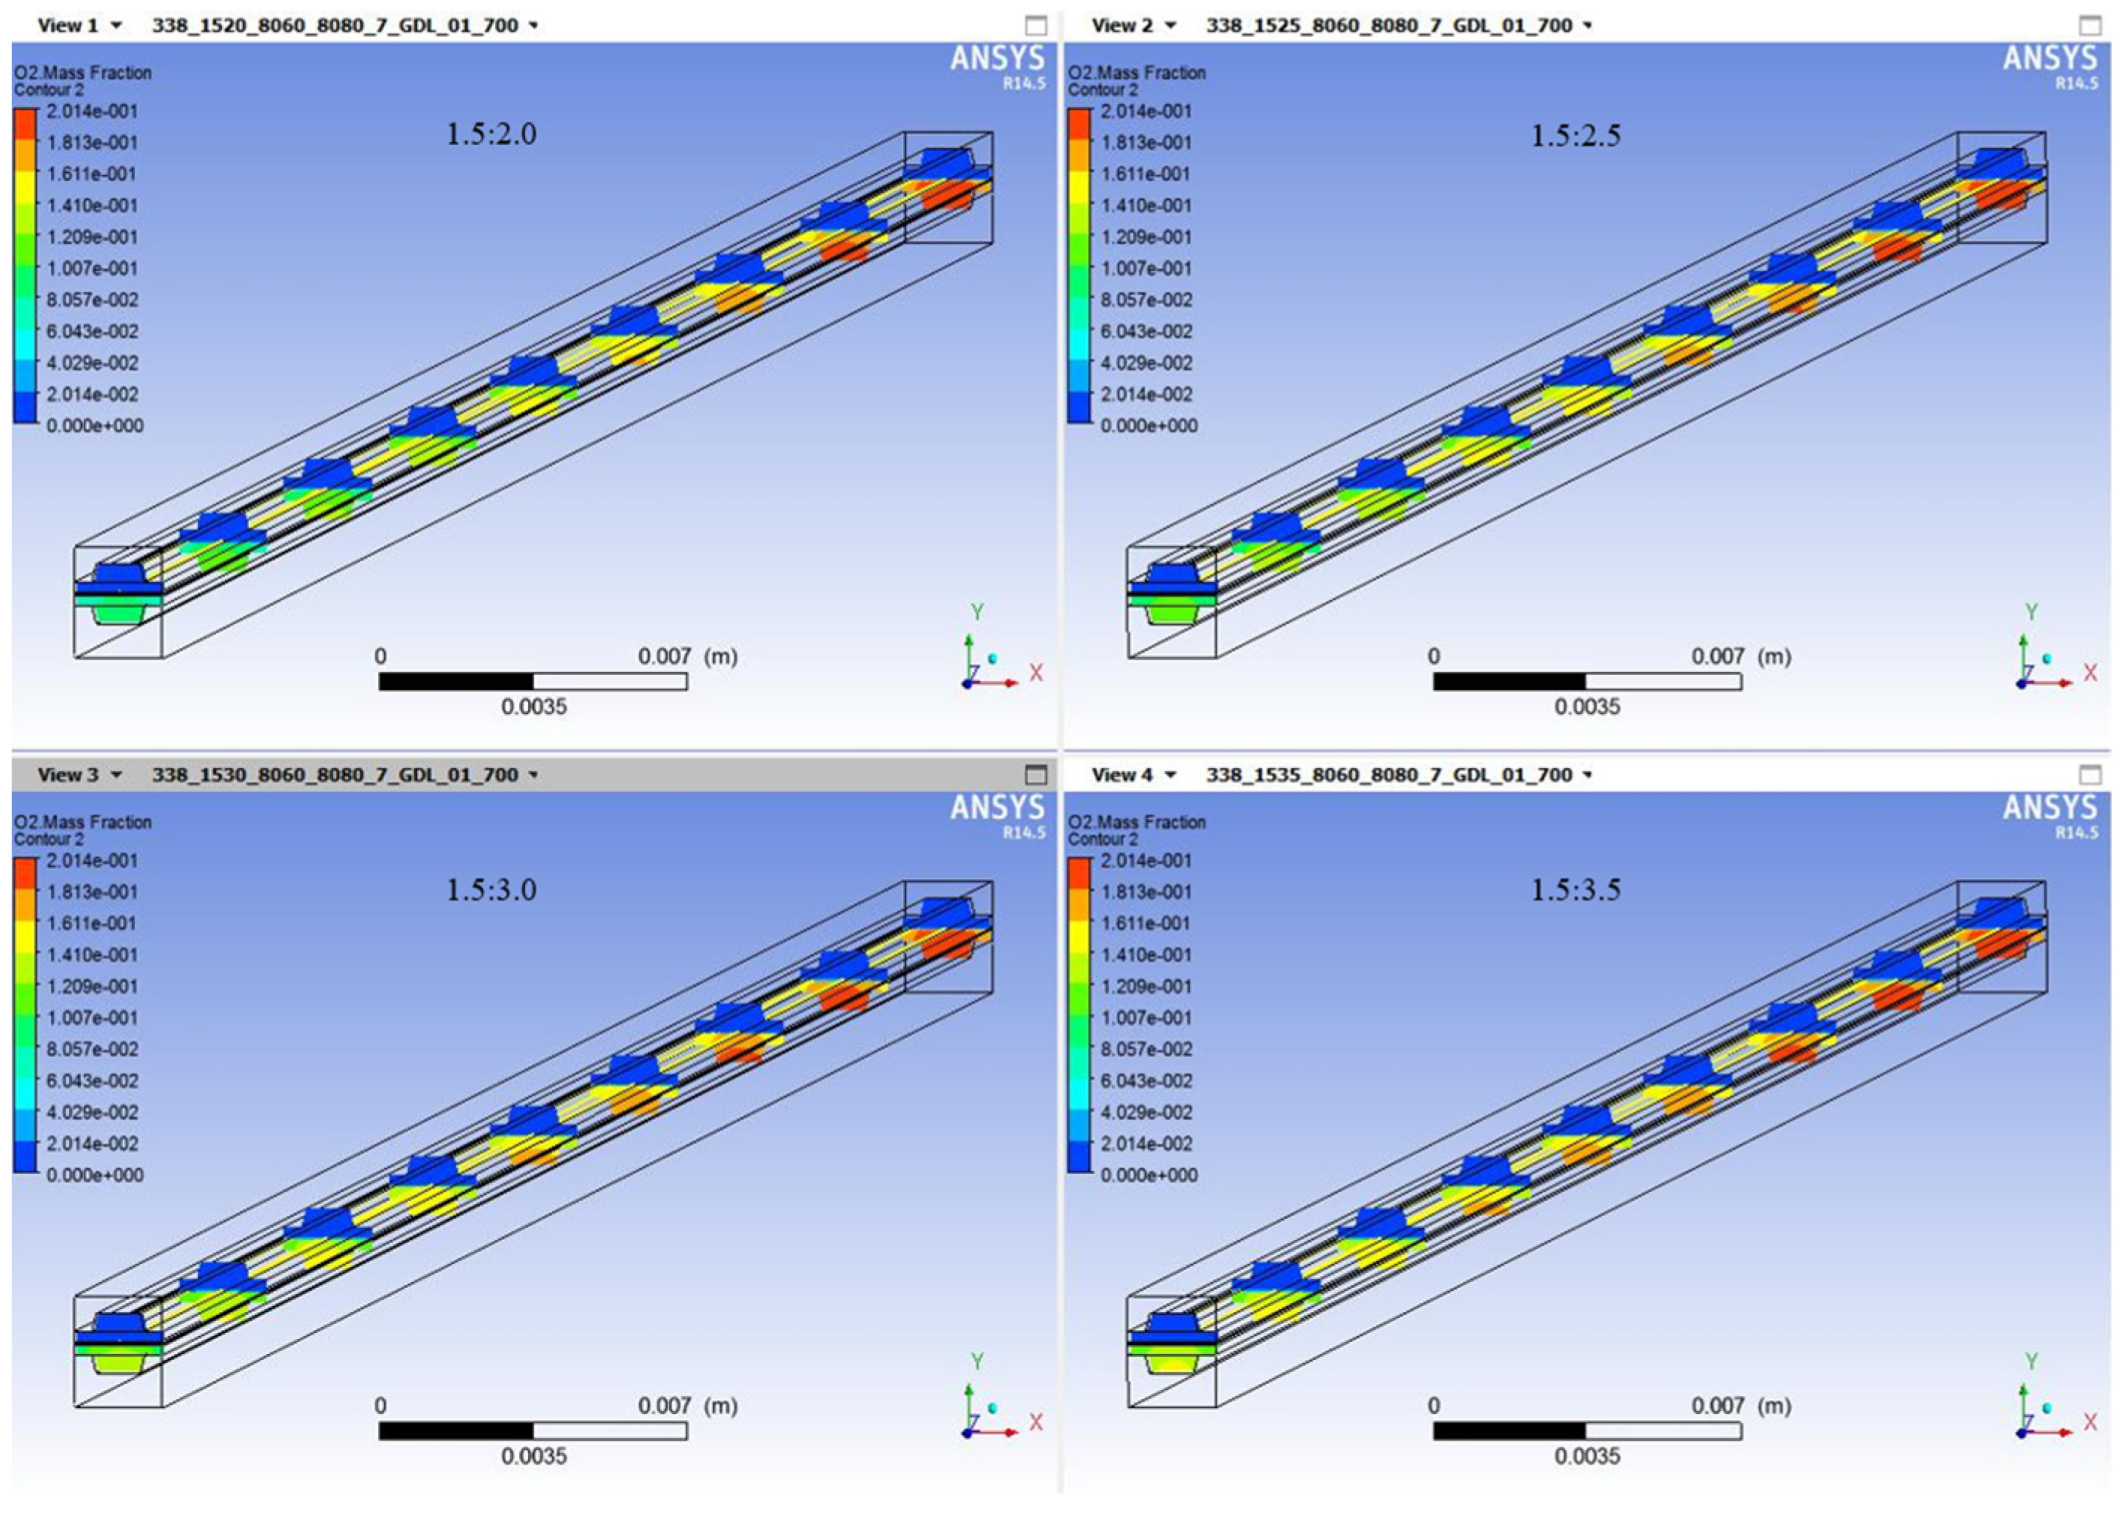
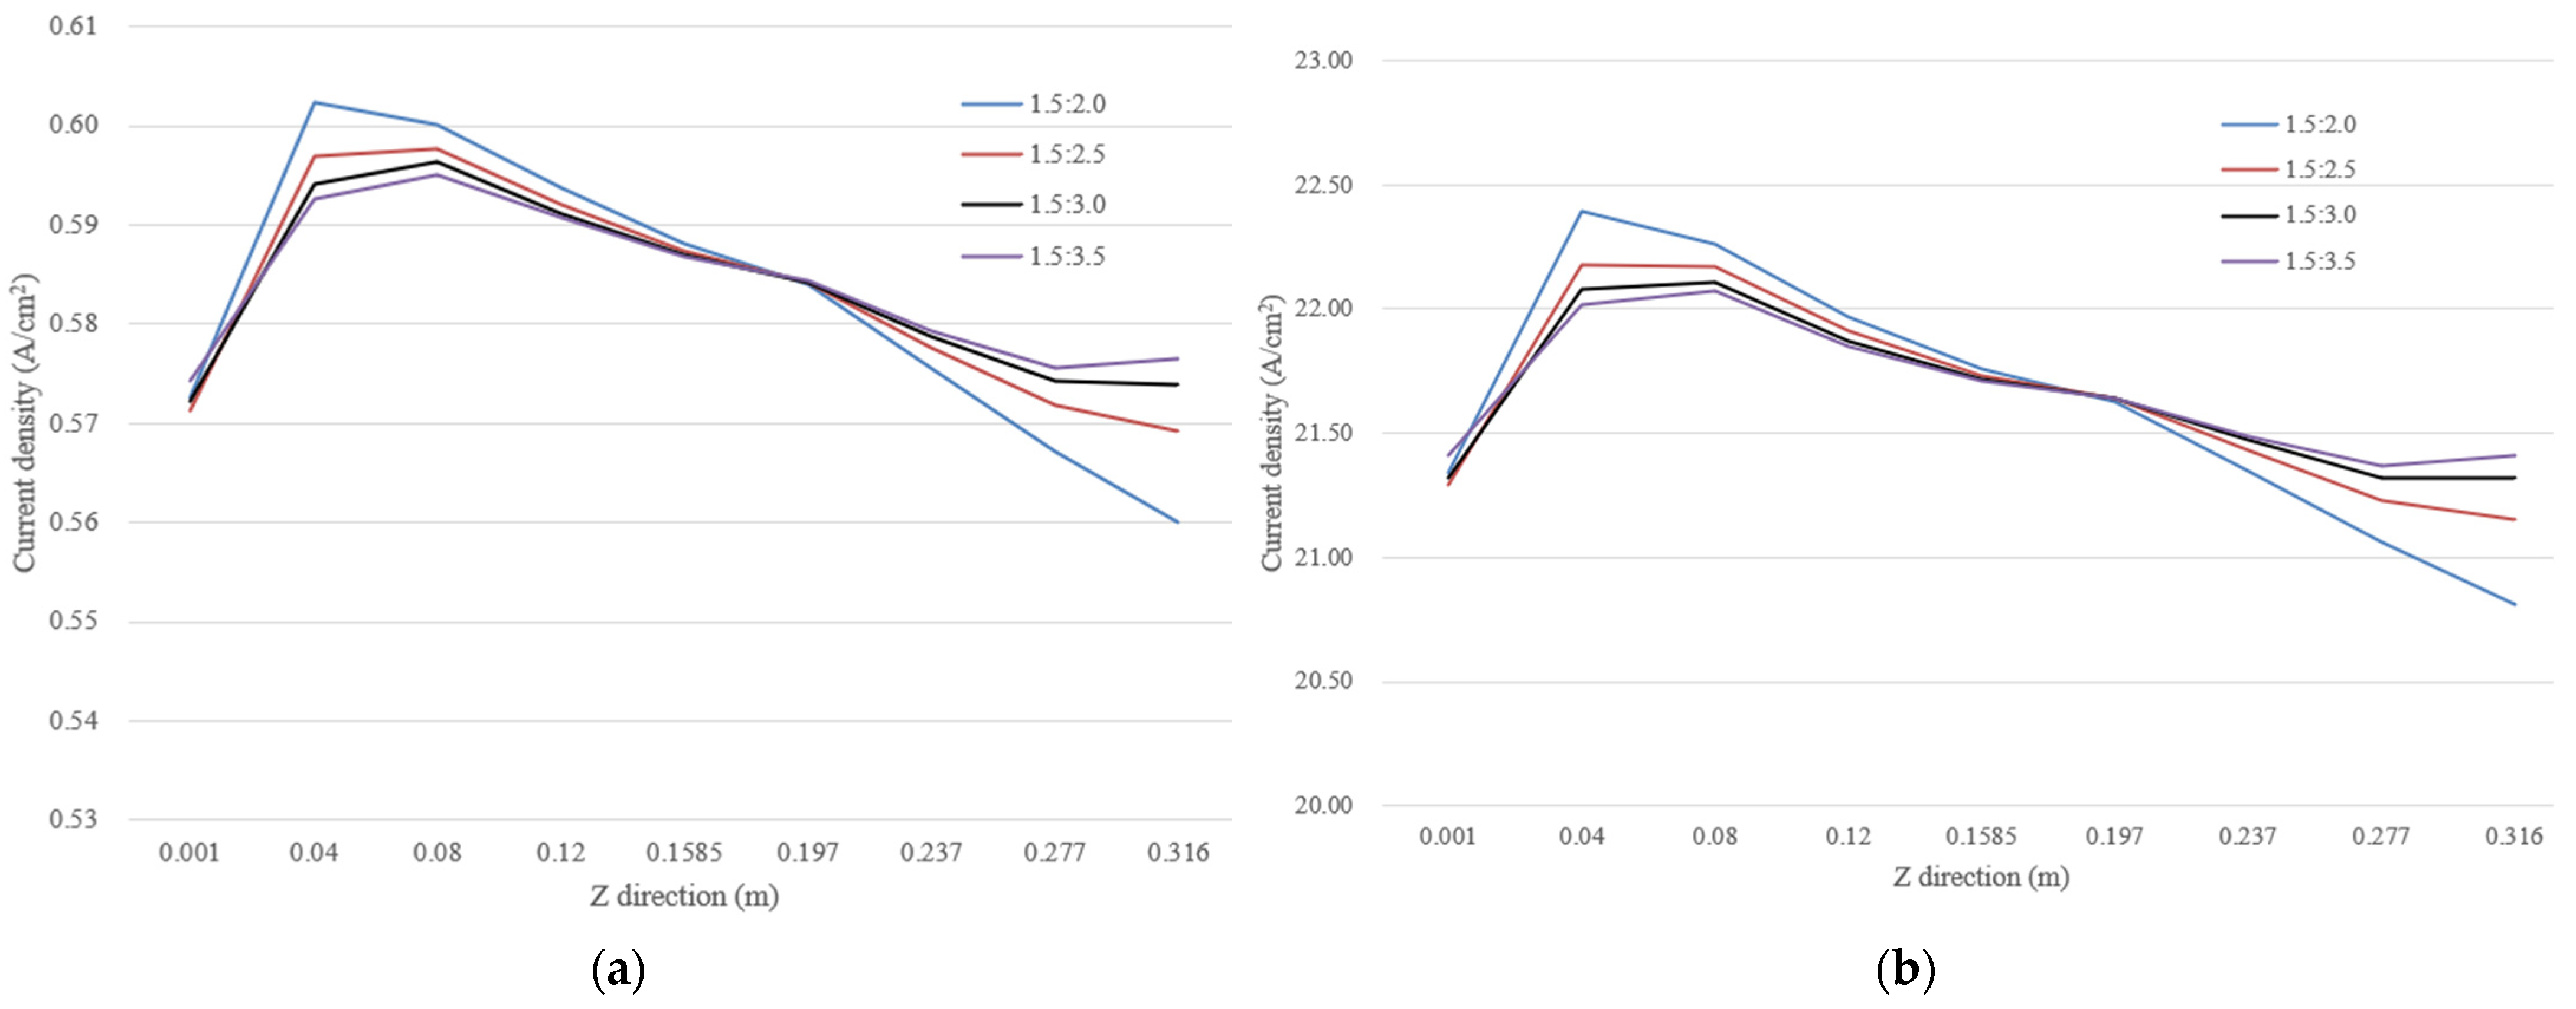
3.2. Effects of Hydrogen/Air Stoichiometric Ratio on the Performance Parameters

Since the hydrogen/air stoichiometry ratio is an important factor in the fuel cell performance, the effects of different hydrogen/air stoichiometry ratios (1.5/2.0, 1.5/2.5, 1.5/3.0, 1.5/3.5) of inlet reactive gas are also investigated on the distribution of the performance parameters (operating temperature, water content, hydrogen/oxygen concentration and current density) in the fuel cell.
Figure 9 shows the distribution of the temperature in the fuel cell with the different hydrogen/air stoichiometry ratios. It can be seen that as the air stoichiometry ratio increases, the operating temperature tends to decrease. This is because the increased gas flow rate takes away produced heat and enhances heat dissipation.
Figure 10 shows the distribution of the water content in the fuel cell with the different hydrogen/air stoichiometry ratios. It can be seen that as the oxygen flow rate increases, the water content decreases, particularly on the cathode side. This is because, with the increase in the gas flow rate in the cathode flow channel, the generated water is more easily purged out. The difference in water content under the flow channel and rib is mainly due to the different porosity of the compressed GDL.
Figure 11 and Figure 12, respectively, show the distribution of hydrogen concentration and oxygen concentration in the fuel cell with different hydrogen/air stoichiometry ratios. As shown in Figure 11, there is a slight increase in hydrogen concentration as the air stoichiometry ratio increases. This is mainly caused by the decreased water content in the hydrogen/water mixture of the anode side, which contrarily increases the hydrogen concentration. As the air stoichiometry ratio increases, there is a significant increase in the oxygen concentration in the GDL, as shown in Figure 12, which is reasonable.
Figure 13 shows the average and maximum current density distribution of the cross sections along the flow channel with the different hydrogen/air stoichiometry ratios. It can be found that the current density along the flow channel increases slightly and then decreases, but the whole variance is enough small. Moreover, with the increase in the stoichiometry ratio, the air supply is sufficient to prevent the lack of the reaction gas, and the current density distribution in the fuel cell becomes more uniform. Meanwhile, the enhanced gas flow rate is helpful to purge out the generated water and ensure more oxygen diffuses through the GDL to the CL for an electrochemical reaction, increasing the effective reaction area. Thus, the current density distribution in the fuel cell becomes uniform and effectively avoids local hot spots.

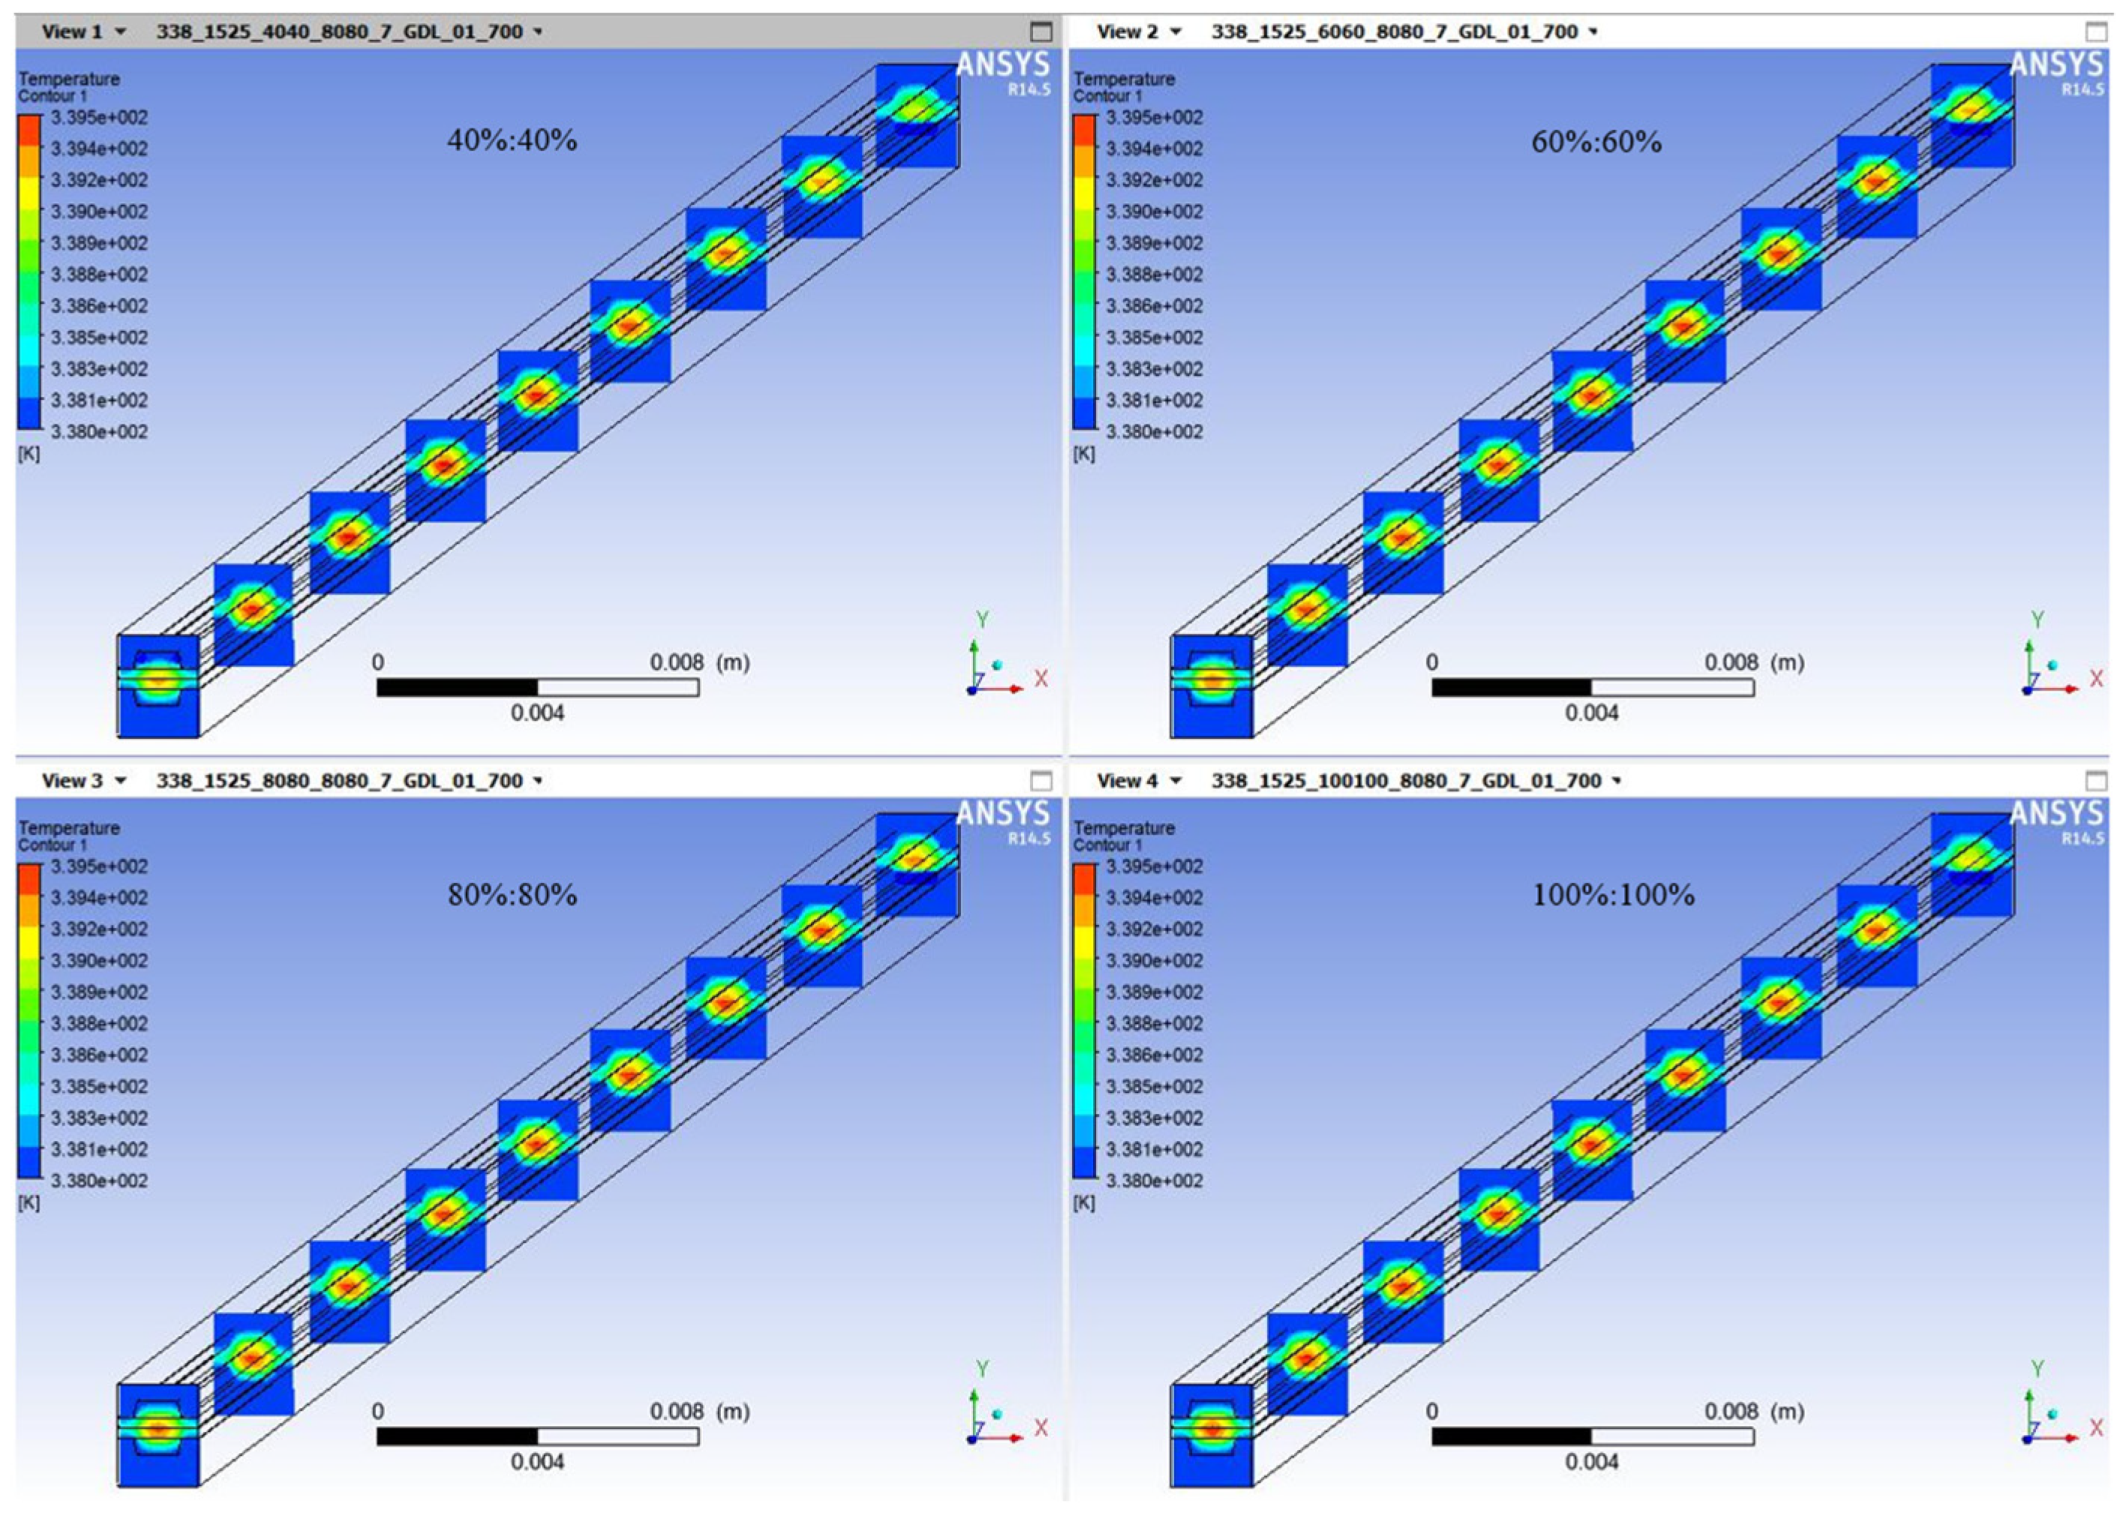
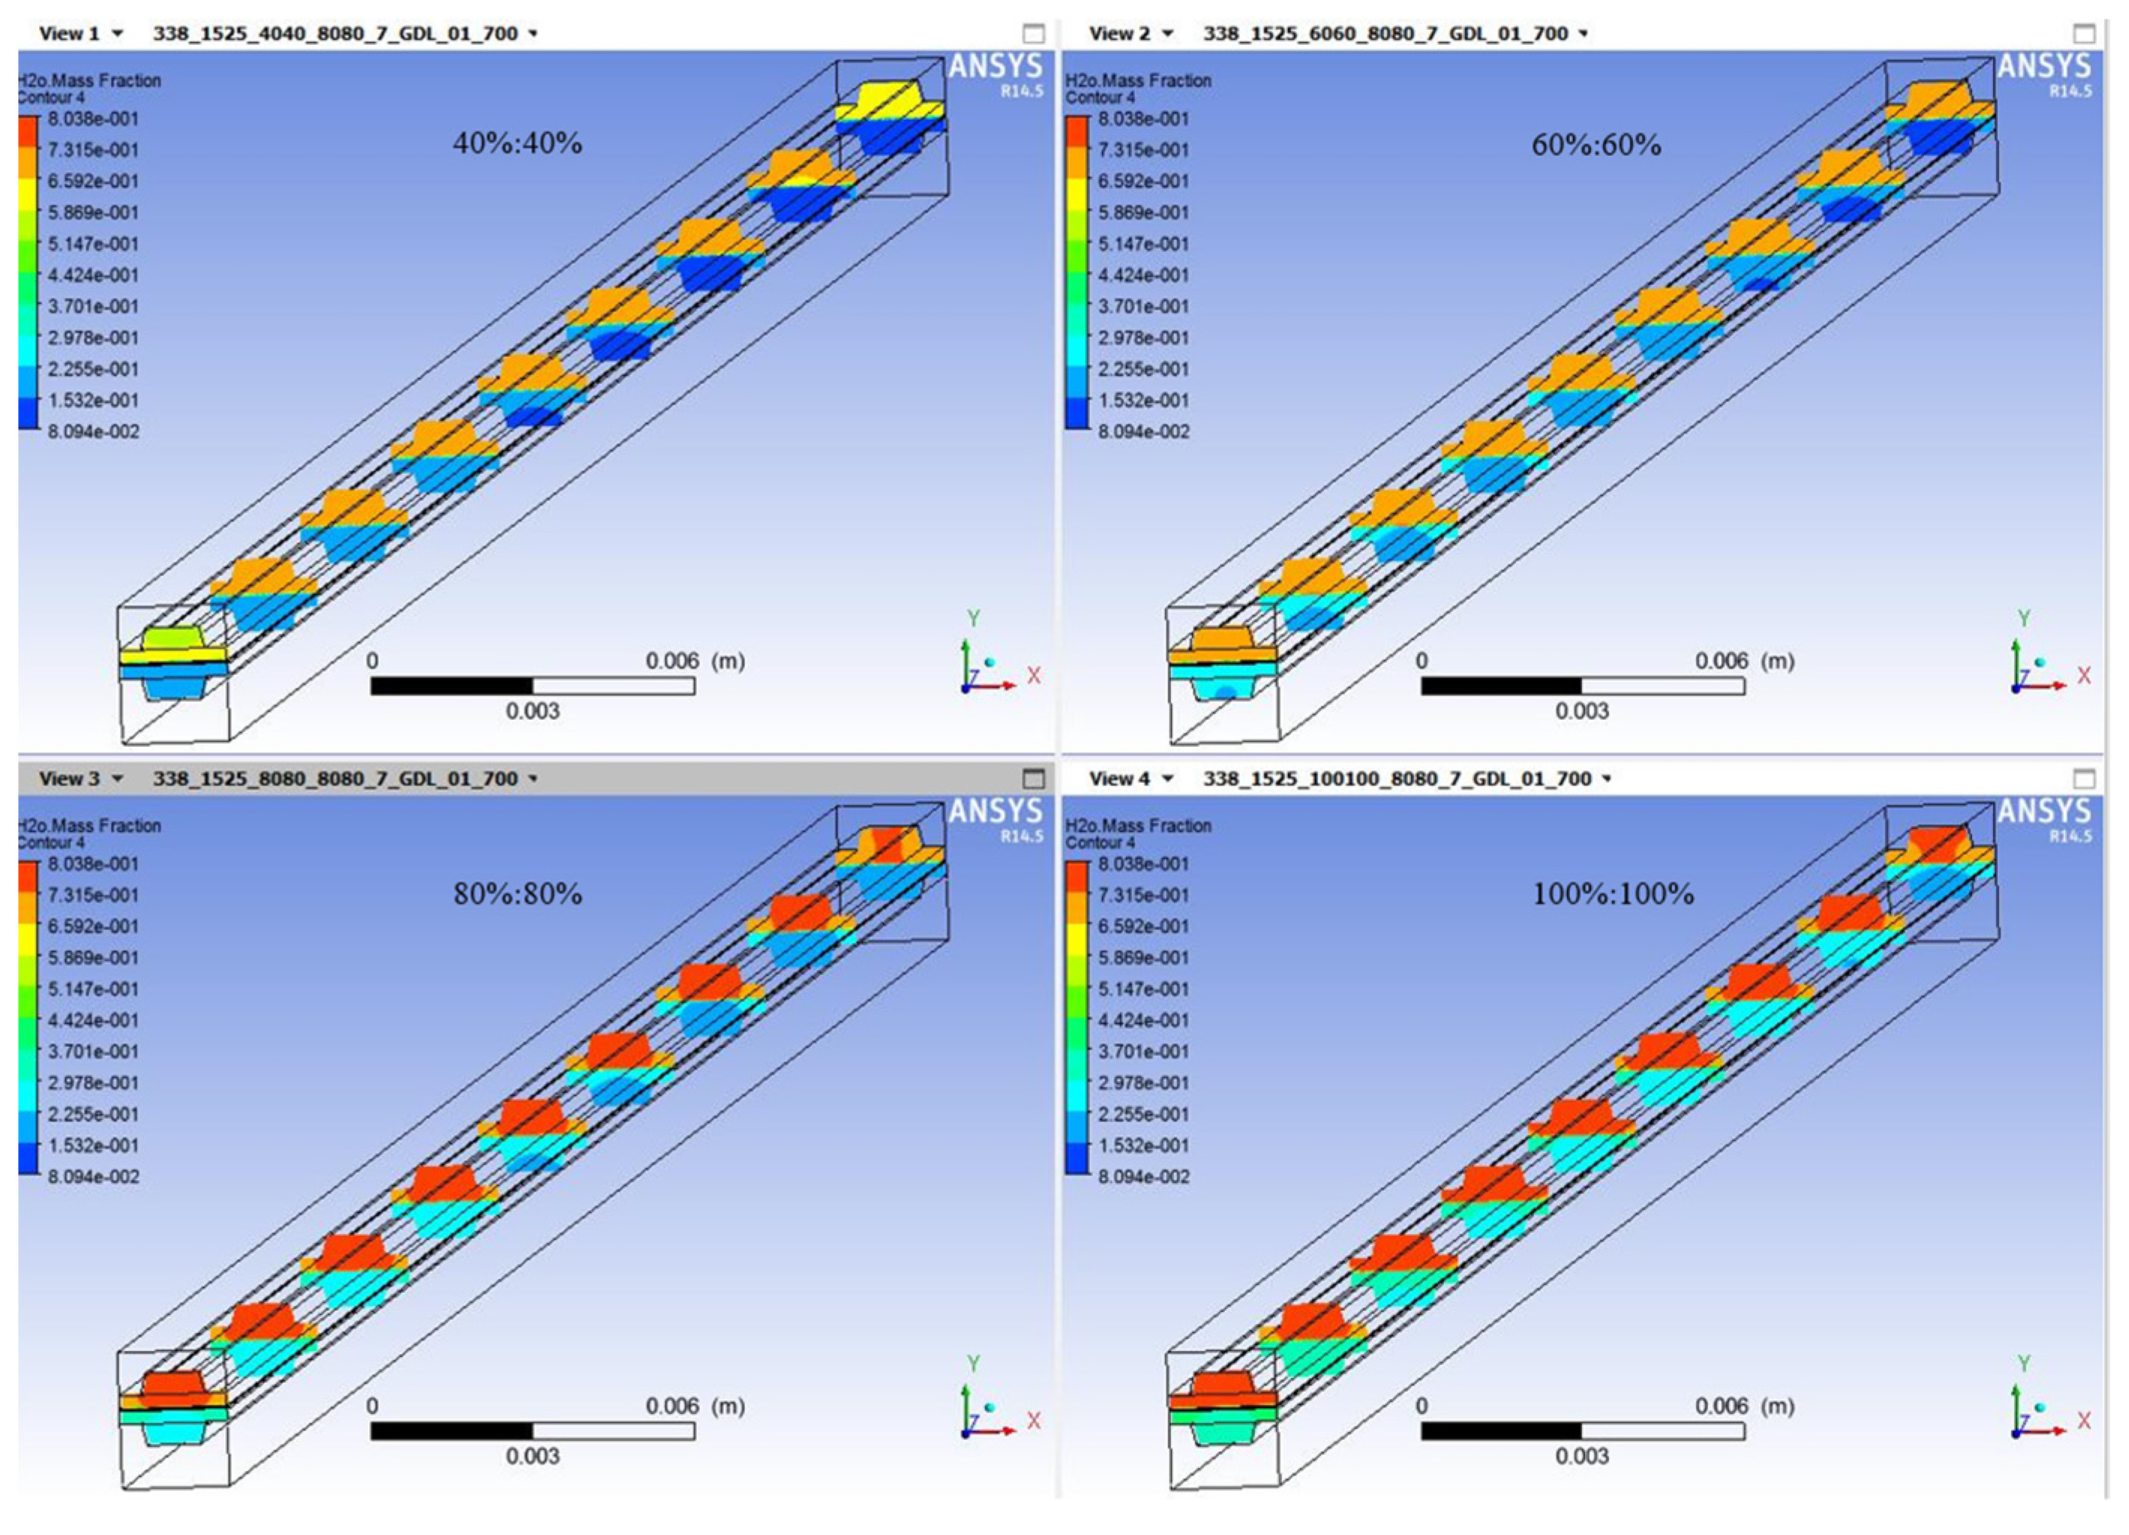
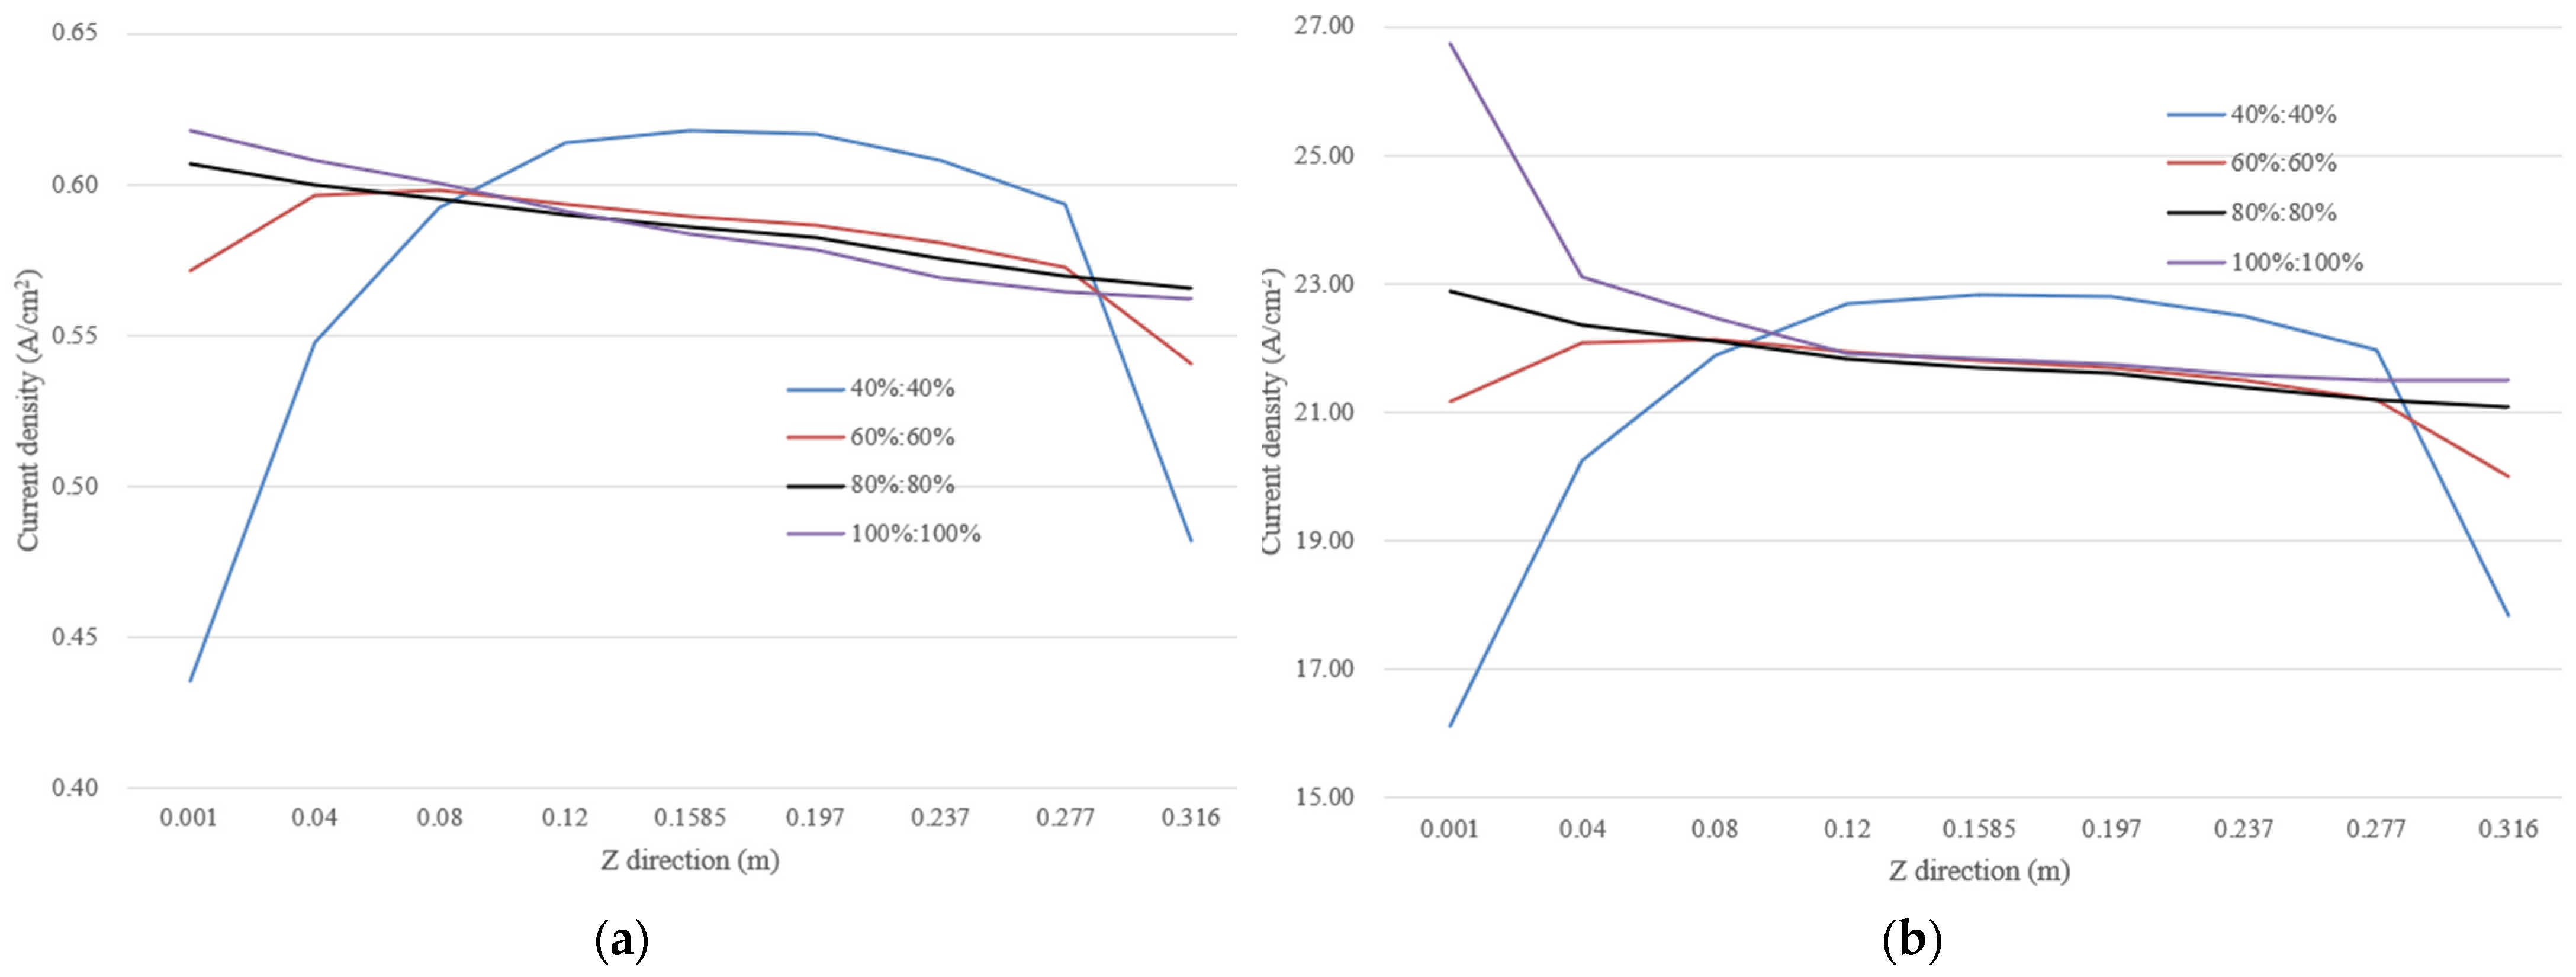
3.3. Effects of the Relative Humidity Distribution on the Performance Parameters

Since the hydrogen/air relative humidity has an important influence on the fuel cell performance, the effects of the different hydrogen/air relative humidity (40%/40%, 60%/60%, 80%/80%, 100%/100%) on the performance parameters (operating temperature, water content, hydrogen/oxygen concentration and current density) in the fuel cell are studied.
Figure 14 shows the distribution of the operating temperature in the fuel cell with the different hydrogen/air relative humidity of the inlet gas. It can be seen that as the relative humidity increases, the internal operating temperature of the fuel cell increases and then decreases. Firstly, the water content in the membrane has a significant increase with the increase in the relative humidity, which facilitates the improvement of the problem of the membrane dryer. Then the electrochemical reaction rate and the produced heat will also increase. When the relative humidity continues to increase while the water content in the membrane is enough large, then the operating temperature will decrease because the heat is absorbed, since the specific heat capacity of the water is larger than the reactive gases.
Figure 15 shows the distribution of the water content in the fuel cell with the different hydrogen/air relative humidity. It can be seen that the water content in the fuel cell increases and the water content in the membrane under the rib is higher than that under the flow channel because the GDL porosity under the rib is small and the gas flow has less purging effect on the water removal. It should be noted that excessive gas humidity may also cause the water flooding problem under the rib. Hence, relative humidity is an important controlling factor for the fuel cell performance.
Figure 16 and Figure 17 show the distribution of the hydrogen concentration and the oxygen concentration along the flow channel in the fuel cell with the different hydrogen/air relative humidity. It can be seen that both hydrogen and oxygen concentrations decrease with the increase in relative humidity because the electrochemical reaction enhances and facilitates the consumption of hydrogen and oxygen.
Figure 18 shows the average and maximum current density along the flow channel of the cross sections with the different hydrogen/air relative humidity. As the relative humidity increases, the current density distribution becomes more uniform as shown in Figure 18; the low relative humidity (RH40%/40%) is not favorable to the current density in this case, which will result in the hot point and local dry region, since the high relative humidity allows the membrane to be fully moist. Thus, it can be concluded that the high relative humidity can lead to the uniform current density distribution in the fuel cell, which should also be well considered in controlling the fuel cell stack.

4. Conclusions

To comprehensively simulate and analyze the PEMFC performance parameters with the multi-field coupled behavior, this study proposes a force-temperature-humidity multi-field coupled model considering the GDL compression to analyze the effects of key operating conditions (operating temperature, relative humidity and hydrogen/air stoichiometric ratio) on the performance parameters (water content, hydrogen/oxygen concentration and current density). This presented model is effective and desirable to optimize the performance parameters in the PEMFC stack.
Firstly, a force-temperature-humidity multi-field coupled model considering the GDL compression is introduced to analyze the PEMFC performance parameters based on the FEA and CFD co-simulation with an iteration algorithm.
Secondly, an optimal operating temperature is significant to facilitate the proton conductivity in the membrane, which can decrease the internal resistance and increase the uniform current density distribution. However, the too-large operating temperature will lead to the non-uniform distribution of the water content along the flow channel and the increase in the internal resistance in the membrane.
Thirdly, a high air stoichiometric ratio will lead to a slight decrease in the operating temperature of the fuel cell, which is due to the enhancement of heat dissipation. Meanwhile, it is ideal for the uniform oxygen concentration and current density along the flow channel, which is desirable to the PEMFC performance.
Finally, high relative humidity will cause the increase in the water content in the membrane and the current density to be more uniformly distributed. However, too much relative humidity is not beneficial to water removal and results in the water flooding problem in the GDL under the rib.
This study confirms that this effective multi-field coupled model is practical for the optimal PEMFC performance parameter matching and controlling, which will be desirable to evaluate the performance of a large fuel cell stack design regarding the complex multi-field phenomenon and the coupled relation of the performance parameters.

Author Contributions

Conceptualization, Z.Z. and K.L.; methodology, Z.Z.; software, S.W., C.Z. and G.W.; validation, Z.Z., J.Z. and S.W.; resources, T.Z. and C.Z.; writing—original draft preparation, Z.Z. and S.W.; writing—review and editing, Z.Z. and J.Z.; project administration, Z.Z. and T.Z.; funding acquisition, Z.Z. All authors have read and agreed to the published version of the manuscript. Please turn to the CRediT taxonomy for the term explanation. Authorship must be limited to those who have contributed substantially to the work reported.

Funding

This research was funded by the Natural Science Foundation of Shanghai, grant number 22ZR1466800.

Institutional Review Board Statement

Not applicable.

Informed Consent Statement

Not applicable.

Data Availability Statement

Not applicable.

Conflicts of Interest

The authors declare no conflict of interest.

References

  1. Jiao, K.; Xuan, J.; Du, Q.; Guiver, M.D. Designing the next generation of proton-exchange membrane fuel cells. Nature 2021, 595, 361–369. [Google Scholar] [CrossRef] [PubMed]
  2. Zeng, T.; Zhang, C.; Hao, D.; Cao, D.; Chen, J.; Chen, J.; Li, J. Data-driven approach for short-term power demand prediction of fuel cell hybrid vehicles. Energy 2020, 208, 118319. [Google Scholar] [CrossRef]
  3. Dong, P.; Zhao, J.; Liu, X.; Wu, J.; Xu, X.; Liu, Y.; Wang, S.; Guo, W. Practical application of energy management strategy for hybrid electric vehicles based on intelligent and connected technologies: Development stages, challenges, and future trends. Renew. Sustain. Energy Rev. 2022, 170, 112947. [Google Scholar] [CrossRef]
  4. Zhou, J.; Feng, C.; Su, Q.; Jiang, S.; Fan, Z.; Ruan, J.; Sun, S.; Hu, L. The Multi-Objective Optimization of Powertrain Design and Energy Management Strategy for Fuel Cell–Battery Electric Vehicle. Sustainability 2022, 14, 6320. [Google Scholar] [CrossRef]
  5. Xu, X.; Zhao, J.; Zhao, J.; Shi, K.; Dong, P.; Wang, S.; Liu, Y.; Guo, W.; Liu, X. Comparative study on fuel saving potential of series-parallel hybrid transmission and series hybrid transmission. Energy Convers. Manag. 2022, 252, 114970. [Google Scholar] [CrossRef]
  6. Zhang, Z.; Wu, S.; Miao, H.M.; Zhang, T. Numerical Investigation of Flow Channel Design and Tapered Slope Effects on PEM Fuel Cell Performance. Sustainability 2022, 14, 11167. [Google Scholar]
  7. Zeng, T.; Zhang, C.; Zhang, Y.; Deng, C.; Hao, D.; Zhu, Z.; Ran, H.; Cao, D. Optimization-oriented adaptive equivalent consumption minimization strategy based on short-term demand power prediction for fuel cell hybrid vehicle. Energy 2021, 227, 120305. [Google Scholar] [CrossRef]
  8. Zhang, Y.; Zhang, C.; Huang, Z.; Xu, L.; Liu, Z.; Liu, M. Real-Time Energy Management Strategy for Fuel Cell Range Extender Vehicles Based on Nonlinear Control. IEEE Trans. Transp. Electrif. 2019, 5, 1294–1305. [Google Scholar] [CrossRef]
  9. Zhang, C.; Cao, X.; Bujlo, P.; Chen, B.; Zhang, X.; Sheng, X.; Liang, C. Review on the safety analysis and protection strategies of fast filling hydrogen storage system for fuel cell vehicle application. J. Energy Storage 2022, 45, 103451. [Google Scholar] [CrossRef]
  10. Niu, T.; Huang, W.; Zhang, C.; Zeng, T.; Chen, J.; Li, Y.; Liu, Y. Study of degradation of fuel cell stack based on the collected high-dimensional data and clustering algorithms calculations. Energy AI 2022, 10, 100184. [Google Scholar] [CrossRef]
  11. Ji, X.; Wang, X.; Li, Y.; Guo, J.; Yang, Z.; Hao, D. Sensitivity analysis of operating parameters on a 65 kW proton exchange membrane fuel cell stack performances. Energy Rep. 2022, 8, 521–527. [Google Scholar] [CrossRef]
  12. Sun, W.; Yi, F.; Hu, D.; Zhou, J. Research on matching design method of waste heat reuse system of fuel cell vehicle considering system energy consumption and waste heat exchange rate. Int. J. Energy Res. 2021, 45, 5470–5485. [Google Scholar] [CrossRef]
  13. Yang, Y.; Jia, H.; Liu, Z.; Bai, N.; Zhang, X.; Cao, T.; Zhang, J.; Zhao, P.; He, X. Overall and local effects of operating parameters on water management and performance of open-cathode PEM fuel cells. Appl. Energy 2022, 315, 118978. [Google Scholar] [CrossRef]
  14. Zhang, B.; Lin, F.; Zhang, C.; Liao, R.; Wang, Y. Design and implementation of model predictive control for an open-cathode fuel cell thermal management system. Renew. Energy 2020, 154, 1014–1024. [Google Scholar] [CrossRef]
  15. Zhang, Z.; Zhang, J.; Zhang, T. A Study of Contact Pressure with Thermo-Mechanical Coupled Action for a Full-Dimensional PEMFC Stack. Sustainability 2022, 14, 8593–8610. [Google Scholar] [CrossRef]
  16. Zhang, Z.; Zhang, J.; Zhang, T. Endplate Design and Topology Optimization of Fuel Cell Stack Clamped with Bolts. Sustainability 2022, 14, 4730–4743. [Google Scholar] [CrossRef]
  17. Huang, J.; Xiao, H.; Hu, J.; Mu, R.; Chen, Z. The influence of baffle geometry on mass transfer and performance of proton exchange membrane fuel cells considering the compression of gas diffusion layer. Int. J. Hydrogen Energy 2022, 47, 21403–21416. [Google Scholar] [CrossRef]
  18. Molaeimanesh, G.R.; Nazemian, M. Investigation of GDL compression effects on the performance of a PEM fuel cell cathode by lattice Boltzmann method. J. Power Sources 2017, 359, 494. [Google Scholar] [CrossRef]
  19. Xing, L.; Wang, Y.; Prodip, K.; Das Keith, S.; Shi, W. Homogenization of current density of PEM fuel cells by in-plane graded distributions of platinum loading and GDL porosity. Chem. Eng. Sci. 2018, 192, 699. [Google Scholar] [CrossRef] [Green Version]
  20. Hu, D.; Wang, Y.; Li, J.; Yang, Q.; Wang, J. Investigation of optimal operating temperature for the PEMFC and its tracking control for energy saving in vehicle applications. Energy Convers. Manag. 2021, 249, 114842. [Google Scholar] [CrossRef]
  21. Dong, Z.; Liu, Y.; Qin, Y. Coupled FEM and CFD Modeling of Structure Deformation and Performance of PEMFC Considering the Effects of Membrane Water Content. Energies 2022, 15, 5319. [Google Scholar] [CrossRef]
  22. Qiu, D.; Peng, L.; Yi, P.; Lehnert, W.; Lai, X. Review on proton exchange membrane fuel cell stack assembly: Quality evaluation, assembly method, contact behavior and process design. Renew. Sustain. Energy Rev. 2021, 152, 111660. [Google Scholar] [CrossRef]
  23. Wu, C.W.; Zhang, W.; Han, X.; Zhang, Y.X.; Ma, G.J. A systematic review for structure optimization and clamping load design of large proton exchange membrane fuel cell stack. Power Sources 2020, 476, 228724. [Google Scholar] [CrossRef]
  24. Yan, X.; Lin, C.; Zheng, Z.; Chen, J.; Wei, G.; Zhang, J. Effect of assembly force on liquid-cooled PEMFC stack performance considering inhomogeneous gas diffusion layer compression. Appl. Energy 2020, 258, 114073. [Google Scholar] [CrossRef]
  25. Ouaidat, G.; Cherouat, A.; Kouta, R.; Chamoret, D. Study of the effect of mechanical uncertainties parameters on performance of PEMFC by coupling a 3D numerical multiphysics model and design of experiment. Int. J. Hydrogen Energy 2022, 47, 23772–23786. [Google Scholar] [CrossRef]
  26. Yin, C.; Cao, J.; Tang, Q.; Su, Y.; Wang, R.; Li, K.; Tang, H. Study of internal performance of commercial-size fuel cell stack with 3D multi-physical model and high resolution current mapping. Appl. Energy 2022, 323, 119567. [Google Scholar] [CrossRef]
  27. Bai, F.; Quan, H.; Yin, R.-J.; Zhang, Z.; Jin, S.-Q.; He, P.; Mu, Y.-T.; Gong, X.-M.; Tao, W.-Q. Three-dimensional multi-field digital twin technology for proton exchange membrane fuel cells. Appl. Energy 2022, 324, 119763. [Google Scholar] [CrossRef]
  28. Fu, X.; Wen, Q.; Han, J.; Wei, J.; Li, Y.; Ning, F.; Zhou, X. One-step to prepare high-performance gas diffusion layer (GDL) with three different functional layers for proton exchange membrane fuel cells (PEMFCs). Int. J. Hydrogen Energy 2022, 47, 25769–25779. [Google Scholar] [CrossRef]
  29. Prince Abraham, B.; Kalidasa Murugavel, K. Influence of Catalyst Layer and Gas Diffusion Layer Porosity in Proton Exchange Membrane Fuel Cell Performance. Electrochim. Acta 2021, 389, 138793. [Google Scholar]
  30. Son, J.; Um, S.; Kim, Y.-B. Numerical analysis of the effect of anisotropic gas diffusion layer permeability on polymer electrolyte membrane fuel cell performance with various channel types. Fuel 2021, 289, 119888. [Google Scholar] [CrossRef]
  31. Toghyani, S.; Moradi Nafchi, F.; Afshari, E.; Hasanpour, K.; Baniasadi, E.; Atyabi, S.A. Thermal and electrochemical performance analysis of a proton exchange membrane fuel cell under assembly force on gas diffusion layer. Int. J. Hydrogen Energy 2018, 43, 4534–4545. [Google Scholar] [CrossRef]
  32. Shi, L.; Xu, S.; Liu, J. Influences of assembly force and flow channel size on performances of proton exchange membrane fuel cells based on a multi-model. Int. J. Hydrogen Energy 2022, 47, 7902–7914. [Google Scholar] [CrossRef]
  33. Kerkoub, Y.; Benzaoui, A.; Haddad, F.; Ziari, Y.K. Channel to rib width ratio influence with various flow field designs on performance of PEM fuel cell. Energy Convers. Manag. 2018, 174, 260–275. [Google Scholar] [CrossRef]
  34. Carcadea, E.; Ismail, M.S.; Bin Ingham, D.; Patularu, L.; Schitea, D.; Marinoiu, A.; Ion-Ebrasu, D.; Mocanu, D.; Varlam, M. Effects of geometrical dimensions of flow channels of a large-active-area PEM fuel cell: A CFD study. Int. J. Hydrogen Energy 2021, 46, 13572–13582. [Google Scholar] [CrossRef]
  35. Azarafza, A.; Ismail, M.S.; Rezakazemi, M.; Pourkashanian, M. Comparative study of conventional and unconventional designs of cathode flow fields in PEM fuel cell. Renew. Sustain. Energy Rev. 2019, 116, 350–366. [Google Scholar] [CrossRef]
  36. Zhou, P.; Wu, C.W.; Ma, G.J. Contact resistance prediction and structure optimization of bipolar plates. J. Power Sources 2006, 159, 1115–1122. [Google Scholar] [CrossRef]
Figure 1. 3-D single PEMFC performance model and its cross-sectional shape.
Sustainability 14 14416 g001
Figure 2. The force-temperature coupled 2-D model with loads and constraints (1 and 2 refer to the positions of the applied symmetric constraint , respectively).
Sustainability 14 14416 g002
Figure 3. BPP and GDL deformation of the force-temperature model.
Sustainability 14 14416 g003
Figure 4. Internal operating temperature distribution in the fuel cell.
Sustainability 14 14416 g004
Figure 5. Water content in the fuel cell with different operating temperatures.
Sustainability 14 14416 g005
Figure 6. Hydrogen concentration in the fuel cell with different operating temperatures.
Sustainability 14 14416 g006
Figure 7. Oxygen concentration in the fuel cell with different operating temperatures.
Sustainability 14 14416 g007
Figure 8. Average and maximum current density distribution of the cross section along the flow channel with different operating temperatures: (a) average; (b) maximum.
Sustainability 14 14416 g008
Figure 9. Operating temperature in the fuel cell with different hydrogen/air stoichiometry ratios.
Sustainability 14 14416 g009
Figure 10. Water content along the flow channel in the fuel cell with different hydrogen/air stoichiometry ratios.
Sustainability 14 14416 g010
Figure 11. Hydrogen concentration along the flow channel in the fuel cell with different hydrogen/air stoichiometry ratios.
Sustainability 14 14416 g011
Figure 12. Oxygen concentration along the flow channel in the fuel cell with different hydrogen/air stoichiometry ratios.
Sustainability 14 14416 g012
Figure 13. Average and maximum current density of the cross section along the flow channel with different hydrogen/air stoichiometry ratios: (a) average; (b) maximum.
Sustainability 14 14416 g013
Figure 14. Operating temperature in the fuel cell with different hydrogen/air relative humidity.
Sustainability 14 14416 g014
Figure 15. Water content in the fuel cell with different hydrogen/air relative humidity.
Sustainability 14 14416 g015
Figure 16. Hydrogen concentration in the fuel cell with different hydrogen/air relative humidity.
Sustainability 14 14416 g016
Figure 17. Oxygen concentration in the fuel cell with different hydrogen/air relative humidity.
Sustainability 14 14416 g017
Figure 18. Average and maximum current density of the cross section along the flow channel with different hydrogen/air relative humidity: (a) average; (b) maximum.
Sustainability 14 14416 g018
Table 1. Dimensions of each component of the model.
ComponentHeight/mmWidth/mmLength/mm
Anode BPP0.82317
Cathode BPP1.22317
Flow Channel0.41.2317
GDL0.252317
CL0.0082317
PEM0.0252317
Table 2. Material properties of the GDL.
Material PropertiesValueUnits
coefficient of linear expansion1.7 a10−6·K−1
22 b
thermal conductivity15 aW·m−1 K−1
−0.8 b
elastic modulus6.13MPa
Poisson’s ratio0.09
specific heat capacity711.76J·kg−1·K−1
density450Kg·m−3
* The subscript a and b represent vertical to fiber direction and parallel to the fiber direction, respectively.
Table 3. Conservation equations of PEMFC model.
EquationDescription *
mass conservation equation [33] ε ρ t + ε ρ u ¯ = S m
S m ,   a = M H 2 2 F i a v   and   S m ,   c = M H 2 O 2 F i c v     M O 2 4 F i c v
momentum conservation equation [33] u ¯ ε ρ t + u ¯ u ¯ ε ρ = P ε + ε μ u ¯ + S u
energy conservation equation [33] ρ ε c k T t + ρ u ¯ ε c k T = k eff T + S Q
the Butler–Volmer equation [34] S a = j ref ,   a   C H 2 C ref ,   H 2 γ a e α a F η a RT     e α a F η a RT
S c = j ref ,   c   C O 2 C ref ,   O 2 γ c e α c F η c RT     e α c F η c RT
current conservation equation [34] σ s ϕ s + S i ,   s = 0   and   σ m ϕ m + S i ,   m = 0
diffusion equation in the porous zone [35] D k = ε 1 s b D k 0 P 0 P γ T T 0 1 . 5
* The subscript a , c represents the anode and cathode; k represents one of O 2 , N 2 , H 2 and H 2 O ; s , m represents the solid phase and membrane phase.
Table 4. Description of the parameters in conservation equations.
ParametersUnitsDescription
ε porosity
ρ kg∙m−3gas density
u ¯
S m
m∙s−1gas velocity
kmol∙m−3mass source term
M kg∙kmol−1molar mass
F C∙mol−1Faraday constant
i v A∙m−3volumetric current density
P Papressure
S u kg∙m−2∙s−1momentum source term
μPa∙sviscosity
c J∙kg−1K−1specific heat at constant pressure
T Ktemperature
k eff W∙m−1∙K−1effective thermal conductivity
S Q W∙m−3energy source term
ηVoverpotential
j ref A∙m−2reference exchange current density
C kmol∙m−3molar concentration
C ref kmol∙m−3reference molar concentration
γ concentration index
α charge transfer coefficient
σs∙m−1charge or electron conductivity
ϕVphase potential
S i A∙m−3current source term
s liquid water saturation
b liquid water saturation index
D m2∙s−1diffusion coefficient
D 0 m2∙s−1diffusion coefficient at T 0 and P 0
γ pressure index
T 0 Kreference temperature
P 0 Pareference pressure
кm−2viscous resistance in porous zone
Publisher’s Note: MDPI stays neutral with regard to jurisdictional claims in published maps and institutional affiliations.

