Abstract
Groundwater pollution in karst areas is often the result of the interaction of hydrogeological characteristics and human activities. In this study, a chimeric evaluation system of groundwater vulnerability and pollution load was constructed, and the groundwater contamination risk was intuitively displayed using a risk map. The study area is located in Qiannan, a typical karst area in Southwest China. Groundwater vulnerability was mainly calculated using the PLEIK model. Pollution source load evaluation was evaluated using the classification method. The groundwater pollution status was evaluated by the CCME WQI method. The results show that the groundwater vulnerability in the research area was mainly at a medium level. The areas with high pollution load values were mainly distributed in industrial parks and other pollution-source-gathering areas. The results of the water quality evaluation show that the groundwater quality in the study area was generally good. However, the impact of some pollution sources on the surrounding groundwater still cannot be ignored. The results reveal the risk level of groundwater pollution in typical karst areas and provide theoretical support for regional groundwater protection.
1. Introduction
The prevention of groundwater pollution incidents is usually easier than groundwater pollution remediation. According to statistics, groundwater in karst areas supplies 25% of the world’s population [1,2]. Therefore, when groundwater pollution events occur, karst areas often produce a large range of contamination due to the rapid movement of groundwater [3,4,5,6]. The study of regional groundwater contamination risk can provide basic information for groundwater environmental protection and management in karst areas. However, determining the risk of groundwater contamination in karst areas remains a challenge due to the heterogeneous nature of groundwater in karst areas [7,8,9]. Therefore, it is an important research topic to deeply explore the groundwater pollution risk in karst areas and put forward groundwater protection strategies on the basis of existing research to promote the sustainable utilization of groundwater resources in karst areas.
In 1968, Margat first proposed the term “vulnerability of groundwater to contamination” [10,11]. This became the beginning of the study of the risk of groundwater contamination. Traditional groundwater pollution risk usually includes (1) groundwater vulnerability assessment; (2) assessment of regional groundwater pollution sources; and (3) assessment of groundwater pollution status [12,13,14]. EPIK, developed by Doerfliger et al. (1999), is the first tool to quantify the vulnerability of karst aquifers [15]. Gogu and Dass et al. (2000) demonstrated the EPIK method and believed that this method was suitable for groundwater vulnerability assessment in large areas [16]. Following the EPIK method, European scholars developed a variety of methods for assessing European groundwater vulnerability under the COST620 framework, such as COP [17], PI [18], and VULK [19]. The effectiveness of these methods has also been confirmed in multiple regional practices. On the basis of the EPIK method, the Chinese scholars Zou et al. (2014) proposed the PLEIK method, considering land-use type factors comprehensively [20]. The PLEIK method has shown high operability and applicability in typical karst areas such as Guangxi [13], Guangdong [21], Sichuan [22], and Hunan [23] in China. Zhu et al. verified the accuracy of the PLEIK method using the geographical detector method, and the results showed that the PLEIK method had certain explanatory power for groundwater pollution risk [13].
The evaluation of groundwater pollution sources mainly includes classification and discrimination methods, the pollution risk index method, and the priority order method [24,25]. That is, the possible pollution of different pollution sources is evaluated qualitatively or quantitatively according to their characteristics. Although the methods of groundwater vulnerability assessment and groundwater pollution source assessment are relatively mature, there is still a lack of research on groundwater contamination risk assessment by combining these methods.
Because of its unique hydrogeological structure, karst areas have been widely studied by scholars from all walks of life [26,27,28]. However, groundwater pollution risk is not only caused by groundwater vulnerability, and groundwater pollution risk is closely related to human activities [29]. In some areas with high groundwater vulnerability, there may be no human activity, so the risk of groundwater pollution is relatively low. In order to truly reflect the current situation of groundwater contamination risk in karst areas, this study highlights the importance of groundwater pollution sources on the basis of groundwater vulnerability research, integrates hydrogeological characteristics and human impacts, and realizes multi-factor embedded groundwater pollution risk analysis. Finally, the risk of groundwater pollution is presented in the form of a risk map. It provides a strong basis for the formulation of regional groundwater environmental protection policies and regulations.
Characteristics of Study Area
The total area of the research area is 26,197 km2, the terrain is high in the northwest and low in the southeast, the overall elevation is between 201 m and 1912 m, and the average elevation is 997 m. The research area has typical karst landform features, such as underground dark river skylights and funnels in peak forest and peak cluster depression. The research area is affected by topography and rainfall, and there are many rivers in the area. At the same time, some rivers run through valleys and caves, and there is a strong exchange between surface water and groundwater. The research area is located in the East Asian monsoon zone, where the climate types are diverse and the climate characteristics are significantly affected by regional and topographic factors, which makes the regional and vertical differences of regional climate change obvious. The average annual rainfall in the research area is 1189.4 mm, the average annual temperature is between 13.6 and 19.6, and the average annual frost-free period is 292 days.
2. Materials and Methods
2.1. Data Sources of Research
Groundwater vulnerability was studied based on a 1:20,000 integrated hydrogeological map, 50 m resolution raster data of land use, and 50 m resolution elevation raster data as well as many pieces of regional literature (Table S1). The pollution source load assessment was mainly based on the pollution source information obtained from the survey of pollution sources. A total of 986 pollution sources were collected; the types of pollution sources included industrial parks, industrial enterprises, mining areas, hazardous waste disposal sites, landfills, large-scale farms, gas stations, and agricultural non-point source pollution.
From September to October 2020, on the basis of regional control and representativeness, groundwater sampling sites were laid (Figure 1), taking into account factors such as aquifer type, groundwater flow direction, contaminant transport, fissure and karst conduit distribution. A total of 218 groundwater samples were collected. These samples cover all hydrogeological units in the study area.
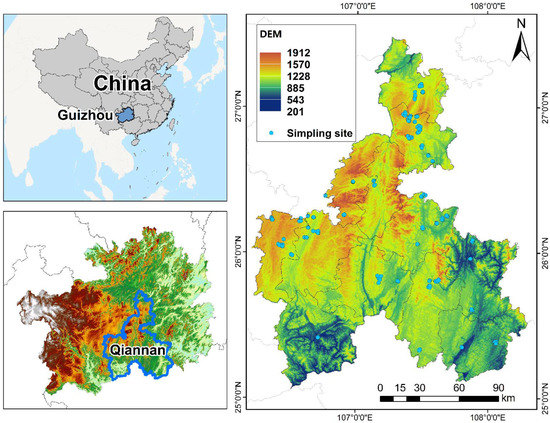
Figure 1.
Distribution of topography and groundwater sampling sites in study area.
Groundwater samples were stored in ice boxes at 4 °C and tested in the laboratory. Detailed information about the analysis procedure was provided elsewhere [19]. A total of 46 indicators were tested, as shown in Table S2.
2.2. Groundwater Vulnerability Assessment
The PLEIK method is mainly carried out by systematic mapping of the following parameters: protective cover (P), land use (L), epikarst development (E), recharge condition (I) and karst development (K) [20]. Weighted superposition of these five indicators is carried out to obtain regional groundwater vulnerability, and the formula is as follows:
GV = αPR + βLR + γER + δIR + εKR
α, β, γ, δ and ε are the weight coefficients, 0.29, 0.24, 0.20, 0.16 and 0.11, respectively. All PLEIK plots and thematic maps were analyzed and edited using ArcGIS 10.8. All results were processed in a grid format, and the GV value was calculated using a grid computing tool. The coordinate system used was the universal transverse Mercator projection, datum Xian1980, in meters.
Factor P mainly refers to the thickness of the soil layer above the aquifer. Due to the thickness, structure, cation exchange capacity (CEC) content, water content and water conductivity of the soil, it has a strong attenuation ability to pollutants [30]. The evaluation matrix was constructed with soil thickness and CEC content (Table S1). Due to the large area of the study area, using traditional methods to measure soil thickness has high uncertainty. Therefore, soil thickness was calculated based on land use types, and CEC content was calculated with reference to the World Soil Database.
Factor L mainly considers land use types. Intensification of human activities is the main factor leading to environmental deterioration [31], and is scored according to the degree of protection of groundwater for different land use types (Table S1).
Factor E is mainly affected by lithology, rock structure, structure and other factors [32]. The lithology of aquifer determines the possible development degree of dissolution fractures in the aquifer. Therefore, the lithology of aquifer is taken as the main evaluation parameter of factor E (Table S1). The score of factor E mainly depends on the lithology description of surface karst zone in a 1:20,000 comprehensive hydrogeological map.
Factor I is mainly affected by infiltration intensity. Groundwater recharge is relatively large in areas with high infiltration intensity, and pollutants are more likely to enter groundwater. The rainfall infiltration in karst areas is mainly concentrated infiltration and dispersed infiltration controlled by sinkholes. Dispersed infiltration is closely related to land use type. [33]. Meanwhile, scattered infiltration is closely related to land use types, and the evaluation matrix was constructed to evaluate factor I from these two aspects (Table S1).
Factor K mainly refers to the development intensity of dissolution pores with a diameter over 10 mm [34]. Since it is difficult to obtain the distribution and development data of dissolution pores, groundwater runoff modulus was used to evaluate factor E (Table S1). The score of Factor K is mainly based on the description of the groundwater runoff modulus of the aquifer in the 1:20,000 comprehensive hydrogeological map.
2.3. Pollution Loading Assessment
Groundwater vulnerability can reflect the pollution tolerance of aquifer itself, but it cannot fully reflect the impact of human activities on groundwater. The pollution loading assessment of pollution sources can effectively reflect the impact of human activities on groundwater, which is a powerful supplement to the assessment of groundwater vulnerability [35,36]. The calculation formula is as follows:
where Pi is the load index of the ith potential pollution source, Ti is the pollutant toxicity, Li is the pollutant release possibility, Qi is the pollutant release possibility, Pi is the comprehensive pollution load index, and Wi is the weight of Pi. The higher the Pi value, the greater the pollution load in this area.
The main consideration factors of Ti are the pollution characteristics of toxic pollutants, according to different industry categories and assigned points (Table S4). The main consideration factor of Li is the possibility of different pollution sources releasing pollutants. At the same time, different characteristics set different evaluation criteria for assigning points to pollution sources (Table S5). Major Li sources may consider different release quantities of pollutants. At the same time, different evaluation criteria are set for different pollution sources according to their industry characteristics to assign points (Table S6). The buffer radius is the range that the pollution sources may affect. The evaluation range of each pollution source was determined and assigned points by setting the buffer radius (Table S4). Evaluation criteria for groundwater pollution load are shown in Table 1.

Table 1.
Evaluation standard of groundwater pollution load.
2.4. Groundwater Quality Assessment
CCME WQI is a water quality evaluation method. The water quality status is directly reflected by the three aspects of comprehensive over-standard index quantity percentage, over-standard monitoring quantity percentage and monitoring value over-standard range. The CCME WQI method has strong advantages in application flexibility, intuitiveness and fault tolerance [37]. The evaluation results of the CCME WQI evaluation method are more strict than those of the single factor index and Nemerow index evaluation methods, and can avoid too-loose evaluation results due to having too many indexes.
In the equation above, F1 is the percentage that does not meet the standard limit index at least once, F2 is the percentage of the field sample that does not meet the standard limit, and F3 is the average excess multiple of each sample. The Class III Groundwater Standard (BT 14848e2017) was used as the standard limit index. The 46 indicators in 218 groups of water samples were evaluated by CCME WQI. The ArcGIS Kriging interpolation method was used to interpolate the evaluation results. The CCME WQI classification standard is shown in Table 2.
Table 2.
Evaluation standard of CCME WQI.
2.5. Groundwater Contamination Risk
The risk of groundwater pollution is the possibility of groundwater being affected by human influence. The possibility of groundwater pollution events is mainly affected by human activities and hydrogeological characteristics. The groundwater vulnerability assessment represents the intrinsic characteristics of the aquifer, and the pollution load represents the potential pollution caused by human activities. Using the spatial mapping characteristics of ArcGIS, the groundwater vulnerability and pollution load results were multiplied by a grid calculator [13]:
In the formula, GRI stands for groundwater contamination risk, GV stands for comprehensive vulnerability index, and PL stands for pollution source load index. Therefore, the results of GRI are divided into 5 grades of very high, high, medium, low and very low by the natural discontinuous point method in ArcGIS.
3. Results and Discussion
3.1. Groundwater Vulnerability Maps
According to the judgment of land use types, the soil thickness of cultivated land and grassland in the study area was mostly between 100~150 cm, and the soil thickness of forest land was between 20~100 cm. Due to the special geographical environment, most of the towns in the study area are distributed in mountain basins and valleys, so the soil thickness around towns was more than 150 cm. A larger soil thickness means that pollutants are less likely to enter groundwater. At the same time, the larger soil CEC content also indicates that the soil had stronger degradation ability for pollutants. The soil CEC content in the central and southern parts of the study area was between 10 and 100 (meq/100 g). CEC content was <10 (meq/100 g) in the western part of the southern study area. Therefore, the high value area of element P was mainly concentrated in the south (Figure 2a).
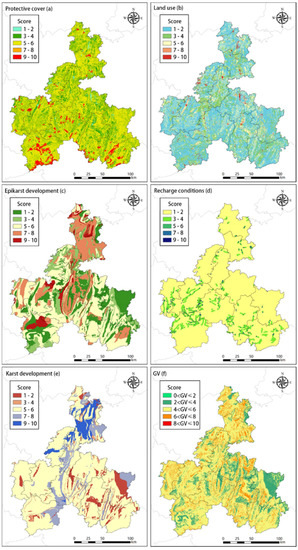
Figure 2.
Maps of PLEIK factor and groundwater vulnerabilities.
From the perspective of land use types in the research area, forestland and arable land were absolutely dominant, with the largest area of forestland shown in Figure 2b. Forest land is distributed throughout the study area, accounting for 39.5% of the total area of the study area. The areas with high score of factor L were mainly urban land-use areas with scattered distribution as shown in Figure 2b. The score of factor L was mainly between 1 and 4, indicating that the land use level in the research area has no obvious impact on groundwater.
The areas with high development intensity of epikarst zone were mainly distributed in the middle and north of the study area. Areas with larger limestone thickness often have more dissolution pores, which makes it easier for pollutants to reach the groundwater and produce pollution. Therefore, the regions with a high factor E score in Figure 2c were mainly concentrated in the middle and north of the research area. It can be seen that the epikarst development in the north of the research area was relatively strong, which has a great impact on the groundwater vulnerability intensity in the north of the research area.
Aven skylight karst conduits and underground rivers in the research area were mainly distributed in the southwest and south of the research area. Precipitation was the main recharge source of research area groundwater. The annual average daily maximum precipitation in the study area was greater than 25 mm. Rainfall is more likely to converge on aquifers in the distribution areas of falling water and underground rivers. Therefore, the factor I score was higher in these areas (Figure 2d).
The regions with large groundwater runoff modulus were mainly distributed in the middle and north of the research area. The development of the karst network is analyzed by the size of groundwater runoff modulus in different strata. The development of karst network is similar to the development intensity of surface karst, which is obviously affected by lithology. In a region with high groundwater runoff modulus, it is easy to discharge and spread pollutants. The karst network in the southeast was relatively poorly developed, and the formation had relatively good anti-pollution ability. The karst network was most developed in the middle and north of the research area, so the K score of elements in this part of the region was high (Figure 2e).
After comprehensive assessment, the results of the groundwater vulnerability assessment in research area are shown in Figure 2f. The area of very high vulnerability was 0.85 km2, accounting for 0.003% of the total research area; the area of high vulnerability was 1382.92 km2, accounting for 5.27% of the total research area; the medium vulnerability area was 15,310.13 km2, accounting for 58.44% of the total research area; the low vulnerability area was 9461.39 km2, accounting for 36.12% of the total research area; and the very low vulnerability area was 42.06 km2, accounting for 0.16% of the total research area.
It can be seen from the results that the groundwater vulnerability score in the study area was mainly concentrated between 4–6, which is mainly related to the strong development of epikarst and karst in the study area. The increase of these two factors increased the overall score of the study area. At the same time, it can be noted that the groundwater vulnerability score of sinkhole, skylight and underground river areas was high, and these areas were scattered. It is worth noting that the groundwater type in the southwest of the study area was bedrock fissure water, which makes the groundwater vulnerability in this area low.
3.2. Pollution Loading Maps
The number of industrial parks in the study area was large, and some parks belong to the chemical industry park, making the pollution load score higher, as shown in Figure 3a. Industrial pollution sources are affected by regional mountainous terrain and the enterprise factory area concentrated in the flat terrain area. Therefore, the northern enterprises’ gathered pollution load value increased, as shown in Figure 3b. The scattered pollution load level of mine explorations, landfills, hazardous waste disposal sites and intensive live-stock farms was low. The total number of gas stations in the study area was 223, which is the largest number of pollution sources. Due to the progress of social development in the study area, the transportation system gradually improved. This makes the number of tanks in some gas stations larger and the load score higher (Figure 3g).
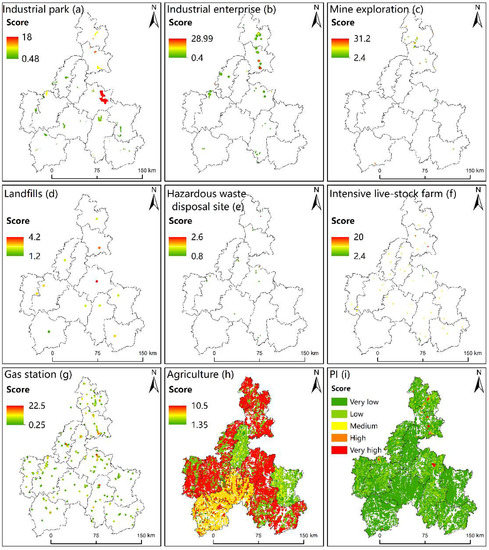
Figure 3.
Maps of pollution loading factors and pollution loading.
The generation of high load area is related to the high density of groundwater pollution sources, and the dense distribution of enterprises may lead to groundwater pollution incidents (Figure 3i). Due to the influence of karst topography in the study area, most of the groundwater-polluting enterprises were located in the inter-mountain valleys area, which makes the load value in some areas relatively high, while the pollution load value in the vast mountainous area of research area was at the low and very low levels. Therefore, the research area should pay attention to the planning and construction of industrial clusters, so as to avoid a large number of enterprises gathering in a small area, which will cause a higher risk of groundwater contamination.
The very-high-load area of the study area was 97.33 km2, accounting for 0.37% of the total evaluation area, including 44 groundwater pollution enterprises, mainly in the northern and central part of the study area. The high-load area was 38.45 km2, accounting for 0.15% of the total evaluation area. The medium-load area was 90.16 km2, accounting for 0.34% of the total evaluation area. The low-load area was 3808.17 km2, accounting for 14.54% of the total evaluation area. The very-low-load area was 17,759.33 km2, accounting for 67.79% of the total evaluation area. Due to the unique karst mountainous landform in the study area, most of the areas are not suitable for enterprises to locate and build factories, which makes the pollution load level in most areas low, being the main reason for the low and very low pollution load level in most areas of the study area. There is a distribution of phosphate rock resources in the northern part of the study area, so there are a large number of phosphate rock processing enterprises in the northern region. The distribution and aggregation of chemical enterprises was the main reason for the increase of load value in this area.
3.3. Groundwater Quality Status Map
The groundwater around the industrial agglomeration area sampled in this study was polluted to varying degrees, and the groundwater all had TP and Pb exceeding standards. The TP of 33.3% of the monitoring points around the industrial agglomeration area exceeded the standard of Class III, and the Pb of 45.8% of the monitoring points exceeded the standard of Class III. In some industrial agglomeration areas, fluoride, iodide, NO3−, NO2−, NH4+, CODMn, Mn, Hg and other indicators exceeded standards, and the overall water quality was poor. The overall quality of the surrounding groundwater environment in the mining area was generally good. Heavy metal indicators of serious pollution include Fe, Mn and Sb. Among them, the excess of Fe and Sb may be due to the influence of mining in the mining area, while the excess of Mn requires further investigation and discussion. Ammonia nitrogen, Pb, Mn and Ni exceeded standards in most of the surrounding hazardous waste disposal sites.
The groundwater in the study area was not seriously polluted. Among the 218 sampling points, 124 points had no pollution level and 56 points were at a good level. The marginal and poor areas were mainly distributed in the west and north where the groundwater vulnerability was high (Figure 4). This pollution is related to groundwater pollution sources such as hazardous waste disposal sites and large-scale aquaculture farms in the surrounding industrial agglomeration areas. However, in the western part of the study area, the load value is lower and the groundwater quality is poor. This shows that the pollution load value cannot be used as the only index to judge the possibility of pollution events, and groundwater quality monitoring is also necessary.
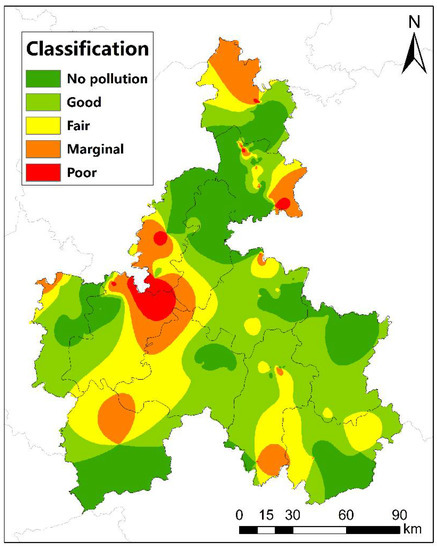
Figure 4.
Present situation of groundwater quality in study area.
3.4. Groundwater Contamination Risk
The groundwater in the research area was generally at low contamination levels. The area with low prevention and control value was the largest, accounting for 11,002.74 km2, 42% of the total research area; the area with lower prevention and control value was the second largest, 8906.98 km2, accounting for 18,906.98 km2 of the total southern research area (34%); the area with high prevention and control value was small, 130.985 km2, accounting for 0.5% of the total southern research area (Figure 5).
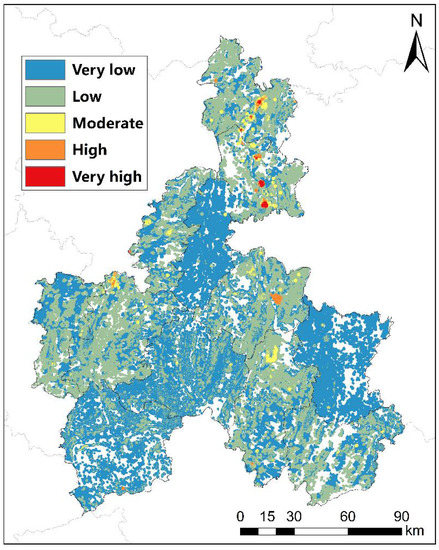
Figure 5.
Map of groundwater contamination risk.
The groundwater prevention and control value in the research area was relatively high, and the areas with high prevention and control value were mainly distributed in the northern and central parts. The large area of high prevention and control value in the north was mainly due to the high vulnerability of regional groundwater, and the aggregation of more enterprises in the region made the regional groundwater pollution source load value higher, making the area with high prevention and control value larger. The large area of high prevention and control value in the middle was mainly due to the influence of high regional load value. At the same time, in most areas where groundwater pollution sources do not exist, the aquifer is not threatened by pollution sources, and the possibility of groundwater pollution incidents is generally low.
3.5. Limitations
The scale of basic data used in the groundwater vulnerability assessment in this research was 1:200,000, which can effectively reflect the variation of groundwater vulnerability in a large area. However, due to the limitation of data accuracy, the vulnerability assessment in a small area may be biased. In addition, a large amount of groundwater pollution source information has been collected in this study. However, this research still cannot guarantee that all potential groundwater pollution sources are listed. However, with the current accuracy, the data used in this study can fully reflect the risk of regional groundwater pollution and provide a strong basis for regional water environment protection.
4. Conclusions
In this study, based on the data of hydrogeology and groundwater pollution sources, the PLEIK model and pollution source classification method were used to evaluate the groundwater vulnerability and pollution source load in the study area. The groundwater vulnerability assessment comprehensively considers the regional hydrogeological characteristics, and highlights the impact of karst development intensity and land use types on groundwater vulnerability. The groundwater vulnerability in the study area was at a medium level, and the medium vulnerability accounts for 58.44% of the total area of the study area. The development intensity of the surface karst zone and karst network is the main factor controlling groundwater vulnerability in karst area. On the other hand, the pollution load assessment also reflects the impact of various types of pollution sources on groundwater. The risk of groundwater pollution is greater in areas with various types of pollution sources. Among the 218 sampling points, 124 points had no pollution level and 56 points were at a good level. In general, there was no large area of groundwater pollution distribution in the high groundwater vulnerability area of the study area, which made the possibility of groundwater pollution events generally low. However, the groundwater contamination risk was higher in areas with dense pollution sources, which is significantly different from the surrounding areas. Therefore, in future environmental protection, work should focus on controlling the distribution of pollution-source-dense areas.
Supplementary Materials
The following supporting information can be downloaded at: https://www.mdpi.com/article/10.3390/su142114483/s1, Table S1, sources of research data; Table S2, test method and test items; Table S3, groundwater vulnerability assessment table; Table S4, classification standard for toxicity of five pollution sources; Table S5, classification standard for likelihood of release for five pollution sources; Table S6, classification standard for potential release quantity of five pollution sources; Table S7, the weights of different types of pollution sources. Ref. [38] is cited in supplementary materials.
Author Contributions
Conceptualization, J.W. and Y.X.; methodology, J.W.; software, J.L.; validation, J.L. and S.R.; formal analysis, J.L.; investigation, Y.X.; resources, Y.X.; data curation, Y.X.; writing—original draft preparation, J.L.; writing—review and editing, J.W.; visualization, S.R.; supervision, Y.T.; project administration, Y.T.; funding acquisition, Y.X. All authors have read and agreed to the published version of the manuscript.
Funding
This research received no external funding.
Institutional Review Board Statement
Not applicable.
Informed Consent Statement
Informed consent was obtained from all subjects involved in the study.
Conflicts of Interest
The authors declare no conflict of interest.
References
- Musgrove, M.; Solder, J.; Opsahl, S.; Wilson, J. Timescales of water-quality change in a karst aquifer, south-central Texas. J. Hydrol. X 2019, 4, 100041. [Google Scholar] [CrossRef]
- Ford, D.; Williams, P. Karst Hydrogeology and Geomorphology; John Wiley and Sons Ltd.: West Sussex, UK, 2019; p. 562. ISBN 978-0-470-84996-5. [Google Scholar]
- Ghasemizadeh, R.; Hellweger, F.; Butscher, C.; Padilla, I.; Vesper, D.; Field, M.; Alshawabkeh, A. Review: Groundwater flow and transport modeling of karst aquifers, with particular reference to the North Coast Limestone aquifer system of Puerto Rico. Hydrogeol. J. 2012, 20, 1441–1461. [Google Scholar] [CrossRef] [PubMed]
- Xu, Z.; Hu, B.X.; Davis, H.; Cao, J. Simulating long term nitrate-N contamination processes in the Woodville Karst Plain using CFPv2 with UMT3D. J. Hydrol. 2015, 524, 72–88. [Google Scholar] [CrossRef]
- Hartmann, A.; Jasechko, S.; Filippini, M.; Garvelmann, J.; Goldscheider, N.; Kralik, M.; Kunstmann, H.; Ladouche, B.; Lange, J.; Lucianetti, G.; et al. Risk of groundwater contamination widely underestimated because of fast flow into aquifers. Proc. Natl. Acad. Sci. USA 2021, 118, e2024492118. [Google Scholar] [CrossRef]
- Kalhor, K.; Ghasemizadeh, R.; Rajic, L.; Alshawabkeh, A. Assessment of groundwater quality and remediation in karst aquifers: A review. Groundw. Sustain. Dev. 2019, 8, 104–121. [Google Scholar] [CrossRef] [PubMed]
- Wang, Z.; Guo, X.; Kuang, Y.; Chen, Q.; Luo, M.; Zhou, H. Recharge sources and hydrogeochemical evolution of groundwater in a heterogeneous karst water system in Hubei Province, Central China. Appl. Geochem. 2021, 136, 105165. [Google Scholar] [CrossRef]
- Zeng, C.; Liu, Z.; Yang, J.; Yang, R. A groundwater conceptual model and karst-related carbon sink for a glacierized alpine karst aquifer, Southwestern China. J. Hydrol. 2015, 529, 120–133. [Google Scholar] [CrossRef]
- Zhao, M.; Hu, Y.; Zeng, C.; Liu, Z.; Yang, R.; Chen, B. Effects of land cover on variations in stable hydrogen and oxygen isotopes in karst groundwater: A comparative study of three karst catchments in Guizhou Province, Southwest China. J. Hydrol. 2018, 565, 374–385. [Google Scholar] [CrossRef]
- Machiwal, D.; Jha, M.K.; Singh, V.P.; Mohan, C. Assessment and mapping of groundwater vulnerability to pollution: Current status and challenges. Earth-Sci. Rev. 2018, 185, 901–927. [Google Scholar] [CrossRef]
- Taghavi, N.; Niven, R.K.; Paull, D.J.; Kramer, M. Groundwater vulnerability assessment: A review including new statistical and hybrid methods. Sci. Total Environ. 2022, 822, 153486. [Google Scholar] [CrossRef]
- Zhang, Q.; Li, P.; Lyu, Q.; Ren, X.; He, S. Groundwater contamination risk assessment using a modified DRATICL model and pollution loading: A case study in the Guanzhong Basin of China. Chemosphere 2021, 291, 132695. [Google Scholar] [CrossRef] [PubMed]
- Zhu, Z.; Wang, J.; Hu, M.; Jia, L. Geographical detection of groundwater pollution vulnerability and hazard in karst areas of Guangxi Province, China. Environ. Pollut. 2018, 245, 627–633. [Google Scholar] [CrossRef] [PubMed]
- Hamdan, I.; Margane, A.; Ptak, T.; Wiegand, B.; Sauter, M. Groundwater vulnerability assessment for the karst aquifer of Tanour and Rasoun springs catchment area (NW-Jordan) using COP and EPIK intrinsic methods. Environ. Earth Sci. 2016, 75, 1474. [Google Scholar] [CrossRef]
- Doerfliger, N.; Jeannin, P.-Y.; Zwahlen, F. Water vulnerability assessment in karst environments: A new method of defining protection areas using a multi-attribute approach and GIS tools (EPIK method). Environ. Earth Sci. 1999, 39, 165–176. [Google Scholar] [CrossRef]
- Gogu, R.C.; Dassargues, A. Sensitivity analysis for the EPIK method of vulnerability assessment in a small karstic aquifer, southern Belgium. Appl. Hydrogeol. 2000, 8, 0337–0345. [Google Scholar] [CrossRef]
- Vías, J.M.; Andreo, B.; Perles, M.J.; Carrasco, F.; Vadillo, I.; Jiménez, P. Proposed method for groundwater vulnerability mapping in carbonate (karstic) aquifers: The COP method. Appl. Hydrogeol. 2006, 14, 912–925. [Google Scholar] [CrossRef]
- Goldscheider, N.; Klute, M.; Sturm, S.; Hötzl, H. The PI method—A GIS-based approach to mapping groundwater vulnerability with special consideration of karst aquifers. Z. Angew. Geol. 2000, 46, 157–166. [Google Scholar]
- Jeannin, P.Y.; Cornaton, F.; Zwahlen, F.; Perrochet, P. VULK: A tool for intrinsic vulnerability assessment and validation. In Proceedings of the 7th Conference on Limestone Hydrology and Fissured Media, Besancon, France, 20–22 September 2001; Volume 13, pp. 185–188. [Google Scholar]
- Zou, S.; Li, L.; Lu, H.; Liu, Q.; Su, C.; Zhu, D. Evaluation method of antifouling performance of karst groundwater system. Acta Geosci. Sin. 2014, 35, 262–268. [Google Scholar]
- Lu, S. Groundwater Antifouling Performance of PLEIK Model in Karst Area of Guangdong Applied Research in Evaluation. Ground Water 2019, 44, 20–22+58. [Google Scholar]
- Li, C.; Zhang, X.; Zhu, Z.; Mao, Y. Groundwater Vulnerability Assessment Based on PLEIK Model. Acta Geol. Sichuan 2016, 36, 638–640+645. [Google Scholar]
- Dai, C.; Li, H.; Pan, Z.; Zhao, J.; Huang, S. Comparison of the REKST model with pleik model in performing the antifouling analysis of karstic groundwater A case study in Xiangxi Dalongdong underground river. Carsologica Sin. 2015, 34, 354–361. [Google Scholar]
- Nobre, R.; Rotunno Filho, O.C.; Mansur, W.; Nobre, M.; Cosenza, C. Groundwater vulnerability and risk mapping using GIS, modeling and a fuzzy logic tool. J. Contam. Hydrol. 2007, 94, 277–292. [Google Scholar] [CrossRef] [PubMed]
- Kazakis, N.; Oikonomidis, D.; Voudouris, K.S. Groundwater vulnerability and pollution risk assessment with disparate models in karstic, porous, and fissured rock aquifers using remote sensing techniques and GIS in Anthemountas basin, Greece. Environ. Earth Sci. 2015, 74, 6199–6209. [Google Scholar] [CrossRef]
- Peng, H.; Yang, W.; Ferrer, A.S.N.; Xiong, S.; Li, X.; Niu, G.; Lu, T. Hydrochemical characteristics and health risk assessment of groundwater in karst areas of southwest China: A case study of Bama, Guangxi. J. Clean. Prod. 2022, 341, 130872. [Google Scholar] [CrossRef]
- Lv, Y.; Jiang, J.; Chen, L.; Hu, W.; Jiang, Y. Elaborate simulation and predication of the tunnel drainage effect on karst groundwater field and discharge based on Visual MODFLOW. J. Hydrol. 2022, 612, 128023. [Google Scholar] [CrossRef]
- Bakalowicz, M. Karst groundwater: A challenge for new resources. Hydrogeol. J. 2005, 13, 148–160. [Google Scholar] [CrossRef]
- Xiong, Y.; Liu, J.; Yuan, W.; Liu, W.; Ma, S.; Wang, Z.; Li, T.; Wang, Y.; Wu, J. Groundwater Contamination Risk Assessment Based on Groundwater Vulnerability and Pollution Loading: A Case Study of Typical Karst Areas in China. Sustainability 2022, 14, 9898. [Google Scholar] [CrossRef]
- Pereira, D.L.; Galvão, P.; Lucon, T.; Fujaco, M.A. Adapting the EPIK method to Brazilian Hydro(geo)logical context of the São Miguel watershed to assess karstic aquifer vulnerability to contamination. J. S. Am. Earth Sci. 2018, 90, 191–203. [Google Scholar] [CrossRef]
- Jiang, Y.; Zhang, C.; Yuan, D.; Zhang, G.; He, R. Impact of land use change on groundwater quality in a typical karst watershed of southwest China: A case study of the Xiaojiang watershed, Yunnan Province. Appl. Hydrogeol. 2008, 16, 727–735. [Google Scholar] [CrossRef]
- Perrin, J.; Jeannin, P.-Y.; Zwahlen, F. Epikarst storage in a karst aquifer: A conceptual model based on isotopic data, Milandre test site, Switzerland. J. Hydrol. 2003, 279, 106–124. [Google Scholar] [CrossRef]
- Şener, A.; Pekşen, E.; Yolcubal, I. Application of square array configuration and electrical resistivity tomography for characterization of the recharge area of a karst aquifer: A case study from Menekşe karst plateau (Kocaeli, Turkey). J. Appl. Geophys. 2021, 195, 104474. [Google Scholar] [CrossRef]
- Jakada, H.; Chen, Z.; Luo, Z.; Zhou, H.; Luo, M.; Ibrahim, A.; Tanko, N. Coupling intrinsic vulnerability mapping and tracer test for source vulnerability and risk assessment in a karst catchment based on EPIK method: A case study for the Xingshan County, Southern China. Arab. J. Sci. Eng. 2019, 44, 377–389. [Google Scholar] [CrossRef]
- Amin, M.M.; Veith, T.L.; Collick, A.S.; Karsten, H.D.; Buda, A.R. Simulating hydrological and nonpoint source pollution processes in a karst watershed: A variable source area hydrology model evaluation. Agric. Water Manag. 2017, 180, 212–223. [Google Scholar] [CrossRef]
- Xu, G.; Fan, H.; Oliver, D.M.; Dai, Y.; Li, H.; Shi, Y.; Long, H.; Xiong, K.; Zhao, Z. Decoding river pollution trends and their landscape determinants in an ecologically fragile karst basin using a machine learning model. Environ. Res. 2022, 214, 113843. [Google Scholar] [CrossRef] [PubMed]
- Kaur, M.; Das, S.K.; Sarma, K. Water quality assessment of Tal Chhapar Wildlife Sanctuary using water quality index (CCME WQI). Acta Ecol. Sin. 2021, 9. [Google Scholar] [CrossRef]
- Technical Guidelines for Environmental Impact Assessment Groundwater Environment. 2016. Available online: https://english.mee.gov.cn/Resources/standards/others1/Technical_Guideline_EIA/201603/t20160303_331190.shtml (accessed on 25 September 2022).


Publisher’s Note: MDPI stays neutral with regard to jurisdictional claims in published maps and institutional affiliations. |
© 2022 by the authors. Licensee MDPI, Basel, Switzerland. This article is an open access article distributed under the terms and conditions of the Creative Commons Attribution (CC BY) license (https://creativecommons.org/licenses/by/4.0/).