3.1. Physico-Chemical Characteristics of OMWs
Table 2 summarizes the results from the analysis of chemical analysis and physicochemical parameters of the wastewaters from the olive industries.
The studied OMWs effluents are very acidic with a pH below 7. The acidic pH of the regions studied varies between 4.63 and 5.15. W8 is the region with the lowest pH value of 3.8, while W10 shows a high pH value of around 5.1. These values are identical to those cited in the literature by Mekki et al. and Khoufi et al. [
20,
21], which are of the order of 4.8–4.5 and 4.10–4.5, respectively. Moreover, similar values were cited by El Moudden et al. (4.6) [
18]. However, the acidity of vegetable waters is linked to the duration of their storage in the basins. This can also be explained by polymerization and auto-oxidation reactions which convert phenolic alcohols into phenolic acids [
23,
24,
25]. These reactions are manifested by a change in the initial coloration of the vegetable waters to a very dark black color [
26].
Regarding conductivity, the ten regions marked variable values between 9.58 mS/cm and 20.7 mS/cm. The lowest conductivity value was attributed to the W8 region; this value is greater than that found by Paraskeva et al. (5 mS/cm) [
27], while the W9 and W10 regions showed a high value and close to the interval found by Sassi et al. [
28] (13 and 41 mS/cm).
The moisture content of this study showed very high percentages in all the regions studied, up to 76%, except the W2 region which showed a low value of around 46%. These results are in agreement with Kamal-eldine et al. [
29], who presented moisture percentages ranging from 83 to 92%, and also according to El Moudden et al., with a value of 91% [
18].
As for the dry matter, W2 and W9 had the highest content (53.87 and 23.3%) compared to the other OMWs studied. The latter presented percentages ranging from 6.5% to 23.33%. The values obtained are similar to those found by Kamal-eldine et al. (6–12%) [
29] and De Ursinos et al. [
30], showing that in the case of OMWs from the press, the dry matter is around 12%.
The lipid values presented a minority in the different regions studied; in particular, W7 and W9 showed the most significant value of 0.3%, followed by W3 and W6 with 0.2% and W1 with 0.1%, while the lowest lipid value is attributed to the W10 with 0.03%. These lipid contents are very low compared to the results found by Kamal-eldine et al. (0.5–2.3%) [
29].
The ten OMWs studied experienced a variation between 93 and 300 g O
2/L in chemical oxygen demand. W9 OMWs require a high oxygen concentration of 300 g O
2/L, while W6 requires a low COD of 93 g O
2/L. Research by Mouncif et al. has shown that OMWs generally have a very high organic and mineral load expressed by COD, with an average value varying between 100 and 430 g O
2/L for extraction by pressure [
31]. According to Al-Bsoul et al. [
32], the average organic matter COD content is around 51.25 g O
2/L. Our COD results are more or less in agreement with those found by Morillo et al. (200 g O
2/L) [
33], while the general release limit values in surface or groundwater are equal to 250 mg O
2/L.
3.2. Phytochemical Study
The TPC, TFC, and TTC were determined using gallic acid, quercetin, and catechin, respectively, as standard. These colorimetric methods are widely used in research for the quantification of different phenolic compounds and especially for the extracts of margins [
34,
35,
36,
37].
Table 3 shows the TPC, TFC, and TTC of various OMW, extracted with ethyl acetate solvent.
The various extracts of OMWs had relatively high values of phenolic compounds. The phenolic contents were in the range from 238.26 to 534.16 (mg GAE/g), flavonoids content was from 179.89 to 421.47 (mg QE/g), and finally, tannins were found from 39.66 to 106.28 (mg CE/g). OMWs W4 had the highest polyphenol value of 534.16 (mg GAE/g) while W6 had the lowest value of 238.26 (mg GAE/g). In addition, the latter shows a low flavonoid content (179.89 mg QE/g). OMW W1 showed a very high flavonoid content of around (421.47 mg QE/g) and tannin content of (106.28 mg CE/g). In comparison, the OMW (W8) offered low tannin content (39.66 mg CE/g).
Several studies have already used colorimetric assay methods to quantify the contents of polyphenols and flavonoids using the same tests that we adopted. These methods show the quantitative richness of the extracts by phenolic compounds of different natures. Indeed, using the Folin–Ciocâlteu method, Leouifoudi et al. [
35] showed that OMW extracts contain a high polyphenol content of 8.90 ± 0.728 g/L. Similar contents were found by El-Abbassi et al. [
37]. The semi-modern milling technique showed a higher phenolic content (9.8 g/L) compared to the modern milling technique (6.1 g/L). For Di Mauro et al. [
36], the values of total polyphenols were 5.20 ± 0.21 g/L gallic acid and the values of total flavonoids were 2.28 ± 0.23 g/L catechin using the colorimetric methods.
El Moudden et al. showed a polyphenol content of the order 431 mg GAE/g, this result is relatively in agreement with those obtained in this study [
18]. This content is much lower compared to the results obtained for the OMWs studied. El Moudden et al. found a total flavonoid content of around 115 mg QE/g for OMWs from the Moroccan Picholine olive variety [
18].
Posadino et al. [
8] investigated the identification and quantification by HPLC-DAD of the main phenolic compounds of ethyl acetate extracts and revealed hydroxytyrosol and tyrosol as major components followed by vanillic acid, caffeic acid, ferulic acid, apigenin-7-O-glucoside, oleuropein, and luteolin-7-O-glucoside.
The difference of the OMW phenolic amount and its antioxidant activities is influenced by several factors such as the olive oil extraction process, olive cultivar, the physicochemical feature of OMW samples, the storage conditions, and finally the fungal and bacterial flora existing in OMW [
38]. This high phenolic content gives the OMW, on the one hand, a phytotoxic effect, and on the other hand, an antimicrobial property [
39], which prevents their purification through biological means. Taking into account the antioxidant capacity of polyphenols, they can be used as natural antioxidants as a substitute for non-natural antioxidants to preserve edible oils from oxidation and give them a noticeable organoleptic quality [
40]. Flavonoids, the various and the largest group of natural phenolic compounds, are celebrated to have antioxidant, antimicrobial, antiallergic, anticarcinogenic, and anti-inflammatory properties [
41].
3.3. Free Radical Scavenging Activity DPPH and ABTS
Antioxidant activity by DPPH and ABTS has been performed for the OMWs extracts for a concentration region from 2.5 to 100 µg/mL (
Table 4).
All the extracts of the OMWs showed IC50 values of DPPH lower than that of the trolox of 2.96 µg/mL. These values prove that the extracts of OMWs have a better antioxidant power than that of the prepared standard. As for ABTS, the ten OMWs showed good antioxidant activity. The values obtained are all lower than that of the trolox (30.85 µg/mL). In particular, W1, W2, and W4 OMWs have the lowest values of IC50 for DPPH (0.32, 0.30 and 0.36 µg/mL) and for ABTS (2.04, 2.28 and 2.20 µg/mL) compared to the other OMWs studied.
The antioxidant IC
50 value of the polyphenols extracted from hydrolyzed olive leaves was 0.65 mg/L, which was related to its high hydroxytyrosol content (hydroxytyrosol: IC
50 = 0.58 mg/L) according to Bouaziz et al. [
41]. The IC
50 values our extracts, lead us propose that they have high content of hydroxytyrosol coming from the hydration of oleuropein.
Our results of the activity of scavenging free radicals by the phenolic extracts of OMWs (from the same variety of olive “Picholine Marocaine”) reinforce those found by [
15,
34,
35,
36,
37,
38]. All of these authors have shown the powerful antioxidant effect of phenolic extracts. The results of trapping of the DPPH radical reported by Sousa et al. are comparable to the trapping effect obtained by the BHA and alpha-tocopherol standards.
The phenolic extracts from OMW display a high antioxidant prospective; this is mainly attributed to the presence of polyphenols, which are known to be powerful free radical scavengers [
35,
36]. The results from our free radical scavenging assays using the OMW phenolic extracts are further confirmed by previous studies, where the powerful antioxidant effect of phenolic extracts is proven [
34,
35,
36,
37,
38,
39].
Phenolic acid extracts with ethyl acetate have the possibility to eliminate the DPPH radicals comparing to that of synthetic antioxidants. However, the result of the extraction of leaves using aqueous alkaline solutions show a high effect of trapping the free radicals [
34,
37], possibly because of a high concentration of hydroxytyrosol and oleuropein in these extracts.
3.5. Principal Component Analysis (PCA)
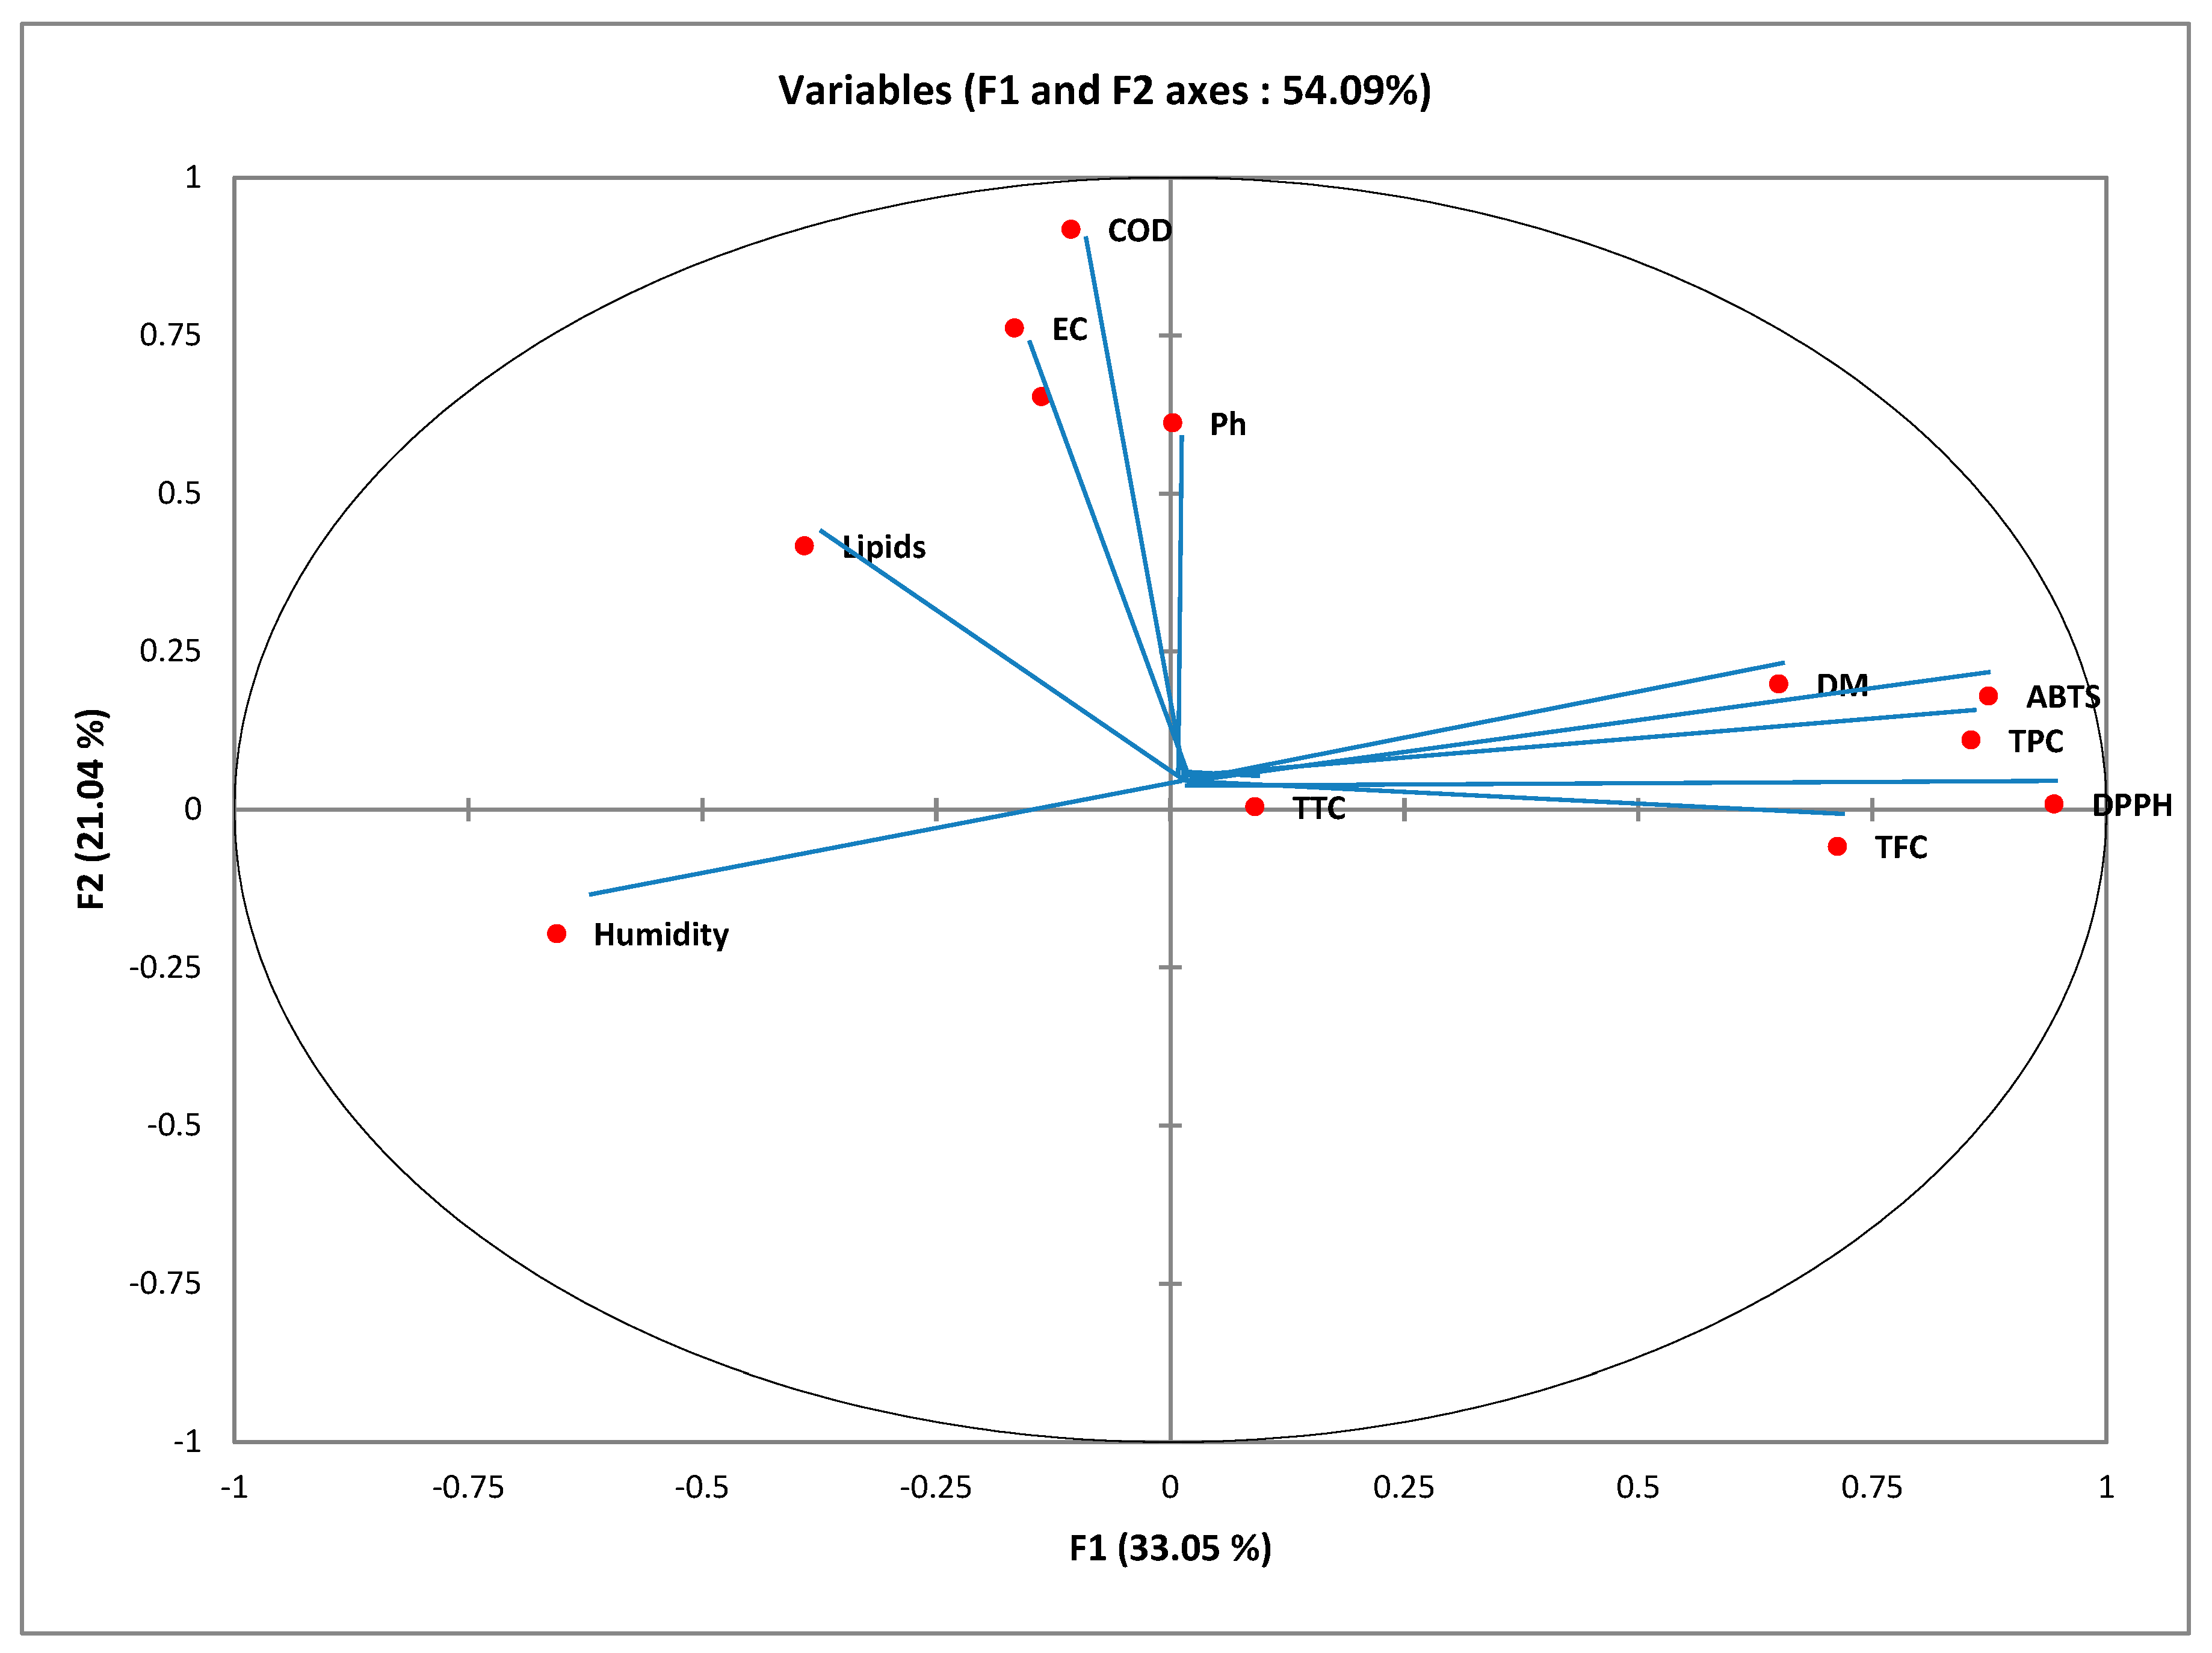
The different physico-chemical characteristics data and the results of the phytochemical content and antioxidant activity of OMWs are considered variables. They are projected by the PCA on the F1–F2 factorial plan (
Figure 1). The first main component (F1) and the second main component (F2) explain 33.05% and 21.04% of the total information, respectively. Moreover, the cumulative percentage of the two first principal components is 54.09%; accordingly, its linear combination is characteristic of the variables because it is more than 50%. Therefore, the first two axes are suitable for representing the information in general.
Figure 1 represent the plane formed by axes F1 and F2 giving the correlation between the variables. The F1 axis is principally constructed by the positive correlation between the TPC, TFC, DPPH, and ABTS and the negative correlation between humidity and DM. Axis F2 is formed by the positive correlation between pH and EC (
Figure 1).
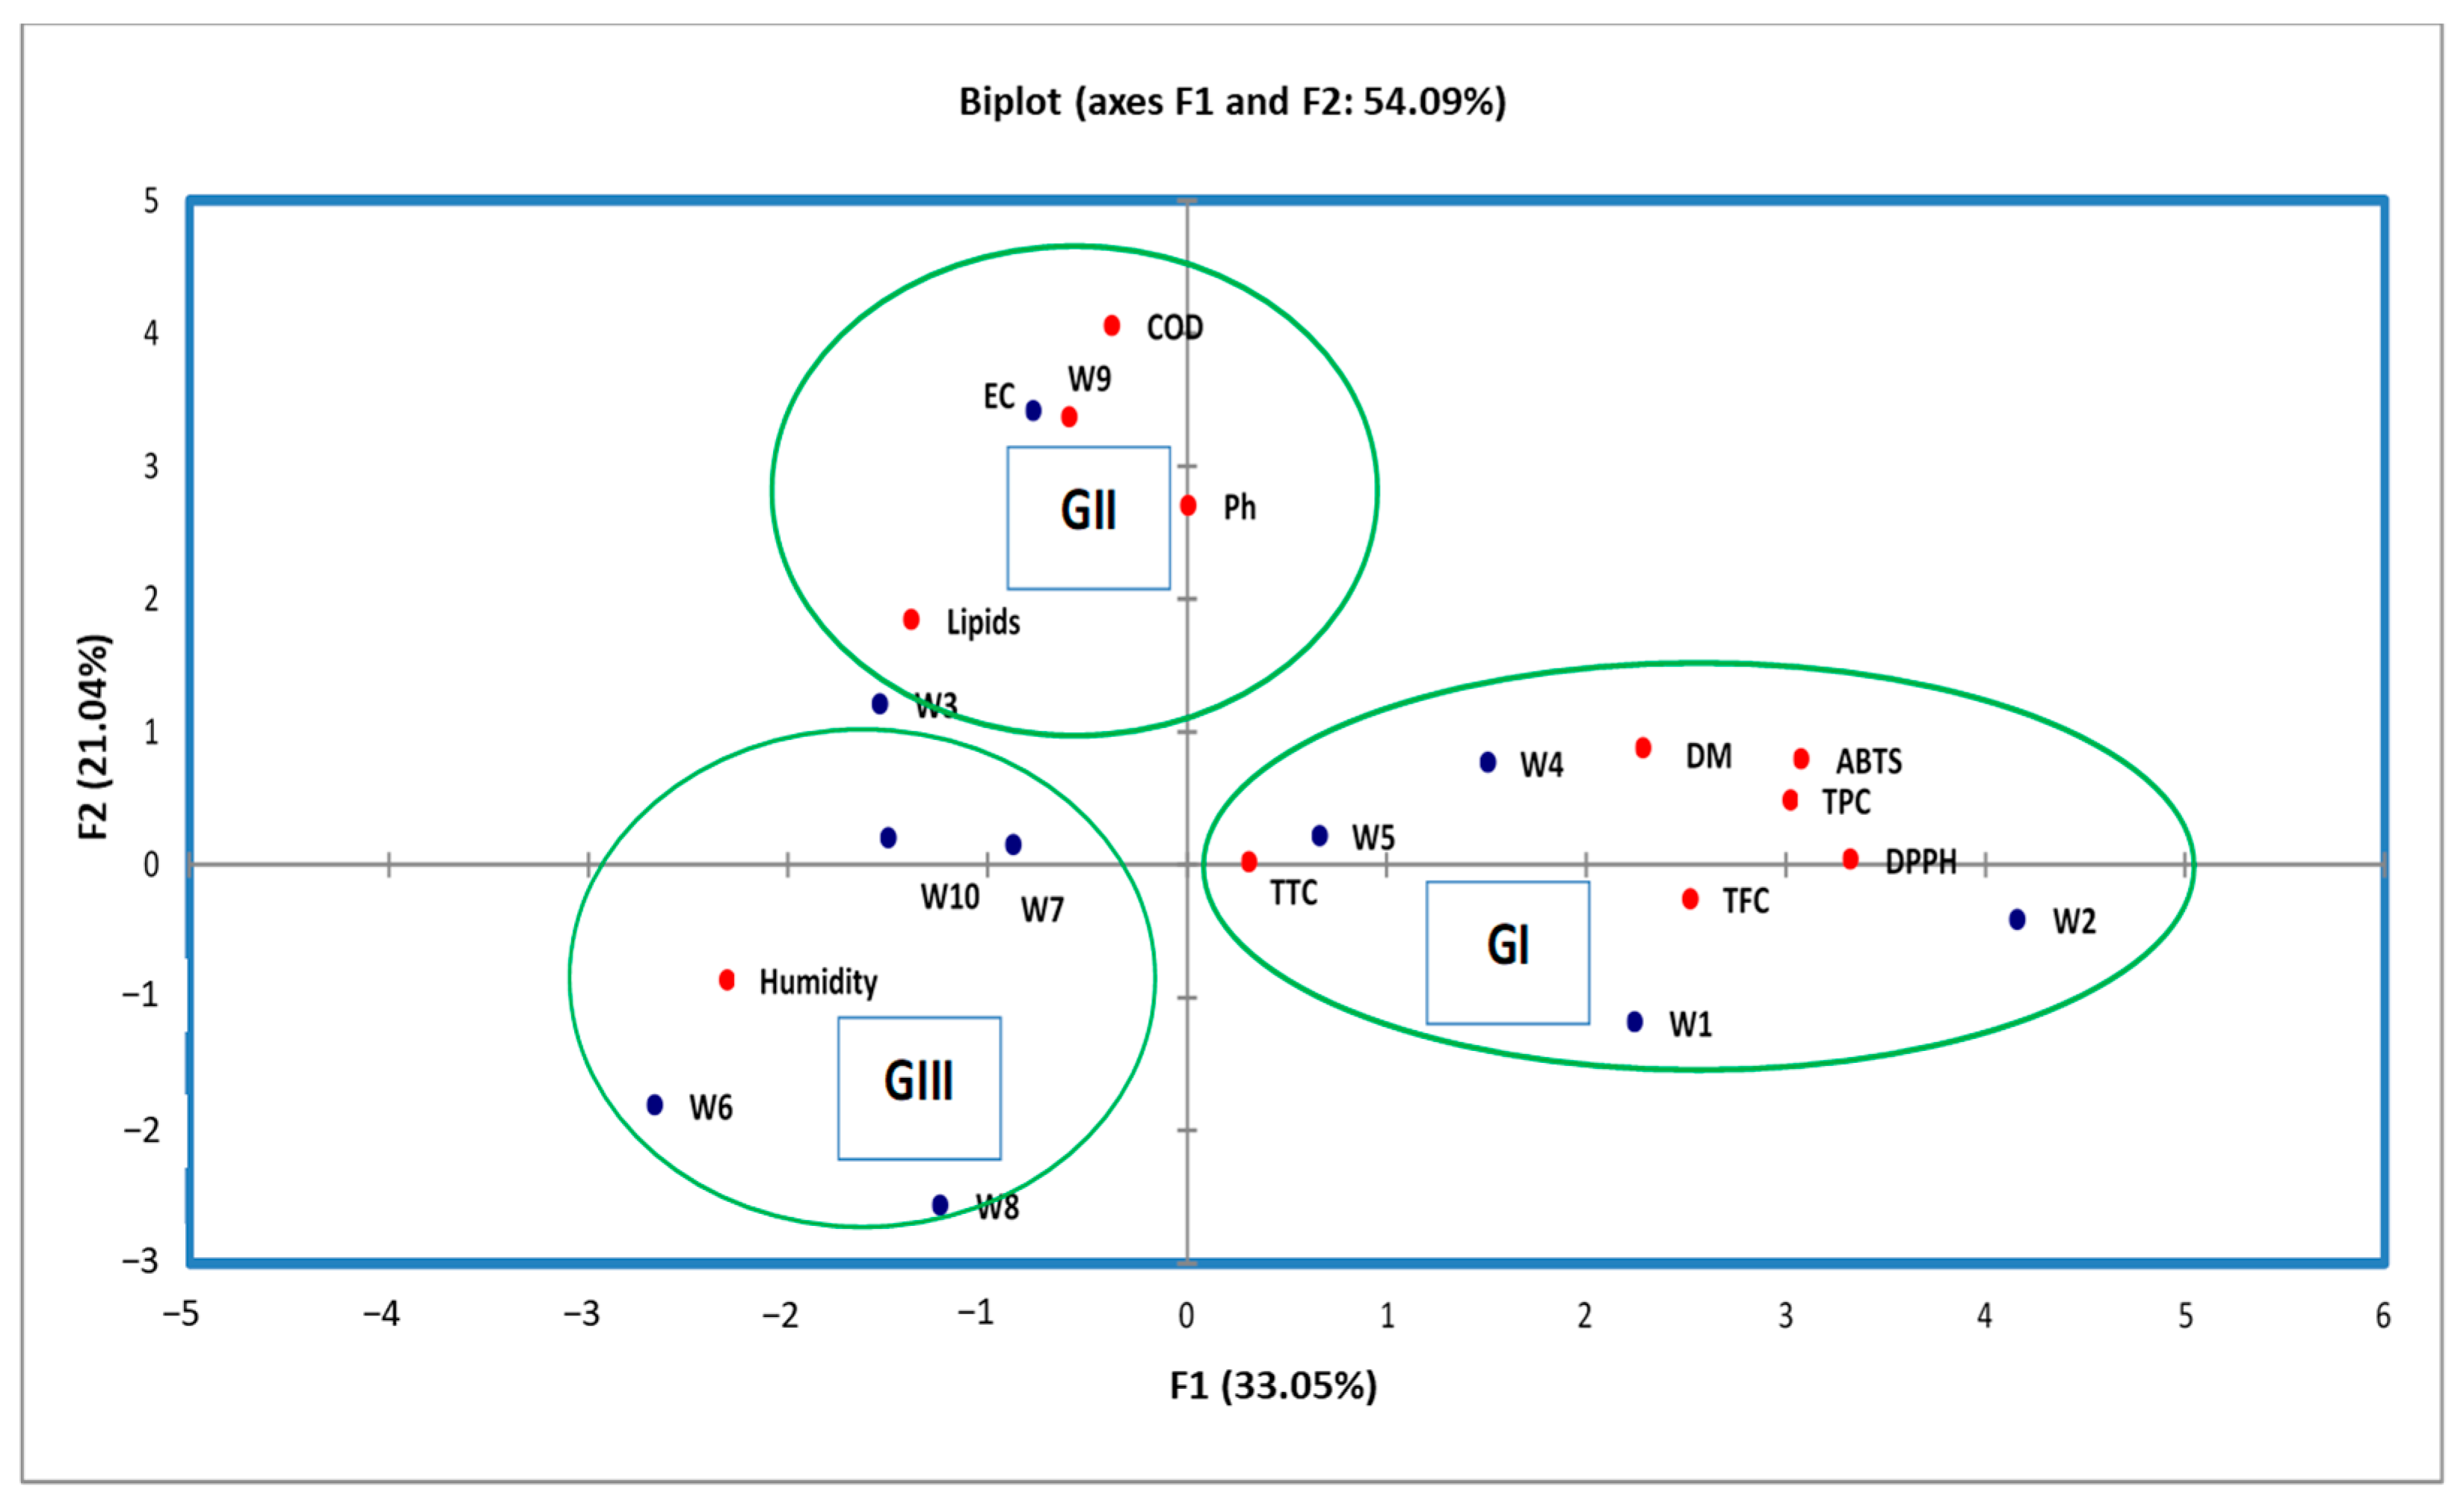
Figure 2 shows that the 10 individuals are spread (extracts) into 3 groups.
Group I consist of 4 extracts (W1, W2, W4, and W5). They are characterized by the high value of TPC, TFC, and TTC, as well as a strong antioxidant activity by DPPH and ABTS assays. These extracts also had a high value of DM.
Group II is made up of two extracts named W3 and W9 collected in Meknes and Guelmim, respectively. They are characterized by a high value of pH and COD, as well as the value of lipids of these extracts being more than other groups.
Group III is formed by the 4 extracts named W6, W7, W8, and W10. They are characterized by the high value of humidity and by low antioxidant activity, because the values of TPC and TFC are less than other groups (1 and 2).
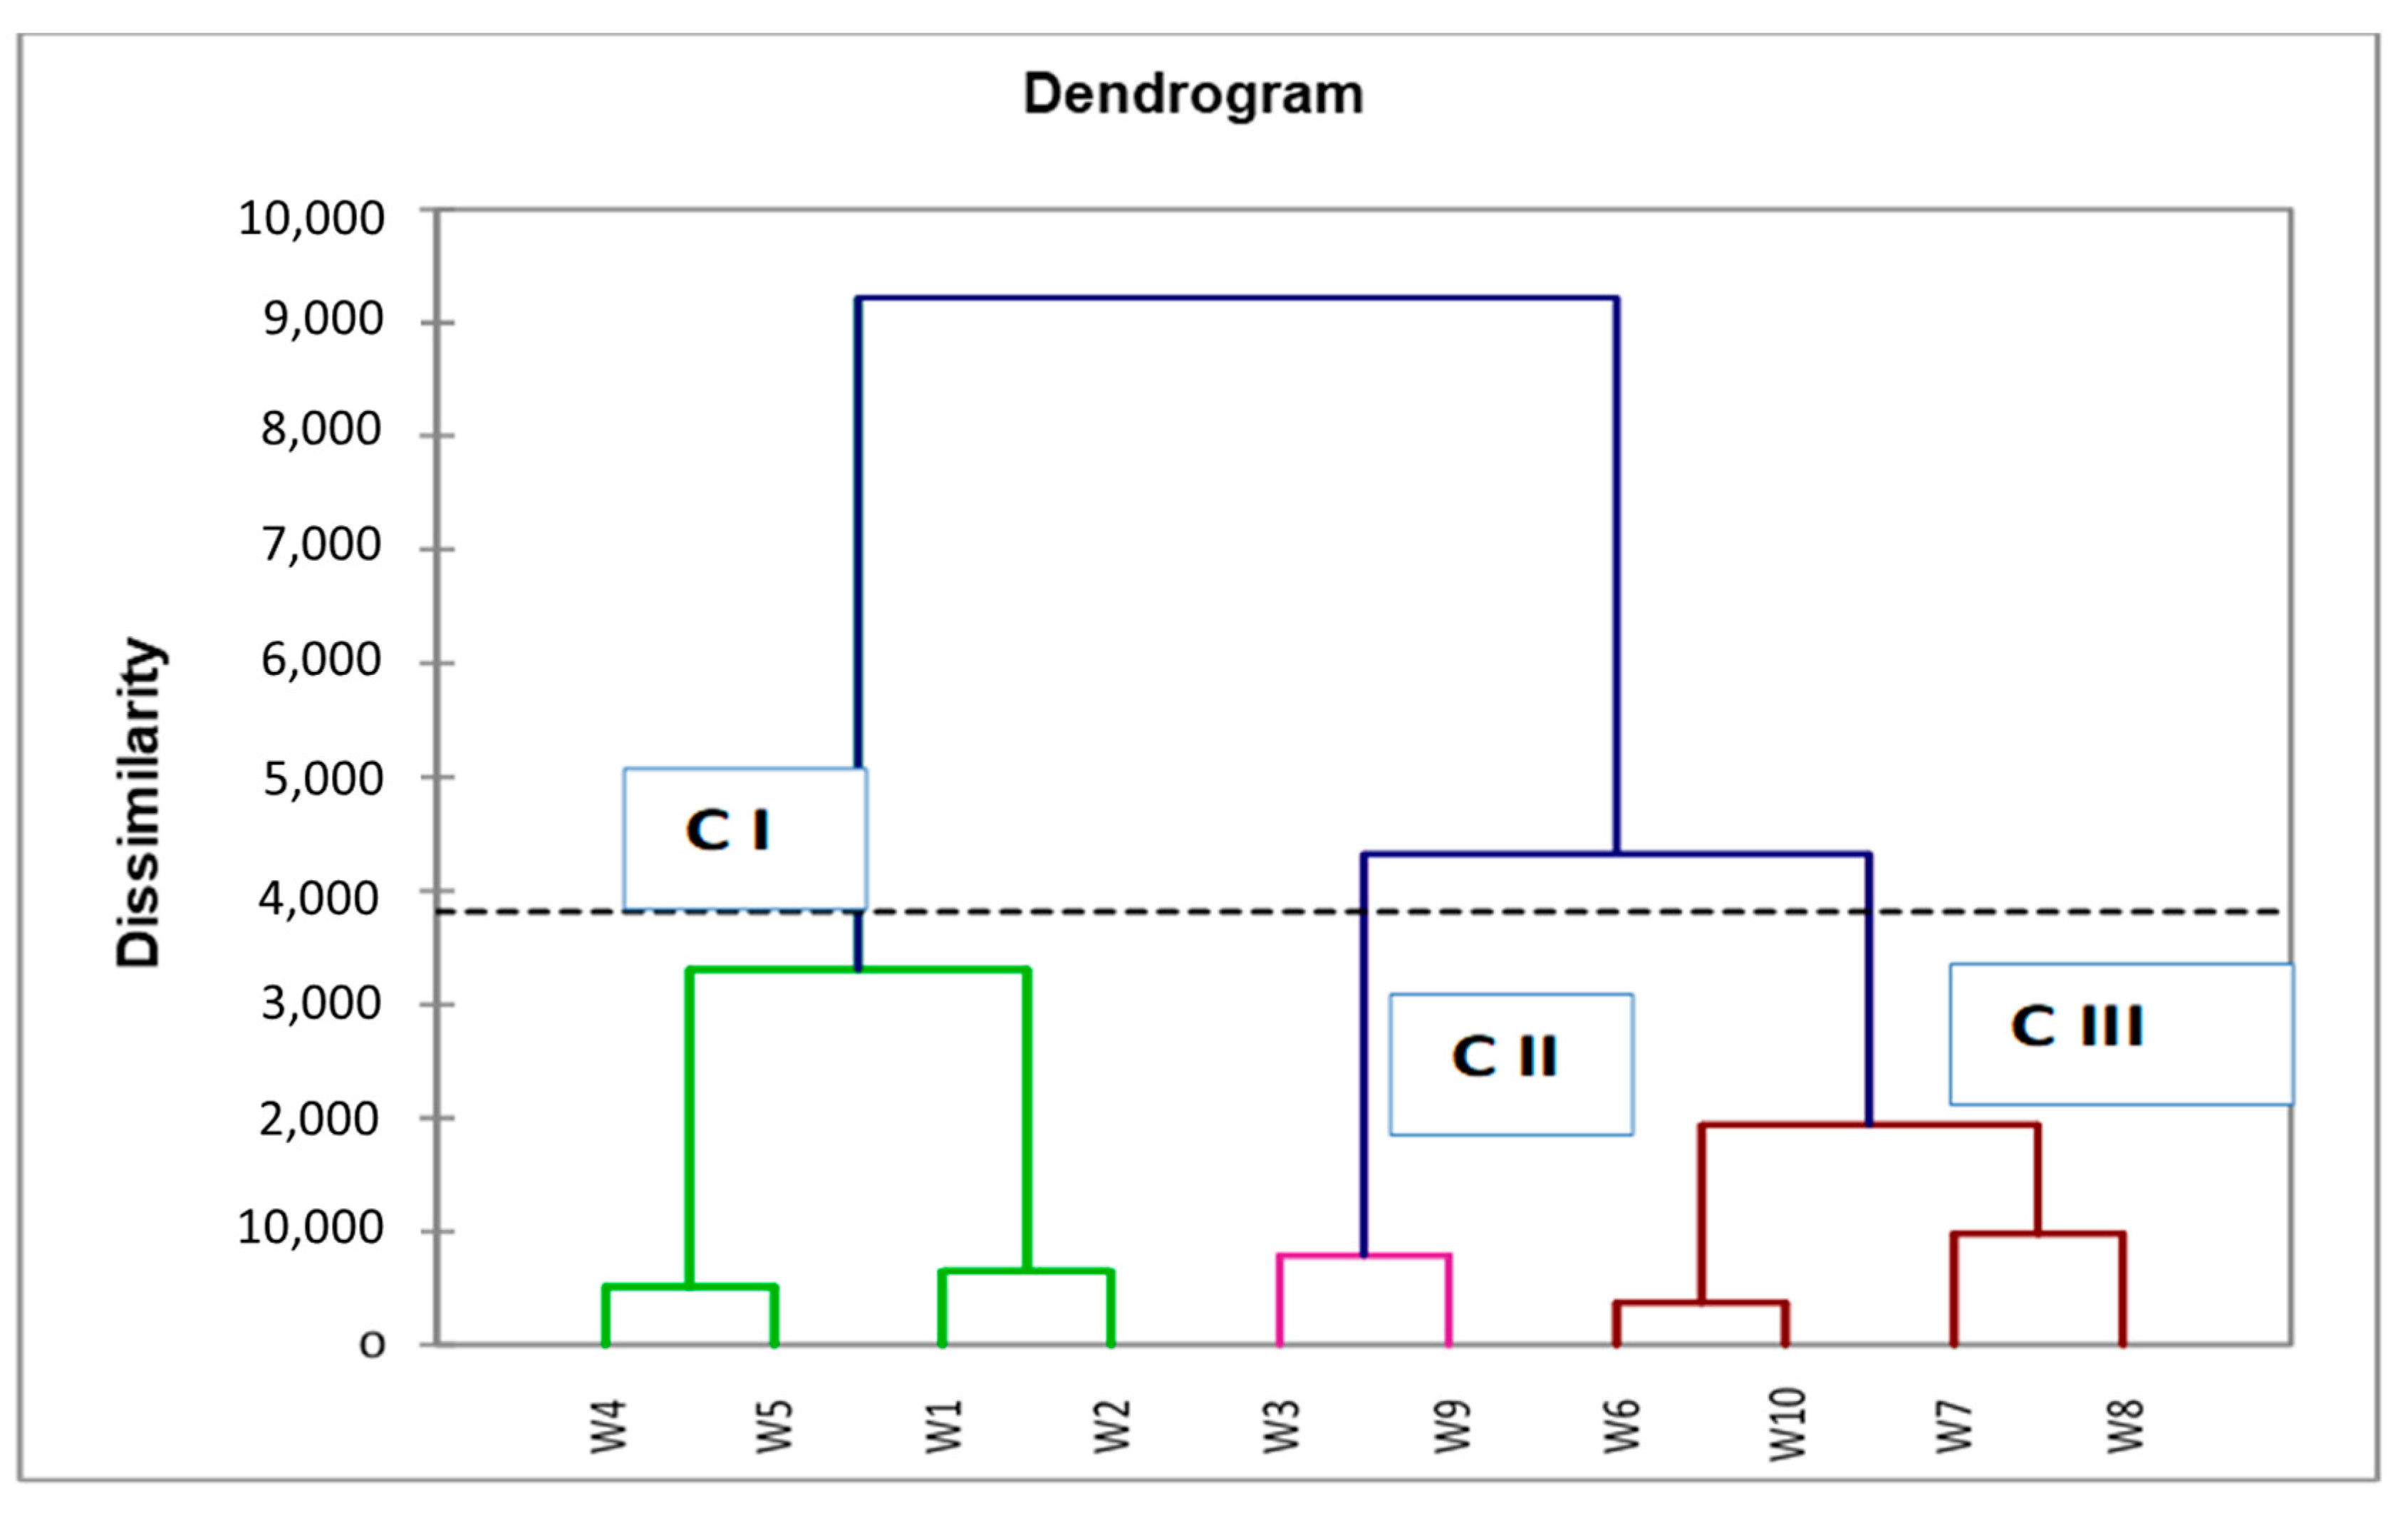
3.6. Hierarchical Clustering Analysis (HCA)
In order to evaluate the measure of similarity, the extracts of OMWs collected in 10 regions of Morocco were classified using the method of Wards and the Euclidean square.
HCA was used to quantify the correlation between all the extracts and to show similarities of 10 extracts based on the data of physico-chemical characteristics and the results of the phytochemical content as presented in the dendrogram in
Figure 3.
According to the results of 10 extracts, these extracts were clustered into three clusters. Cluster I contains four extracts (W1, W2, W4, and W5), representing 40% of the total extracts characterized by a high value mean of TPC (467.90 mg GAE/g), TFC (312.19 mg QE/g), TTC (74.19 mg CE/g), and DM (22.22%), and they had a high antioxidant power compared to group II and group III, but they had a lower value mean of humidity (77.55%), EC (13.90 mS/cm), lipids (0.068%), and medium mean value of COD (174.25 g O2/L) and pH (4.6).
Cluster II, formed by two extracts named W3 and W9, accounted for 20% of total extracts. These extracts characterized by the strong mean value of COD (287.50 g O2/L), EC (16.30 mS/cm), lipids (0.25%), and pH (4.75). Moreover, they had a medium mean value of TPC (297.54 mg GAE/g), TFC (251.73 mg QE/g), and lowest mean value TTC (67.06 mg CE/g), but they are characterized by a medium antioxidant power. In addition, they had a medium mean value of humidity (89.75%) and DM (20.05%).
Cluster III contained extracts named W6, W7, W8, and W10, representing 40% of the total extracts. This cluster is characterized by a highest value mean of humidity 89.90%, and by a lowest mean value of TPC (283.20 mg GAE/g), TFC (232.63 mg QE/g), pH (4.52), DM (10%), and COD (142.25 g O2/L). Furthermore, these extracts had lower antioxidant power compared to group I and group II, and these extracts had a medium mean value of EC (14.10 mS/cm) and lipids (0.15%). This result is in conformity with those of the PCA in which the distribution of all extracts on the score plot shows a similar tendency. Furthermore, the comparison between the HCA and PCA is significant, which showed that the PCA score plot data were in line with HCA scores.


 ,
, 


