Abstract
The Nile Delta is the most vital region of the desert-dominated country of Egypt. Due to its prominent level of vulnerability to climate change’s negative impacts and its low capacity for adaptation and mitigation, the current study aims to provide accurate quantification of temperature change across the Nile Delta as an integral basis for sustainability and climate change impacts assessment studies. This was achieved through monitoring urban dynamics and detecting LST trends in 91 cities and their rural surroundings. The relevant local urban bias was discriminated from regional/background changes present in diurnal/nocturnal temperature records. The temperature records were then corrected/adjusted by removing this urban bias. Owing to the insufficiency of ground-based meteorological observatories, the investigation utilized moderate resolution imaging spectroradiometer (MODIS) land surface temperatures (LSTs) and Landsat-based datasets (2000–2021). The widely used Mann–Kendall test (MKT) and Theil–Sen estimator (TSE) were employed to assess trends in urban sprawl, LST time series, and the implied association. The analysis revealed that the region has experienced dramatic urbanization, where the total urban expansion was greater than two-thirds (69.1%) of the original urban area in 2000. This was accompanied by a notable warming trend in the day/night and urban/rural LST records. The nocturnal LST exhibited a warming tendency (0.072 °C year−1) larger than the diurnal equivalent (0.065 °C year−1). The urban dynamics were positively correlated with LST trends, whereas the Mediterranean Sea appeared as a significant anti-urbanization moderator, in addition to the Nile River and the prevailing northerly/northwesterly winds. The urban–rural comparison approach disclosed that the urbanization process caused a warming bias in the nighttime LST trend by 0.017 °C year−1 (21.8%) and a cooling bias in the daytime by −0.002 °C year−1 (4.4%). All results were statistically significant at a confidence level of 99%. It is recommended that studies of climate-related sustainability and climate change impact assessment in the Nile Delta should apply a distinction of urban-induced local effect when quantifying the actual regional temperature change.
1. Introduction
It is incontrovertible that there is no other country in the world that is as reliant on a mono-fluvial system, i.e., the Nile River, as Egypt. With a sizable population of more than 100 million people and about 96% of desert lands, Egypt is one of the most densely populated countries throughout the globe [1]. Although it constitutes just 2.4%, the Nile Delta is the most vital region in Egypt. It supports 63% of the country’s arable land, yields most crop production, and offers residence for nearly 50% of the population [2]. Under these circumstances, the region’s resources are invaluable but, at the same time, scarce and insufficient. Therefore, the studies concerning the environmental impact assessment and sustainable development are crucial to evaluate the overall region’s sensitivity to possible hazards, notably impactful climate change.
Recent studies have been appraising possible impacts of past climate change and future scenarios on the world environment [3,4,5,6,7,8,9,10,11,12,13]. Owing to their paramount importance, the low-lying deltaic systems have broadly attracted special attention as land/sea interfaces and as hotspots of climate change-related threats [8,9,14,15,16,17]. The Nile Delta was identified as one of the most vulnerable regions to adverse influences related to climate change, including sea-level rise and seawater intrusion [2,18,19], and accelerated coastal erosion [1], threatening the agricultural and rural communities [20,21]. At the same time, the region’s adaptive capacity and mitigative/adjustable capability with these implications are weak since its marginal ecosystem can be described as fragile or highly susceptible to climate change.
Urban dynamics, on the other hand, are the most significant anthropogenic influence on the atmospheric system after human-made climate change [22]. Realizing the long-term dynamics of urbanization is increasingly significant for addressing the relevant environmental implications and sustainable development goals [23,24]. This issue has manifold critical consequences on the environmental biophysical systems and the national socio-economic sectors. In Egypt, the uncontrolled urban dynamics with high rates are complicated because of the rapid population growth, accelerated national development, and scanty resources of the arable lands [25,26]. So, the conversion of the Nile Delta’s cultivated lands to urban LULC is one of the most irreversible negative human impacts. These urban dynamics over the old deltaic lands severely damage the richest natural reservoir containing invaluable agriculture-supporting resources and food-producing systems. In the current context, the atmospheric system is not an exception, where diversified micro-scale modifications were observed as a result of the urbanization process, including the conspicuous urban heat island (UHI) [27,28]. It is a phenomenon that occurs when urban land uses/land covers (LULC) replace the natural vegetation lands, causing a strong micro-scale overheating within three layers of the cities, i.e., surface, canopy, and boundary layers, compared to the surrounding environment [29]. The local effect of UHI can exacerbate the temperature trend observed in the urban areas relative to that detected in the rural surroundings [30,31,32].
Considering the above-mentioned arguments, as accurate as possible quantification of temporal temperature change can be counted as a fundamental ground for assessing the expected environmental impacts of potential climate change on the Nile Delta’s water–food–energy systems and the relevant concerns of sustainability. The accurate estimation of temporal temperature changes requires unbiased temperature records. Many triggers are well-recognized as contaminants that can introduce biases into the systematically observed records of temperature [33,34,35,36], primarily the unavoidable processes of urban dynamics.
Early research works embarked on eliminating the systematic urban effect existing in temperature records (e.g., [30,37,38,39]), where the city has been recognized long ago as a serious contamination source of the climate signals [40]. This was originally triggered and encouraged as an integral part of the wider scientific interest in the global climate change issue. Correcting the urbanization effect should be conducted to provide bias-free temperature records necessary for monitoring the actual long-term climate change, namely “Macro and/or Large-scale and/or Background and/or Regional Component” of climate change [41,42]. Advancements in the methodologies of urban bias removal can be divided into the urban–rural comparison approach and the urban-based approach.
Kukla et al., (1986) demonstrated the early urban bias estimations by comparing trends of air temperature datasets collected in urban environments and countryside sites worldwide [37]. This technique was then mostly adopted in North America [37], the United States [38], the Northern Hemisphere [39], Prague [43], and South Korea [44]. Jones et al., (1989) used linear regression between urban–rural temperature differences and population growth to discover the urban effect in the United States and the Northern Hemisphere temperature records [39]. The urban–rural distinction was initially based on population size, population density, and census area categorization [45]. Later, satellite night-light metadata was used for this purpose [46,47]. A new machine learning-based method was proposed by [48] to classify weather stations into rural/urban based on a satellite-based global LULC product. They then estimated the urbanization contribution to the global/regional time series of annual land mean/extreme temperature indices.
In case the reference rural stations are inadequate, another methodological approach was invented based solely on the urban conditions. Some papers estimated urban bias by utilizing the upper-air temperature records collected through atmospheric vertical soundings, which are not sensitive to urbanization [22,49,50]. An innovative analysis drew an analogy between air temperature trends in windy and calm weathers to extract the net urban effect [51]. Yuan and Guo-Yu [52] developed a new method to adjust urban bias in Beijing using linear correction between the accumulated urbanization effect and surface air temperature. A similar work [53] connected trends of urban fraction around weather stations to quantify the nexus between urban sprawl and urban warming in China. Integration between remote sensing and weather observations was employed to assess Brussels’ UHI effect on the summertime air temperature series of Uccle [54]. Bassett et al., created a statistical model to estimate the daily urban warming across Great Britain based on the relationships between UHI intensity, urban fraction, and wind speed [55]. Recently, Shi et al., (2021) corrected the urbanization bias at a typical station in the Yangtze River Delta. The discussion suggested that the new satellite-based technology can be more effective in correcting the urbanization effect around the station [32].
It has long been acknowledged that remote sensing is a robust system for monitoring the Earth’s environmental conditions and ecological problems [56,57,58,59,60]. It consistently provides a long historical record of imagery acquired in diverse spatial/temporal resolutions, which is essentially advantageous in the assessment of urban dynamics [61,62,63] and LULC changes [64,65,66] over time. Satellites operating in thermal infrared (TIR) imaging have an extraordinary prominence in terms of LSTs calculation and investigation [67,68], including Landsat missions 4/5/7/8, the advanced space-borne thermal emission and reflection radiometer (Terra ASTER), and Aqua/Terra MODIS. TIR satellites were designated to supply thermal data in a high spatial sampling rather than any other data source. They are specifically optimal for exploring and analyzing local-to-site thermal characteristics and UHI effects [28,69,70,71,72]. Consequently, those systems overcome the rooted shortages that devalue the ground-based observatory network of the atmospheric system, particularly in developing countries’ regions, such as the Nile Delta, whose meteorological service contains very few weather stations with limited capacity for micro-scale applications of urban climate.
In addition, the localized nature of per-pixel LSTs makes TIR products remarkably valid in separating the urban warming component from the regional atmospheric change. On the contrary, in the case of ambient air temperature data measured systematically by sparse, inadequate weather stations, the achievement of that local–regional thermal separation is largely defective because of the well-mixed urban–rural air masses. This air mixing prompts the urbanized contamination effect in meteorological stations located within peri-urban and rural surroundings. This urban-induced corruption is mainly caused by the horizontal outgrowth of the UHI effect beyond the city’s built-up zone, namely the well-known phenomenon of the UHI footprint [73,74,75,76,77].
In this paper, we monitor the dynamics of the urban centers across the Nile Delta, explore diurnal/nocturnal LST trends in both urban areas and rural surroundings, and analyze the urbanization–warming nexus. Finally, the local-to-regional temperature changes are discriminated using quantification of the urban bias. We utilized LST data products acquired by Aqua/Terra MODIS sensors (2000–2021) and Landsat-based annual coverage of urban settlements, namely the “Global Artificial Impervious Areas (GAIA)” dataset.
2. Materials and Methods
2.1. Study Area
The Nile Delta is a major physiographic division of Egypt. It is an inverted triangle-like region situated in the northern territory of Egypt, as shown in Figure 1. Its southernmost tip is formed by the divergence of the Nile River’s main course into the eastern (namely Damietta) and the western (namely Rosetta) distributaries. The northern arc-shaped edge of the region stretched along the middle part of the Egyptian Mediterranean coastline. The region spans latitudes between 30°10′25.9″–31°36′11.6″ north and longitudes between 29°22′35.7″–32°33′15.8″ east. Hence, it is located within the African subtropical zone, fully influenced by Köppen’s hot desert climate BWh [78].
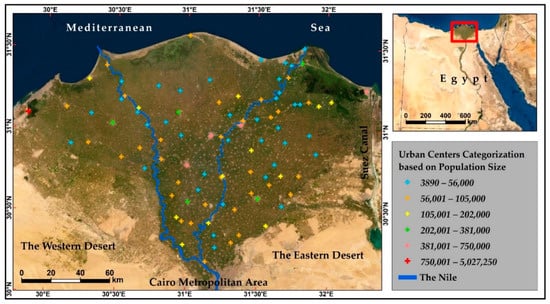
Figure 1.
Location map and geographical setting of the study area (the red box) using ESRI true-color satellite images. The Nile Delta (the dark greenish cultivated surface) extends between the Western and Eastern Desert surfaces (the yellowish surfaces). The urban system under consideration includes 91 urban centers symbolized using the natural breaks (Jenks) method into six categories according to population size: small towns (37 centers), large towns (32 centers), small cities (12 centers), medium cities (5 centers), large cities (4 centers), and megacities (single center). This method of classification groups the original population data into similar natural classes of urban centers to maximize the differences between classes. The limits of each population class were rounded for generalization purposes.
The key aspect of the climatic conditions is the enormous evapotranspiration that exceeds the rainfall amount, forming a vast arid zone as a part of the Northern African Sahara, which is interrupted by the Nile River and its own Delta intrusion. Broadly speaking, the region experiences warm-to-hot summers with mild winters. The westerlies dominate the general wind system, acting as a temperature-moderating agent. Based on the spatial average of climate data observed for the period 1976–2005 in 10 meteorological stations within the Nile Delta, the annual maximum, minimum, and daily temperature normals were 25.9 °C, 15.4 °C, and 20.4 °C, respectively. The summer maximum temperatures frequently exceed 30 °C, while minimum temperatures in winters are usually above 5 °C. The absolute maximum (highest) and minimum (lowest) temperature values observed were 44.4 °C and 0.1 °C, respectively.
The region covers an onshore area of about 21,427.1 sq km, only 2.4% of Egypt’s mainland [2]. The Nile Delta’s alluvial formation within a desert-dominated country makes it the richest agricultural environment that offers a habitat for about 50% of the country’s population. Considering the above-mentioned socio-economic impetus, the region has been undergoing considerably intensified urban dynamics. The cultivated surface of the Nile Delta plain is speckled with a wide variety of urban/non-urban settlements. The urban system occupying the Nile Delta’s old lands includes 91 municipalities out of the total 241 Egyptian urban settlements. Figure 1 illustrates their spatial distribution and categories with respect to population size. The total population of the urban centers of interest is 14.2 million, with a considerable domain ranging between the smallest town of Gamasa (3890 inhabitants) and the largest megacity of Alexandria (5,027,250 inhabitants).
2.2. Datasets Description and Analysis Procedure
2.2.1. Urban Dynamics Data and Mapping
Monitoring large-scale urban dynamics is crucial for numerous environmental applications on a changing globe. The practicality of big imagery data archives collected by satellite remote sensing systems was frequently expanded to produce ready-to-use long-term urban impervious surfaces and LULC products for mapping urban dynamics worldwide [24,79,80,81]. The current study exploited the so-called GAIA dataset generated by [81] to map and explore the urban dynamics across the Nile Delta in terms of urban sprawl. It is a web-based repository that offers high-resolution (30 meters) raster layers of the human urban/rural settlements’ footprints. The dataset has a planetary-scale spatial extension, with temporal coverage spanning more than 30 years (1985–2018) at annual intervals. Human settlements were extracted and mapped annually based on the full image archive of Landsat satellite missions on the Google Earth engine platform. The developers of GAIA reported that they evaluated the dataset using a five-year interval sample, namely 1985, 1990, 1995, 2000, 2005, 2010, and 2015, and the overall accuracy was +90%. The cross-comparison and temporal trend in GAIA agreed well with the similar local, regional, and global datasets. The full dataset is freely downloadable and sharable from http://data.ess.tsinghua.edu.cn (accessed on 5 January 2022).
After downloading, the preprocessing procedures involved clipping the dataset spatial coverage by the Nile Delta’s boundary and transforming the layers from the geographic coordinate system (GCS) of WGS 1984 to the commonly used projected coordinate system (PCS) of Universal Transverse Mercator (UTM) Zone 36 N. Owing to its inclusion of all settlement types, we masked GAIA raster layers to eliminate rural settlements. The final outputs contained only the annual built-up footprints of the 91 urban centers under investigation within the Nile Delta region. Because the GAIA dataset ends in 2018, the yearly urban expansions up to 2021 were derived from 30-meter Landsat images using on-screen digitizing. The area (sq km) of each urban settlement was computed on a year-to-year basis during the study timeframe (2000–2021).
2.2.2. Vegetation Indices and Urban–Rural Distinction
The most straightforward approach of quantifying the urbanization effect is to compare the urban areas with the neighboring rural environment that is considered free of the urban influence. The current study adopted an urban–rural comparison approach for measuring the local contribution of urbanization in the LST time series. So, it was necessary to accurately distinguish the urbanized built-up zones and the rural vegetated surroundings. Simply put, the Nile Delta’s urban built-up zones were extracted based on the GAIA dataset [81] described before in Section 2.2.1.
As for the rural areas, since the standard height of the thermometer shelter is 1.5 m, the maximum possible impact of the urbanized built-up area on the temperature data under advection and turbulence conditions does not exceed 5 km [32,82,83]. Therefore, the reference rural surroundings were delineated as well by creating a GIS Euclidean distance analysis to determine the areas extending +5 km around each urban center. The rural environments occupying the immediate vicinity (0–5 km) of the urban areas were neglected so as to eliminate the well-recognized UHI footprint effect. Figure 2 shows an example of the conceptual framework used to identify the urban center, the ignored ring buffer, and the reference rural surroundings required for removing urban bias from the LST records.
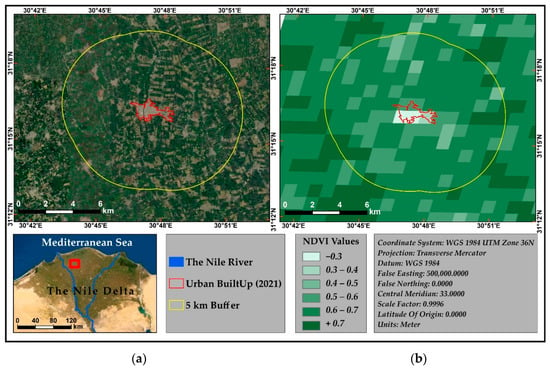
Figure 2.
(a) The conceptual framework adopted in the study to identify (1) the urban area whose temperature record endures the UHI signals and needs to be corrected (the red border), (2) the ignored 0–5 km rural surrounding which is affected by the UHI footprint (inside the yellow border), and (3) the reference +5 km rural surroundings utilized for urban bias removal (outside the yellow border). (b) The reference +5 km rural surroundings were selected based on Terra MODIS NDVI values. As indicated by the left panel (a), the region is highly urbanized and numerous villages spread across its surface. We used GIS-based processing to exclude these unfavorable built-up areas from the rural benchmark zone to avoid introducing uncertainty to the analysis results. The illustrative mapped example is for the small town of Sidi Salem.
As a matter of fact, the LST values in rural areas are expected to be largely affected by the interannual variations of vegetation greenery/extent expressed in NDVI values. This situation can introduce much uncertainty when comparing urban/rural environments to measure the effect of urban expansion on LST. We neutralized the vegetation-induced LST variations in the reference rural locations by exclusively utilizing the highly vegetated pixels in which NDVI ≥ 0.65 and no significant trend was observed in the 22-year time series of the NDVI dataset. It should be noted that the web-based accessible (https://earthexplorer.usgs.gov/ (accessed on 14 January 2022)) Terra MODIS product of MOD13A3 V6.1 was manipulated to identify vegetated areas in the reference rural zone located +5 km from each city. The product involves the vegetation indices of the normalized difference vegetation index (NDVI) and the enhanced vegetation index (EVI) provided monthly at 1 km spatial resolution. More improvements were applied to the reference rural surroundings by eliminating the pixels containing high water content or small built-up settlements, which may elevate the errors in the analysis results.
2.2.3. LST Time-Series Construction
In determining the local response of temperature to urban dynamics, nine LST time series were imperative for analysis, i.e., diurnal, nocturnal, and daily collections for urban, rural, and area averaged LST values. Moreover, per-city LST records were crucial to analyze the dependency of temperature bias on the city size and rates of urban dynamics. The work relied entirely on satellite data acquired by Aqua/Terra MODIS sensors available for use at https://earthexplorer.usgs.gov (accessed on 9 January 2022). The imagery datasets cover a continuous, relatively prolonged period of about 22 years (2000–2021). The Aqua/Terra MODIS sensors detect four scenes a day for the study area, both in diurnal (≈10:00 AM and 02:00 PM) and nocturnal (≈10:00 PM and 02:00 AM) times. We drew Terra MODIS-derived MOD11A2 and Aqua MODIS-derived MYD11A2 version 6.1 products, which provide an average 8-day per-pixel LST and emissivity at 1 km spatial resolution.
Preprocessing for each imagery collection included sub-setting the study area, projecting the scene to PCS UTM Zone 36 N coordinate system, transforming the scene’s digital numbers (DNs) to LSTs by the provided scale factor (0.02), and conducting emissivity correction of LST using the supplied per-pixel emissivity values. Temporal and spatial missing LST values were estimated using the inverse distance weight (IDW) interpolator and forecasting function. Subsequently, the annual LST averages of daytime, nighttime, and day imagery records were computed. Ultimately, the above-mentioned temporal daytime, nighttime, and day LST records were spatially segmented using GIS zonal analysis to more homogeneous urban, rural, and area-averaged composites.
2.2.4. Trend Analysis
Upward and downward trends are detectable in hydrometeorological time series using different statistical parametric and nonparametric tests [84,85,86,87,88]. We applied the widely used MKT [89,90] and TSE [91,92] to assess trends in urban sprawl and LST time series, and the relevant intercorrelation. MKT is a rank-based, nonparametric test developed to detect positive/negative monotonic trends in environmental impact assessments [93,94]. Unlike the parametric methods, MKT is a distribution-independent test, i.e., it does not require the data to be normally distributed, a presumption that is statistically rare in atmospheric data. However, the dataset should have no serial correlation [95]. All LST trends were evaluated at a statistical significance of 0.01 (confidence level of 99%).
The MKT statistic S is given by [94]:
where and are the values of sequence is the length of the time series, and:
The statistic S is approximately normally distributed when n ≥ 8, with mean and variance as follows:
where is the number of data points in the tied group and is the number of groups of tied ranks. The standardized test statistic Z is computed by:
Although the MKT is robust, it does not provide a quantitative estimation of the trend line’s slope, i.e., the magnitude of a positive or negative trend. For this purpose, trend analysis utilized the TSE to compute the trend magnitude. The TSE was first outlined by Theil (1950) and later expanded by Sen (1968). It is a nonparametric estimator and resistant to outlier data points. It uses medians to fit the trend line as an alternative to the parametric mean-based method of least squares [96].
The TSE model for trend magnitude is conducted by calculating the slopes of all possible combinations of data pairs as follows [97]:
The final slope is then defined as the median of all slopes:
Because the TSE computes the trend line’s slope alone, the model “intercept ” can be given by:
where and are the medians of the measurements and of the response variables, respectively.
2.2.5. Local–Regional Warmings Separation
The annual average of micro-scale urban bias expected to exist in the city’s LST record was computed by comparing trends of LST datasets collected in both urban environments against countryside locations. This was achieved based on the following simple formula:
where and are the average LST values in both urban and rural environments, respectively. The urban bias trend was then obtained by conducting trend analysis on the 22-year record of the annual average LST biases. Ultimately, this urban-induced bias trend was utilized to correct the original LST time series. Adjustment of the annual LST average for the annual average of UHI intensity/bias was derived from [45]:
where is the corrected annual LST average of the year i and is the observed annual average of LST of the year i. Correction of the annual LST average for the trend of UHI intensity/bias was calculated from [45]:
where is the trend TSE slope of the annual UHI intensity record and is the start year of the time series under investigation, i.e., 2000. Equations (10) and (11) can be aggregated in the following one:
The urban-induced bias of LST time series was then linked to the urban dynamics time series to disclose the possible nexus between urbanization and local urban warming.
3. Results and Discussion
3.1. Urban Dynamics in the Overall Nile Delta
This section is intended to provide a holistic view of the observed temporal tendency in urban dynamics across the overall Nile Delta and per-city time series on a yearly basis. Figure 3 shows a mapping of the 22-year period (2000–2021) of urban dynamics across the Nile Delta, basically in terms of urban ground coverage. The temporal growth and trend line of the total urban area and built-up increments (sq km) using MKT and TSE analysis are also visualized. Analysis revealed that the total urban footprint in the Nile Delta consistently grew from 455.47 sq km in 2000 to 770.23 sq km in 2021, at an average growth rate of 14.99 sq km year−1 and a standard deviation of 22.85 sq km. Figure 3 indicates that there was a perfect positive monotonous linear trend in the total urban area as calculated from MKT analysis, where Kendall’s tau value was 1. According to TSE, the magnitude of the trend line slope was 9.8 with a confidence interval of 9.74–9.9. This means that the annual increment of urban expansion was 9.8 sq km year−1. The results were statistically significant at a confidence level of 99%, where the computed p-value of MKT was < 0.0001, or less than the alpha threshold (α = 0.01). It was observed, as well, that the largest annual growth rates in the urban built-up were 106.6, 42.2, 22.1, 18.8, and 16.9 sq km, which were detected in the years 2020, 2015, 2001, 2021, and 2014, respectively. The measured annual expansions during the remaining years were mostly less than 10 sq km.
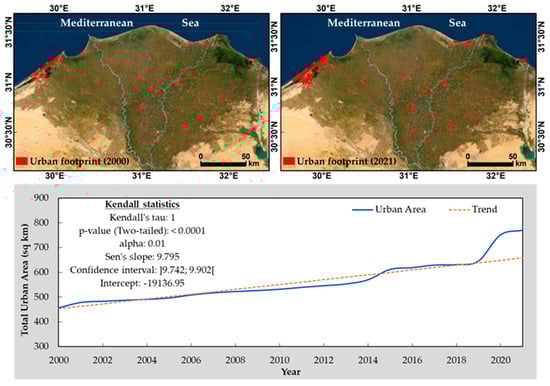
Figure 3.
Mapping urban area footprints across the Nile Delta 2000–2021 (upper panels) and trend analysis of the total urban area (sq km) using MKT and TSE (lower panel).
These findings suggested that the Nile Delta has experienced a dramatic urbanization process, in terms of urban sprawl, during the period 2000–2021. The total built-up zone of about 314.8 sq km was appended as an urbanized extension to the base-year urban area, i.e., 455.5 sq km in 2000. This expansion was estimated to be greater than two-thirds (69.1%) of the original urban area during a relatively short time span (22 years). The main motives behind the rapid urbanization were the natural population growth at an annual rate of 2–3%, the immense rural-to-urban people migration, and the fast national development through modernization, industrialization, and diversification of the economic structure [25]. The exponential pattern of the population growth in the region implied sharper increases over time [26]. In addition, the urban dynamics in the Nile Delta were tremendously complicated and usually exceeded the expected rates because the urban development was mostly informal, unplanned, and uncontrolled [98]. Considering its alluvial formation within the desert-dominated surfaces, the Nile Delta’s richest agricultural environment supports 63% of the country’s farmland and offers habitat for about 50% of the country’s population. So, the region has undergone a considerable intensified human-induced pressure, predominately the urban dynamics.
It should be noted that those dynamic expansions in urban built-up zones implicitly involved LULC alterations across the Nile Delta, specifically the urban encroachment over the old rural lands fully enveloping the cities, as shown in Figure 3. This pattern of urban expansion should be accompanied by exacerbated urban warming and prompting urban bias in the temperature records. Similar studies have been investigating the observed LULC changes and the relevant urban sprawl over rural farmlands. Throughout the Nile Delta, urban settlements have expanded mostly at the expense of the fluvial lands dedicated to cultivation rather than the barren lands or desert fringes.
Analysis of Landsat MSS and TM datasets (1972–1990) showed that urban expansion of about 58% in 18 years was endangering the region’s agricultural lands [99]. In the period from 1984–2006, the change detection technique applied to Landsat TM and ETM+ images disclosed that the total urban expansion amounted to 689.2 sq km [100]. The expansion was mostly at the expense of the vegetated lands, while the urban encroachment over the nonarable soils was very limited. Landsat-derived estimation of urban expansion in the middle Nile Delta between 1997 and 2017 was approximately 21.19% (from 1192.56 sq km to 1445.33 sq km). This expansion implicitly referred to a decrease in rural environments enveloping the cities by about the same size [25]. Radwan et al. [26] monitored changes in the Nile Delta’s LULC during a 24-year period (1992–2015) using a multi-sensor dataset. A dramatic urban expansion of about 746 sq km was detected in the region, leading to a loss of the old, cultivated land at a rate of 31.08 sq km year−1. In the same period, 2061 sq km of bare desert surfaces were reclaimed to be new farmlands at a rate of 85.88 sq km year−1. Landsat 5/7/8 data were used to assess modifications of LULC classes for the Nile Delta from 1987 to 2015 [101]. There was a continuous increase in urban, agricultural, fish farms, and natural vegetation classes, while continuous decreases were detected in both water bodies and barren sandy areas. The urban area had the highest increase during 2000–2015 (979.408 sq km with a rate of 34.8%) compared to the period 1987–2000 (531.126 sq km with a rate of 47.6%). Overall, the total growing rates of LULC classes during the period 1987–2015 were 99% in urban areas and 25.8% in cultivated lands. By the 1990s, the total area of lagoons and wetlands occupying the northern Nile Delta has declined by about 45% of its observed size in the 1950s [2].
Figure 4 shows the urban classes according to the total growth in the built-up area of each urban center (2000–2021) and the total number of urban areas per class. It is notable that the vast majority of the urban centers (66 urban settlements) are located in the first category, in which the total per-city expansion was 2 sq km or less. The smallest urban expansion of about 0.21 sq km was recorded by the town of Kafr Saad in the Damietta Governorate. On the other hand, the megacity of Alexandria occupied a unique and prominent stature regarding the urban growth, where it was enormously expanded by approximately 129.7 sq km. The second largest urban growth within the period 2000–2021 was 15 sq km, which was observed in the city of New Damietta located along the Mediterranean coast in the Damietta Governorate.
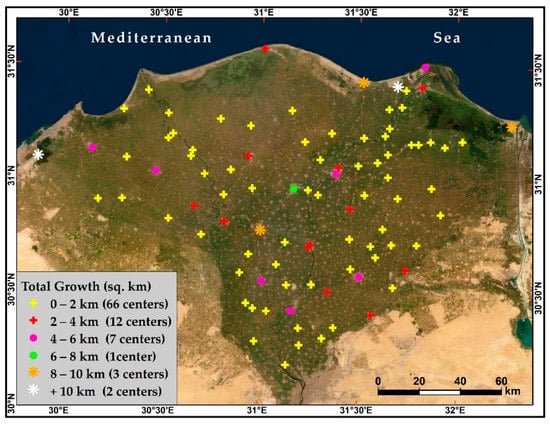
Figure 4.
Categories of the urban centers in the Nile Delta based on the total built-up expansion from 2000 to 2021. The number of urban centers within each category is written between brackets.
3.2. Day/Night and Urban/Rural LST Trends and the Nexus with Urban Dynamics
For this section of the study, the analysis aims at examining the inter-annual trends of LST time series within the urban area, rural surroundings, and across the overall Nile Delta on three timescales, i.e., the daytime, nighttime, and daily datasets. Figure 5 exhibits the inter-annual variability and Kendall trend analysis for these time series. The LST data were calculated based on Terra and Aqua MODIS imagery acquired during the period 2000–2021. The descriptive statistics and MKT and TSE outputs for the 22-year LST time series are displayed in Table 1. As illustrated in Figure 5, the LST series have consistently risen since 2000 and their inter-annual variability had a general increasing tendency through time with different magnitudes for all the series. The descriptive statistics provided in Table 1 indicate that the lowest LST values throughout the time series were always measured in the first quarter of the period, i.e., the years 2000 and 2005, whereas the highest readings in LSTs were observed in the last quarter of the period, specifically in the years 2018 and 2021. This is a strong indicator of the warming phenomenon in the Nile Delta region, including its urban and rural environments, in the daytime and nighttime hours. Furthermore, the LST values in all datasets were homogeneous in terms of the statistical dispersion, where the standard deviation ranged in a noticeably short domain between 0.4 °C and 0.6 °C.
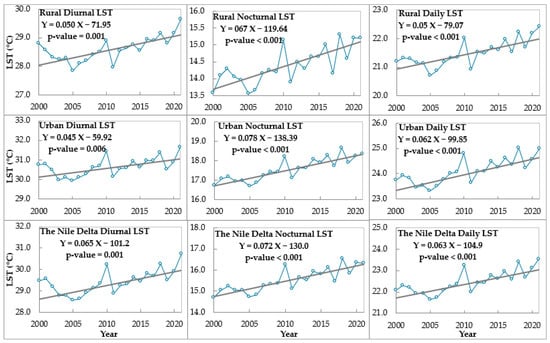
Figure 5.
Year-to-year variations and Kendall trend analysis for the rural, urban, and overall Nile Delta’s diurnal, nocturnal, and daily LST records (°C) derived from Terra/Aqua MODIS imagery detected during the period 2000–2021.

Table 1.
Basic analysis outputs of descriptive and Kendall trend statistics for the rural, urban, and overall Nile Delta’s diurnal, nocturnal, and daily LST time series (°C) calculated based on Terra and Aqua MODIS imagery acquired during the period 2000–2021.
Regarding the overall Nile Delta’s LST datasets, the lowest and highest annual averages of LST were 21.6 °C (2005) and 23.5 °C (2021), respectively, with a period average of 22.5 °C and a standard deviation of 0.5 °C. It is clear that the Nile Delta’s daily record of LST experienced substantial warming during the study period. Statistical analysis using MKT discovered that daily LST had an upward trend, where Kendall’s tau value was 0.62, which indicates the elevation of LSTs throughout the time, as shown in Table 1. TSE suggested that the observed elevation rate in daily LSTs was 0.063 °C year−1, with a total warming magnitude of 1.32 °C for the whole period. For the diurnal and nocturnal records, there was an obvious tendency of LST amplification in both measures. The lowest LST values were 28.6 °C in 2005 and 14.7 °C in 2000 for daytime and nighttime datasets, respectively, whereas the highest readings in the daytime and nighttime LSTs were 30.7 °C in 2021 and 16.5 °C in 2018, respectively. The overall period means of diurnal and nocturnal LST were 29.4 °C and 15.5 °C, respectively, with a standard deviation of 0.6 °C for both measures. According to TSE Analysis, Table 1 reports that diurnal and nocturnal datasets warmed throughout the study period at rates of 0.065 °C year−1 and 0.072 °C year−1, respectively. The total warming magnitudes in both measures were 1.36 °C and 1.51 °C, respectively. The statistical analysis outputs were significant at a confidence level of more than 99%. Table 1 specifies that p-values were <0.001 for all statistics.
It has become apparent that LST records collected during nighttime for the whole Nile Delta exhibited a warming tendency slightly larger than the equivalent records derived for the daytime. This aspect of the day/night LST trends was far greater observed in both urban and rural environments, where the day/night warming rates in the urban areas were 0.045 °C year−1 and 0.078 °C year−1, respectively, and in the rural areas were 0.050 °C year−1 and 0.067 °C year−1, respectively, as shown in Table 1. It is well-known that a more apparent increasing trend can appear in the minimum temperature time series than in the maximum temperature records. Similar studies in neighboring regions have shown comparable findings with these results. In Kuwait [102], an investigation of 23-year air temperature data indicated that the minimum temperatures were rising at a significant rate, while the maximum temperatures showed a decreasing trend. This contrast supports a strong signal of the urban effect on temperature trends. Across the eastern Middle East during the period 1983–2012, trends in temperature-related indices were examined [103]. The results showed warming trends throughout the region. The nighttime high-temperature extremes have risen at more than twice their corresponding daytime extremes. The minimum temperature indices exhibited a higher rate of warming than the maximum ones in terms of intensity and frequency. However, unlike the previous studies, Almazroui et al., (2013) [104] conducted a national-scale correlation analysis between urbanization and atmospheric warming in Saudi Arabia by utilizing air temperature data (1981–2010) for 24 weather stations and population census data. They reported that the observed warming is not likely due to the urbanization process. The population increase did not necessarily equate with the rising temperature trend. The largest population growth was observed in two cities whose trends were not the highest. Large warming trends were noticed in sites located near small cities with low population growth. In addition, in the 17 largest Mediterranean cities [105], the comparison between temporal trends of LST and UHI, and urban population changes resulted in poor correlation (R = 0.28). The authors reported that this result was expected because of differences in climatic conditions, city structures, and human activities. We think that changes in population size are not a reasonable indicator of urbanization in most cases.
On the urban/rural comparison basis, the Nile Delta’s urban areas constituted a conspicuous positive UHI over the course of the day. The average annual nocturnal UHI intensity was stronger (3.2 °C) than the diurnal one (2.1 °C), where the average annual LSTs were 17.6 °C and 14.4 °C during the nighttime, and 30.7 °C and 28.6 °C during the daytime for the urban and rural areas, respectively. In general, we found statistically significant (at a +99% confidence level) positive trends in the inter-annual averages of daytime, nighttime, and daily LST records within both urban environments and rural surroundings across the Nile Delta. Based on the TSE, the LST upward trend was greater in the urban areas than in the rural embracing outskirts of the nocturnal (0.078 °C year−1 and 0.067 °C year−1, respectively) and the daily (0.062 °C year−1 and 0.05 °C year−1, respectively) scales. This effect supports the role of urbanization in exacerbating the atmospheric warming in the Nile Delta region, where it is more compatible with the fact that the UHI effect is a nocturnal phenomenon. It is worth mentioning that the consistent LST pattern of the monotonous upward trends within the diversified urban/rural environments emphasized the large-scale nature of the regional atmospheric warming in the Nile Delta. However, the different trend magnitudes for urban and rural LST series pointed out the local contribution of the urban dynamics. So, the total detectable changes in the temperature records are a result of both the background atmospheric factors and the microscale anthropogenic drivers, chiefly the urbanization process.
Our findings concerning the nocturnal UHI and LST trend seem to be geographically dominated in the wider near regions. For example, a unique work [105] analyzed MODIS nighttime data (2001–2012) to investigate the characteristics and trends of the nighttime LST and surface UHI in the 17 largest Mediterranean cities. In general, urban areas exhibited higher LST values compared to non-urban surroundings, forming a UHI effect with an average intensity of 1 °C. The strongest UHI intensities were 3.9 °C, 3.5 °C, and 2.8 °C in Damascus, Alexandria, and Cairo, respectively. A warming trend was found for 82% of the urban areas, while mixed positive and negative trends were detected in non-urban surroundings. An overall increasing rate of a 0.1 °C decade−1 was detected in urban LST. The higher positive trends appeared in the eastern Mediterranean cities, where the Nile Delta extended.
On the other hand, the increasing trend of the diurnal LST records was slightly larger in the rural fringes (0.05 °C year−1) than that found in the urban areas (0.045 °C year−1). This unexpected urban-rural pattern in the diurnal LST trends was noticed in China [53] during the period 1980–2009 using different datasets and methodology. The research used ERA-interim reanalysis datasets of the average air maximum and minimum temperatures and relied on an urban-derived approach to correlate the urban warming to the urban fraction in 10 × 10 km around 753 weather stations. The urban growth enhanced the average minimum temperature by +1.7 ± 0.3 °C, whereas the average maximum temperature trend was slightly declined due to urbanization by −0.4 ± 0.2 °C. However, the study provides no explanation for this situation. A recent study [106] discovered close results when employing similar datasets and procedures to the current study. It utilized two decades (2001–2018) of Aqua/Terra MODIS imagery to investigate the day/night temporal trends in LST and surface UHI for three diverse Indian cities (Lucknow, Kolkata, and Pune). Positive trends of daytime (0.003 to 0.059 °C year−1) and nighttime (0.03 to 0.078 °C year−1) LST records were observed in the cities, except in Pune City where urban cooling was detected during the daytime. The increase in the aerosol concentration, the consequent decrease in surface insolation and air temperature, and expanding the vegetative areas over time were considered the primary reasons for the urban daytime cooling effect in Pune.
Despite the greater nighttime LST trend than the daytime opposite being a well-documented feature of the urban centers, the same daytime/nighttime pattern of LST trend was disclosed in the Nile Delta’s rural area as well. Table 1 shows that the detected trends in the rural LST records were 0.05 °C and 0.067 °C during the day and night, respectively (daily trend 0.059 °C). In fact, this discovery may be substantial proof indicating the contamination of rural environments by the horizontal advection of the urban footprint effect. This was noteworthy enough to make us skeptically reconsider the criteria by which the rural surroundings were chosen as a reference thermal environment to which the urban LST will be compared. For the purpose of verifying and validating our findings, we decided to reiterate the analysis using remoter reference surroundings that are distant enough from the potential contamination that may be caused by the Nile Delta’s urban system. An idealized remote, human-activity-free barren area in the Western Desert was selected, as shown in Figure 1. Interestingly, we almost found the same results where the day/night trends of the desert LST records were 0.048 °C and 0.07 °C (daily average 0.059 °C), so close to the rural reference trend magnitudes formerly reported. This referred to the high trustworthiness of the methodology our research followed and the results we obtained. Furthermore, this discovery distinctly indicated the fact that the greater nocturnal LST trend than the diurnal one is not a rule confined to the urban areas.
Figure 6 presents a per-city assessment of the trend pattern observed in both day/night LST records. It is clear that the first class, in which the nocturnal LST trend is greater than the diurnal LST trend (Figure 6a), is the most common, where it included 68 urban centers or three-quarters of the urban areas. The remaining quarter (23 urban centers) was characterized by a nocturnal LST trend that is less than the diurnal one. All the per-city LST series showed an increasing trend during the day and night. However, just four urban centers had a decreasing trend in the diurnal LST series, including the coastal cities of Gamasa (−0.042 °C), New Damietta (−0.041 °C), Idku (−0.026 °C), and El-Borollos (−0.013 °C) (Figure 6a). It was noted that the results of the four cities were statistically nonsignificant.
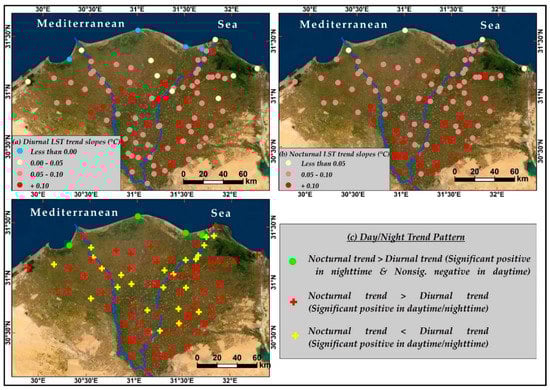
Figure 6.
Per-city assessment of LST trends across Nile Delta (2000–2021), including (a) the annual trend slopes of the diurnal LST, (b) the annual trend slopes of the nocturnal LST, and (c) day/night trend pattern and the relevant statistical significance.
This finding demonstrates the significant role of the Mediterranean Sea in modulating urban warming during the daytime. This role during the daytime can be proved as well by the megacity of Alexandria. Among the 91 urban centers under investigation, Alexandria City has the largest built-up area (roughly 285.1 sq. km), population size (more than 5 million inhabitants), and the greatest annual rate of urban growth (6.2 sq km year−1), as shown in Figure 1 and Figure 4. However, its annual trend slope of the diurnal LST was just 0.021 °C, making it one of the modest urban centers with an upward LST trend, as shown in Figure 6a. This can be chiefly explained by its coastal location in the northwesternmost point of the study area, where it immediately overlooks the sea. In the nighttime, Figure 6b stressed the same effect of the Mediterranean Sea. It is clear that there was a remarkable spatial pattern, in which the per-city annual magnitude (in terms of TSE slope) of the nocturnal LST trend decreased in a generally south–north direction. This distribution largely agrees with the maritime influence blowing from the north. Furthermore, this role of the Mediterranean Sea is expected to be maximized because of the function of the prevailing northwesterly and northerly winds in transferring the maritime effect into the coastal urban areas.
Evaluating the association between the maritime effects, in terms of the distance between each city and the Mediterranean Sea coast, and the magnitudes of LST trends using the Kendall correlation, unveiled a stronger positive connection between the two variables during the nighttime (R = 0.67) than the daytime (R = 0.33). These significant correlations (p-values < 0.0001) pointed out that the proximity to the maritime influences of the Mediterranean Sea can explain 45% of the nighttime LST trend and 11% of the daytime LST trend, as suggested by the coefficient of determination. Linear regression analysis of the cities’ proximities to the Mediterranean Sea (independent variable) against their LST trends (dependent variable) showed that the magnitude of the diurnal LST trends increased more rapidly than the nocturnal LST trends with increasing the distance by which the city is far from the sea. The increasing rates of LST trends were 0.005 °C per 10 km and 0.004 °C per 10 km in diurnal and nocturnal LST trends, respectively. Consequently, the Mediterranean Sea and the related maritime leverage can be considered an anti-urbanization moderator for the urban warming across the Nile Delta.
From the same perspective, the warming–limiting influence is expected to be found in the urban centers located immediately beside or around the water surfaces of the Nile Delta branches, i.e., the Rosetta and Damietta distributaries. It is worth noting that most of the urban areas (16 out of 23) with a nocturnal LST trend less than the diurnal one are located along the Rosetta and Damietta distributaries, as shown in Figure 6c. The concentrated distribution pattern of such urban centers along the Nile River’s channels is consistent with the above-mentioned discovery indicating that the water moderating effect is greater in the nighttime than in the daytime. Since the riverine urban centers are subjected to double water influence by the Mediterranean Sea and the Nile River, this is probably the reason for reducing the nocturnal warming trend than the diurnal one in these centers. It should be confirmed that the water influence of the Nile River is less noticeable than that produced by the Mediterranean Sea as suggested by the water body characteristics, e.g., surface area, water depth, and salinity.
Regarding the urbanization–warming nexus, measuring the bivariate linear relationship using the nonparametric Kendall rank correlation analysis, as shown in Figure 7, unveiled a direct positive relationship between the annual urban expansion and urban LST records. It was remarkable that the strength of association is stronger (the correlation coefficient R = 0.7) in the case of nighttime LST values, and weaker (R = 0.43) during the daytime, with an average R of 0.62 in the daily LST dataset. The relevant coefficients of determination (R2) were 0.49, 0.18, and 0.38 in the nighttime, daytime, and daily relationships, respectively. All results were dependable in terms of the statistical significance at a confidence level of 99%, where the supplied p-values were <0.001 for all variables. This discovery emphasized that the urbanization effect on temperature change throughout the region is a substantial phenomenon. Interpretation of the coefficients of determination (R2) suggested that urban dynamics have weak-to-moderate effects on the urban LST datasets, where these dynamics can explain just 18%, 49%, and 38% of the inter-annual variations observed in the urban LST records collected throughout the daytime, nighttime, and daily, respectively. This non-strong relationship between annual urban sprawl and urban LST time series was expected, where temporal changes in LST are caused not only by such urban expansion but also by various biophysical and anthropogenic forcing factors. However, the stronger connection between urbanization rates and nighttime LSTs than that in daytime ones can be considered as hard evidence of the urbanization signals in the Nile Delta’s LST records. The preponderance of evidence refers that man-made agents, particularly urban dynamics, are mostly responsible for this warming. This is because the urbanization effect on temperature and the relevant UHI pattern is fundamentally a nocturnal phenomenon [107,108,109,110,111] that is attributable to the differential urban/rural cooling (rather than heating) rates, the high thermal inertia of concrete and asphalt materials used in urban constructions, and the anthropogenic heat emissions from transportation, residential and commercial buildings, power plants, and industrial zones.
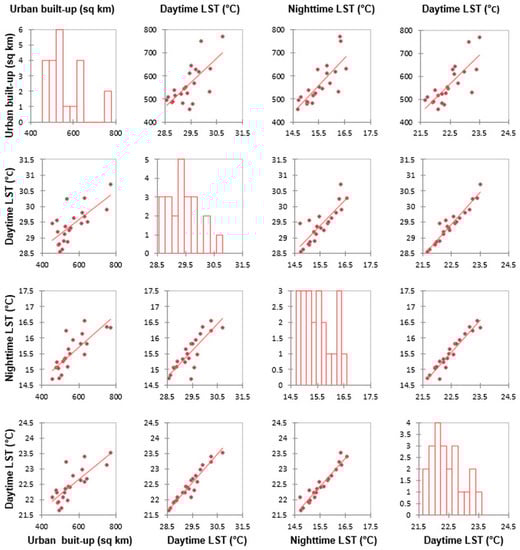
Figure 7.
Scatter plots and best-fit trend lines depicting the bivariate association of the annual urban expansions against the Nile Delta’s diurnal, nocturnal, and daily LST time series (2000–2021).
3.3. Urban Bias Estimation and Removal
The discovered findings in Section 3.1 and Section 3.2 explicitly indicated that urban dynamics have had a profound impact on the Nile Delta temperature records over time. The urbanization signals in the LST time series included a greater upward trend in the nighttime than daytime LST records, larger urban warming than what existed in the surrounding rural environments, and finally the statistically inferred urbanization–warming nexus. Consequently, it is critical for studies concerning sustainability and climate change impact assessment in the region to accurately provide basic quantification of the background temperature change over time through estimating and removing the local urban bias contaminating the temperature time series. This removal has the ability of refining temperature records from the possible overestimations of trend analysis resulting from the urban influence.
Table 2 provides the observed day/night annual LST averages for the Nile Delta’s urban/rural areas, the calculated year-to-year averages of UHI intensities, and the bias-free LST record of the urban areas. Screening the annual averages of the observed LST values suggested that urban LSTs were always greater than the rural ones, whether during the day or night hours. Diurnally, the urban/rural LST averages ranged between 29/27.9 °C and 31.6/29.7 °C, respectively. At nighttime, the lowest urban/rural LST averages were 16.7/13.6 °C, and the highest values were 18.6/15.3 °C, respectively. Accordingly, the Nile Delta’s urban areas formed a positive UHI with average annual intensities between 1.7 °C and 2.5 °C during the day, and 2.9 °C and 3.6 °C at night. This implicitly denoted that there were annual urban-induced biases in the Nile Delta urban thermal environment by about the same magnitudes of the above-mentioned UHI intensity. The average annual nocturnal bias was stronger (3.2 °C) than the diurnal one (2.1 °C), where the average annual LSTs were 17.6 °C and 14.4 °C during the nighttime, and 30.7 °C and 28.6 °C during the daytime for the urban and rural areas, respectively.
Table 2.
The observed annual averages of the Terra/Aqua LST collected for the Nile Delta’s urban/rural areas during the daytime and nighttime. The table also contains the calculated year-to-year averages of UHI intensities, and the bias-free LST record of the urban areas.
With regard to the urban-derived bias observed in the temporal trend, the analysis revealed that there have been significantly increasing trends in LST records measured across the Nile Delta’s urban/rural areas during the study period (2000–2021). The greater slope of the urban LST trend (0.078 °C year−1) than the rural LST trend (0.067 °C year−1) throughout the nighttime indicated that there was a micro-scale bias in urban LST records across the Nile Delta by about 0.011 °C year−1, which caused total additional warming in the urban environment (overall warming 1.638 °C) compared to the rural surroundings (overall warming 1.407 °C) by about 0.231 °C during the period 2000–2021. This spurious urban-made warming trend constituted about 14.1% of the overall detectable warming in the Nile Delta’s urban system. The urbanization influence on the nocturnal LST trend can also be noticed from the increasing trend of the nocturnal UHI intensity (bias), estimated by 0.017 °C year−1 (the total trend was 0.357 °C), as shown in Table 2 and Figure 8. Based on the UHI intensity trend of 0.017 °C year−1, the urban bias in the nocturnal LST record can be estimated to be 21.8% of the total observed warming in the Nile Delta.
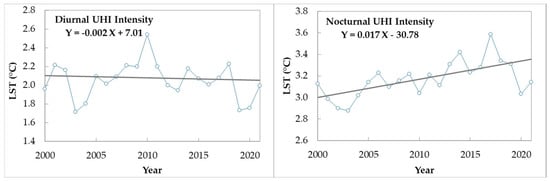
Figure 8.
Trend analysis using MKT of the diurnal and nocturnal UHI intensity/bias across the Nile Delta (2000–2021).
Contrary to the nighttime record, the investigation discovered an unexpected cooling bias in the daytime LST record of the Nile Delta, where the observed diurnal trends were 0.045 °C year−1 and 0.05 °C year−1 in the urban areas and rural outskirts, respectively. This means that the urbanization process was responsible for diminishing the diurnal LST trend in the urban areas by about −0.005 °C less than in the rural areas. Hence, the overall warming trend in the urban areas of 0.945 °C throughout the study period was underestimated by about 0.105 °C (11.1%) compared to the overall increasing trend of 1.05 °C in the rural surroundings. This was emphasized by the decreasing trend of the diurnal UHI intensity/bias by −0.002 °C year−1 (the total trend was −0.042 °C), Table 2 and Figure 8. Considering the UHI intensity trend of −0.002 °C year−1, the urban bias in the diurnal LST record can be calculated to be just 4.4% of the total observed warming in the Nile Delta.
In Table 2, estimations of the urban biases caused by both annual UHI intensity and inter-annual UHI trend were calculated for each year, 2000–2021, using Equations (9)–(12). The observed diurnal/nocturnal LSTs were then corrected with the aid of a bias-removal adjustment process for each annual LST average. As mentioned earlier, all the yearly bias estimates were always greater than zero and have grown since the year 2000. This process of correcting the temperature records across the Nile Delta is highly recommended as an initial preprocessing for studies of climate-related sustainability and climate change impact assessment. After the correction procedure, the diurnal LST record of the urban areas has increased to reverse the cooling urban effect during the daytime, whilst the nocturnal LST record has decreased to remove the local urban warming.
Although the urban cooling effect in the daytime LST trend was tiny, it was also completely unexpected. This was fundamentally because of the strong positive heat island the urban areas formed in the Nile Delta region, as illustrated in Table 2. Within the diurnal division of the day, it was clear that the urban settlements were always warmer than their rural envelopes throughout the study period, in which the UHI intensity oscillated between its minimum strength of 1.7 °C in 2003, and the maximum strength of 2.5 °C in 2010. This conflict in urban effects among the positive intensities of annual UHI and the negative trend of inter-annual UHI needs further research to be diagnosed and clarified. As a tentative attribution of the diurnal urban cooling effect through time, we suggest the increasing shading effect within the urban environment by buildings. Another possible cause is the thermal inertia, i.e., the ability of urban material to absorb heat and store it subsurface during the daytime, then release it later in the nighttime. This effect delays thermal sensation and prevents overheating during daytime hours. In addition, the elevated levels of the man-made pollutants and aerosols in the urban canopy and boundary layers can increase the atmospheric albedo in the city rather than in the rural areas.
The same phenomenon was noticed in China [53] during the period 1980–2009 using different datasets and methodology. The research used ERA-interim reanalysis datasets of the average air maximum and minimum temperatures and relied on an urban-derived approach to correlate the urban warming to the urban fraction in 10 × 10 km around 753 weather stations. The urban growth enhanced the average minimum temperature by +1.7 °C ±0.3 °C, whereas the average maximum temperature trend declined slightly because of urbanization by −0.4 °C ±0.2 °C. Based on this estimation, the local urban warming represented about 9% of the overall regional warming trend in minimum temperature and reduced the maximum temperature trend by 4%. However, the study provides no explanation for this. A promising study [106] utilized two decades (2001–2018) of Aqua/Terra MODIS imagery to investigate the day/night temporal trends in LST and surface UHI for three diverse Indian cities (Lucknow, Kolkata, and Pune). Positive trends in the inter-annual averages of daytime (0.003 to 0.059 °C/year) and nighttime (0.030 to 0.078 °C/year) LST records were observed in the cities, except in Pune City where urban cooling was detected during the daytime. The increase in the aerosol concentration, the consequent decrease in surface insolation and air temperature, and expanding the vegetative areas over time were considered as the primary reasons for the urban daytime cooling effect in Pune. Nighttime UHI was positive for all cities (mean annual intensities ranged from 1.34 °C to 2.07 °C). Statistically significant upward trends were observed in mean annual UHI intensity (0.009 °C/year to 0.022 °C/year) for Kolkata and Pune. A downward trend was observed over Lucknow.
The discoveries of this study were found to partially support the numerous investigations adopting the significance of the urbanization process and the UHI effect on the temperature records. For example, early studies assessed the significance of warming produced by the local urbanization effect on large-scale mean temperature time series. The urban bias was identified by about just 0.1 °C in the Northern Hemispheric landmass’s temperature datasets during 1904–1984 [39] and ranged between 0.15–0.26 °C/30 years in China’s northern plains (1954–1983) using a statistical methodology of the rank-score procedure [45]. In South Korea [44], estimations of urban trends were positive, indicating an increasing trend in the urban bias over time. Warming trends oscillated from 0.039 °C/year to 0.042 °C/year in the urban stations, while the rural areas had the minimum trend magnitude (0.028 °C/year). Lately, in Great Britain, urbanization’s contribution to atmospheric warming in the daily mean temperature was computed to be 0.02–0.06 °C (1961–2015) by utilizing a statistical model linking the UHI intensity with urban fraction and wind speed. More recently, 42 weather stations (2009–2018) in the western Yangtze River Delta were selected to analyze the environmental factors dominating within a 5 km buffer around the old and new station locations based on remote sensing technology [32]. The multiple linear regression models between temperature data and the 17 environmental conditions were efficient to correct the urbanization effect with an error range of 3.66–18.21%, and an average error of 10.09%.
However, the upward LST trend of the Nile Delta’s urban areas at a smaller magnitude than the nearby countryside in the daytime datasets minifies the urban contribution to the climate change issue. The underestimation of the urban role in changing the temperature record over time is a scientific thought that was suggested by some previous studies to the degree that the urban effect can be fully neglected. This premise was reinforced by analysis over the globe [51,112], world lands [113,114,115,116], global rural areas [117], and the contiguous United States [46].
4. Conclusions
Under the circumstances of the paramount importance of the Nile Delta and its high vulnerability to climate change and the relevant negative environmental impacts, and the sharp insufficiency of the ground meteorological network, the main objectives of the study were to employ the available satellite-based products of Aqua/Terra LSTs and Landsat GAIA settlement coverage to detect and monitor urban dynamics across the Nile Delta, explore the relevant changes in day/night and urban/rural temperature records, and assess the possible local urban bias in those records. It was found that the region has been subjected to an intensified LULC change because of the rapid urbanization resulting from accelerated population growth. A dramatic increase in urban areas has taken place at the expense of the rural fringes throughout the Nile Delta. The total urban expansion was greater than two-thirds (69.1%) of the original urban area in 2000. This was accompanied by a notable warming trend in the day/night and urban/rural LST records. The nocturnal LST exhibited a warming tendency (0.072 °C year−1) larger than the diurnal equivalent (0.065 °C year−1). The urban–rural comparison approach disclosed that the urbanization process caused a warming bias in the nighttime LST trend by 0.017 °C year−1 (21.8%) and a cooling bias in the daytime by −0.002 °C year−1 (4.4%). Correlation analysis detected a positive nexus between the urban dynamics and LST trends. All the results were statistically significant at a confidence level of 99%, where the p-value was always equal to 0.01 or less.
Based on these findings, the key research contribution was to provide accurate quantification of the temperature change across the region. Identifying the local urban warming/cooling effect enables applying corrections to temperature records to estimate the actual regional climate change. This separation of local and regional components of the temperature change is of critical importance in the subsequent investigations concerning the climate change impact assessment and sustainable development in the region. Conducting the analysis in both daytime and nighttime scales enriched the research results and widened its applicability. It should be noted that urban sprawl is a substantial factor causing temperature change over time and space. There are other driving factors controlling such changes, such as sea–land interaction, the water body of the Nile River, micro-scale aspects of climate, LULC types, building geometry, and anthropogenic heat emissions. The current study’s scope focused on urban sprawl as a reliable measure of urban dynamics, in addition to some other mechanisms, including the maritime role, the Nile River effect, and the prevailing winds. However, the concentrated domain of the study has no effect on introducing uncertainty in the key research findings, i.e., the temperature trend analysis and temperature record adjustments. The other driving factors of temporal temperature change could be a topic for future research, particularly the LULC change. Promising research works can integrate all measures of urban dynamics, e.g., intra-urban surface configuration [118], population growth [104], and built-up sprawl, to provide a holistic assessment of the urbanization–warming nexus.
The study concluded that the urban dynamic process, in terms of city sprawl, is a dominant, substantial degradation mechanism of the urban thermal environments. It can prompt a significant micro-scale bias in the temperature records of the Nile Delta cities. Therefore, discriminating the local-to-regional components of these records is an indispensable prior requirement to provide accurate quantification of the macro-scale climate change acting as an integral basis for studies of sustainability and climate change impacts assessment.
Author Contributions
Conceptualization, W.A.; methodology, W.A. and I.H.; software, I.H.; formal analysis, W.A. and I.H.; investigation, W.A.; resources, I.H.; data curation, I.H.; writing—original draft preparation, W.A.; writing—review and editing, W.A.; visualization, W.A. and I.H.; supervision, W.A.; funding acquisition, W.A. All authors have read and agreed to the published version of the manuscript.
Funding
This research was funded by Mansoura University, Egypt.
Conflicts of Interest
The authors declare no conflict of interest. The funder had no role in the design of the study, in the collection, analyses, or interpretation of data, in the writing of the manuscript, or in the decision to publish the results.
References
- Stanley, D.J.; Warne, A.G. Nile Delta in its Destruction Phase. J. Coast. Res. 1998, 14, 794–825. Available online: https://www.jstor.org/stable/4298835 (accessed on 28 March 2022).
- Fishar, M.R. Nile Delta (Egypt). In The Wetland Book: II: Distribution, Description, and Conservation; Finlayson, C.M., Milton, G.R., Prentice, R.C., Davidson, N.C., Eds.; Springer: Dordrecht, The Netherlands, 2018; pp. 1251–1260. [Google Scholar]
- IPCC. Climate Change: The IPCC Impacts Assessment. Canberra. 1990. Available online: https://www.ipcc.ch/site/assets/uploads/2018/03/ipcc_far_wg_II_full_report.pdf (accessed on 2 April 2022).
- IPCC. Climate Change 1995: Impacts, Adaptations and Mitigation of Climate Change: Scientific-Technical Analyses. Cambridge. 1995. Available online: https://www.ipcc.ch/site/assets/uploads/2018/03/ipcc_sar_wg_II_full_report.pdf (accessed on 2 April 2022).
- IPCC. Climate Change 2022: Impacts, Adaptation, and Vulnerability. Cambridge. 2022. Available online: https://www.ipcc.ch/report/ar6/wg2/downloads/report/IPCC_AR6_WGII_FinalDraft_FullReport.pdf. (accessed on 2 April 2022).
- IPCC. The Regional Impact of Climate Change: An Assessment of Vulnerability. Cambridge. 1997. Available online: https://www.ipcc.ch/site/assets/uploads/2020/11/The-Regional-Impact.pdf (accessed on 2 April 2022).
- IPCC. Climate Change 2001: Impacts, Adaptation, and Vulnerability. Cambridge. 2001. Available online: https://www.ipcc.ch/site/assets/uploads/2018/03/WGII_TAR_full_report-2.pdf (accessed on 2 April 2022).
- IPCC. Climate Change 2007: Impacts, Adaptation and Vulnerability. Cambridge. 2007. Available online: https://www.ipcc.ch/site/assets/uploads/2018/03/ar4_wg2_full_report.pdf (accessed on 2 April 2022).
- IPCC. Climate Change 2014: Impacts, Adaptation, and Vulnerability. Part A: Global and Sectoral Aspects. Contribution of Working Group II to the Fifth Assessment Report of the Intergovernmental Panel on Climate Change. Cambridge. 2014. Available online: https://www.ipcc.ch/site/assets/uploads/2018/02/WGIIAR5-PartA_FINAL.pdf (accessed on 2 April 2022).
- IPCC. Climate Change 2014: Impacts, Adaptation, and Vulnerability. Part B: Regional Aspects. Contribution of Working Group II to the Fifth Assessment Report of the Intergovernmental Panel on Climate Change. Cambridge. 2014. Available online: https://www.ipcc.ch/site/assets/uploads/2018/02/WGIIAR5-Chap21_FINAL.pdf (accessed on 2 April 2022).
- FAO. Climate Change and Food Security: Risks and Responses. Rome. 2015. Available online: https://www.fao.org/3/i5188e/I5188E.pdf (accessed on 4 April 2022).
- Ammann, P.; Dietler, D.; Winkler, M.S. Health impact assessment and climate change: A scoping review. J. Clim. Chang Health 2021, 3, 100045. [Google Scholar] [CrossRef]
- Maldonado-Erazo, C.P.; Álvarez-García, J.; Río-Rama, M.D.L.C.D.; Durán-Sánchez, A. Scientific Mapping on the Impact of Climate Change on Cultural and Natural Heritage: A Systematic Scientometric Analysis. Land 2021, 10, 76. [Google Scholar] [CrossRef]
- Chapman, A.; Darby, S. Evaluating sustainable adaptation strategies for vulnerable mega-deltas using system dynamics modelling: Rice agriculture in the Mekong Delta’s An Giang Province, Vietnam. Sci. Total Environ. 2016, 559, 326–338. [Google Scholar] [CrossRef] [PubMed]
- Szabo, S.; Brondizio, E.; Renaud, F.G.; Hetrick, S.; Nicholls, R.J.; Matthews, Z.; Tessler, Z.; Tejedor, A.; Sebesvari, Z.; Foufoula-Georgiou, E.; et al. Population dynamics, delta vulnerability and environmental change: Comparison of the Mekong, Ganges–Brahmaputra and Amazon delta regions. Sustain. Sci. 2016, 11, 539–554. [Google Scholar] [CrossRef]
- Cazcarro, I.; Arto, I.; Hazra, S.; Bhattacharya, R.N.; Adjei, P.O.-W.; Ofori-Danson, P.K.; Asenso, J.K.; Amponsah, S.K.; Khondker, B.; Raihan, S.; et al. Biophysical and Socioeconomic State and Links of Deltaic Areas Vulnerable to Climate Change: Volta (Ghana), Mahanadi (India) and Ganges-Brahmaputra-Meghna (India and Bangladesh). Sustainability 2018, 10, 893. [Google Scholar] [CrossRef]
- Arto, I.; García-Muros, X.; Cazcarro, I.; González-Eguino, M.; Markandya, A.; Hazra, S. The socioeconomic future of deltas in a changing environment. Sci. Total Environ. 2018, 648, 1284–1296. [Google Scholar] [CrossRef]
- El-Nahry, A.H.; Doluschitz, R. Climate change and its impacts on the coastal zone of the Nile Delta, Egypt. Environ. Earth Sci. 2009, 59, 1497–1506. [Google Scholar] [CrossRef]
- Abutaleb, K.A.A.; Mohammed, A.H.E.-S.; Ahmed, M.H.M. Climate Change Impacts, Vulnerabilities and Adaption Measures for Egypt’s Nile Delta. Earth Syst. Environ. 2018, 2, 183–192. [Google Scholar] [CrossRef]
- Kassem, H.S.; Bello, A.R.S.; Alotaibi, B.M.; Aldosri, F.O.; Straquadine, G.S. Climate Change Adaptation in the Delta Nile Region of Egypt: Implications for Agricultural Extension. Sustainability 2019, 11, 685. [Google Scholar] [CrossRef]
- Gouda, D.M. Climate Change, Agriculture and Rural Communities’ Vulnerability in the Nile Delta BT—Climate Change Impacts on Agriculture and Food Security in Egypt: Land and Water Resources—Smart Farming—Livestock, Fishery, and Aquaculture; Omran, E.-S.E., Negm, A.M., Eds.; Springer International Publishing: Cham, Switzerland, 2020; pp. 525–576. [Google Scholar]
- Kalnay, E.; Cai, M. Impact of urbanization and land-use change on climate. Nature 2003, 423, 528–531. [Google Scholar] [CrossRef] [PubMed]
- Zhao, M.; Zhou, Y.; Li, X.; Cheng, W.; Zhou, C.; Ma, T.; Li, M.; Huang, K. Mapping urban dynamics (1992–2018) in Southeast Asia using consistent nighttime light data from DMSP and VIIRS. Remote Sens. Environ. 2020, 248, 111980. [Google Scholar] [CrossRef]
- Zhao, M.; Cheng, C.; Zhou, Y.; Li, X.; Shen, S.; Song, C. A global dataset of annual urban extents (1992–2020) from harmonized nighttime lights. Earth Syst. Sci. Data 2022, 14, 517–534. [Google Scholar] [CrossRef]
- Vasisith, S. Detecting Urban Sprawl in the Middle Nile Delta Region to Assess the Effects on Egypt’s Agriculture; Central European University: Budapest, Hungary, 2018. [Google Scholar]
- Radwan, T.M.; Blackburn, G.A.; Whyatt, J.D.; Atkinson, P.M. Dramatic Loss of Agricultural Land Due to Urban Expansion Threatens Food Security in the Nile Delta, Egypt. Remote Sens. 2019, 11, 332. [Google Scholar] [CrossRef]
- Yang, L.; Qian, F.; Song, D.-X.; Zheng, K.-J. Research on Urban Heat-Island Effect. Procedia Eng. 2016, 169, 11–18. [Google Scholar] [CrossRef]
- De Almeida, C.R.; Teodoro, A.C.; Gonçalves, A. Study of the Urban Heat Island (UHI) Using Remote Sensing Data/Techniques: A Systematic Review. Environments 2021, 8, 105. [Google Scholar] [CrossRef]
- Rossi, F.; Cardinali, M.; Gambelli, A.M.; Filipponi, M.; Castellani, B.; Nicolini, A. Outdoor thermal comfort improvements due to innovative solar awning solutions: An experimental campaign. Energy Build. 2020, 225, 110341. [Google Scholar] [CrossRef]
- Karl, T.R.; Jones, P.D. Urban Bias in Area-averaged Surface Air Temperature Trends. Bull. Am. Meteorol. Soc. 1989, 70, 265–270. [Google Scholar] [CrossRef]
- Ya, Z. Identifying and Correcting Urban Bias for Regional Surface Air Temperature Series of North China over Period of 196Q_2000. Clim. Environ. Res. 2005, 10, 743–753. [Google Scholar]
- Shi, T.; Huang, Y.; Sun, D.; Lu, G.; Yang, Y. A New Method for Correcting Urbanization-Induced Bias in Surface Air Temperature Observations: Insights From Comparative Site-Relocation Data. Front. Environ. Sci. 2021, 9, 625418. [Google Scholar] [CrossRef]
- Janis, M.J. Observation-Time-Dependent Biases and Departures for Daily Minimum and Maximum Air Temperatures. J. Appl. Meteorol. 2002, 41, 588–603. Available online: http://www.jstor.org/stable/26184999 (accessed on 20 March 2022). [CrossRef]
- Vose, R.S.; Williams, C.N.; Peterson, T.C.; Karl, T.R.; Easterling, D.R. An evaluation of the time of observation bias adjustment in the U.S. Historical Climatology Network. Geophys. Res. Lett. 2003, 30, 2046. [Google Scholar] [CrossRef]
- Böhm, R.; Jones, P.D.; Hiebl, J.; Frank, D.; Brunetti, M.; Maugeri, M. The early instrumental warm-bias: A solution for long central European temperature series 1760–2007. Clim. Chang. 2010, 101, 41–67. [Google Scholar] [CrossRef]
- Dienst, M.; Lindén, J.; Engström, E.; Esper, J. Removing the relocation bias from the 155-year Haparanda temperature record in Northern Europe: Removing the relocation bias from a 155-year temperature record. Int. J. Climatol. 2017, 37, 4015–4026. [Google Scholar] [CrossRef]
- Kukla, G.; Gavin, J.; Karl, T.R. Urban Warming. J. Clim. Appl. Meteorol. 1986, 25, 1265–1270. [Google Scholar] [CrossRef]
- Karl, T.R.; Diaz, H.F.; Kukla, G. Urbanization: Its Detection and Effect in the United States Climate Record. J. Clim. 1988, 1, 1099–1123. [Google Scholar] [CrossRef]
- Jones, P.D.; Kelly, P.M.; Goodess, C.M.; Karl, T. The Effect of Urban Warming on the Northern Hemisphere Temperature Average. J. Clim. 1989, 2, 285–290. Available online: http://www.jstor.org/stable/26195817 (accessed on 1 March 2022). [CrossRef]
- Landsberg, H.E. The Climate of Towns. Man’s Role in Changing the Face of the Earth; Hutchinson: London, UK, 1956; pp. 584–603. [Google Scholar]
- Ren, G.; Zhou, Y.; Chu, Z.; Zhou, J.; Zhang, A.; Guo, J.; Liu, X. Urbanization Effects on Observed Surface Air Temperature Trends in North China. J. Clim. 2008, 21, 1333–1348. [Google Scholar] [CrossRef]
- Wang, J.; Yan, Z.-W. Urbanization-related warming in local temperature records: A review. Atmos. Ocean. Sci. Lett. 2015, 9, 129–138. [Google Scholar] [CrossRef]
- Brázdil, R.; Budíková, M. An urban bias in air temperature fluctuations at the Klementinum, Prague, The Czech Republic. Atmos. Environ. 1999, 33, 4211–4217. [Google Scholar] [CrossRef]
- Choi, Y.; Jung, H.-S.; Nam, K.-Y.; Kwon, W.-T. Adjusting urban bias in the regional mean surface temperature series of South Korea, 1968–1999. Int. J. Clim. 2003, 23, 577–591. [Google Scholar] [CrossRef]
- Portman, D.A. Identifying and Correcting Urban Bias in Regional Time Series: Surface Temperature in China’s Northern Plains. J. Clim. 1993, 6, 2298–2308. [Google Scholar] [CrossRef]
- Peterson, T.C. Assessment of Urban Versus Rural In Situ Surface Temperatures in the Contiguous United States: No Difference Found. J. Clim. 2003, 16, 2941–2959. [Google Scholar] [CrossRef]
- Manalo, J.A.; Matsumoto, J.; Takahashi, H.G.; Ii, M.Q.V.; Olaguera, L.M.P.; Ren, G.; Cinco, T.A. The effect of urbanization on temperature indices in the Philippines. Int. J. Clim. 2021, 42, 850–867. [Google Scholar] [CrossRef]
- Zhang, P.; Ren, G.; Qin, Y.; Zhai, Y.; Zhai, T.; Tysa, S.K.; Xue, X.; Yang, G.; Sun, X. Urbanization Effects on Estimates of Global Trends in Mean and Extreme Air Temperature. J. Clim. 2021, 34, 1923–1945. [Google Scholar] [CrossRef]
- Epperson, D.L.; Davis, J.M.; Bloomfield, P.; Karl, T.R.; McNab, A.L.; Gallo, K.P. Estimating the Urban Bias of Surface Shelter Temperatures Using Upper-Air and Satellite Data. Part I: Development of Models Predicting Surface Shelter Temperatures. J. Appl. Meteorol. 1995, 34, 340–357. [Google Scholar] [CrossRef]
- Epperson, D.L.; Davis, J.M.; Bloomfield, P.; Karl, T.R.; McNab, A.L.; Gallo, K.P. Estimating the Urban Bias of Surface Shelter Temperatures Using Upper-Air and Satellite Data. Part II: Estimation of the Urban Bias. J. Appl. Meteorol. 1995, 34, 358–370. [Google Scholar] [CrossRef]
- Parker, D.E. Urban heat island effects on estimates of observed climate change. WIREs Clim. Chang. 2009, 1, 123–133. [Google Scholar] [CrossRef]
- Yuan, Z.; Guo-Yu, R.E.N. Correcting urban bias for surface air temperature series of Beijing Station over time period 1915–2012. Chin. J. Geophys. 2014, 57, 2197–2207. (In Chinese) [Google Scholar] [CrossRef]
- Wang, J.; Tett, S.F.B.; Yan, Z. Correcting urban bias in large-scale temperature records in China, 1980-2009. Geophys. Res. Lett. 2017, 44, 401–408. [Google Scholar] [CrossRef]
- Hamdi, R.; Van De Vyver, H. Estimating urban heat island effects on near-surface air temperature records of Uccle (Brussels, Belgium): An observational and modeling study. Adv. Sci. Res. 2011, 6, 27–34. [Google Scholar] [CrossRef]
- Bassett, R.; Young, P.J.; Blair, G.S.; Cai, X.-M.; Chapman, L. Urbanisation’s contribution to climate warming in Great Britain. Environ. Res. Lett. 2020, 15, 114014. [Google Scholar] [CrossRef]
- National Research Council; Division on Earth and Life Studies; Board on Atmospheric Sciences and Climate; Committee on Scientific Accomplishments of Earth Observations from Space. Earth Observations from Space: The First 50 Years of Scientific Achievements; National Academies Press: Washington, DC, USA, 2008.
- Li, G.; Cao, C. Development of environmental monitoring satellite systems in China. Sci. China Earth Sci. 2010, 53, 1–7. [Google Scholar] [CrossRef]
- Guo, H.-D.; Zhang, L.; Zhu, L.-W. Earth observation big data for climate change research. Adv. Clim. Chang. Res. 2015, 6, 108–117. [Google Scholar] [CrossRef]
- Young, R.; Onoda, M. Satellite Earth Observations in Environmental Problem-Solving BT—Satellite Earth Observations and Their Impact on Society and Policy; Springer: Singapore, 2017; pp. 3–27. [Google Scholar]
- Andries, A.; Murphy, R.J.; Morse, S.; Lynch, J. Earth Observation for Monitoring, Reporting, and Verification within Environmental Land Management Policy. Sustainability 2021, 13, 9105. [Google Scholar] [CrossRef]
- Huzui, A.E.; Abdelkader, A.; Pătru-Stupariu, I. Analysing urban dynamics using multi-temporal satellite images in the case of a mountain area, Sinaia (Romania). Int. J. Digit. Earth 2013, 6, 563–579. [Google Scholar] [CrossRef]
- Cao, W.; Zhou, Y. Remote Sensing of Urban Dynamics. In Landscape and Land Capacity; Taylor & Francis Group: Abingdon, UK, 2020; pp. 387–391. [Google Scholar]
- Chaudhuri, G.; Mainali, K.P.; Mishra, N.B. Analyzing the dynamics of urbanization in Delhi National Capital Region in India using satellite image time-series analysis. Environ. Plan. B Urban Anal. City Sci. 2021, 49, 368–384. [Google Scholar] [CrossRef]
- Lin, X.; Xu, M.; Cao, C.; Singh, R.P.; Chen, W.; Ju, H. Land-Use/Land-Cover Changes and Their Influence on the Ecosystem in Chengdu City, China during the Period of 1992–2018. Sustainability 2018, 10, 3580. [Google Scholar] [CrossRef]
- Twisa, S.; Buchroithner, M.F. Land-Use and Land-Cover (LULC) Change Detection in Wami River Basin, Tanzania. Land 2019, 8, 136. [Google Scholar] [CrossRef]
- Inalpulat, M.; Genc, L. Quantification of LULC Changes and Urbanization Effects on Agriculture Using Historical Landsat Data in North-West Anatolia, Turkey. Pol. J. Environ. Stud. 2021, 30, 3999–4007. [Google Scholar] [CrossRef]
- Kuenzer, C.; Dech, S. (Eds.) Thermal Infrared Remote Sensing: Sensors, Methods, Applications, 1st ed.; Springer: Dordrecht, The Netherlands, 2013. [Google Scholar]
- Tang, H.; Li, Z.-L. Quantitative Remote Sensing in Thermal Infrared: Theory and Applications; Springer: Berlin/Heidelberg, Germany, 2014. [Google Scholar]
- Weng, Q.; Larson, R.C. Satellite Remote Sensing of Urban Heat Islands: Current Practice and Prospects BT—Geo-Spatial Technologies in Urban Environments; Jensen, R.R., Gatrell, J.D., McLean, D.D., Eds.; Springer: Berlin/Heidelberg, Germany, 2005; pp. 91–111. [Google Scholar]
- Imhoff, M.L.; Zhang, P.; Wolfe, R.E.; Bounoua, L. Remote sensing of the urban heat island effect across biomes in the continental USA. Remote Sens. Environ. 2010, 114, 504–513. [Google Scholar] [CrossRef]
- Zhou, D.; Xiao, J.; Bonafoni, S.; Berger, C.; Deilami, K.; Zhou, Y.; Frolking, S.; Yao, R.; Qiao, Z.; Sobrino, J.A. Satellite Remote Sensing of Surface Urban Heat Islands: Progress, Challenges, and Perspectives. Remote Sens. 2019, 11, 48. [Google Scholar] [CrossRef]
- Abulibdeh, A. Analysis of urban heat island characteristics and mitigation strategies for eight arid and semi-arid gulf region cities. Environ. Earth Sci. 2021, 80, 259. [Google Scholar] [CrossRef]
- Hung, T.; Uchihama, D.; Ochi, S.; Yasuoka, Y. Assessment with satellite data of the urban heat island effects in Asian mega cities. Int. J. Appl. Earth Obs. Geoinf. 2006, 8, 34–48. [Google Scholar] [CrossRef]
- Zhou, D.; Zhao, S.; Zhang, L.; Sun, G.; Liu, Y. The footprint of urban heat island effect in China. Sci. Rep. 2015, 5, 11160. [Google Scholar] [CrossRef]
- Sfîcă, L.; Ichim, P.; Apostol, L.; Ursu, A. The extent and intensity of the urban heat island in Iași city, Romania. Arch. Meteorol. Geophys. Bioclimatol. Ser. B 2017, 134, 777–791. [Google Scholar] [CrossRef]
- Qiao, Z.; Wu, C.; Zhao, D.; Xu, X.; Yang, J.; Feng, L.; Sun, Z.; Liu, L. Determining the Boundary and Probability of Surface Urban Heat Island Footprint Based on a Logistic Model. Remote Sens. 2019, 11, 1368. [Google Scholar] [CrossRef]
- Yang, Q.; Huang, X.; Tang, Q. The footprint of urban heat island effect in 302 Chinese cities: Temporal trends and associated factors. Sci. Total Environ. 2018, 655, 652–662. [Google Scholar] [CrossRef] [PubMed]
- Kottek, M.; Grieser, J.; Beck, C.; Rudolf, B.; Rubel, F. World map of the Köppen-Geiger climate classification updated. Meteorol. Z. 2006, 15, 259–263. [Google Scholar] [CrossRef]
- Gong, P.; Wang, J.; Yu, L.; Zhao, Y.; Zhao, Y.; Liang, L.; Niu, Z.; Huang, X.; Fu, H.; Liu, S.; et al. Finer resolution observation and monitoring of global land cover: First mapping results with Landsat TM and ETM+ data. Int. J. Remote Sens. 2013, 34, 2607–2654. [Google Scholar] [CrossRef]
- Chen, J.; Chen, J.; Liao, A.; Cao, X.; Chen, L.; Chen, X.; He, C.; Han, G.; Peng, S.; Lu, M.; et al. Global land cover mapping at 30 m resolution: A POK-based operational approach. ISPRS J. Photogramm. Remote Sens. 2015, 103, 7–27. [Google Scholar] [CrossRef]
- Gong, P.; Li, X.; Wang, J.; Bai, Y.; Chen, B.; Hu, T.; Liu, X.; Xu, B.; Yang, J.; Zhang, W.; et al. Annual maps of global artificial impervious area (GAIA) between 1985 and 2018. Remote Sens. Environ. 2019, 236, 111510. [Google Scholar] [CrossRef]
- Shi, T.; Huang, Y.; Wang, H.; Shi, C.-E.; Yang, Y.-J. Influence of urbanization on the thermal environment of meteorological station: Satellite-observed evidence. Adv. Clim. Chang. Res. 2015, 6, 7–15. [Google Scholar] [CrossRef]
- Yang, Y.; Zhang, M.; Li, Q.; Chen, B.; Gao, Z.; Ning, G.; Liu, C.; Li, Y.; Luo, M. Modulations of surface thermal environment and agricultural activity on intraseasonal variations of summer diurnal temperature range in the Yangtze River Delta of China. Sci. Total Environ. 2020, 736, 139445. [Google Scholar] [CrossRef]
- Mudelsee, M. Trend analysis of climate time series: A review of methods. Earth-Sci. Rev. 2018, 190, 310–322. [Google Scholar] [CrossRef]
- Song, Z.; Chen, L.; Wang, Y.; Liu, X.; Lin, L.; Luo, M. Effects of urbanization on the decrease in sunshine duration over eastern China. Urban Clim. 2019, 28, 100471. [Google Scholar] [CrossRef]
- Kim, S.W.; Jung, D.; Choung, Y.-J. Development of a Multiple Linear Regression Model for Meteorological Drought Index Estimation Based on Landsat Satellite Imagery. Water 2020, 12, 3393. [Google Scholar] [CrossRef]
- Malik, S.; Pal, S.C.; Sattar, A.; Singh, S.K.; Das, B.; Chakrabortty, R.; Mohammad, P. Trend of extreme rainfall events using suitable Global Circulation Model to combat the water logging condition in Kolkata Metropolitan Area. Urban Clim. 2020, 32, 100599. [Google Scholar] [CrossRef]
- Tong, X.; Wang, P.; Wu, S.; Luo, M. Urbanization effects on high-frequency temperature variability over South China. Urban Clim. 2022, 42, 101092. [Google Scholar] [CrossRef]
- Mann, H.B. Nonparametric tests against trend. Econometrica 1945, 13, 245–259. [Google Scholar] [CrossRef]
- Kendall, M.G. Rank Correlation Methods, 4th ed.; Charles Griffin: London, UK, 1975. [Google Scholar]
- Theil, H. A Rank-Invariant Method of Linear and Polynomial Regression Analysis. In Proceedings of the Koninklijke Nederlandse Akademie Wetenschappen, Series A Mathematical Sciences, Amsterdam, The Netherlands; 1950; pp. 386–392. [Google Scholar]
- Sen, P.K. Estimates of the regression coefficient based on Kendall’s tau. J. Am. Stat. Assoc. 1968, 63, 1379–1389. [Google Scholar] [CrossRef]
- Hipel, K.W.; McLeod, A.I. (Eds.) Chapter 23 Nonparametric Tests for Trend Detection. In Time Series Modelling of Water Resources and Environmental Systems; Elsevier: Amsterdam, The Netherlands, 1994; Volume 45, pp. 853–938. [Google Scholar]
- Wang, F.; Shao, W.; Yu, H.; Kan, G.; He, X.; Zhang, D.; Ren, M.; Wang, G. Re-evaluation of the Power of the Mann-Kendall Test for Detecting Monotonic Trends in Hydrometeorological Time Series. Front. Earth Sci. 2020, 8, 14. [Google Scholar] [CrossRef]
- Ahmad, I.; Tang, D.; Wang, T.; Wang, M.; Wagan, B. Precipitation Trends over Time Using Mann-Kendall and Spearman’s rho Tests in Swat River Basin, Pakistan. Adv. Meteorol. 2015, 2015, 1–15. [Google Scholar] [CrossRef]
- Mohsin, T.; Gough, W.A. Characterization and estimation of urban heat island at Toronto: Impact of the choice of rural sites. Arch. Meteorol. Geophys. Bioclimatol. Ser. B 2011, 108, 105–117. [Google Scholar] [CrossRef]
- Chervenkov, H.; Slavov, K. Theil–Sen estimator vs. Ordinary least squares—Trend analysis for selected ETCCDI climate indices. Comptes Rendus Acad. Bulg. Sci. 2019, 72, 47–54. [Google Scholar] [CrossRef]
- Redeker, C.; Kantoush, S.A. The Nile Delta: Urbanizing on Diminishing Resources. Built Environ. 2014, 40, 201–212. Available online: http://www.jstor.org/stable/43296887 (accessed on 25 February 2022). [CrossRef]
- Sultan, M.; Fiske, M.; Stein, T.; Gamal, M.; El Araby, H.; Madani, A.; Mehanee, S.; Becker, R. Monitoring the urbanization of the Nile Delta, Egypt. Ambio 1999, 28. Available online: https://www.ostgov/biblio/942608 (accessed on 5 March 2022).
- Shalaby, A.; Moghanm, F.S. Assessment of urban sprawl on agricultural soil of northern Nile Delta of Egypt using RS and GIS. Chin. Geogr. Sci. 2015, 25, 274–282. [Google Scholar] [CrossRef]
- Elagouz, M.; Abou-Shleel, S.; Belal, A.; El-Mohandes, M. Detection of land use/cover change in Egyptian Nile Delta using remote sensing. Egypt. J. Remote Sens. Space Sci. 2019, 23, 57–62. [Google Scholar] [CrossRef]
- Nasrallah, H.A.; Brazel, A.J.; Balling, R.C. Analysis of the Kuwait city urban heat island. Int. J. Clim. 1990, 10, 401–405. [Google Scholar] [CrossRef]
- Cheng, W.L.; Saleem, A.; Sadr, R. Recent warming trend in the coastal region of Qatar. Theor. Appl. Climatol. 2017, 128, 193–205. [Google Scholar] [CrossRef]
- Almazroui, M.; Islam, M.N.; Jones, P.D. Urbanization effects on the air temperature rise in Saudi Arabia. Clim. Chang. 2013, 120, 109–122. [Google Scholar] [CrossRef]
- Benas, N.; Chrysoulakis, N.; Cartalis, C. Trends of urban surface temperature and heat island characteristics in the Mediterranean. Arch. Meteorol. Geophys. Bioclimatol. Ser. B 2016, 130, 807–816. [Google Scholar] [CrossRef]
- Siddiqui, A.; Kushwaha, G.; Nikam, B.; Srivastav, S.; Shelar, A.; Kumar, P. Analysing the day/night seasonal and annual changes and trends in land surface temperature and surface urban heat island intensity (SUHII) for Indian cities. Sustain. Cities Soc. 2021, 75, 103374. [Google Scholar] [CrossRef]
- Oke, T.R. The energetic basis of the urban heat island. Q. J. R. Meteorol. Soc. 1982, 108, 1–24. [Google Scholar] [CrossRef]
- Van Hove, L.W.A.; Jacobs, C.M.J.; Heusinkveld, B.G.; Elbers, J.A.; van Driel, B.L.; Holtslag, A.A.M. Temporal and spatial variability of urban heat island and thermal comfort within the Rotterdam agglomeration. Build. Environ. 2015, 83, 91–103. [Google Scholar] [CrossRef]
- Chen, X.; Jeong, S.-J. Shifting the urban heat island clock in a megacity: A case study of Hong Kong. Environ. Res. Lett. 2017, 13, 014014. [Google Scholar] [CrossRef]
- Abbas, W.; Ismael, H. Assessment of constructing canopy urban heat island temperatures from thermal images: An integrated multi-scale approach. Sci. Afr. 2020, 10, e00607. [Google Scholar] [CrossRef]
- Parlow, E. Regarding Some Pitfalls in Urban Heat Island Studies Using Remote Sensing Technology. Remote Sens. 2021, 13, 3598. [Google Scholar] [CrossRef]
- Easterling, D.R.; Horton, B.; Jones, P.D.; Peterson, T.C.; Karl, T.R.; Parker, D.E.; Salinger, M.J.; Razuvayev, V.; Plummer, N.; Jamason, P.; et al. Maximum and minimum temperature trends for the globe. Science 1997, 277, 364–367. [Google Scholar] [CrossRef]
- Jones, P.D.; Groisman, P.Y.; Coughlan, M.; Plummer, N.; Wang, W.-C.; Karl, T.R. Assessment of urbanization effects in time series of surface air temperature over land. Nature 1990, 347, 169–172. [Google Scholar] [CrossRef]
- Parker, D.E. Large-scale warming is not urban. Nature 2004, 432, 290. [Google Scholar] [CrossRef] [PubMed]
- Parker, D.E. A Demonstration That Large-Scale Warming Is Not Urban. J. Clim. 2006, 19, 2882–2895. [Google Scholar] [CrossRef]
- Wickham, C.; Rohde, R.; Muller, R.A.; Wurtele, J.; Curry, J.; Groom, D.; Jacobsen, R.; Perlmutter, S.; Rosenfeld, A.; Mosher, S. SInfluence of Urban Heating on the Global Temperature Land Average using Rural Sites Identified from MODIS Classifications. Geoinform. Geostat. Overv. 2013, 1. [Google Scholar] [CrossRef]
- Peterson, T.C.; Gallo, K.P.; Lawrimore, J.; Owen, T.W.; Huang, A.; McKittrick, D.A. Global rural temperature trends. Geophys. Res. Lett. 1999, 26, 329–332. [Google Scholar] [CrossRef]
- Zhang, Q.; Wu, Z.; Singh, V.P.; Liu, C. Impacts of Spatial Configuration of Land Surface Features on Land Surface Temperature across Urban Agglomerations, China. Remote Sens. 2021, 13, 4008. [Google Scholar] [CrossRef]


Publisher’s Note: MDPI stays neutral with regard to jurisdictional claims in published maps and institutional affiliations. |
© 2022 by the authors. Licensee MDPI, Basel, Switzerland. This article is an open access article distributed under the terms and conditions of the Creative Commons Attribution (CC BY) license (https://creativecommons.org/licenses/by/4.0/).