Article

Research on Sustainability of Financing Mode and Demand of PPP Project—Based on Chinese PPP and Local Financing Platform Alternative Perspective

Business School, Shanghai Normal University Tianhua College, Shanghai 201815, China
Sustainability 2022, 14(21), 14591; https://doi.org/10.3390/su142114591
Submission received: 29 August 2022 / Revised: 23 October 2022 / Accepted: 4 November 2022 / Published: 6 November 2022

Abstract

:
This paper studies the sustainability of the financing model in China’s urbanization and the demand of local governments for PPP projects. Based on the integrated panel data of PPP, local investment and financing platforms, urban investment bonds, and local economic statistics, the fixed effect model and dynamic panel regression model are used to study whether local financing platforms promote economic growth. The results show that in general, the development model of financing platform is not conducive to sustainable economic development. Before the 2008 economic crisis, local governments were pushing up house prices through financing platforms which boosted economic growth, but after the 2008 economic crisis, this mechanism did not work. Therefore, the sample selection model is used to predict the demand of local PPP projects and verify the substitution relationship between local financing platforms and PPP. The study found that financing platforms hinder local government demand for PPP projects and the attraction to private investment. After adjusting the relevant variables to zero, the demand for PPP projects in a representative city is 3.46.

1. Introduction

Promoting economic growth and improving people’s livelihood by new urbanization is an important strategy for long-term development of Chinese society [1]. For a long time, China’s local governments had no financing rights and generally relied on financing platforms to make up for the financial gap of new urbanization. The financing platform model has played an active role in the new urbanization, but it has also produced problems such as the government’s dependence on land finance and the neglect of debt risk [2,3,4]. After 2013, social capital was used to participate in urban infrastructure investment and operation through franchise and other ways, broadening the financing channels and operation mode of new urbanization, and thus the government began to actively try to improve the public-private partnership (PPP) (Domestic and foreign enterprise legal persons have established modern enterprise management systems, which do not include financing platform companies and other state-owned enterprises controlled by the government at the corresponding level.) [5]. How do we understand the transformation of the development model of new urbanization from a local financing platform to a PPP model? Exploring the internal logic of the transformation of the development model of new urbanization from a local financing platform to a PPP model is helpful to clarify the relationship between local government and local financing platforms. This helps to design the top-level architecture of local financing platform transformation, which is helpful to induce social capital to carry out continuous innovation, and constantly strengthen the project standard innovation management, and truly form a long-term partnership. This also helps the PPP model to achieve the best results in the construction of new urbanization, and to avoid the alienation of the local financing platform and ensure the smooth landing of PPP projects which helps to resolve local government debt risk and reduce the pressure on local debt. Lastly, this helps to give full play to the synergy between government and market resources to promote sustained and healthy economic development.
There have been many studies on the cooperation between the public and private sectors. Based on the incomplete contract theory, Ref. [6] discussed the optimal boundary problem of the public sector in an incomplete contract framework and proposed a theoretical model (HSV model) for public sector ownership and private sector contracting. From the perspective of incomplete contract and property rights theory, this model analyzes the different effects of public sector ownership and private sector contracting on product and service cost and quality improvement input. As to the question of the optimal scope for the provision of public goods and services by the public sector, the authors considered that privatization measures should be taken in cases where the adverse effects on quality reduction in the cost of goods and services could be controlled, or where the problem of public sector employees sheltering interest groups is serious; conversely, public goods and services should be provided by the public sector. The HSV model considers the impact of different types of partners on the allocation of control rights but does not consider the impact of product attributes on the allocation of control rights. Ref. [7] studied the allocation of control rights between the public and private sectors in the co-production of pure public goods with incomplete contract theory. Ref. [8] studied the allocation of control rights between the public and private sectors when the product is quasi-public goods with incomplete contract theory. On the basis of incomplete contract theory, Ref. [9] also established an analytical framework for the optimal allocation of different tasks (such as design, construction, operation, etc.) in PPP projects, examined the benefits and costs of integration from the perspective of property rights and incentives, and explored the efficiency of public-private partnerships based on the impact of ownership on innovative investment incentives. It is proven that when the government’s requirements for the early design stage are easier to be written into the PPP contract and the requirements for the later construction stage are not easy to be written into the PPP contract, the ‘bundling’ method should be adopted. That is, the same enterprises bear the PPP project design and construction at the same time; on the contrary, the design and construction tasks of PPP projects should be handed over to different enterprises by unbundling. The above theory explains the economic logic of the PPP model in the framework of incomplete contracts, and also provides the most basic theoretical basis for studying the distribution of control rights when the public sector and the private sector adopt the PPP model to cooperate in the production of public goods. However, it based on the public sector and the private sector. There is still a big difference between the private sector and the social capital in China’s PPP. At the same time, it does not take into account the role of the Chinese government in the development of the PPP model and cannot well understand the development of PPP in China and the development model of promoting the economy.
The development of PPP model in China has embedded its own unique style. In the process of new urbanization, due to rapid urbanization and fiscal decentralization, local governments choose to set up financing platform companies to alleviate the shortage of funds for local government construction through ‘local financing’, and also accumulate large debt risks [10,11]. The PPP model can not only broaden the source of funds, but also improve the efficiency of project construction, strengthen the government supervision function, alleviate the level of local debt, and help to improve the quality and efficiency of new urbanization construction [12]. In the process of promoting PPP projects in China, the inconsistency between the goals of local governments and the central government leads to games, such as the game of fiscal and tax payment and the game of financial supervision [13,14,15] and local governments that compete for growth [16,17,18,19], which plays a vital role. We will explore the following two issues: 1. whether local government debt promotes economic growth in the neoclassical framework and 2. whether PPP can be used as an alternative to local financing platforms to boost private investment and economic development. This can well explain the behavior of local governments in local debt expansion and help to understand the intrinsic motivation of the Chinese government to promote PPP development.
The relationship between public debt and economic growth is a time-honored issue. The literature [20,21,22,23] used the theoretical approach of neoclassical growth models to demonstrate that an increase in public debt reduces economic growth rates. Some of the empirical literature also confirms the negative relationship between government debt and economic growth [24,25,26]. Ref. [27] reviewed the existing 40 economic literature studies published during the period 2010 to 2020 on the relationship between public debt levels and economic growth and found that there is a nonlinear debt threshold above which debt has a significant deleterious impact on growth rates. At present, there are relatively few studies on local government debt and regional economic growth. China’s local government debt in recent years due to social concern and heated debate has gradually become a topic of academic attention. The existing literature shows that local government debt has a promoting effect on public goods financing and regional economic growth [28,29,30,31]. Based on the local debt balance data of 30 provinces in China from 2010 to the end of 2014, Ref. [32] conducted an empirical study on the economic growth effect of local debt. It is found that there is an obvious threshold effect of economic growth in China’s local debt: when the debt rate is higher than about 112%, the positive significant effect basically approaches 0.
Local government debt to promote economic growth may ignore the cost of government intervention or government failure, especially ignoring the importance of investment cost compensation, so that the actual economic growth is based on unreality (such as relying on debt), eventually leading to economic and social unsustainable. Therefore, this paper understands the PPP model as an alternative to the urban investment bond and local financing platform model. Many literature studies [33,34,35,36,37] put forward the PPP model instead of the financing platform to prevent local government debt risk, but few empirical literature studies examined the substitution relationship between the PPP model and the financing platform. In order to make up for the lack of relevant research, this paper integrates the relevant data of 287 prefecture-level cities in the CBRC’s (China Banking Regulatory Commission) list of local government financing platforms, the PPP of the Treasury Department’s project library [38], the urban investment debt of Wind information [39], CEIC (China entrepreneur Investment Club) [40], and the China Urban Statistical Yearbook [41]. Under the neoclassical growth framework, this paper empirically studies the operation mechanism of the financing platform and predicts the demand for PPP projects in prefecture-level cities. The study found that the financing platform model formed the local government’s dependence on land finance, and under its intervention, pushed up housing prices but not conducive to economic growth. Moreover, the existence of the financing platform hinders the development of PPP projects and is not conducive to the transformation and development of investment and financing.
The contributions of this paper are summarized as follows:
  • The research on the relationship between public debt and economic growth basically focuses on the national level, which is also different from the provincial data of [32]. Our research is based on prefecture-level city data, which has richer information and avoids provincial-level data. Ignoring the differences in industrialization, marketization, and urbanization between cities within provinces and regions may bring about cognitive biases, enriching the Chinese case study on the relationship between debt and economic growth.
  • Urban investment bonds and local financing platform data were constructed to study the operating mechanism of the local government financing platform and deepen the understanding of local governments on land financial dependence.
  • It verifies the alternative relationship between the PPP model and local financing platform model, deepens the understanding of PPP promoting economic growth mechanism, and makes up for the lack of relevant literature.
  • It enriches the economic growth theory of new institutional economics and provides a ‘Chinese model’ for developing countries.
The second part of this paper focuses on the research background and the inner logic of model selection from the perspective of literature. The third part is a statistical descriptive analysis of the data and an elaboration of the empirical research methodology. The fourth part is the prediction of the demand for PPP projects, and finally the conclusion and policy enlightenment of this paper.

2. Research Background and Internal Logic of Model Selection

Moderate government debt promotes economic growth, and excessive debt is not conducive to sustainable economic development. In terms of economic theory, at a moderate level of government debt, government debt may induce growth. Because government debt is used for public investment, the improvement of production efficiency through better services and infrastructure will drive the investment and production behavior of the private sector, which will have an impact on output and the real economy. Ref. [42], using cross-sectional data from a group of countries, also concluded that public investment has a positive effect on private investment and economic growth. Ref. [43] analyzed the data samples of Latin American countries from 1980 to 1995, and the results show that public investment has a significant pulling effect on private investment. Ref. [44] selected the data of 19 representative developing countries from 1970 to 1998 for research. The results show that public investment has a significant effect on private investment and economic growth in major developing countries. At high debt levels, however, expected future tax increases would reduce the likely positive impact of government debt. The expansion of government debt has brought rising capital costs and future tax increases, and people will reduce investment and consumption, which could crowd out private investment and lead to lower output. Ref. [45]’s study showed that when there is excess supply in the labor market and excess demand in the commodity market, an increase in public investment will completely crowd out private investment. Using the data of the United States and Canada from 1949 to 1976, Ref. [46] also showed that public investment has a certain crowding-out effect on private investment. Ref. [47] studied the cross-sectional data of OECD countries and found that public investment has a negative effect on private investment and is not conducive to economic growth.
In the process of China’s economic growth, investment plays an important role. In 2009, China achieved a GDP growth rate of up to 8.7%, but capital formation alone contributed up to 8% to growth and 92.3% to GDP. It can be said that China’s economic growth is heavily dependent on investment. In the process of promoting new urbanization, the financing platform realizes external borrowing through land mortgage, which is an important way to obtain the funds needed for municipal project construction. In 1994, the tax-sharing reform was implemented. The tax-sharing financial management system was designed according to the principle of “combining the power of affairs (the power of governments at all levels to deal with social public affairs and economic affairs based on different functions) with the financial power (the power of governments at all levels to organize various fiscal revenues and arrange various fiscal expenditures),” which further standardized the financial relationship between the central and local governments. In order to obtain municipal project construction funds and promote local economic and social development, local governments gave birth to the financing platform [48]. The implementation of the tax-sharing system reform has brought about vertical competition between financial power and administrative power, and horizontal competition among local governments with GDP growth rate as the performance evaluation mechanism of local officials [49], making local governments establish local financing platforms and rely on land for financing [50,51,52], promoting the rapid development of the urban economy.
In the development mode of local financing platforms, land acts as a leverage to leverage urban construction financing, which also leads to the risk of local excessive borrowing. Ref. [53] found that for infrastructure investment, only 10% came from financial investment, 90% was related to land, land transfer funds accounted for about 30%, and 60% was obtained through land mortgage financing channels. On the one hand, land transfer fees increase year by year. On the other hand, land mortgage loan increases year by year. With the deepening of China’s economic development, the land finance model gradually shows many problems. The pattern of “seeking development by land” began to have a negative impact on economic development and urbanization [54]; it also exposes local governments to financial and credit risks [55]. Related land finance and debt data is shown in Table 1.
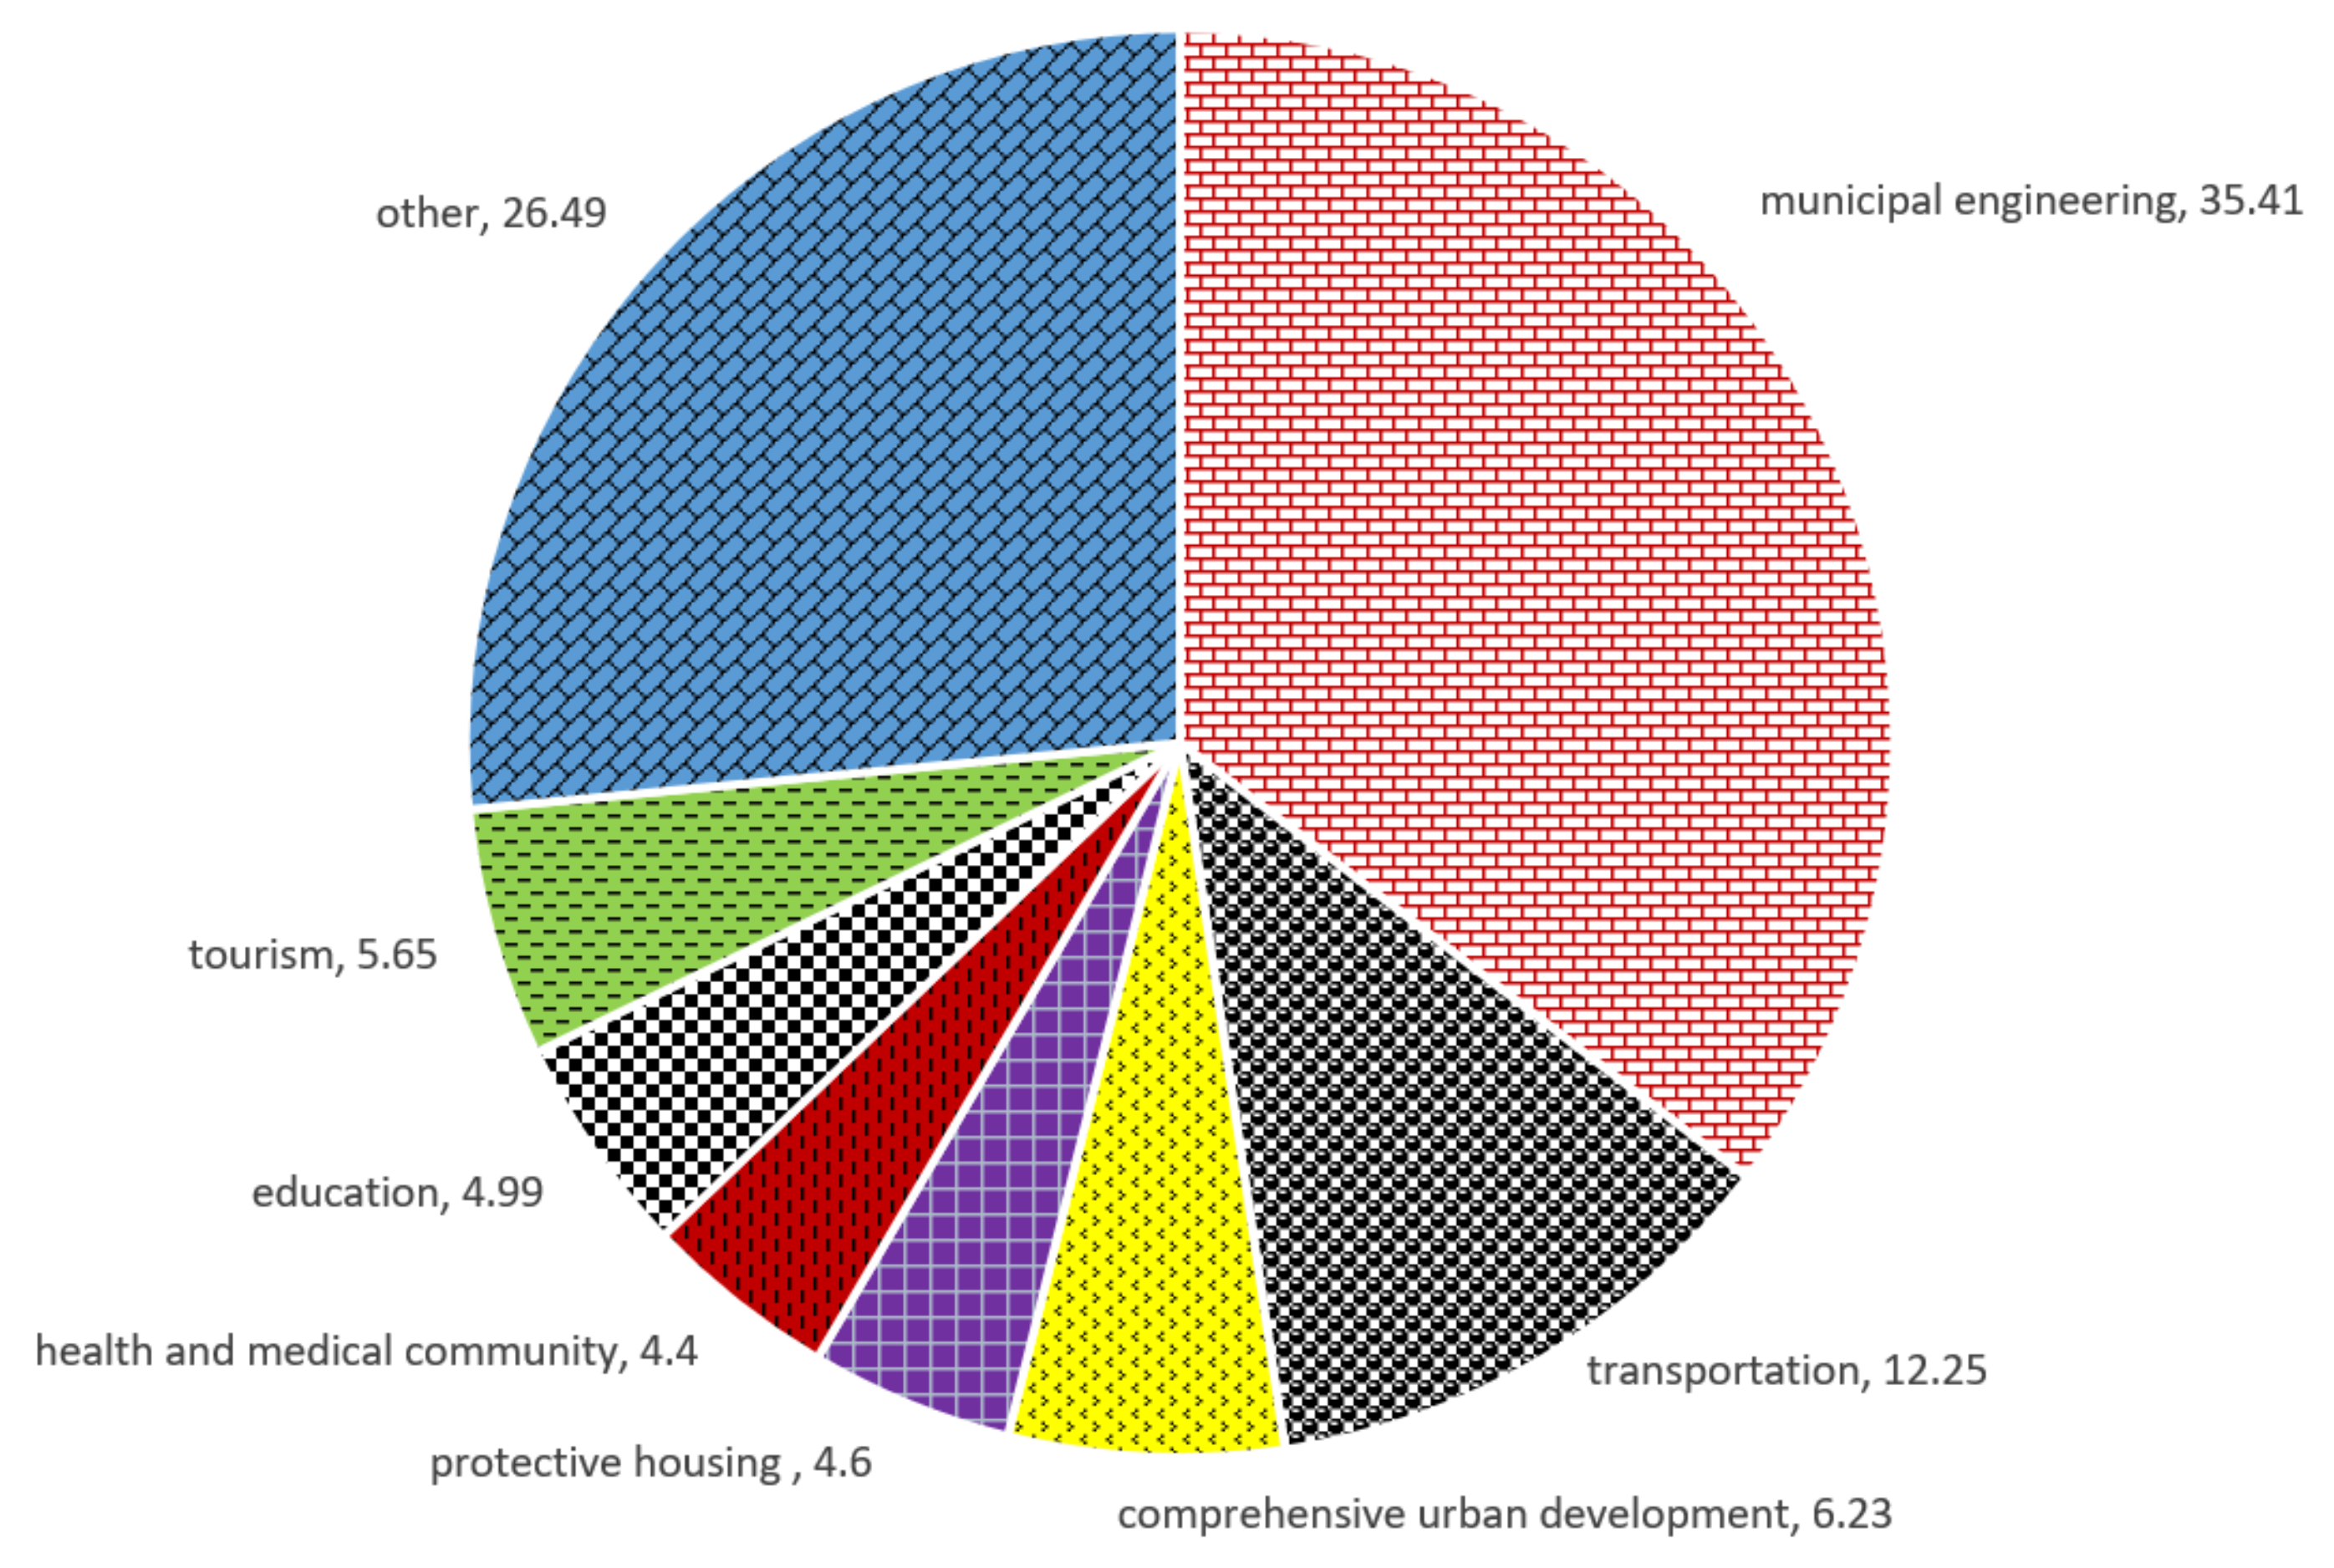
After the local financing platform is restricted, PPP projects can be used as a way to alleviate the financial pressure of local governments. According to data published by the National Audit Office (2013), about 70 percent of local government debt expenditures in recent years have been directed to municipal and transport facilities, and about 10 percent to land reserves, with three expenditures accounting for about 80 percent of all expenditures. The above expenditure items are key business areas in which PPP models are currently involved (see Figure 1), Municipal engineering accounted for 35.41%, transportation accounted for 12.25%, and urban comprehensive development accounted for 6.23%. Protective housing accounted for 4.6%. By attracting private capital into municipal projects, PPP mode changes the financing mode of financing platforms, reduces the dependence of local governments on land finance, and reduces the debt risk of financing platforms. At the same time, local governments can allocate more financial resources to the field of social development.
In the investment and operation of urban infrastructure, PPP model, as a new management model, is easy to promote the establishment and improvement of incentive mechanism and improve the efficiency of construction and operation. The nonstandard management of financing platform has gathered debt risks, prompting the government to achieve institutional innovation through the PPP model. As a new management mode, PPP mode helps to form incentive mechanism, realize the transformation of public sector from traditional plan to market, and the private sector from market to social service. This ‘double shift’ allows institutional innovation that leverages private investment while limiting local governments’ overreliance on financing platforms through land finance to complete the short-term task of urbanization, ignoring the long-term risk of local debt accumulation, thereby improving infrastructure construction and operational efficiency. Therefore, on 18 May 2014 and 7 July 2015, the National Development and Reform Commission issued “notices on the issuance of the first batch of infrastructure and other fields to encourage social investment projects” and “Measures for the management of infrastructure and public utilities franchises” to encourage and guide social capital to participate in the construction and operation of infrastructure and public utilities, thereby improving the quality and efficiency of public services. Ref. [56] thinks that there are three differences between the PPP model and the traditional financing model: Firstly, financing is only one of the purposes of the PPP model, as the government and the public sector can also effectively use the production and management technology of the private sector through the PPP model. Secondly, the PPP model more considers the overall risk minimization, compared to the public and private pursuit of risk minimization, and can better resolve the risk. Thirdly, corresponding to risk control, the PPP model pursues the maximization of social comprehensive benefits. It can be seen that the PPP model is an effective integration of public interests and market interests at the operational mechanism level, forming a management and operational mechanism superior to the separate role of the government and the market.

3. Data statistical Description and Research Methods

3.1. Statistical Description

The data used in this paper are from four sources: the data of fiscal revenue, fiscal expenditure, sales price of commercial housing, and per capita GDP of 287 prefecture-level cities in CEIC from 2001 to 2016; the relevant data of cities in China City Statistical Yearbook, the full-aperture financing statistics of the list of local government financing platforms of the CBRC on 31 March 2016; the PPP data of the project database of the Ministry of Finance of China’s PPP service platform; and the data of city investment bonds in Wind Information. In our database, the launch time of PPP projects is mainly concentrated in 2015 and 2016, with 6468 and 2883 items, respectively. However, it was not until 2017 that the PPP projects led by local governments began to accelerate their landing. However, from the statistical data of previous projects in various provinces, we can still find that there are significant differences from the attitudes of local governments towards adopting the PPP model (Table 2). This difference provides an interesting natural experiment for us to understand the behavior of local governments. For example, the top three provinces in the number of project applications are Guizhou (1730), Shandong (1056), and Xinjiang (including 835 autonomous regions and construction corps), and the number of applications in economically underdeveloped regions is relatively large. The reason may be that the financing needs of the central and western regions are difficult to raise funds through financing platforms. PPP projects are mainly related to the construction of new urbanization (Figure 1), and the financing of these constructions has been mostly raised through local financing platforms. It is important to note that since this database collects the number of project applications, it only reflects the subjective needs of local governments for PPP projects (financing and construction content). At the same time, the organizational form of the PPP model is more complex, and there is an inevitable divergence of interests and responsibilities between the public and private parties of cooperation. Only by reaching a tacit understanding of project cooperation can we objectively achieve project landing and ultimately achieve positive contributions to new urbanization.
Before the central government vigorously promotes the PPP model, China’s local government urbanization construction funds mainly rely on local financing platforms. Table 3 reports the data of local financing platforms in each province. On the whole, there are more financing platforms in the eastern region, while there are fewer financing platforms in the central and western regions. The reason may be that the overall land price (price at time of sale of land) is not high, and the efficiency of land finance financing (financing efficiency on financing transaction efficiency evaluation) is not as good as that in the eastern region. At the same time, the central government has strengthened the local special fiscal transfer payment [57], making up for the funding gap of urbanization construction. In practice, there are many problems in the operation of local financing platforms. According to the study of [2], from 2000 to 2012, China’s local government financing platform as an independent economic entity had a total of 3395 urban land auctions. The financing platform is keen to auction urban land, which exposes the dependence of local finance on land transfer funds. During the 20 years from 1998 to 2017, China’s land transfer funds maintained rapid growth, with an average annual growth rate of 33.77%. Over the past 20 years, the national land transfer fund has grown from 50 billion yuan to 5 trillion yuan, 100 times the size of 20 years ago. The share of land transfer income in local fiscal revenue increased substantially, from 9.19 percent in 1999 to 51.83 percent in 2007. At the municipal and county level, the ratio of national land use transfer income to local fiscal revenue increased from 0.35:1 to 0.75:1 from 2007 to 2010 [58].
The problems existing in the management and operation of the financing platform established by local governments have aroused the concern of the central government on the local debt risk. In order to cope with the international financial crisis, in 2009, the city investment bonds appeared with explosive growth, as the issuance scale exceeded 400 billion (see Figure 2). In June 2010, the State Council issued a ‘notice on strengthening the management of local government financing platform companies’, but the implementation effect was not ideal. Due to the dual pressure of financing needs of China’s new urbanization development and economic growth entering the new normal, the dependence of local economic growth on financing platforms has not been reduced. After 2012, the issuance scale of urban investment bonds exceeded 1 trillion (see Figure 2). This triggered the regulatory authorities and the central government to introduce more stringent policies to restrict financing platforms. For example, the CBRC issued ‘guidance on strengthening the supervision of local government financing platform loan risk in 2013’ in April 2013, and the State Council issued ‘advice on strengthening local government debt management’ in September 2014.
In order to prevent and resolve the debt risks arising from the financing platform, the central government has strengthened the management of the standardized operation of local government financing platform companies. At the same time, local governments have also begun to actively try to improve the cooperation mode of government and social capital. From Figure 3, the ratio of the total amount of annual urban investment bond issuance to the total amount of financing of the two types of financing modes (the sum of the total amount of annual urban investment bond issuance and the amount of PPP landing) shows that the proportion of financing platform financing is decreasing, the proportion of PPP financing is increasing, and the proportion of urban investment bond and PPP financing is changing, reflecting its possible substitution relationship. The implementation of the new ‘budget law’ and the standardized management of financing platforms, in the context of restricting local governments from borrowing through financing platforms, vigorously develops the PPP model, which can make full use of social capital to effectively supplement the financial needs of local infrastructure construction and effectively alleviate the debt pressure of local financing platforms. It is confirmed that the number of regional PPP promotion projects and the amount of growth rate of PPP public projects are positively correlated with the solvency of local urban investment projects [59,60].
An empirical study of the relevant variable definitions and statistical descriptions is shown in Table 4.

3.2. Research Methods

This paper first discusses the impact of land finance and local debt on economic growth. In the context of economic decentralization, land is not only a factor of production, but also a tool for local governments to compete for GDP, which makes land finance show a strong ability to promote urban economic growth [61]. In the neoclassical framework, there have been many studies on land as a factor of production for urban economic growth. We refer to the research of [62] and assume that the production function Q = F ( K ,   N ,   L ) = AK α N β L γ , where land (L), labor (N), and capital (K) are productive factors. We focus on examining the possible negative impact on the land finance model formed by local government competition on economic growth. Land finance can increase the enthusiasm of local governments. The reason is that a large part of government expenditures and fixed asset investment comes from land finance. There are three specific ways: first, land transfer fees; second, financing through platforms land mortgages; and third, urban investment bonds financed based on the expected revenue value of land on financing platforms. Among the land obtained by the local government financing platform, 69.3% of the land is used for commercial and residential construction, 20% for industrial projects, and the remaining land is for other purposes [2]. In practice, the synchronous relationship between land price and house price [63] and land mortgage are priced by commercial housing price [64]. Therefore, this paper uses the price of commercial housing as the proxy variable of land finance and defines L as the product of land price (P) and land supply area (T). At the same time, a large number of literature studies (refer to the introduction) have theoretically and empirically verified that debt has an impact on economic growth, so debt variables (urban investment bonds and financing platforms) are added to the empirical model.
Based on the above analysis, in order to avoid model specification bias and endogeneity problems, lagged dependent variables are introduced to establish a dynamic model in order to obtain a consistent estimate of the variables [65]. The empirical model can be seen (1). Because the local financing platform is not changing with time, it cannot be investigated in the dynamic panel regression model; therefore, we use the fixed effect model to examine the role of the financing platform on economic growth. Although the bias is not accurate, the overall and GMM estimation results are consistent; at the same time, because the economic environment has changed greatly before and after 2008, we take the time period to examine and then explore whether there is a structural change in the economic role of land finance before and after 2008.
g g d p i t = α 1 + α 2 g g d p i t 1 + α 3 c t z i t + α 4 c o u n t i t + α 5 g p i t + α 6 g T i t + α 7 g K i t + α 8 g N i t + v i + μ t + ε i t
where t represents time, i represents place, g g d p i t represents GDP per capita growth rate, c t z i t represents city investment bonds, g p i t represents housing price growth rate, c o u n t i t represents local financing platform, g K i t represents capital growth rate, g N i t represents employment growth rate, g T i t represents land supply area growth rate, and ε i t represents stochastic disturbance. Secondly, local governments’ competition for growth has spawned financing platforms, and debt risks have prompted the government to develop PPP to replace financing platforms. Therefore, we assume that the demand of local governments for PPP projects is mainly affected by maintaining local economic growth and controlling local fiscal deficits. The Prediction Model (2) estimates the demand of local governments to achieve economic goals through PPP projects due to the constraints of financing platforms. Finally, we test whether the PPP project application is hindered by the existence of urban investment bonds and local financing platforms in Model (5).
In the application for PPP projects, a large proportion of cities do not apply, but it does not mean that they do not intend to apply. If we delete this part of the samples for regression, the results are likely to be biased, so we use the sample selection model to estimate the prediction equation. The demand equation for local PPP projects:
P P P i * = β 0 + β 1 g g d p i + β 2 d e f i + β 3 g p o p i + β 4 In   l o a d i + β 5 In   d e n s i t y i + β 6 g exp i + v i
where, β 1 represents the number of PPP projects determined by the local per capita GDP growth rate g g d p i , β 2 represents the number of PPP projects determined by the local fiscal deficit rate d e f i , β 3 represents the number of PPP projects determined by the local resident population growth rate g p o p i , β 4 represents the number of PPP projects determined by infrastructure In   l o a d i , β 5 represents the number of PPP projects determined by the resident population density In   d e n s i t y i , and β 6 represents the number of PPP projects determined by local fiscal expenditure g exp i .
The PPP project application tendency equation is determined by local per capita GDP growth rate, fiscal deficit rate, resident population growth rate, fiscal expenditure, infrastructure, resident population density, and economic openness:
e * i = α 0 + α 1 g g d p i + α 2 d e f i + α 3 g p o p i + α 4 g exp i + α 4 ln l o a d i + α 5 ln d e n s i t y i + α 7 o p e n i + u i
where E ( v i ) = 0 and E ( u i ) = 0 ; when cov ( v i , u i ) > 0 , the following regression equation can be derived:
P P P i = β 0 + β 1 g g d p i + β 2 d e f i + β 3 g p o p i + β 4 ln l o a d i + β 5 ln d e n s i t y + β 6 g exp i + ρ σ 1 λ i + μ i
Let z i = α 0 + α 1 g g d p i + α 2 d e f i + α 3 g p o p i + α 4 g exp i + α 4 ln l o a d i + α 5 ln d e n s i t y + α 7 o p e n i , then λ i = ϕ ( z i / σ 2 ) / Φ ( z i / σ 2 ) , where λ i is the inverse Mills ratio, ρ is the correlation coefficient of v i and u i , σ 1 is the standard deviation of v i , and σ 2 is the standard deviation of u i . The MLE method is used to estimate the sample selection model, where the heteroscedastic robust standard error is used.
According to Figure 3 and the foregoing analysis, there is an alternative relationship among urban investment bonds, financing platforms, and PPP projects, i.e., urban investment bonds and financing platforms hinder the application of PPP projects. To test this hypothesis, a counterfactual method is used to estimate the unrealized demand for PPP projects, and then Model (5) is tested:
P P P ^ i t = γ 0 c t z i t + γ 1 c o u n t i t + μ i t
where c t z i t represents city investment bonds, c o u n t i t represents local financing platform, and μ i t represents stochastic disturbance.

4. Demand Forecast of PPP Project

4.1. Land Finance and Economic Growth

The empirical results of land finance and economic growth are shown in Table 5. In Table 5, (1)–(6) are fixed effects model results, where (1)–(3) examine the time period 2003–2007 and (4)–(6) examine the time period 2009–2014. Moreover, (7) are differential GMM results and (8) are systematic GMM results.
Table 5 reports the results of our empirical model. It can be seen from the report in Table 5 that although the coefficients of urban investment bonds in (1)–(6) are basically negative, they have no significant impact on local economic growth. The coefficient of the financing platform in (1)–(6) is significantly negative, and the coefficient of GMM estimation (7) and (8) urban investment bond (which can be regarded as the proxy variable of financing platform) is significantly negative, indicating that the financing platform hinders economic development. This result is consistent with neoclassical theory. According to this theory, when local governments finance through debt, households and enterprises will expect that the current increase in investment will lead to future tax increases, which will crowd out current private consumption and investment. The net effect of urban investment bond variables is determined by investment increase effect and crowding out effect.
Similar to the findings of [66], between 2003 and 2007, the growth rate of housing prices in various regions is positively correlated with the economic growth rate. This positive correlation reflects the agglomeration effect of new urbanization development, i.e., the rapid development of urban economy and the continuous improvement of citizens’ quality of life will inevitably attract a large number of immigrants into the city. The improvement of urbanization will attract immigrants into the city, and immigration into the city will increase housing demand and push up housing prices. In this case, asset price becomes the leading indicator to predict economic growth. However, between 2009 and 2014, the coefficient of housing price growth rate is positive, but not significant, indicating that pushing up housing prices to promote economic growth mechanism no longer works. In SYSGMM, pushing house prices to promote economic development is not feasible.
However, as stated in the theory of land finance, if local governments realize that urbanization can be achieved rapidly by pushing up land prices, there will be incentives to intervene in the economy under the pressure of competition. By establishing local financing platforms, land finance can be used to speed up infrastructure construction. However, the competition between local governments has formed a prisoner’s dilemma. Accelerating infrastructure through financing platforms does not necessarily attract migrants, such as Kangbashi in Ordos, and Caofeidian in Tangshan, Hebei. As a result, the land urbanization is too fast, the population urbanization is insufficient, the agglomeration effect is not realized, and the development of urbanization is not implemented, which only raises the land price and pushes up the housing price. So, we can see that except (3), the coefficient of financing platform is significantly negative. The coefficient of financing platform of (3) is also negative (but not obvious), and the coefficient of interaction term is obviously negative. That is to say, in a sense, the mechanism of land finance to push up housing prices has hampered economic growth.
Our model controls the fixed effect of time. Taking 2008 as a benchmark, the coefficients of other years’ time dummy variables reflect the overall economic growth relative to 2008. Figure 4, based on the coefficients of the time dummy variables for each year, reflects changes in economic growth in 2004–2014. As can be seen from Figure 4, China’s economy was hit by the subprime crisis in 2009, the government through the ‘4 trillion’ economic stimulus plan, but this also caused the rapid expansion of the financing platform, the ab-normal issuance of urban investment bonds (reference Figure 2). This over-reliance on land finance has led the economy to a downward trajectory after 2012.

4.2. Alternative Relationship between PPP and Financing Platforms

The prediction estimation results are summarized in Table 6. It should be pointed out that from the results, the economic openness coefficient (open) in the first step regression is significantly negative, indicating that the selection of instrumental variables is effective. At the same time, the Wald test results of rho show that H0 is rejected at least at the level of 5%. This shows that there is indeed a selection bias in the baseline regression model. In the second step, the coefficient of per capita GDP growth rate is significantly positive, indicating that local governments competing for growth have the motivation to promote the development of PPP. The density of resident population is obviously positive, indicating that the density of resident population is large, and the demand for PPP projects is also large, which reflects the social needs.
To test the alternative relationship between PPP and financing platforms, the regression results of Model (5) are summarized in Table 7.
By testing Model (5) with a sample of cities which did apply for PPP, the results show that the coefficients of urban investment debt and financing platform variables are significantly negative, which verifies our hypothesis that urban investment debt and financing platform hinder the application of PPP projects. At the same time, all samples are used to test the robustness of the substitution relationship, and the results are shown in Table 7. The coefficient of urban investment debt and the number of financing platforms are significantly negative, indicating that the results are robust. This shows that the reduction of financing platforms is conducive to the development of PPP projects. Under the background of strengthening supervision and standardized management of financing platforms by the central government, in order to develop local economy and improve urban living environment, local governments have incentives to use PPP to replace the development model of financing platforms.
A comparison of estimated PPP project requirements with actual PPP project applications is shown in Figure 5. It is particularly noteworthy that the number of data points with PPP applications are 0 and 1. From the perspective of our forecasting model, taking into account the needs of economic and social development, even if financing through fiscal deficits is controlled, these data points may still have a large demand for PPP projects in the corresponding prefecture-level cities. The constant terms of the prediction model from Table 6 are 3.94, and the constant terms of test model and robust test model from Table 7 are 3.22 and 3.23, respectively. Although different data and different related variables are used, this value is relatively stable, indicating that our estimation results are robust. The average (3.46) of these three constants (3.94, 3.22, 3.23) can be used as a representative city’s demand for PPP projects (when the control variables are zero). In addition, some areas may have the problem of excessive application for PPP projects (data points of application projects greater than 4).

5. Conclusions

5.1. Research Findings and Suggestions

Hart explained the economic logic of the PPP model in the incomplete contract framework [9]. Unlike this abstract theory, the development of China’s PPP model follows its own characteristics: the game between central and local governments and the competitive relationship between local governments for growth play a crucial role in the promotion of PPP projects. Firstly, this paper discusses the internal logic of the government’s promotion of PPP projects through the regression literature, and on the basis of the integration of PPP, local investment and financing platforms, urban investment bonds, and local economic data, uses the fixed effect model, dynamic panel regression model, and sample selection model to study whether local financing platforms promote economic growth and the substitution relationship between local financing platforms and PPP. The study found that under the financing platform development model, the impact of the land finance mechanism on economic growth is generally negative, and the existence of the financing platform hinders the local government’s demand for PPP projects and the attraction of private investment. After controlling the relevant variables to zero, the demand for PPP projects in a representative city is 3.46.
The PPP model can not only solve the financial problems of local governments, but also improve the level and efficiency of public services [67]. More importantly, the promotion of institutional innovation of the PPP model is of great significance for building a modern financial system, accelerating new urbanization, and improving national governance capacity. On the one hand, the PPP model reform attracts social capital, which is consistent with the goal of reducing fiscal expenditure and resolving debt crisis. Attracting social funds to participate in the construction of basic public services can not only reduce local government investment [68], but also effectively improve the utilization efficiency of financial funds. On the other hand, the PPP model creates market development space for the growing private capital and social capital, which can better play its advantages and creativity in the market system.
Our research deepens the understanding of PPP which promotes economic growth mechanism and deepens the understanding of local governments on land financial dependence. It enriches the economic growth theory of new institutional economics and provides a ‘Chinese model’ for developing countries.

5.2. Limitations and Future Research Directions

This paper focuses on urban infrastructure investment and operation industries. According to the boundary theory of cooperative relationship proposed by Hart [8] and the study of [69], the PPP model is not in fact a ‘panacea’ and has its own applicable boundary and objective conditions. Therefore, in industries that are not suitable for the development of the PPP model, the financing platform should be standardized rather than banned, so that it can borrow moderately within the scope of making up for market failure and reduce the dependence of local governments on the debt of financing platform, so as to prevent the debt risk of local governments and stabilize economic development.
PPP projects are difficult to land. What are the reasons? At present, there is no good answer. In the future, we can analyze the mechanism of influencing factors of PPP project landing rate. The influencing factors are related to the project’s management performance, capital structure, risk sharing, private sector behavior, and the role of the government. The literature recommendations for future research are shown in Table A1.

Funding

This research was partly funded by Shanghai Chenguang Program (under grant number 20CGB06 and grant number 21CGB08) and Shanghai Higher Education Association planning research topics “Practical teaching design and teaching objectives—Take Financial Mathematics major as an example” under grant number Y1-50.

Institutional Review Board Statement

Not applicable.

Informed Consent Statement

Not applicable.

Data Availability Statement

All data or codes used to support the findings of this study are available from the corresponding author.

Conflicts of Interest

The authors declare no conflict of interest.

Appendix A

Table A1. Future Research Directions.
LiteratureTitleFuture Research Directions
[70]Mapping Studies on Sustainability in the Performance Measurement of Public-Private Partnership Projects: A Systematic ReviewAppropriate performance standards for PPP projects within the UN SDGs, establish specific sustainable performance measures to suit PPP projects in specific sectors such as roads, buildings, railways, etc.
[71]Barriers in proper implementation of public–private partnerships (PPP) in Sri LankaAnalysis of the inherent barriers to the implementation of public–private partnerships in mature and less mature economies.
[72]Project Sustainability and Public-Private Partnership: The Role of Government Relation Orientation and Project GovernanceThe behavior of the private sector can be included to further explore the mechanism and path of the government’s relation orientation. Project characteristics can be incorporated into the research model to make the project research closer to the actual situation.
[73]PPP projects: improvements in stakeholder managementHow to systematically identify and deal with the interests of external stakeholders.
[74]Sustainable Development, Governance and Performance Measurement in Public Private Partnerships (PPPs): A Methodological Proposal Implement internationally recognized policies and procedures, taking into account the relationship between PPP and its stakeholders to create public value, in order to visualize PPP performance measurement in terms of sustainable development and governance.
[75]PPPs and project overruns: evidence from road projects in India How to make more accurate initial estimates of project time and cost.
[76]A Comparative Study on the Risk Perceptions of the Public and Private Sectors in Public-Private Partnership (PPP) Transportation Projects in VietnamThe risk allocation of these key risk factors by stakeholders in PPP projects. In addition, risk mitigation strategies for the public and private sectors should be identified and analyzed.
[77]The Whole Lifecycle Management Efficiency of the Public Sector in PPP Infrastructure Projects The study explores the internal relationship between the evaluation system indicators and their importance differences to measure the management efficiency of the public sector.
[78]A Proposal for risk Allocation in social infrastructure projects applying PPP in ColombiaThe differences between the risks in productive infrastructure projects and the risks in social infrastructure projects.

References

  1. Wang, Y.F.; Leng, Z.M.; Ding, R.X. China’s New Urbanization Road and Real Estate Market Development Transformation—‘New Urbanization and Real Estate Development Academic Forum’ Review. Econ. Res. 2016, 51, 181–185. [Google Scholar]
  2. Yi, D.C.; Fan, G.Z. Research on land market participation of local government financing platform. Macroecon. Res. 2015, 10, 151–159. [Google Scholar]
  3. Zhong, H.Y.; Zhong, N.H.; Zhu, X.N. Is the guarantee of city investment bonds credible?—Evidence from bond rating and issue pricing. Financ. Res. 2016, 4, 66–82. [Google Scholar]
  4. Zhong, N.H.; Chen, S.S.; Ma, H.X.; Wang, S.J. Evolution of debt risk of local financing platforms-based on the measurement of ‘implicit guarantee’ expectations. Chin. Ind. Econ. 2021, 4, 5–23. [Google Scholar]
  5. Zhang, S.; Chan, A.P.; Feng, Y.; Duan, H.; Ke, Y. Critical review on PPP Research–A search from the Chinese and International Journals. Int. J. Proj. Manag. 2016, 34, 597–612. [Google Scholar] [CrossRef]
  6. Hart, O.; Shleifer, A.; Vishny, R.W. The proper Scope of government: Theory and an application to prisons. Q. J. Econ. 1997, 112, 1127–1161. [Google Scholar] [CrossRef] [Green Version]
  7. Besley, T.; Ghatak, M. Government versus private ownership of public goods. Q. J. Econ. 2001, 116, 1343–1372. [Google Scholar] [CrossRef]
  8. Francesconi, M.; Muthoo, A. Control Rights in Public Private Partnerships. IZA Discussion Paper No. 2143; CEPR Discussion Paper No. 5733. 2006. Available online: https://ssrn.com/abstract=924197 (accessed on 1 October 2022).
  9. Hart, O. Incomplete Contracts and Public Ownership: Remarks, and an Application to Public-Private Partnerships. Econ. J. 2003, 113, 69–76. [Google Scholar] [CrossRef]
  10. Cheng, Z.; Wang, H.; Xiong, W.; Zhu, D.; Cheng, L. Public–private partnership as a driver of sustainable development: Toward a conceptual framework of sustainability-oriented PPP. Environ. Dev. Sustain. 2021, 23, 1043–1063. [Google Scholar] [CrossRef]
  11. Zhou, L.Y.; Chen, J.Q.; Hu, T.Z. The dual identity risk and supervision of financing platform companies under the mode of ‘local financing’. Local Financ. Res. 2021, 12, 56–66. [Google Scholar]
  12. Wang, K.Q.; Lu, J.L.; Li, Y.C. Does PPP model improve the quality of new urbanization construction? Stat. Res. 2020, 37, 101–113. [Google Scholar]
  13. Sun, N.H. Economic game between central government and local government during economic transition. Manag. World 2001, 3, 35–43. [Google Scholar]
  14. Hu, J.Y.; Dong, Y.W. Improvement of local financial supervision system based on central-local game. Macroecon. Res. 2021, 3, 25–38, 84. [Google Scholar]
  15. Xie, F.S.; Hang, L. A Game-Theory-Based Interaction Mechanism between Central and Local Governments on Financing Model Selection in China. Sustainability 2022, 14, 9821. [Google Scholar] [CrossRef]
  16. Zhang, J. China’s economic development: Competition for growth. World Econ. Lit. 2005, 4, 101–105. [Google Scholar]
  17. Fu, Y.; Zhang, Y. Chinese decentralization and fiscal expenditure structure bias: The price of competition for growth. Manag. World 2007, 3, 4–12. [Google Scholar]
  18. Zhou, L.A. Research on the Promotion Championship Model of Chinese Local Officials. Econ. Res. 2007, 7, 36–50. [Google Scholar]
  19. Cao, G.Y.; Liu, C.R.; Zhou, L.A.; Liu, C. Financial pressure and the rise of local government financing platform. Financ. Res. 2020, 5, 59–76. [Google Scholar]
  20. Modigliani, F. Long-run implications of alternative fiscal policies and the burden of the national debt. Econ. J. 1961, 71, 730–755. [Google Scholar] [CrossRef]
  21. Diamond, P.A. National debt in a neoclassical growth model. Am. Econ. Rev. 1965, 55, 1126–1150. [Google Scholar]
  22. Saint-Paul, G. Fiscal Policy in an Endogenous Growth Model. Q. J. Econ. 1992, 107, 1243–1259. [Google Scholar] [CrossRef]
  23. Dombi, Á.; Dedák, I. Public debt and economic growth: What do neoclassical growth models teach us? Appl. Econ. 2019, 51, 3104–3121. [Google Scholar] [CrossRef] [Green Version]
  24. Reinhart, C.M.; Rogoff, K.S. Growth in a Time of Debt. Am. Econ. Rev. 2010, 100, 573–578. [Google Scholar] [CrossRef]
  25. Woo, J.; Kumar, M.S. Public debt and growth. Economica 2015, 82, 705–739. [Google Scholar] [CrossRef]
  26. Baum, A.; Checherita-Westphal, C.; Rother, P. Debt and Growth: New Evidence for the Euro Area. J. Int. Money Financ. 2013, 32, 809–821. [Google Scholar] [CrossRef] [Green Version]
  27. Salmon, J. The Impact of Public Debt on Economic Growth. CatoJournal 2021, 41, 487–509. [Google Scholar]
  28. Liu, L.G.; Chen, S.Q. Should China allow local governments to borrow ? World Econ. 2006, 4, 37–41. [Google Scholar]
  29. Fan, J.Y.; Mo, J.W. Local Debt, Land Market and Regional Industrial Growth. Econ. Res. 2014, 1, 41–55. [Google Scholar]
  30. Zhu, W.W.; Chen, Y. Local government debt and regional economic growth. Financ. Res. 2014, 4, 114–121. [Google Scholar]
  31. Lu, J. Analysis of the Impact of Local Debt on Economic Growth—Based on the Perspective of Liquidity. Chin. Ind. Econ. 2015, 11, 16–31. [Google Scholar]
  32. Diao, W.T. Debt ratio, debt repayment pressure and economic growth effect of local debt. Quant. Econ. Tech. Econ. Res. 2017, 34, 59–77. [Google Scholar]
  33. Miao, X.L.; Cheng, L.N. The logic and thinking of PPP in preventing local government debt risk in China—From ‘behavioral sacrifice efficiency’ to ‘mechanism recovery efficiency’. Fisc. Res. 2015, 8, 68–75. [Google Scholar]
  34. Gong, Q.; Zhang, Y.L.; Lei, L.H. Government and Social Capital Cooperation (PPP): Public Goods Burden Theory from the Perspective of Incomplete Contract. Econ. Res. 2019, 54, 133–148. [Google Scholar]
  35. Zhang, Y.; Hou, W.; Qian, Y. A dynamic simulation model for financing strategy management of infrastructure PPP projects. Int. J. Strateg. Prop. Manag. 2020, 24, 441–455. [Google Scholar] [CrossRef]
  36. Duan, Y.X.; Guo, M. Sources of Government Financial Risks in PPP Projects. Manag. Mod. 2020, 40, 100–103. [Google Scholar]
  37. Wang, Y.; Yang, Y.J. New urbanization investment and financing mode selection and implementation path. Econ. Dimens. 2022, 3, 110–117. [Google Scholar]
  38. Government and Social Capital Cooperation Center. Available online: https://www.cpppc.org:8082/inforpublic/homepage.html#/homepage (accessed on 29 April 2017).
  39. Wind. Available online: https://www.wind.com.cn/portal/en/Home/index.html (accessed on 30 April 2017).
  40. CEIC Database. Available online: https://info.ceicdata.com/ceic-database-demo-request-social-media-cn (accessed on 29 April 2017).
  41. The China Urban Statistical Yearbook. Available online: https://www.yearbookchina.com/ (accessed on 30 April 2017).
  42. Barro, R.J. Economic growth in a cross section of countries. Q. J. Econ. 1991, 106, 407–443. [Google Scholar] [CrossRef] [Green Version]
  43. Ramirez, M.D. The impact of public investment on private investment spending in Latin America: 1980–1995. Atl. Econ. J. 2000, 28, 210–225. [Google Scholar] [CrossRef]
  44. Erden, L.; Holcombe, R.G. The linkage between public and private investment: A co-integration analysis of a panel of developing countries. East. Econ. J. 2006, 32, 479–492. [Google Scholar]
  45. Barro, R.J.; Grossman, H.I. A general disequilibrium model of income and employment. Am. Econ. Rev. 1971, 61, 82–93. [Google Scholar]
  46. Cebula, R.J. An empirical analysis of the “crowding out” effect of fiscal policy in the United States and Canada. Kyklos 1978, 31, 424–436. [Google Scholar] [CrossRef]
  47. Bairam, E.; Ward, B. The externality effect of government expenditure on investment in OECD countries. Appl. Econ. 1993, 25, 711–716. [Google Scholar] [CrossRef]
  48. Zhang, L.; Wei, H.C.; Ou, D.Y. Land financing, local debt and leverage-local financing platform land mortgage analysis. Financ. Res. 2019, 3, 92–110. [Google Scholar]
  49. Xin, C.C.; Xu, T.; Zhou, F. Passive or active—Based on the reinterpretation of the impact of vertical fiscal imbalances and regional competition on land financial dependence. Economist 2021, 4, 30–40. [Google Scholar]
  50. Zheng, Q.S.; Sun, W.Z.; Wu, J.; Wu, Y. ‘Finance by land, finance by land’ -Research on investment and financing mode of urban construction with Chinese characteristics. Econ. Res. 2014, 49, 14–27. [Google Scholar]
  51. Zhao, Y.J. Land Finance: History, Logic and Choice. Urban Dev. Res. 2014, 21, 1–13. [Google Scholar]
  52. Mei, D.; Wen, X.C. External shocks, land finance and macroeconomic policy dilemmas. Econ. Res. 2020, 55, 66–82. [Google Scholar]
  53. Liu, S.Y.; Jiang, S.S. Land financing and fiscal and financial risks—A case from a developed eastern region. Land Sci. China 2005, 19, 3–9. [Google Scholar]
  54. Liu, S.Y.; Wang, Z.F.; Zhang, W.F. The failure of the ‘ground for development’ model—An empirical study based on threshold regression model. Manag. World 2020, 36, 80–92, 119. [Google Scholar]
  55. Zhang, L.; Gong, G. Real estate cycle, local government financial pressure and financing platform land purchase. Financ. Res. 2020, 46, 4–18. [Google Scholar]
  56. Jia, K.; Sun, J. The concept, origin, characteristics and functions of public-private partnership (PPP). Financ. Res. 2009, 10, 2–10. [Google Scholar]
  57. Xie, X.R. Speech at the 2010 Annual Conference of the Chinese Society of Finance and the 18th National Financial Theory Seminar. Financ. Stud. 2010, 5, 2–9. [Google Scholar]
  58. Jia, K.; Liu, W. ‘Land Finance’: Analysis and Solution—To build a reasonable, standardized and sustainable local ‘land finance’ mechanism in deepening fiscal and tax reform. Financ. Res. 2012, 1, 2–9. [Google Scholar]
  59. Shi, Z. Research on the Measurement of Debt Repayment Ability of China’s Provincial Cities—Empirical Analysis Based on AHP. Macroecon. Res. 2018, 1, 94–102. [Google Scholar]
  60. Liu, J.L.; Meng, S.M. Realistic Logic of Local Government Implicit Debt Formation in China—Empirical Analysis Based on PPP Project. Friends Account. 2021, 21, 17–24. [Google Scholar]
  61. Zhou, G.G.; Lin, L.F.; Yu, J.X. Land urbanization, population urbanization and urban economic growth. Econ. Issues Explor. 2017, 10, 102–110. [Google Scholar]
  62. Nichols, D.A. Land and economic growth. Am. Econ. Rev. 1970, 60, 332–340. [Google Scholar]
  63. Zhang, S.C.; Li, D.K. Analysis of the Financial Basis of ‘Second Housing Reform’—Based on the Perspective of the Relationship between Land Finance and Real Estate Price. Financ. Res. 2010, 7, 5–11. [Google Scholar]
  64. Fu, M.J.; Zhang, P.; Yuan, F.H. Fiscal and taxation system evolution in the process of industrialization and urbanization: Facts, logic and policy choices. Econ. Res. 2017, 12, 29–45. [Google Scholar]
  65. Arellano, M.; Bond, S. Some tests of specification for panel data: Monte Carlo evidence and an application to employment equations. Rev. Econ. Stud. 1991, 58, 277–297. [Google Scholar] [CrossRef] [Green Version]
  66. Lu, M.; European, N.; Chen, B.K. Rationality or bubble: Empirical research on urbanization, migration and housing prices. World Econ. 2014, 1, 30–54. [Google Scholar]
  67. Vlil, T. An overview of economic theory and evidence of public-private partnerships in the procurement of (transport) infrastructure. Util. Policy 2020, 62, 100995. [Google Scholar] [CrossRef]
  68. Levikangas, P.; Ojala, L.; Tyli, J. An integrated ecosystem model for understanding infrastructure PPPs. Util. Policy 2016, 42, 10–19. [Google Scholar] [CrossRef]
  69. Yao, D.M.; Deng, H. Why the industry use of PPP is unevenly distributed—An optimal contract design based on industry characteristics. Financ. Trade Econ. 2017, 38, 82–98. [Google Scholar]
  70. Akomea-Frimpong, I.; Jin, X.; Osei-Kyei, R. Mapping Studies on Sustainability in the Performance Measurement of Public-Private Partnership Projects: A Systematic Review. Sustainability 2022, 14, 7174. [Google Scholar] [CrossRef]
  71. Weththasinghe, K.; Gajendran, T.; Brewer, G. Barriers in proper implementation of public–private partnerships (PPP) in Sri Lanka. In Proceedings of the 40th AUBEA 2016; Radical Innovation in the Built Environment, Cairns, Australia, 6–8 July 2016; pp. 858–869. [Google Scholar]
  72. Feng, G.; Hao, S.; Li, X. Project Sustainability and Public-Private Partnership: The Role of Government Relation Orientation and Project Governance. Sustainability 2022, 14, 4724. [Google Scholar] [CrossRef]
  73. Amadi, C.; Carrillo, P.; Tuuli, M. PPP projects: Improvements in stakeholder management. Eng. Constr. Archit. Manag. 2019, 27, 544–560. [Google Scholar] [CrossRef] [Green Version]
  74. Esposito, P.; Dicorato, S.L. Sustainable Development, Governance and Performance Measurement in Public Private Partnerships (PPPs): A Methodological Proposal. Sustainability 2020, 12, 5696. [Google Scholar] [CrossRef]
  75. Rajan, T.A.; Gopinath, G.; Behera, M. PPPs and project overruns: Evidence from road projects in India. J. Constr. Eng. Manag. 2014, 140, 04013070. [Google Scholar] [CrossRef]
  76. Likhitruangsilp, V.; Do, S.T.; Onishi, M. A comparative study on the risk perceptions of the public and private sectors in public-private partnership (PPP) transportation projects in Vietnam. Eng. J. 2017, 21, 213–231. [Google Scholar] [CrossRef] [Green Version]
  77. Wang, N.; Ma, M.; Liu, Y. The Whole Lifecycle Management Efficiency of the Public Sector in PPP Infrastructure Projects. Sustainability 2020, 12, 3049. [Google Scholar] [CrossRef] [Green Version]
  78. Sastoque, L.M.; Arboleda, C.A.; Ponz, J.L. A proposal for risk allocation in social infrastructure projects applying PPP in Colombia. Procedia Eng. 2016, 145, 1354–1361. [Google Scholar] [CrossRef]
Figure 1. Proportion of various PPP projects (Ministry of Finance PPP project application data collation).
Sustainability 14 14591 g001
Figure 2. Issuance Scale of City Investment Bonds (billion RMB, Ministry of Finance PPP project application data collation).
Sustainability 14 14591 g002
Figure 3. The ratio of urban investment bonds to the sum of urban investment bonds and PPP.
Sustainability 14 14591 g003
Figure 4. Pressure of economic downturn.
Sustainability 14 14591 g004
Figure 5. Differences between PPP Project Requirements and Project Applications.
Sustainability 14 14591 g005
Table 1. Land Finance and Risks.
Land Mortgage in 84 Key Cities (Data Source: China Land and Resources Bulletin)National Land Transfer Fees (Data Source: Ministry of Finance)Local Government Debt Balance (Data Source: Ministry of Finance)
YearTotal Mortgage Loans (Trillion Yuan)YearAmount (Trillion Yuan)YearLocal Government Debt Balance (Trillion Yuan)
20137.7620186.5201818.39
20149.5120196.8201924.08
201511.3320208.41202025.66
Table 2. Statistics of PPP Project Applications in Provinces (measurement unit: Each, billion RMB).
ProvinceNumber of PPP Project Applications (Each)Average Size of PPP Projects (Billion RMB)ProvinceNumber of PPP Project Applications (Each)Average Size of PPP Projects (Billion RMB)
Anhui15912.479Jiangxi2785.6422
Beijing9424.379Liaoning48311.580
Fujian27114.135Neimenggu7557.9107
Gansu46112.358Ningxia7224.116
Guangdong12317.064Qinghai7115.890
Guangxi15012.882Shandong105611.430
Guizhou17298.6558Shanxi3913.514
Hainan1319.8433Shaanxi2579.7808
Hebei44215.109Shanghai113.95
Henan74611.737Sichuan81110.896
Heilongjiang12112.244Tianjin178.8050
Hubei8614.311Xinjiang8365.4357
Hunan30116.758Yunnan40525.138
Jilin5721.604Zhejiang29517.274
Jiangsu33619.664Chongqing6532.706
Note: The data are from the project database of the Ministry of Finance of China’s PPP service platform (organized by the authors).
Table 3. Number of local financing platforms in provinces (measurement unit: Each).
ProvincesNumberProvincesNumberProvincesNumber
Anhui306Heilongjiang229Shandong440
Beijing159Hubei326Shanxi223
Fujian643Hunan557Shaanxi205
Gansu154Jilin206Shanghai229
Guangdong718Jiangsu775Sichuan794
Guangxi286Jiangxi500Tianjin145
Guizhou423Liaoning397Xinjiang183
Hainan30Neimenggu226Yunnan557
Hebei562Ningxia74Zhejiang1521
Henan391Qinghai90Chongqing372
Note: The data comes from the local government platform list and the author of the CBRC on 31 March 2016.
Table 4. Statistical description of variables (2003–2014).
VariableVariable DefinitionSample SizeMeanStandard Deviation
g g d p Per capita GDP growth rate (%)30640.1590.097
c t z Urban investment bonds (billions)30640.0150.052
c o u n t Financing platform (thousands)30640.0380.046
P P P n u m b e r PPP projects (Each)2392.2302.319
g p Housing price growth rate (%)30640.1440.328
g K Growth rate of capital (%)29830.2110.072
g L Growth rate of labor (%)30320.0730.184
g T Growth rate of land (%)30390.5092.536
ln   r o a d Logarithm of road paving area at the end of the year (10,000 square metres)30316.6781.001
ln   d e n s i t y Logarithmized resident population density (km2)30535.7340.921
g exp Fiscal expenditure (billions)306416.73529.353
d e f Deficit rate (%)30641.6681.7954
g p o p Permanent population growth rate (%)16140.0080.032
o p e n Economic openness (the proportion of FDI in fixed asset investment) (%)26830.0600.069
Table 5. Results of empirical model.
 (1)(2)(3)(4)(5)(6)(7)(8)
 Year < 2008
Fixed-Effects Model
Year > 2008
Fixed-Effects Model
DiffGMMSYSGMM
L . g g d p −0.076 **−0.076 **−0.076 **0.052 *0.049 *0.048 *0.073 ***0.076 ***
 (0.033)(0.033)(0.033)(0.026)(0.026)(0.026)(0.002)(0.003)
c t z −0.669−0.532−0.4460.037−0.077−0.071−0.063 ***−0.043 ***
 (0.431)(0.870)(0.869)(0.036)(0.065)(0.065)(0.005)(0.008)
c o u n t −0.273 **−0.271 **−0.033−0.118 *−0.165 **−0.132 *  
 (0.116)(0.116)(0.160)(0.061)(0.065)(0.071)  
g p 0.025 **0.025 **0.050 ***0.0030.0030.010−0.003 ***−0.000
 (0.011)(0.011)(0.016)(0.004)(0.004)(0.007)(0.001)(0.001)
g K 0.202 ***0.202 ***0.202 ***0.332 ***0.330 ***0.328 ***0.524 ***0.524 ***
 (0.055)(0.055)(0.055)(0.037)(0.037)(0.037)(0.005)(0.006)
g L 0.0030.0030.0010.0080.0080.008−0.029 ***−0.023 ***
 (0.021)(0.021)(0.021)(0.009)(0.009)(0.009)(0.002)(0.002)
g T 0.0020.0020.0020.0010.0010.001−0.001 ***−0.001 ***
 (0.002)(0.002)(0.002)(0.001)(0.001)(0.001)(0.000)(0.000)
c o u n t × c t z  −1.079−2.561 1.075 **0.990 *  
  (5.939)(5.965) (0.514)(0.519)  
c o u n t × g p   −1.187 **  −0.268  
   (0.546)  (0.225)  
L . g g d p −0.076 **−0.076 **−0.076 **0.052 *0.049 *0.048 *0.073 ***0.076 ***
 (0.033)(0.033)(0.033)(0.026)(0.026)(0.026)(0.002)(0.003)
Time dummyYes Yes Yes Yes Yes Yes Yes Yes
Regional dummyYes Yes Yes Yes Yes Yes Yes Yes
N90990990914471447144726132613
adj. R20.1740.1730.1760.4870.4890.489  
Note: Standard error in parentheses; *, **, and *** represent the levels of 10%, 5%, and 1%, respectively.
Table 6. Heckman selection model prediction results.
Coef. St.Err. t-Valuep-Value [95% Conf Interval] Sig
PPP number
g5.9533.5111.700.09−0.92812.835*
def−0.1160.165−0.700.482−0.4380.207 
gpop0.19613.6170.010.989−26.49326.885 
ln road−0.4760.301−1.580.114−1.0660.114 
ln density0.2740.1282.140.0320.0230.525**
g exp0.0020.0030.700.484−0.0040.009 
Constant3.9422.0221.950.051−0.0227.905*
e
g−6.0930.965−6.310−7.985−4.201***
def−0.0910.048−1.890.059−0.1860.004*
gpop−5.4551.713−3.180.001−8.813−2.097***
ln road0.1430.0632.250.0240.0190.267**
ln density−0.1090.056−1.930.054−0.2190.002*
g exp0.0040.0013.4800.0020.007***
open−6.8151.307−5.210−9.377−4.253***
Constant−0.2790.508−0.550.584−1.2750.718 
athrho−0.1860.082−2.270.023−0.346−0.025**
ln sigma0.7680.1544.9700.4651.07***
Mean dependent var0.132SD dependent var 0.338
Number of obs 1383Chi-square 8.669
Prob > chi2 0.193Akaike crit. (AIC)1727.628
Note: Standard error in parentheses; *, **, and *** represent the levels of 10%, 5%, and 1%, respectively.
Table 7. Alternative relationship.
 Testing Model 5Robust Test
  P P P ^ P P P ^
c t z −0.824 **−0.531 **
 (0.321)(0.262)
c o u n t −1.847 ***−1.720 ***
 (0.346)(0.322)
Constant3.220 ***3.230 ***
 (0.122)(0.124)
Year dummy variableYesYes
N14081600
r20.2240.248
F31.01340.307
Note: Standard error in parentheses; **, and *** represent the levels of 10%, 5%, and 1%, respectively.
Publisher’s Note: MDPI stays neutral with regard to jurisdictional claims in published maps and institutional affiliations.

