


Factors Influencing Residential Location Choice towards Mixed Land-Use Development: An Empirical Evidence from Pakistan


Abstract
:1. Introduction
2. Literature Review
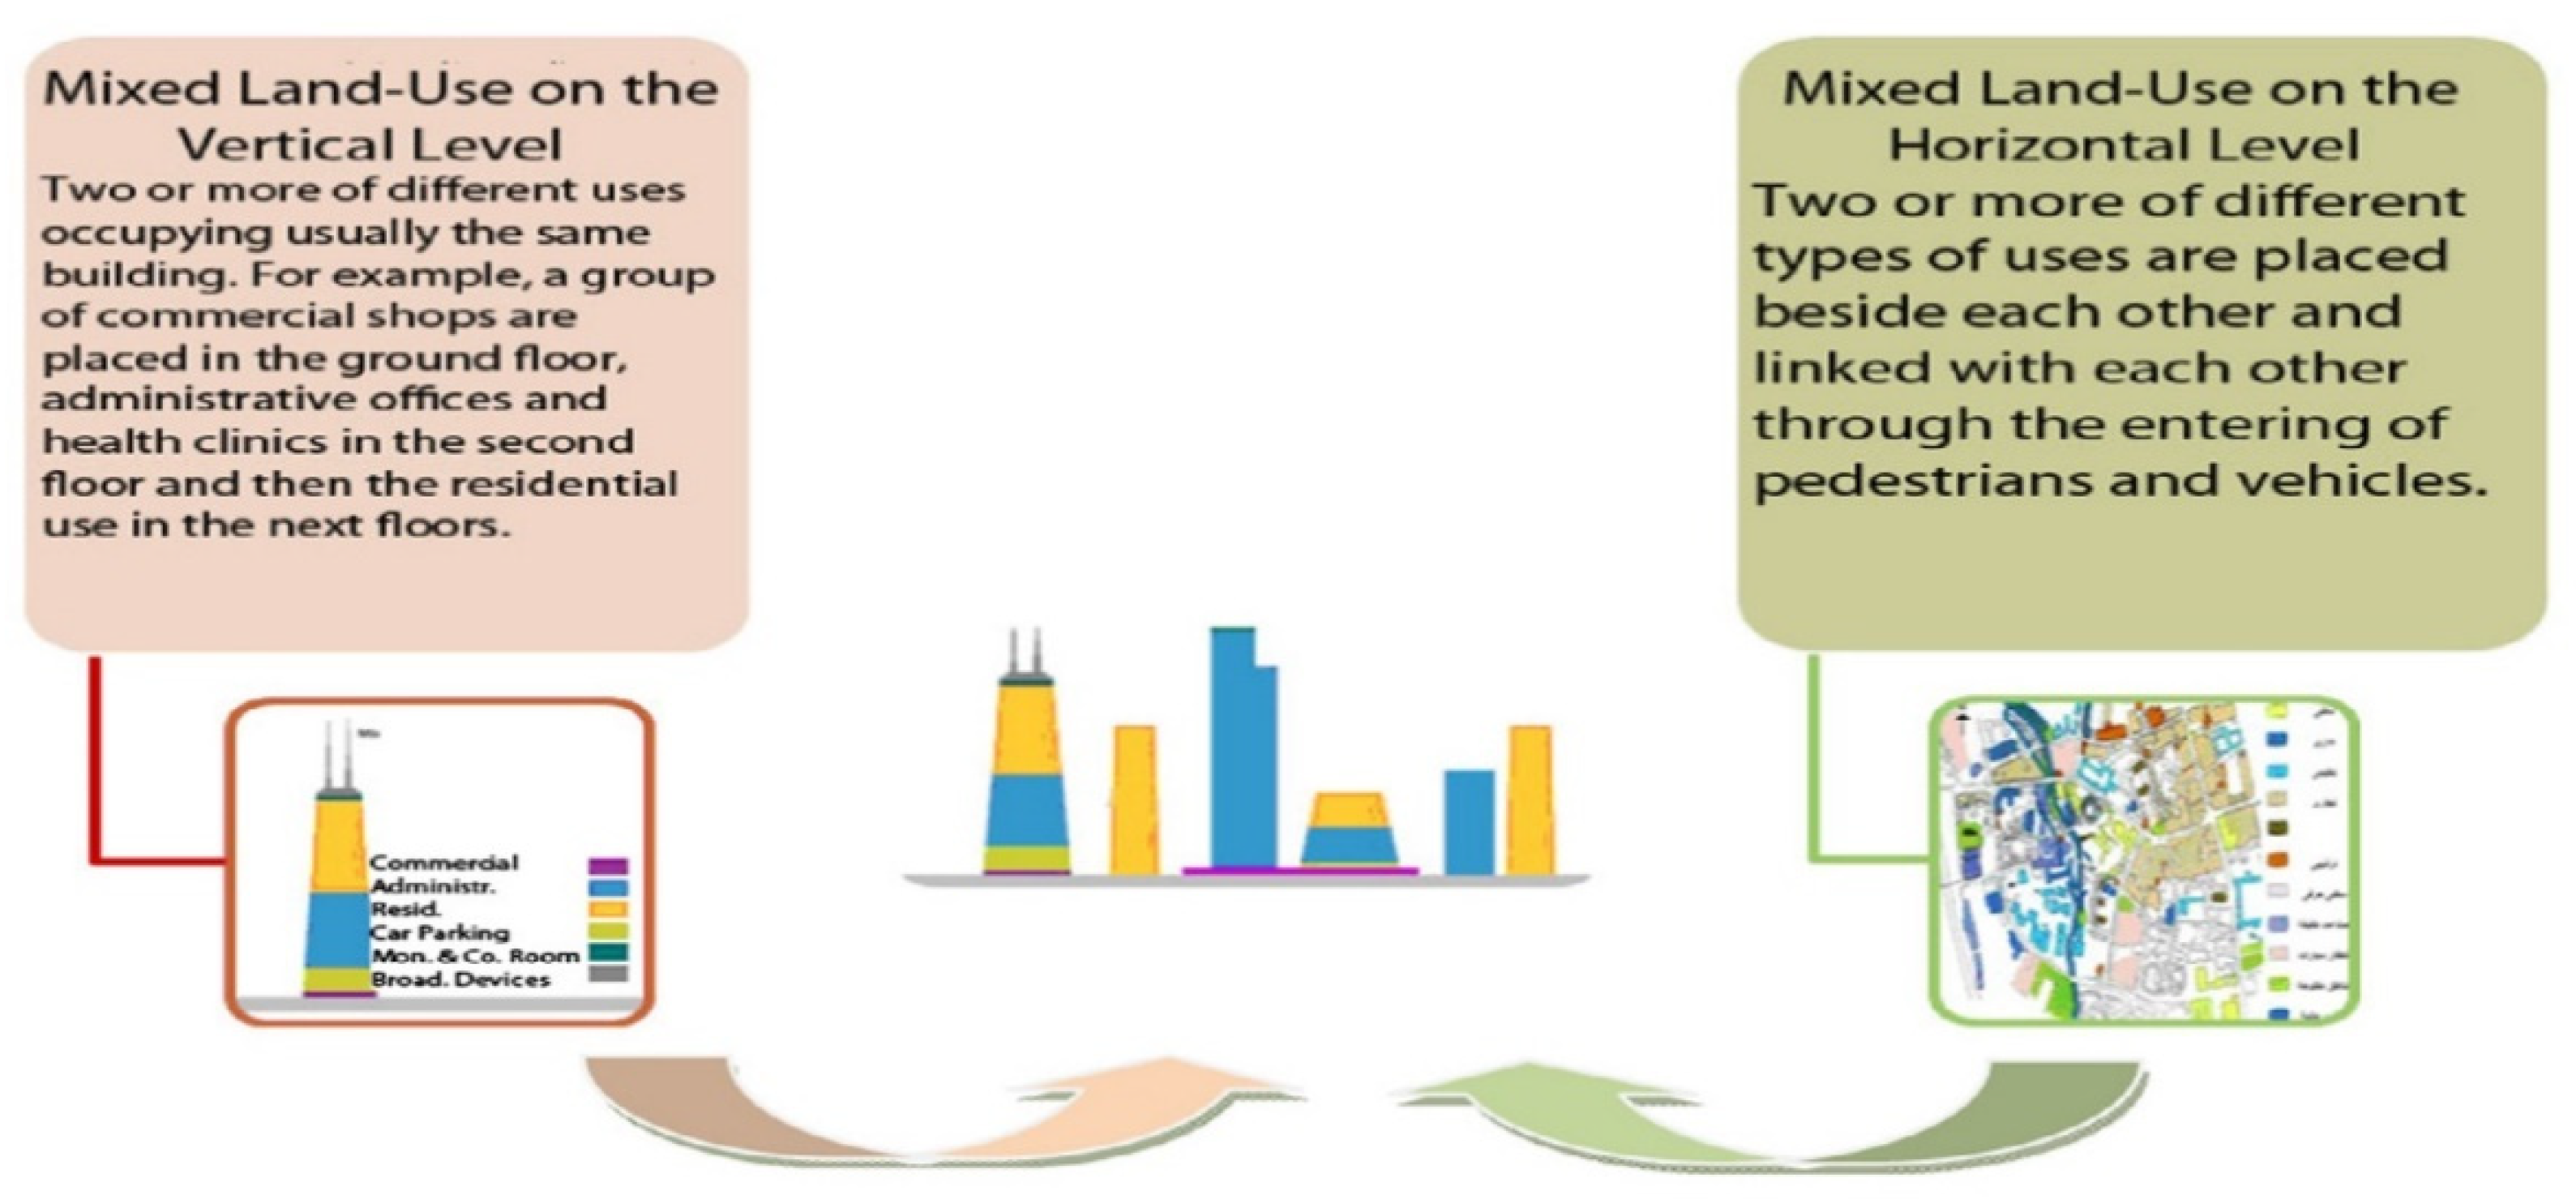
2.1. Rowley’s Model for Mixed Land Use Typology
2.2. Hoppen Brouwer and Louw’s Mixed-Use Model
2.3. Connotation of Mixed Land-Use
3. Method and Materials
3.1. Study Area
3.2. Methods
3.2.1. Delphi Method (DM)
3.2.2. Demographic Information of Experts
4. Results
4.1. Round One Delphi Survey
4.1.1. Physical Factors
4.1.2. Economic Factors
4.1.3. Social Factors
4.1.4. Environmental Factors
4.2. Round Two Delphi Survey
4.2.1. Physical Factors
4.2.2. Economic Factors
4.2.3. Social Factors
4.2.4. Environmental Factors
4.3. Discussion
4.3.1. Physical Factors
4.3.2. Economic Factors
4.3.3. Social Factors
4.3.4. Environmental Factors
4.4. Policy Implications
- The travel cost and low-rent facilities are highly endorsed by the experts as the key MLU development factors. Thus, urban planning policies should be made considering the low-cost multiple travel options available for the people living in MLUs. On the other hand, because of the high demand, the housing rents were found beyond the reach of the common man. It is recommended that public and private sector agencies should formulate policies focusing on low-cost residential facilities in the MLU centers.
- The second prominent factor is the availability of household items and shared utility services. Thus, the policies should be formulated accordingly while designing MLUs, considering the availability of household items access to residents. Provision of utility services in MLUs at ease for residents.
- The third important factor endorsed by experts is the economic vitality due to commercial activities in MLUs. The decision makers, while drawing the policies, should emphasize the provision of commercial activities together with suitable parking spaces.
- The fourth prominent factor is demographic change and social poverty. The policies should be designed in a way that should eradicate poverty and provide equal employment opportunities to all residents. Population density should also be maintained with the provision of policy implications throughout MLU zones. A livable environment for residents may be provided, so they perform their social activities freely. This research parameter is linked to SDG goal number 10, i.e., reduced inequalities.
- The fifth imperative factor is access to public services in MLUs. The planning of MLUs should be followed by the provision of public services within residents’ approach at walking distance.
- The sixth significant factor is easy to access to restaurants and fast-food franchises. Residents prefer ready-to-eat food available within walking distance. Policies should be designed to make it more convenient and cost-effective for residents.
5. Conclusions
Author Contributions
Funding
Institutional Review Board Statement
Informed Consent Statement
Data Availability Statement
Acknowledgments
Conflicts of Interest
References
- Ghosh, P. Mixed landuse practices and implications. Int. J. Sci. Dev. Res. 2017, 2, 1–8. [Google Scholar]
- Zhu, L.; Guo, Y.; Zhang, C.; Meng, J.; Ju, L.; Zhang, Y.; Tang, W. Assessing community-level livability using combined remote sensing and internet-based big geospatial data. Remote Sens. 2020, 12, 4026. [Google Scholar] [CrossRef]
- Pan, W. What type of mixed-use and open? A critical environmental analysis of three neighborhood types in China and insights for sustainable urban planning. Landsc. Urban Plan. 2021, 216, 104221. [Google Scholar] [CrossRef]
- Sharma, A.; Tiwari, G.; Rao, K.R. Identifying mixed use indicators for including informal settlements as a distinct land use: Case study of Delhi. Transp. Res. Procedia 2020, 48, 1918–1930. [Google Scholar] [CrossRef]
- McDonald, J.F. Economics, calibration of a monocentric city model with mixed land use and congestion. Reg. Sci. Urban Econ. 2009, 39, 90–96. [Google Scholar] [CrossRef]
- Tian, L.; Liang, Y.; Zhang, B. Measuring residential and industrial land use mix in the peri-urban areas of China. Land Use Policy 2017, 69, 427–438. [Google Scholar] [CrossRef]
- Arain, S.; Shaikh, F.; Shaikh, M.M. Problem of traffic congestion and correlation analysis of driving behaviors in Qasimabad, Hyderabad. Mehran Univ. Res. J. Eng. Technol. 2017, 36, 139–148. [Google Scholar] [CrossRef] [Green Version]
- Bahadure, S.; Kotharkar, R. Framework for measuring sustainability of neighbourhoods in Nagpur, India. Build. Environ. 2018, 127, 86–97. [Google Scholar] [CrossRef]
- Song, Y.; Knaap, G.-J. Measuring the effects of mixed land uses on housing values. Reg. Sci. Urban Econ. 2004, 34, 663–680. [Google Scholar] [CrossRef]
- Rehman, A.; Asghar, Z. Mixed use of land in big cities of Pakistan and its impact on reduction in commuting and congestion cost. J. Archit. Plan. 2016, 21, 17–28. [Google Scholar]
- Brown, B.B.; Yamada, I.; Smith, K.R.; Zick, C.D.; Kowaleski-Jones, L.; Fan, J.X. Mixed land use and walkability: Variations in land use measures and relationships with BMI, overweight, and obesity. Health Place 2009, 15, 1130–1141. [Google Scholar] [CrossRef] [Green Version]
- Nuhu, S. Peri-urban land governance in developing countries: Understanding the role, interaction and power relation among actors in Tanzania. Urban Forum 2018, 30, 1–16. [Google Scholar] [CrossRef]
- Song, Y.; Merlin, L.; Rodriguez, D. Comparing measures of urban land use mix. Comput. Environ. Urban Syst. 2013, 42, 1–13. [Google Scholar] [CrossRef]
- Wilkinson, R.G.; Marmot, M. Social Determinants of Health: The Solid Facts; World Health Organization: Geneva, Switzerland, 2003. [Google Scholar]
- Giannarou, L.; Zervas, E. Using Delphi technique to build consensus in practice. Int. J. Bus. Sci. Appl. Manag. 2014, 9, 65–82. [Google Scholar]
- Nabil, N.A.; Eldayem, G.E.A. Influence of mixed land-use on realizing the social capital. HBRC J. 2019, 11, 285–298. [Google Scholar] [CrossRef] [Green Version]
- Grant, J. Mixed use in theory and practice: Canadian experience with implementing a planning principle. J. Am. Plan. Assoc. 2002, 68, 71–84. [Google Scholar] [CrossRef]
- Hoppenbrouwer, E.; Louw, E. Mixed-use development: Theory and practice in Amsterdam’s Eastern Docklands. Eur. Plan. Stud. 2007, 13, 967–983. [Google Scholar] [CrossRef]
- Farjam, R.; Motlaq, S.M.H. Does urban mixed use development approach explain spatial analysis of inner city decay? J. Urban Manag. 2019, 8, 245–260. [Google Scholar] [CrossRef]
- Herndon, J.D. Mixed-Use Development in Theory and Practice: Learning from Atlanta’s Mixed Experiences; Georgia Institute of Technology: Atlanta, GA, USA, 2011. [Google Scholar]
- Stucky, T.D.; Ottensmann, J.R.J.C. Land use and violent crime. Criminology 2009, 47, 1223–1264. [Google Scholar] [CrossRef] [Green Version]
- Matijosaitiene, I.; Zhao, P.; Jaume, S.; Gilkey, J.W., Jr. Prediction of hourly effect of land use on crime. ISPRS Int. J. Geo Inf. 2019, 8, 16. [Google Scholar] [CrossRef] [Green Version]
- Zhang, W.J.U.S. Does compact land use trigger a rise in crime and a fall in ridership? A role for crime in the land use–travel connection. Urban Stud. 2016, 53, 3007–3026. [Google Scholar]
- McConville, M.E.; A Rodriguez, D.; Clifton, K.; Cho, G.; Fleischhacker, S. Disaggregate land uses and walking. Am. J. Prev. Med. 2011, 40, 25–32. [Google Scholar] [CrossRef] [PubMed]
- Ma, W.; Jiang, G.; Zhou, T.; Zhang, R. Mixed land uses and community decline: Opportunities and challenges for mitigating residential vacancy in peri-urban villages of China. Front. Environ. Sci. 2022. [Google Scholar] [CrossRef]
- Ozbil, A.; Peponis, J.; Stone, B. Understanding the link between street connectivity, land use and pedestrian flows. Urban Des. Int. 2011, 16, 125–141. [Google Scholar] [CrossRef]
- Manaugh, K.; Kreider, T. What is mixed use? Presenting an interaction method for measuring land use mix. J. Transp. Land Use 2013, 6, 63–72. [Google Scholar]
- Al-Thani, S.K. Neighborhood Sustainability and Livability in Qatar National Development Framework 2032. Int. J. Res. Environ. Stud. 2019, 6, 47–56. [Google Scholar]
- Newman, P.; Kenworthy, J. ‘Peak car use’: Understanding the demise of automobile dependence. World Transp. Policy Pract. 2011, 17, 31–42. [Google Scholar]
- Zahnow, R. Mixed Land Use: Implications for Violence and Property Crime; SAGE Publications Sage CA: Los Angeles, CA, USA, 2018. [Google Scholar]
- Hirt, S.A. Rooting out mixed use: Revisiting the original rationales. Land Use Policy 2016, 50, 134–147. [Google Scholar] [CrossRef]
- Newman, P.; Kenworthy, J. The End of Automobile Dependence. In The End of Automobile Dependence; Springer: Berlin/Heidelberg, Germany, 2015; pp. 201–226. [Google Scholar]
- Wheaton, W.C. Commuting, congestion, and employment dispersal in cities with mixed land use. J. Urban Econ. 2004, 55, 417–438. [Google Scholar] [CrossRef]
- Martinuzzi, S.; Gould, W.A.; González, O.M.R. Land development, land use, and urban sprawl in Puerto Rico integrating remote sensing and population census data. Landsc. Urban Plan. 2007, 79, 288–297. [Google Scholar] [CrossRef]
- Shi, B.; Yang, J. Scale, distribution, and pattern of mixed land use in central districts: A case study of Nanjing, China. Habitat Int. 2015, 46, 166–177. [Google Scholar] [CrossRef]
- Geyer, H.; Quin, L. Social diversity and modal choice strategies in mixed land-use development in South Africa. S. Afr. Geogr. J. 2019, 101, 1–21. [Google Scholar] [CrossRef]
- Yildirim, Y.; Arefi, M. How does mixed-use urbanization affect noise? Empirical research on transit-oriented developments (TODs). Habitat Int. 2021, 107, 102297. [Google Scholar] [CrossRef]
- Cozens, P.; Hillier, D. Revisiting Jane Jacobs’s ‘Eyes on the Street’for the Twenty-First Century: Evidence from Environmental Criminology; Routledge: London, UK, 2012; pp. 196–214. [Google Scholar]
- Browning, C.R.; Byron, R.A.; Calder, C.A.; Krivo, L.J.; Kwan, M.-P.; Lee, J.-Y.; Peterson, R.D. Commercial density, residential concentration, and crime: Land use patterns and violence in neighborhood context. J. Res. Crime Delinq. 2010, 47, 329–357. [Google Scholar] [CrossRef]
- Wo, J.C. Mixed land use and neighborhood crime. Soc. Sci. Res. 2019, 78, 170–186. [Google Scholar] [CrossRef]
- Wo, J.C.; Kim, Y.-A. Neighborhood Effects on Crime in San Francisco: An Examination of Residential, Nonresidential, and “Mixed” Land Uses. Deviant Behav. 2020, 43, 61–78. [Google Scholar] [CrossRef]
- Twinam, T. Danger zone: Land use and the geography of neighborhood crime. J. Urban Econ. 2017, 100, 104–119. [Google Scholar] [CrossRef]
- MacDonald, J.M.; Stokes, R.J. Gentrification, land use, and crime. Annu. Rev. Criminol. 2020, 3, 121–138. [Google Scholar] [CrossRef] [Green Version]
- Song, J.; Andresen, M.A.; Brantingham, P.L.; Spicer, V. Crime on the edges: Patterns of crime and land use change. Cartogr. Geogr. Inf. Sci. 2017, 44, 51–61. [Google Scholar] [CrossRef]
- Abdullahi, S.; Pradhan, B.; Mansor, S.; Shariff, A.R.M. GIS-based modeling for the spatial measurement and evaluation of mixed land use development for a compact city. GIScience Remote Sens. 2015, 52, 18–39. [Google Scholar] [CrossRef]
- Aurand, A. Density, housing types and mixed land use: Smart tools for affordable housing? Urban Stud. 2010, 47, 1015–1036. [Google Scholar] [CrossRef]
- Matthews, J.W.; Turnbull, G.K. Neighborhood street layout and property value: The interaction of accessibility and land use mix. J. Real Estate Finance Econ. 2007, 35, 111–141. [Google Scholar] [CrossRef]
- Koster, H.R.; Rouwendal, J. The impact of mixed land use on residential property values. J. Reg. Sci. 2012, 52, 733–761. [Google Scholar] [CrossRef] [Green Version]
- Wu, J.; Song, Y.; Liang, J.; Wang, Q.; Lin, J. Impact of mixed land use on housing values in high-density areas: Evidence from Beijing. J. Urban Plan. Dev. 2018, 144, 05017019. [Google Scholar] [CrossRef]
- Yang, H.J.; Song, J.; Choi, M.J. Measuring the externality effects of commercial land use on residential land value: A case study of Seoul. Sustainability 2016, 8, 432. [Google Scholar] [CrossRef] [Green Version]
- Van, U.P.; Senior, M. The Contribution of Mixed Land Uses to Sustainable Travel in Cities; Routledge: London, UK, 2000; pp. 139–148. [Google Scholar]
- Van Acker, V.; Witlox, F. Commuting trips within tours: How is commuting related to land use? Transportation 2011, 38, 465–486. [Google Scholar] [CrossRef]
- Cervero, R. Mixed land-uses and commuting: Evidence from the American Housing Survey. Transp. Res. Part A Policy Pract. 1996, 30, 361–377. [Google Scholar] [CrossRef]
- Baqa, M.F.; Chen, F.; Lu, L.; Qureshi, S.; Tariq, A.; Wang, S.; Jing, L.; Hamza, S.; Li, Q. Monitoring and modeling the patterns and trends of urban growth using urban sprawl matrix and CA-Markov model: A case study of Karachi, Pakistan. Land 2021, 10, 700. [Google Scholar] [CrossRef]
- Ul Din, S.; Mak, H.W.L. Retrieval of Land-Use/Land Cover Change (LUCC) maps and urban expansion dynamics of Hyderabad, Pakistan via landsat datasets and support vector machine framework. Remote Sens. 2021, 13, 3337. [Google Scholar] [CrossRef]
- KARACHI CENTRAL_BLOCKWISE, in Pakistan Beaureau of Statistics. 2017. Available online: https://www.pbs.gov.pk/content/final-results-census-2017 (accessed on 9 September 2022).
- HYDERABAD_BLOCKWISE, in Pakistan Beaureau of Statistics. 2017. Available online: https://www.pbs.gov.pk/content/final-results-census-2017 (accessed on 9 September 2022).
- Peerzado, M.B.; Magsi, H.; Sheikh, M.J. Urbanization and causes of agricultural land conversion in Hyderabad, Sindh, Pakistan. Int. J. Dev. Sustain. 2018, 7, 755–763. [Google Scholar]
- Pakistan Beaureau of Statistics. Population Size and Growth of Major Cities (Census 98); Pakistan Beaureau of Statistics: Islamabad, Pakistan, 1998.
- KSDP. Karachi Strategic Development Plan 2020 (KSDP—2020); ECIL: Karachi, Pakistan, 2020; Available online: http://ecil.com/projects/details/Karachi-Strategic-Development-Plan-2020-KSDP-2020 (accessed on 9 September 2022).
- Huang, S.-W.; Tsai, W.-J. The analysis of measurements and influence factors of mixed land use. Int. J. Biosci. Biochem. Bioinform. 2013, 3, 206. [Google Scholar] [CrossRef] [Green Version]
- Green, H.; Hunter, C.; Moore, B. Application of the Delphi technique in tourism. Ann. Tour. Res. 1990, 17, 270–279. [Google Scholar] [CrossRef]


| S. No. | Factors Driving Mixed Land Uses | Empirical Evidence |
|---|---|---|
| Physical | ||
| 1 | Land Use Diversity/mix forms of housing | [1,4,11,13,15,16,19,20,26,27,28,29] |
| 2 | Land use intensity due to urbanization (vibrant land use features in mixed land use areas) | [1,4,9,13,25,26,27,29] |
| 3 | Low quality of dwellings | [4,19] |
| 4 | Inexpedient transit linkages | [1,4,5,11,16,25] |
| 5 | Synergy effects (combined)/Compact features of land use | [13,15,25] |
| 6 | The demand for livable developments (easy access to restaurants and other fast food franchises, etc.) | [9,15,18,25] |
| 7 | Low-skilled labor force (due to the absence of utility services in suburban areas) | [4,19] |
| 8 | Demand for walkable communities/Bicycling modes (reduction in commuting time, cost affects the demand for MLU) | [1,4,10,11,13,14,19,26,29,30,31] |
| Economic | ||
| 9 | Economic vitality | [4,11,18,20,25,32] |
| 10 | Increase in Infrastructure and Fuel Costs | [1,4,21,25,26,31] |
| 11 | Stimulation of Local Economy | [17,18,22] |
| 12 | Automobile Dependence | [1,13,14,21,23,25,26,30,31,33] |
| 13 | Detachment from jobs | [4,5,9,19,33] |
| 14 | Employment is one of the factors that people are getting more focused on MLU due to the generation of more employment opportunities | [4,5,9,19,25,33,34,35] |
| Social | ||
| 15 | Lack of Accessibility to nearby public services | [1,9,19,29,33] |
| 16 | Low Public Health | [4,11,26] |
| 17 | Lack of Spaces and activity-oriented destinations | [19,25] |
| 18 | Need for safer and more vibrant neighborhoods. | [17,18,22,27,28,30,31] |
| 19 | Demographic change and Social Poverty | [1,18,19,26] |
| 20 | Increase in travel need | [4,11,13,15,16,19,25,26,33] |
| 21 | MLU enhances the Sense of Place | [13,14,31,36] |
| Environmental | ||
| 22 | Degrading Environmental impacts | [1,14,18,25] |
| 23 | Energy Consumption | [9,15,25] |
| 24 | Pollution and Traffic Congestion | [5,9,10,11,14,15,23,26,31,33,34,35] |
| 25 | More Noise occurrence in segregated developments leads societies to focus on MLU | [17,22,37] |
| 26 | The revolutionary shift in Industrialization is a major driving factor for MLU | [11,25,26] |
| 27 | MLU may reduce property crime | [16,17,18,22,27,28,38,39,40,41,42,43,44] |
| 28 | Supporting Social equality/social differences/local community | [13,17,18,22] |
| 29 | Improving health and well being | [13,17,18,22,30,31] |
| 30 | MLU promotes Pedestrian Activity | [13,14,17,18,22,29,30,31,33] |
| 31 | MLU is influenced by Violent crime considering the nearby neighborhood | [27,39] |
| 32 | Property Values tend to fall with proximity to Mixed Land use | [13,31,45,46,47,48,49,50] |
| 33 | MLU improves Locational Convenience | [13,31,46,49] |
| 34 | Reduction in commuting time affects the demand for MLU | [13,33,51,52,53] |
| S No. | Extracted MLU Factors | Code Assigned | Extracted from Literature | Proposed by Experts in Local Context |
|---|---|---|---|---|
| Physical Factors | ||||
| 1 | Land Use Diversity/mix forms of housing | P1 | ✓ | |
| 2 | Vibrant Land use features in mixed land use areas | P2 | ✓ | |
| 3 | Low-quality living conditions in scattered urban locations | P3 | ✓ | |
| 4 | Inexpedient transit linkages or Unavailability of transport facilities in low-density areas | P4 | ✓ | |
| 5 | Compact features of land use | P5 | ✓ | |
| 6 | Due to the absence of utility services in suburban areas | P6 | ✓ | |
| 7 | More travel opportunities in mixed land-use areas | P7 | ✓ | |
| 8 | Due to the housing backlog | P8 | ✓ | |
| 9 | People like to live near historical places around the city Center | P9 | ✓ | |
| 10 | Easy access to restaurants and other food fast franchises | P10 | ✓ | |
| 11 | Reduction in commuting time affects the demand for MLU | P11 | ✓ | |
| 12 | Availability of infrastructure in MLU areas (health and educational facilities) | P12 | ✓ | |
| 13 | The overall layout and size of a city with mixed land use suits the middle class that is in majority | P13 | ✓ | |
| 14 | Sustainable, environmentally friendly, and use of minimal designs in mixed land-use Neighborhood | P14 | ✓ | |
| 15 | A Range of Housing Opportunities and Choices | P15 | ✓ | |
| Economic Factors | ||||
| 16 | Economic vitality due to commercial activities | EC1 | ✓ | |
| 17 | Increase in Infrastructure and Fuel Costs in scattered areas | EC2 | ✓ | |
| 18 | Stimulation of Local Economy | EC3 | ✓ | |
| 19 | More Automobile Dependence in areas other than MLU | EC4 | ✓ | |
| 20 | More employment opportunities in mixed land-use areas | EC5 | ✓ | |
| 21 | More household savings in mixed land use areas like; travel costs, low rent, availability of household items nearby, and shared utility services. | EC6 | ✓ | |
| 22 | Availability of a variety of options in purchasing of grocery and other shopping items | EC7 | ✓ | |
| 23 | Property Values tend to fall with proximity to Mixed Land use | EC8 | ✓ | |
| 24 | Things are available nearby, variety and part-time jobs and business opportunities | EC9 | ✓ | |
| 25 | The distance from nearby markets; Distance from markets affects land use because many perishable crops need to reach the markets in fresh condition. | EC10 | ✓ | |
| 26 | Availability of cheap labor in mixed land-use areas | EC11 | ✓ | |
| Social Factors | ||||
| 26 | Accessibility to nearby public services | S1 | ✓ | |
| 27 | Low Public Health facilities and standards in sub-urban areas | S2 | ✓ | |
| 28 | Spaces and activity-oriented destinations | S3 | ✓ | |
| 29 | Need for safer and more vibrant neighborhoods. | S4 | ✓ | |
| 30 | Demographic change and Social Poverty | S5 | ✓ | |
| 31 | MLU enhances the Sense of Place/community life | S6 | ✓ | |
| 32 | The more civilized social environment in mixed land-use areas | S7 | ✓ | |
| 33 | social security and safety in mixed land use areas | S8 | ✓ | |
| 34 | Supporting Social equality/social differences/local community | S9 | ✓ | |
| 35 | Diversified cultural values, sects, languages, castes, religions | S10 | ✓ | |
| 36 | More religious and civic facilities | S11 | ✓ | |
| 37 | More security and safety for women | S12 | ✓ | |
| 38 | MLU may reduce property crime | S13 | ✓ | |
| 39 | Encourage Community and Stakeholder Collaboration | S14 | ✓ | |
| Environmental Factors | ||||
| 40 | Degrading Environmental conditions in sub-urban areas | EN1 | ✓ | |
| 41 | The demand for livable environment | EN2 | ✓ | |
| 42 | The revolutionary shift in Industrialization is a major driving factor for MLU | EN3 | ✓ | |
| 43 | Good water supply and drainage facilities in mixed land use areas | EN4 | ✓ | |
| 44 | Improved solid waste system in mixed land use areas | EN5 | ✓ | |
| 45 | Healthy environment and well being | EN6 | ✓ | |
| 46 | MLU promotes Pedestrian friendly environment | EN7 | ✓ | |
| 47 | Easy access to green spaces | EN8 | ✓ | |
| 48 | MLU improves Locational Convenience | EN9 | ✓ | |
| 49 | Strong municipal environment | EN10 | ✓ | |
| 50 | Land Use Diversity/mix forms of housing | EN11 | ✓ | |
| Co-Efficient of Variation | Level of Consensus Achieved |
|---|---|
| High | |
| Acceptable | |
| Not acceptable |
| Demographic Information | Round 1 | Round 2 |
|---|---|---|
| Experts City | ||
| Karachi | 18 | 12 |
| Hyderabad | 14 | 12 |
| 32 | 24 | |
| Type of current organization | ||
| Private | 18 | 13 |
| Government | 11 | 10 |
| Semi government | 03 | 01 |
| Field of experts | ||
| Civil engineer | 11 | 05 |
| Urban planner | 07 | 07 |
| Transport planner | 01 | 01 |
| Environmental expert | 01 | 01 |
| Project manager | 01 | 0 |
| Private consultant | 01 | 0 |
| Architect | 08 | 08 |
| GIS Specialist | 01 | 01 |
| Other | 0 | 0 |
| National level expert | 01 | 01 |
| Total | 32 | 24 |
| S No. | Factor Code | Mean | SD | CV | Level of Consensus |
|---|---|---|---|---|---|
| 1 | P1 | 3.63 | 1.185 | 32.67802 | Not acceptable |
| 2 | P2 | 3.59 | 1.043 | 29.02064 | Acceptable |
| 3 | P3 | 3.34 | 1.208 | 36.11974 | Not acceptable |
| 4 | P4 | 3.66 | 1.153 | 31.53775 | Not acceptable |
| 5 | P5 | 3.63 | 1.070 | 29.52061 | Acceptable |
| 6 | P6 | 3.63 | 0.976 | 26.91052 | Acceptable |
| 7 | P7 | 3.91 | 1.058 | 27.09201 | Acceptable |
| 8 | P8 | 3.81 | 1.148 | 30.11884 | Not acceptable |
| 9 | P9 | 2.94 | 1.294 | 44.03726 | Not acceptable |
| 10 | P10 | 3.75 | 0.984 | 26.23303 | Acceptable |
| 11 | P11 | 3.88 | 1.008 | 26.01374 | Acceptable |
| 12 | EC1 | 4.06 | 0.759 | 18.6917 | High |
| 13 | EC2 | 4.03 | 1.121 | 27.81235 | Acceptable |
| 14 | EC3 | 3.81 | 0.859 | 22.53149 | Acceptable |
| 15 | EC4 | 3.72 | 1.023 | 27.52041 | Acceptable |
| 16 | EC5 | 4.28 | 0.813 | 18.97991 | High |
| 17 | EC6 | 4.34 | 0.745 | 17.15754 | High |
| 18 | EC7 | 4.31 | 0.780 | 18.09396 | High |
| 19 | EC8 | 3.41 | 1.043 | 30.61811 | Not acceptable |
| 20 | S1 | 3.75 | 0.916 | 24.42163 | Acceptable |
| 21 | S2 | 4.00 | 1.136 | 28.39809 | Acceptable |
| 22 | S3 | 3.69 | 1.203 | 32.62792 | Not acceptable |
| 23 | S4 | 3.97 | 0.999 | 25.18415 | Acceptable |
| 24 | S5 | 4.06 | 0.801 | 19.70967 | High |
| 25 | S6 | 3.97 | 0.822 | 20.72295 | Acceptable |
| 26 | S7 | 3.97 | 0.999 | 25.18415 | Acceptable |
| 27 | S8 | 3.97 | 0.999 | 25.18415 | Acceptable |
| 28 | S9 | 3.81 | 0.998 | 26.17657 | Acceptable |
| 29 | S10 | 3.66 | 1.208 | 33.03258 | Not acceptable |
| 30 | S11 | 3.59 | 1.132 | 31.49699 | Not acceptable |
| 31 | S12 | 3.84 | 1.194 | 31.07186 | Not acceptable |
| 32 | S13 | 3.66 | 1.234 | 33.75519 | Not acceptable |
| 33 | EN1 | 3.88 | 1.289 | 33.26221 | Not acceptable |
| 34 | EN2 | 4.13 | 0.976 | 23.64864 | Acceptable |
| 35 | EN3 | 3.47 | 1.164 | 33.54356 | Not acceptable |
| 36 | EN4 | 3.94 | 1.294 | 32.8532 | Not acceptable |
| 37 | EN5 | 3.78 | 1.263 | 33.4079 | Not acceptable |
| 38 | EN6 | 3.72 | 1.224 | 32.92325 | Not acceptable |
| 39 | EN7 | 3.66 | 1.181 | 32.29382 | Not acceptable |
| 40 | EN8 | 3.63 | 1.157 | 31.91796 | Not acceptable |
| 41 | EN9 | 3.91 | 0.963 | 24.64007 | Acceptable |
| 42 | EN10 | 3.91 | 1.146 | 29.33 | Acceptable |
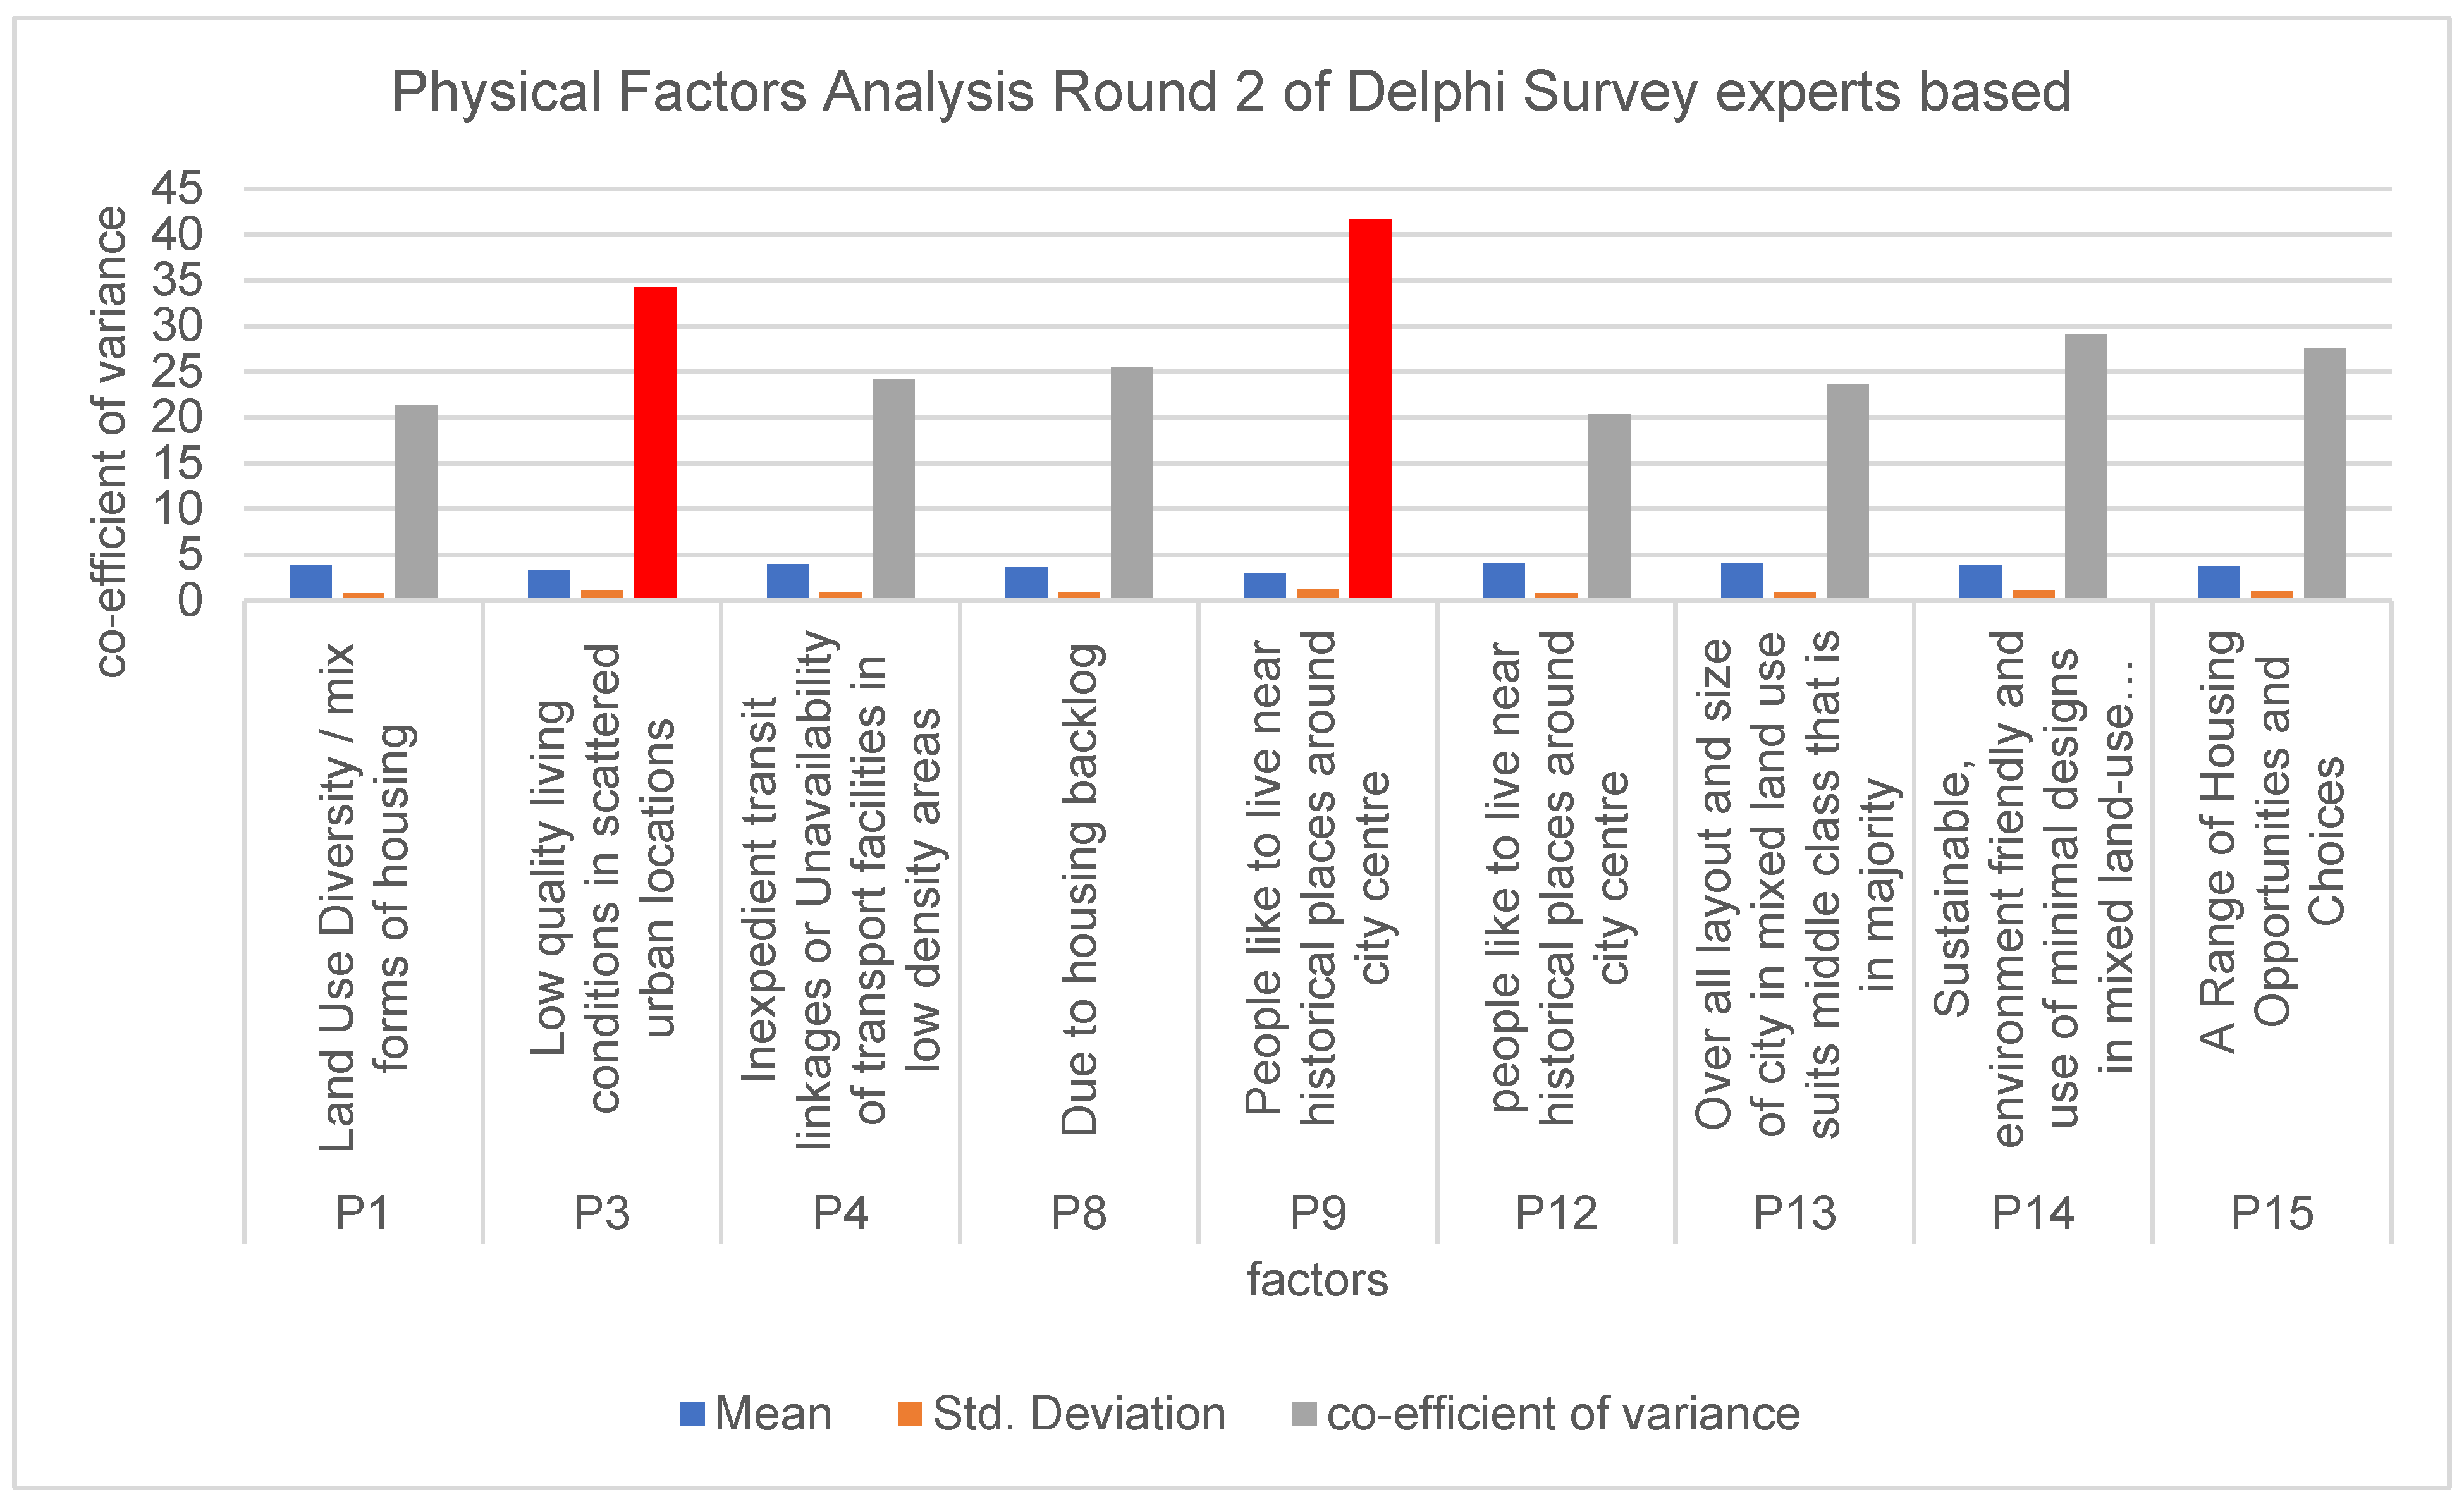
| S No. | Factor Code | Mean | SD | CV | Level of Consensus |
|---|---|---|---|---|---|
| 1 | P1 | 3.8333 | 0.81650 | 21.30019 | Acceptable |
| 2 | P3 | 3.2500 | 1.11316 | 34.25108 | Not acceptable |
| 3 | P4 | 3.9583 | 0.95458 | 24.11591 | Acceptable |
| 4 | P8 | 3.6250 | 0.92372 | 25.48193 | Acceptable |
| 5 | P9 | 3.0000 | 1.25109 | 41.703 | Not acceptable |
| 6 | P12 | 4.0833 | 0.82970 | 20.31935 | Acceptable |
| 7 | P13 | 4.0417 | 0.95458 | 23.61828 | Acceptable |
| 8 | P14 | 3.7917 | 1.10253 | 29.07746 | Acceptable |
| 9 | P15 | 3.7500 | 1.03209 | 27.5224 | Acceptable |
| 10 | EC8 | 3.3333 | 1.20386 | 36.11616 | Not acceptable |
| 11 | EC9 | 3.9583 | 1.04170 | 26.31685 | Acceptable |
| 12 | EC10 | 3.9583 | 1.04170 | 26.31685 | Acceptable |
| 13 | EC11 | 3.6250 | 1.17260 | 32.34759 | Not acceptable |
| 14 | S3 | 3.7083 | 0.80645 | 21.74716 | Acceptable |
| 15 | S10 | 3.5833 | 0.97431 | 27.1903 | Acceptable |
| 16 | S11 | 3.8333 | 0.81650 | 21.30019 | Acceptable |
| 17 | S12 | 3.9583 | 1.23285 | 31.14595 | Not acceptable |
| 18 | S13 | 3.6667 | 1.16718 | 31.83189 | Not acceptable |
| 19 | S14 | 3.8333 | 0.76139 | 19.86252 | High |
| 20 | EN1 | 3.4167 | 1.05981 | 31.01853 | Not acceptable |
| 21 | EN3 | 3.7083 | 1.08264 | 29.19505 | Acceptable |
| 22 | EN4 | 3.9583 | 1.19707 | 30.24202 | Not acceptable |
| 23 | EN5 | 4.0000 | 1.21584 | 30.396 | Not acceptable |
| 24 | EN6 | 4.0000 | 1.06322 | 26.5805 | Acceptable |
| 25 | EN7 | 3.7500 | 1.18872 | 31.6992 | Not acceptable |
| 26 | EN8 | 4.2083 | 1.14129 | 27.11998 | Acceptable |
Publisher’s Note: MDPI stays neutral with regard to jurisdictional claims in published maps and institutional affiliations. |
© 2022 by the authors. Licensee MDPI, Basel, Switzerland. This article is an open access article distributed under the terms and conditions of the Creative Commons Attribution (CC BY) license (https://creativecommons.org/licenses/by/4.0/).
Share and Cite
Shaikh, F.A.; Talpur, M.A.H.; Chandio, I.A.; Kalwar, S. Factors Influencing Residential Location Choice towards Mixed Land-Use Development: An Empirical Evidence from Pakistan. Sustainability 2022, 14, 14604. https://doi.org/10.3390/su142114604
Shaikh FA, Talpur MAH, Chandio IA, Kalwar S. Factors Influencing Residential Location Choice towards Mixed Land-Use Development: An Empirical Evidence from Pakistan. Sustainability. 2022; 14(21):14604. https://doi.org/10.3390/su142114604
Chicago/Turabian StyleShaikh, Fahad Ahmed, Mir Aftab Hussain Talpur, Imtiaz Ahmed Chandio, and Saima Kalwar. 2022. "Factors Influencing Residential Location Choice towards Mixed Land-Use Development: An Empirical Evidence from Pakistan" Sustainability 14, no. 21: 14604. https://doi.org/10.3390/su142114604