
Study on Mechanical Properties and Constitutive Relationship of Concrete Corroded by Hydrochloric Acid under Cyclic Load
Abstract
:1. Introduction
2. Experimental Program
2.1. Specimen Preparation
2.2. Corrosion Test
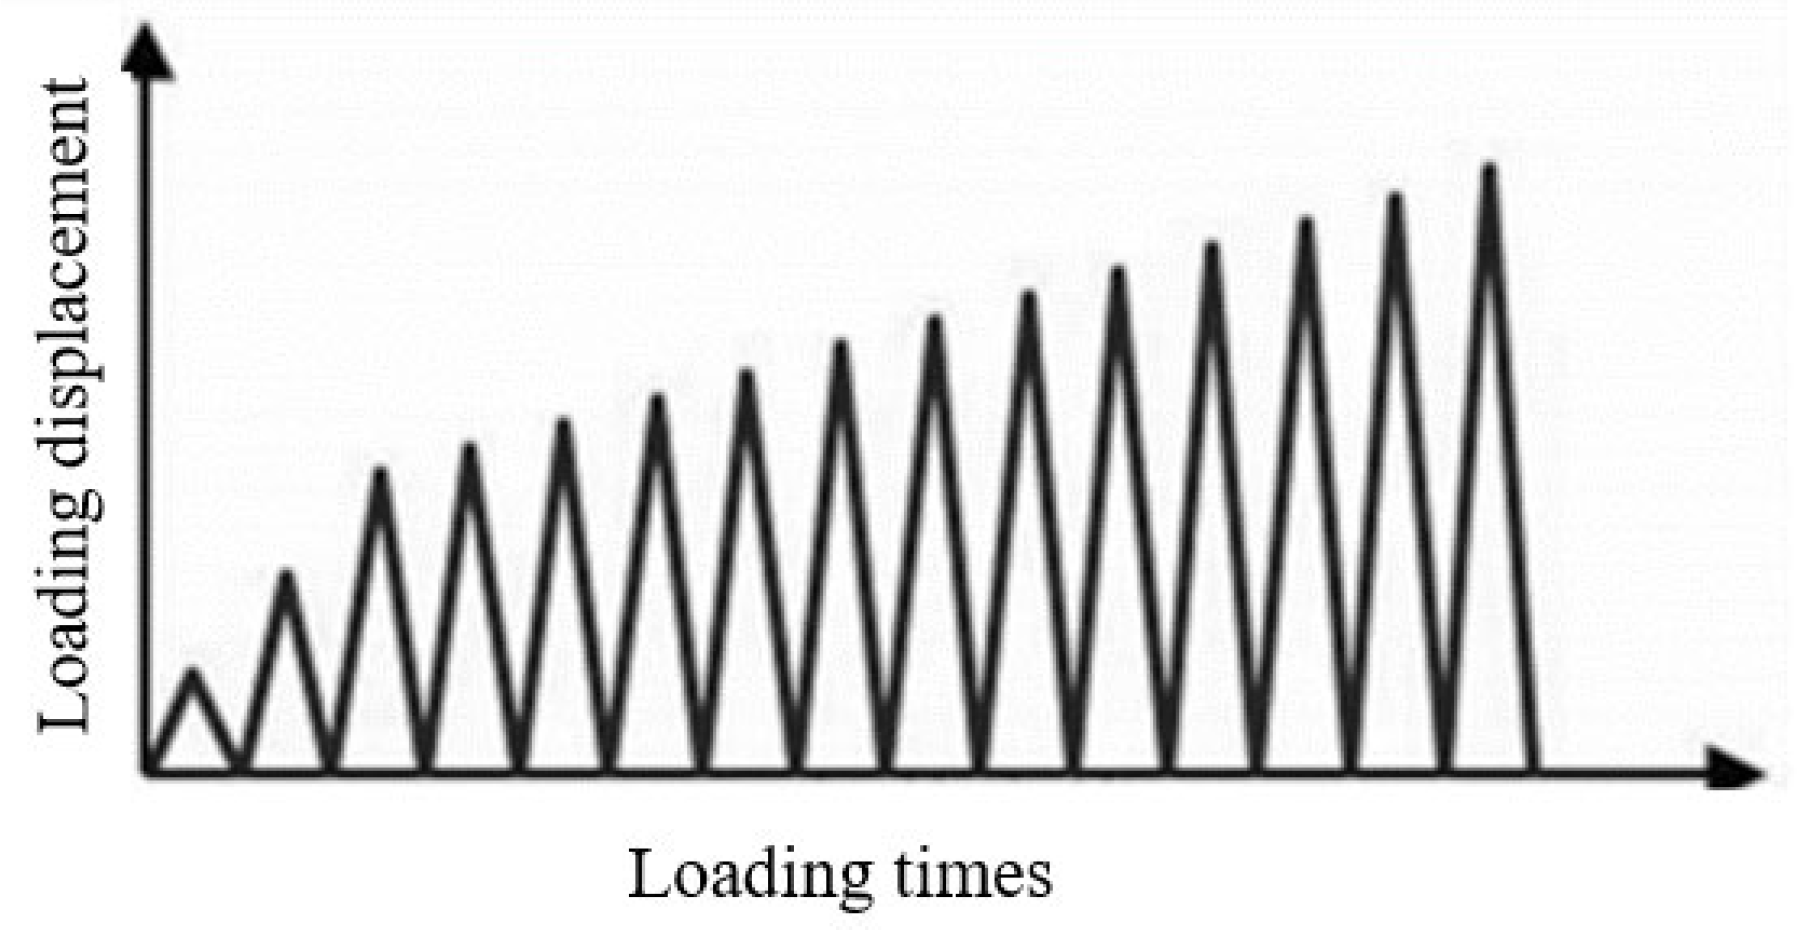
2.3. Test Setup
2.4. Strength Degradation Depth
3. Performance of Concrete Specimens under Monotonic Load and Cyclic Load
3.1. Failure Mode of Concrete Specimen
3.2. Stress–Strain Curves of Corroded Concrete under Monotonic Load
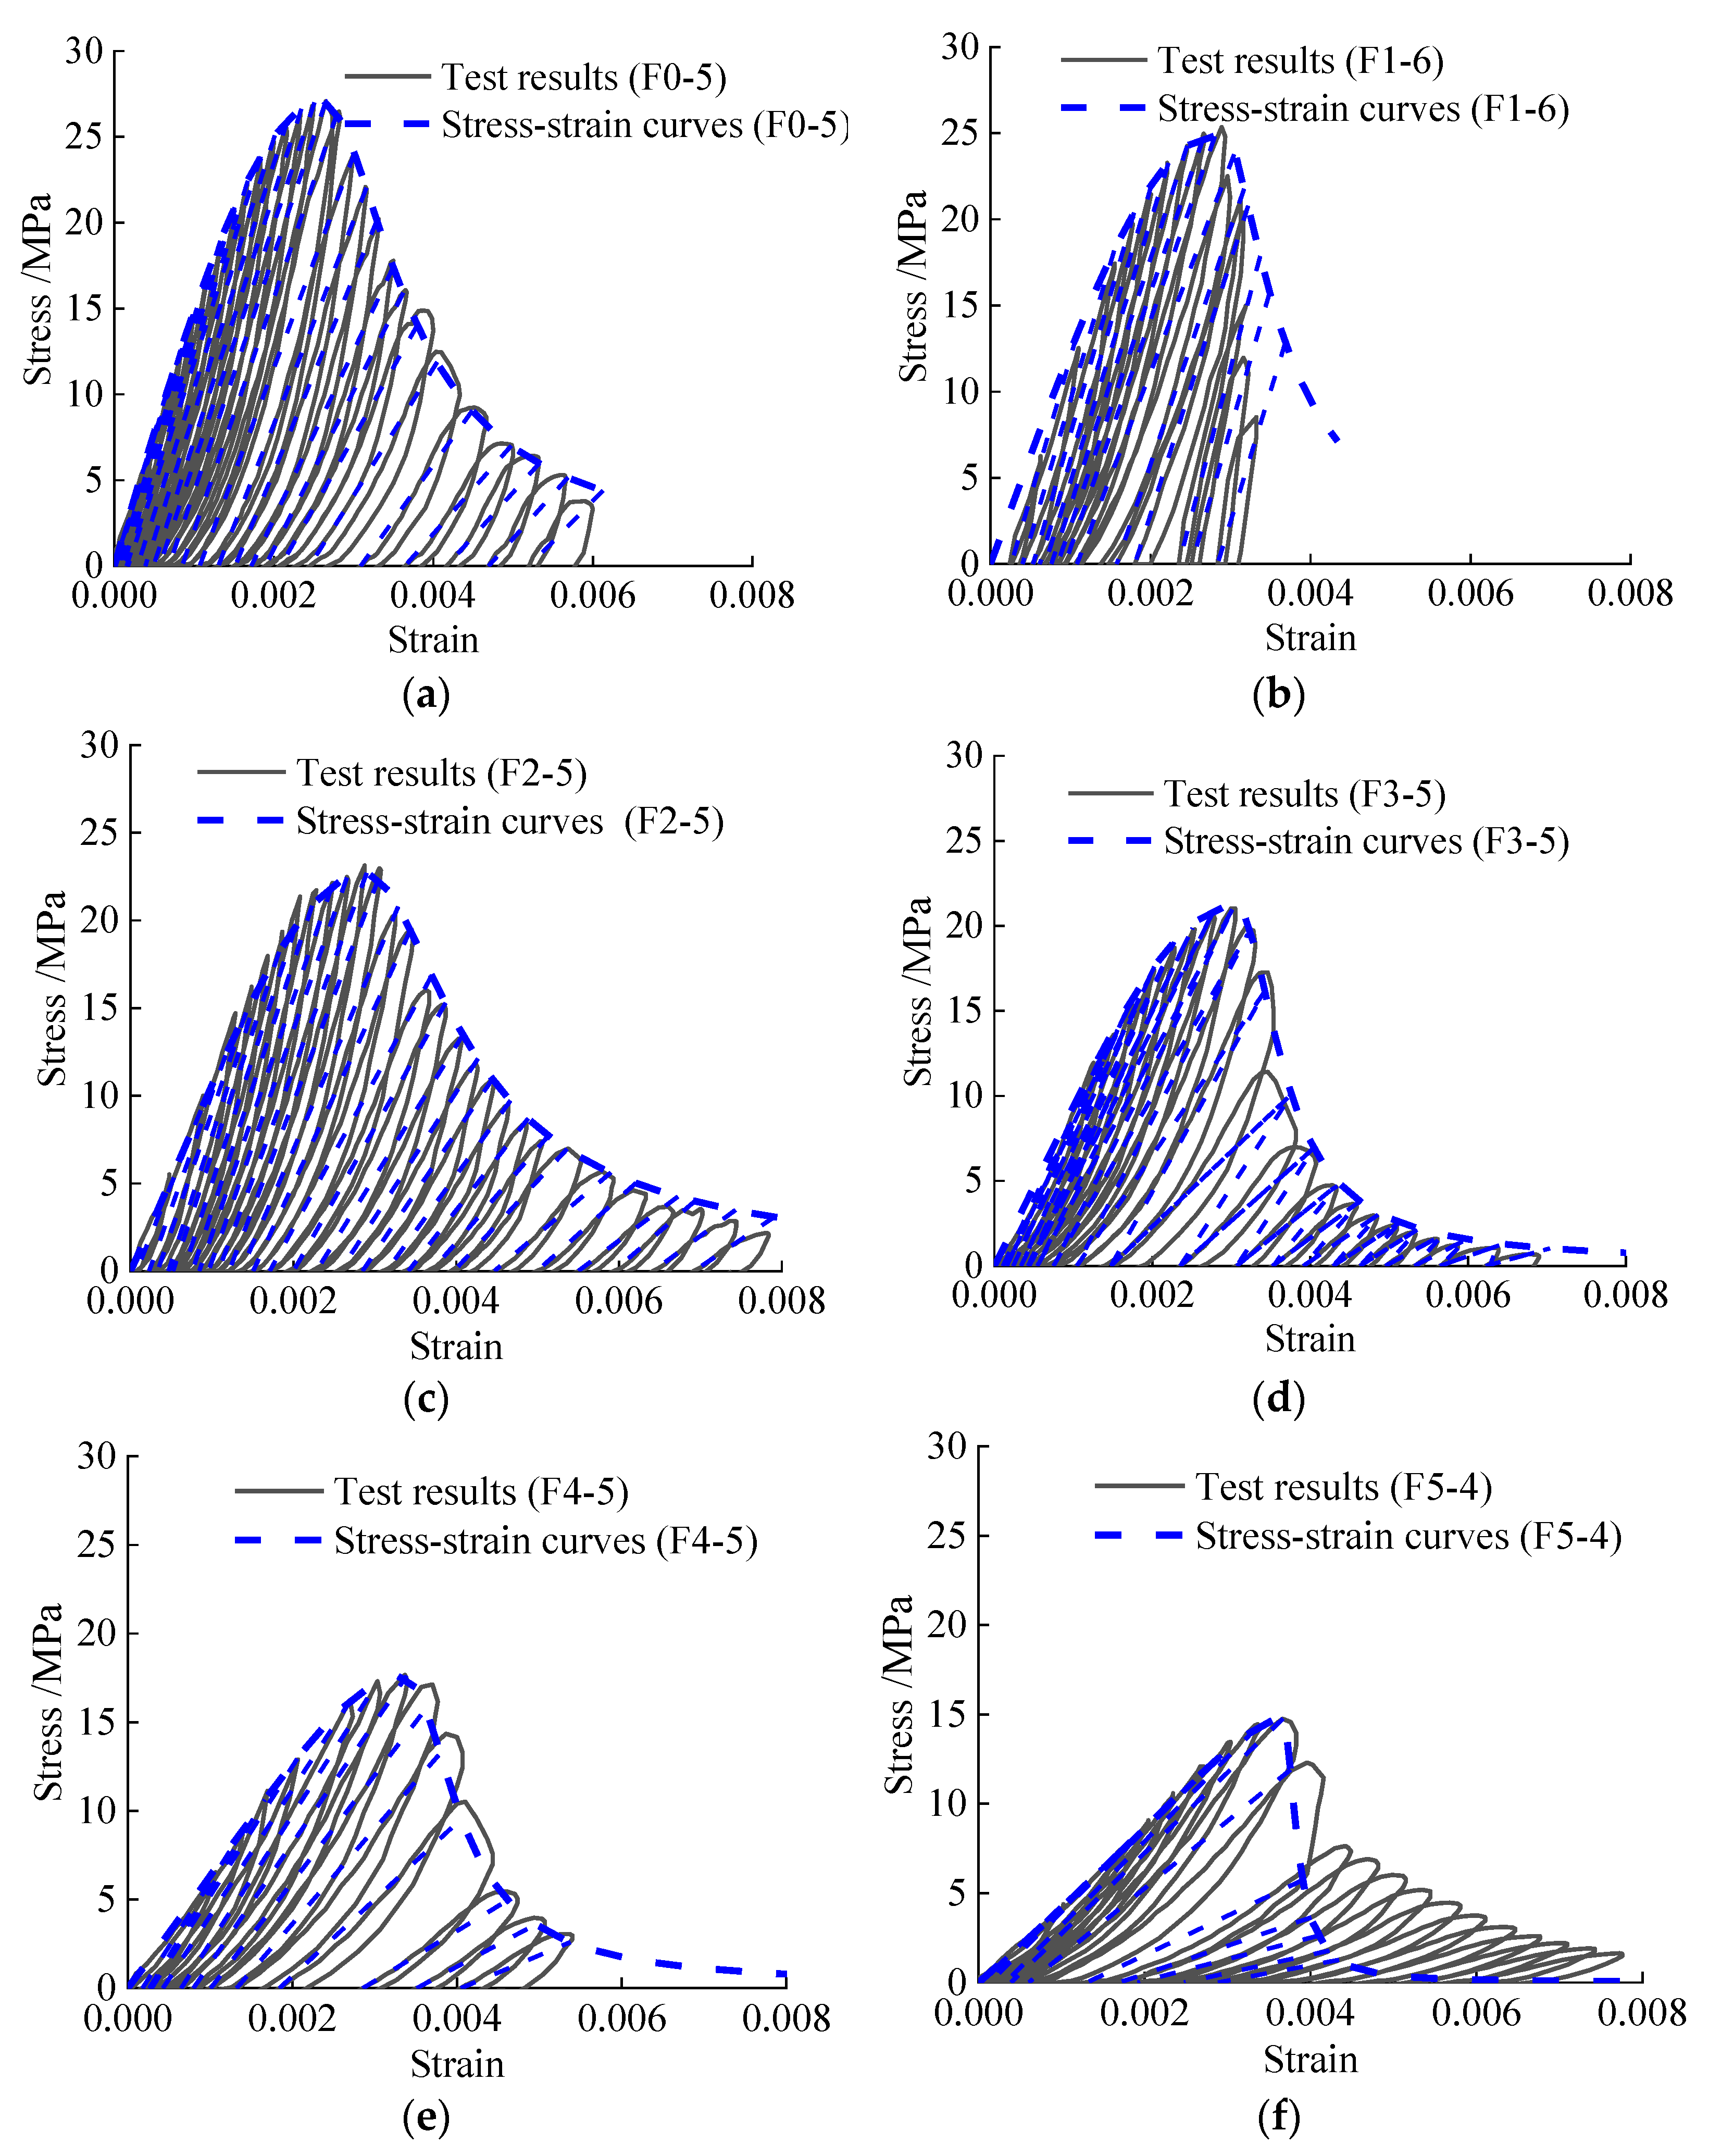
3.3. Stress–Strain Curves of Corroded Concrete under Cyclic Load
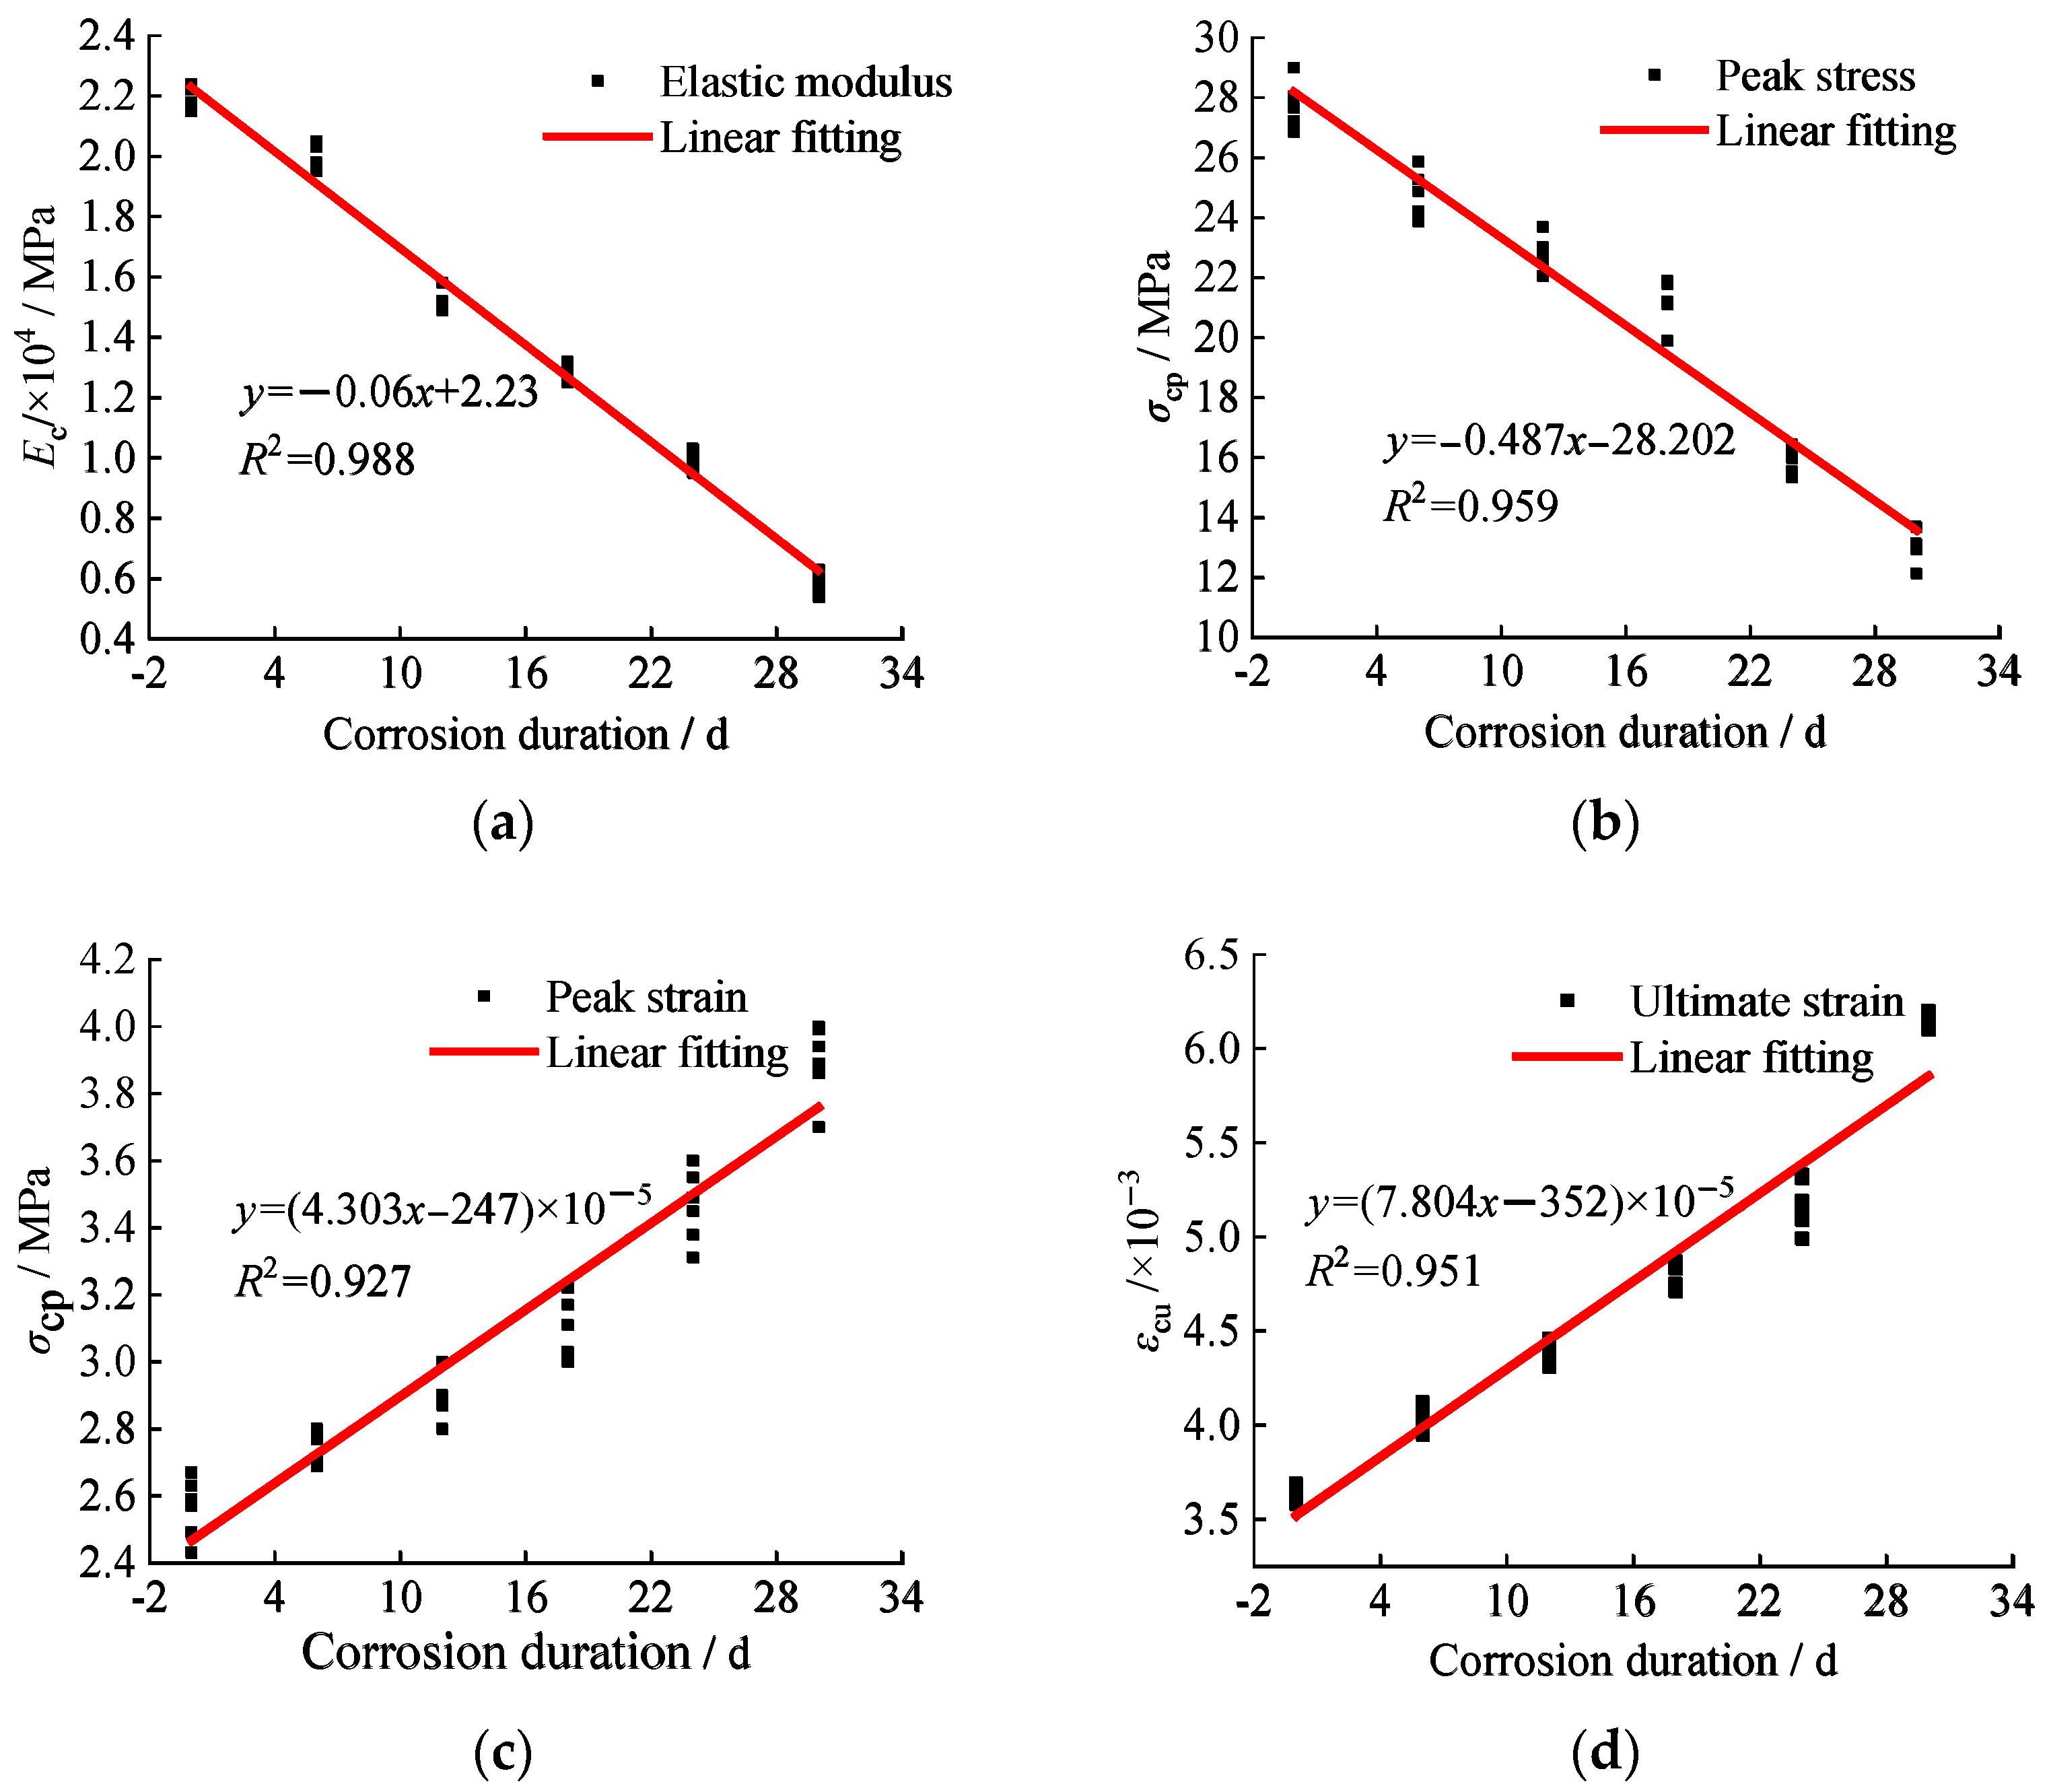
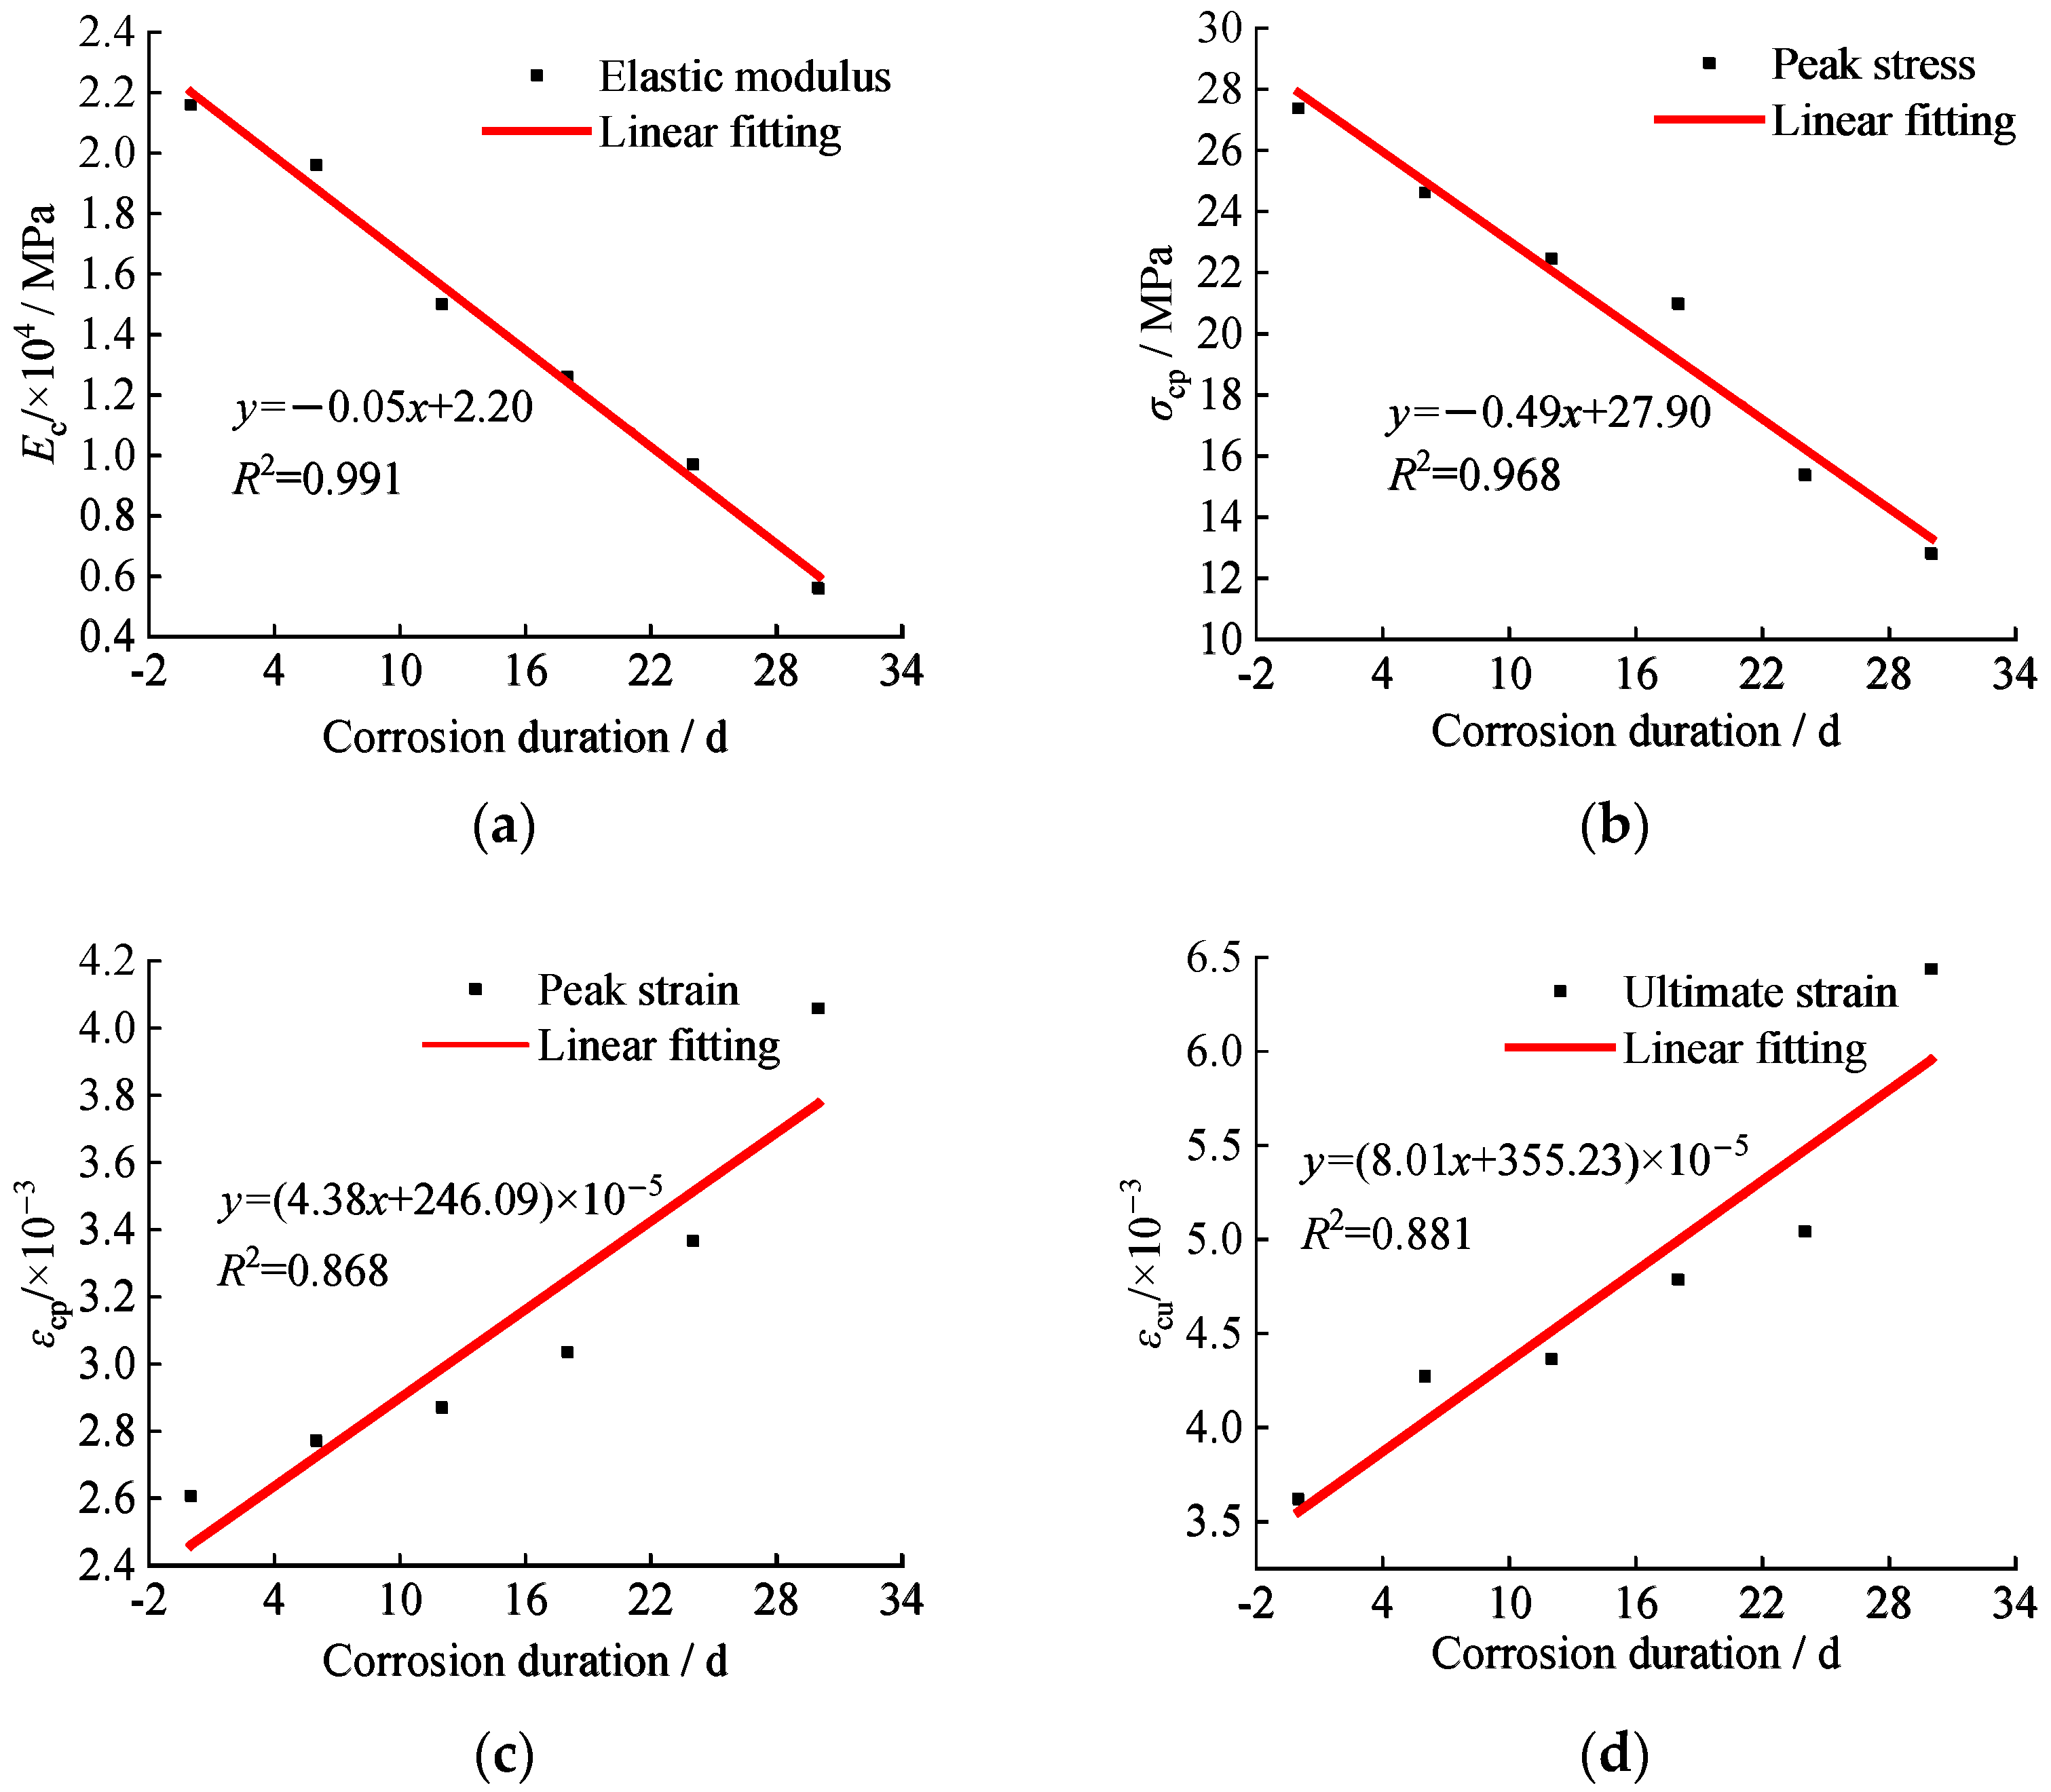
3.4. Mechanical Properties of Characteristic Values Analysis
3.5. Damage Analysis of Corroded Concrete under Cyclic Load
- (1)
- Residual deformation
- (2)
- Cumulative energy dissipation and damage variable (D)
4. Constitutive Relationship of Corroded Concrete under Cyclic Load
4.1. Effective Bearing Capacity Cross-Sectional Area Ratio
4.2. Model Establishment
4.3. Model Verification
5. Conclusions
- (1)
- Hydrochloric acid corrosion has obvious effects on the failure characteristics of concrete. The surface of corroded concrete was easier to crack and crush under load. As the uniaxial compression load increased, several small cracks in the interior concrete and the vertical main cracks were obvious and continued to extend and widen, and thus the surface peeling area of the concrete enlarged. Meanwhile, the compressive capacity and ductility of concrete specimens reduced rapidly with the increase in corrosion duration.
- (2)
- With the increase in corrosion duration, the strength degradation depth, peak strain, and ultimate strain of concrete under monotonic and cyclic loads increased significantly, whereas the peak stress and elastic modulus decreased drastically. The stress–strain curve of concrete after corrosion gradually changed flat with the extension of corrosion duration. Hydrochloric acid corrosion accelerated the degradation of the mechanical properties of concrete under load. The peak strain and ultimate strain of corroded concrete increased significantly when the corrosion duration reached 30 d and enhanced by 55.7% and 77.9% compared with the uncorroded concrete, whereas the peak stress and elastic modulus decreased rapidly and reduced by 53.3% and 74.1%, respectively.
- (3)
- The stress–strain envelope curves for concrete with different corrosion duration under cyclic load were essentially similar to that of concrete under monotonic load. In this case, the slopes of ascending section for the stress–strain curves of corroded concrete under cyclic and monotonic loads were coincident. However, the deviations in the descending section curves between corroded concrete specimens under cyclic load and monotonic load were evident after the peak stress. The degradation rate of descending section for the stress–strain curve of corroded concrete under cyclic load was much larger than that of the monotonic load due to the accumulated internal damage of concrete.
- (4)
- The modeling constitutive relationship of acid-corroded concrete under cyclic load was established, and the results calculated by this model matched well with the experimental values, indicating the model has a desirable fitting effect.
Author Contributions
Funding
Institutional Review Board Statement
Informed Consent Statement
Data Availability Statement
Conflicts of Interest
References
- Dai, J.F.; Wang, Q.; Liu, X.H. A probe into the anti-freeze and anti-slat corrosion mechanism of the poly-concrete. J. Xi’an Univ. Architect. Technol. 2002, 34, 201–204. (In Chinese) [Google Scholar]
- Teymouri, M.; Behfarnia, K.; Shabani, A. Mix design effects on the durability of alkali-activated slag concrete in a hydrochloric acid environment. Sustainability 2021, 13, 8096. [Google Scholar] [CrossRef]
- Chen, H.J.; Chen, M.C.; Tang, C.W. Research on improving concrete durability by biomineralization technology. Sustainability 2020, 12, 1242. [Google Scholar] [CrossRef] [Green Version]
- Liu, H.; Luo, G.; Wang, L. Strength Time–Varying and Freeze–Thaw Durability of Sustainable Pervious Concrete Pavement Material Containing Waste Fly Ash. Sustainability 2018, 11, 176. [Google Scholar] [CrossRef] [Green Version]
- Liu, J.; Xie, C.; Fu, C.; Wei, X. Hydrochloric acid pretreatment of different types of rice husk ash influence on the properties of cement paste. Materials 2020, 13, 1524. [Google Scholar] [CrossRef] [PubMed] [Green Version]
- Yunusa, M.; Zhang, X.; Cui, P. Durability of Recycled Concrete Aggregates Prepared with Mechanochemical and Thermal Treatment. Materials 2022, 15, 5792. [Google Scholar] [CrossRef] [PubMed]
- Du, H.Y.; Qiu, F.R.; Lin, C.J. Corrosion mechanism of concrete and new protection methods. Corro. Sci. Protect. Technol. 2001, 13, 156–161. (In Chinese) [Google Scholar]
- Zhu, W.; Yu, K.; Xu, Y.; Zhang, K. A prediction model of the concrete cracking induced by the non-uniform corrosion of the steel reinforcement. Materials 2020, 13, 830. [Google Scholar] [CrossRef] [Green Version]
- Zhang, L.; Niu, D.; Wen, B. Concrete protective layer cracking caused by non-uniform corrosion of reinforcements. Materials 2019, 12, 4245. [Google Scholar] [CrossRef] [Green Version]
- Jiang, H.; Jin, N.; Ye, H. Fractal characterization of non-uniform corrosion of steel bars in concrete beams after accelerated depassivation and seven-year natural corrosion. Materials 2019, 12, 3919. [Google Scholar] [CrossRef] [Green Version]
- Zhang, Z.; Gong, R.; Zhang, H. The Sustainability performance of reinforced concrete structures in tunnel lining induced by long-term coastal environment. Sustainability 2020, 12, 3946. [Google Scholar] [CrossRef]
- Campos Silva, H.G.; Garces Terradillos, P.; Zornoza, E. Improving sustainability through corrosion resistance of reinforced concrete by using a manufactured blended cement and fly ash. Sustainability 2018, 10, 2004. [Google Scholar] [CrossRef]
- Chen, Y.Z.; Xu, Y.; Ding, Q.J. Study on the corrosive mechanism of reinforced concrete in acid mediums. J. Wuhan Univ. Technol. 2001, 23, 4–6. (In Chinese) [Google Scholar]
- Shi, C.; Stegenmann, J.A. Acid corrosion resistance of different cementing materials. Cement. Concr. Res. 2000, 30, 803–808. [Google Scholar] [CrossRef]
- Song, H.; Chen, J.K. Effect of damage evolution on poisson’s ratio of concrete under sulfate attack. Acta Mech. Solida Sin. 2011, 24, 209–215. [Google Scholar] [CrossRef]
- Sun, C.; Chen, J.K.; Zhu, J. A new diffusion model of sulfate ions in concrete. Constr. Build. Mater. 2013, 39, 39–45. [Google Scholar] [CrossRef]
- Yuan, H.F.; Dangla, P.; Chatellier, P. Degradation modeling of concrete submitted to biogenic acid attack. Cem. Concr. Res. 2015, 70, 29–38. [Google Scholar] [CrossRef] [Green Version]
- Chen, Y.S.; Fan, Y.F.; Li, X. Experimental study on stress-strain relation of concrete corroded by hydrochloric acid solution. J. Build. Mater. 2007, 10, 235–240. (In Chinese) [Google Scholar]
- Ying, Q.X.; Hou, M.J.; Du, J.M. Research on the corrosion rate of concrete under different acid solution corrosion. Concrete 2017, 9, 23–25. (In Chinese) [Google Scholar]
- Rong, H.; Yu, M.L.; Ma, G.W. Research progress on microbial corrosion of concrete in sewage environment. J. Chin. Ceram. Soc. 2021, 49, 988–999. (In Chinese) [Google Scholar]
- Du, J.M.; Jiao, R.M.; JI, Y.S. The reduction in sulfate corrosion of concrete by chloride ion. J. China Univ. Min. Technol. 2012, 41, 906–911. (In Chinese) [Google Scholar]
- Shaheen, F.; Pradhan, B. Effect of chloride and conjoint chloride-sulfate ions on corrosion of reinforcing steel in electrolytic concrete powder solution (ECPS). Constr. Build. Mater. 2015, 101, 99–112. [Google Scholar] [CrossRef]
- Li, B.X.; Zhou, C.Q.; Cai, L.H. Time-dependent rules of performance degradation of fly ash concretes in sulfuric acid environments. J. Materi. Sci. Engin. 2014, 32, 809–815. (In Chinese) [Google Scholar]
- Jiang, L.; Niu, D.T. Study of constitutive relation of concrete under sulfate attack and drying-wetting cycles. J. Chin. Univer. Mining. Technol. 2017, 46, 66–73. (In Chinese) [Google Scholar]
- Zhai, Y.Q. Uniaxial compressive constitutive model of corroded concrete and its application in mechanical properties analysis of concrete members. Master’s Thesis, Chongqing University, Chongqing, China, 2005. (In Chinese). [Google Scholar]
- Liu, J.H.; Zhao, L.; Ji, H.G. Influence of initial damage on degradation and deterioration of concrete under sulfate attack. Chin.Civil. Eng. J. 2017, 39, 1278–1287. (In Chinese) [Google Scholar]
- Ma, G.; Zeng, Z.H. Axial compression behavior of pre-damaged concrete prisms confined with BFRP. J. Disast. Preven. Mitig. 2020, 40, 910–918. (In Chinese) [Google Scholar]
- Shekarchi, M.; Rafiee, A.; Layssi, H. Long-term chloride diffusion in silica fume concrete in harsh marine climates. Cement. Concrete. Comp. 2009, 31, 769–775. [Google Scholar] [CrossRef]
- Rong, H.; Chen, X.J.; Liu, D.E. Research progress on macro biological corrosion of marine concrete. J. Chin. Ceramic. Soci. 2022, 50, 503–511. (In Chinese) [Google Scholar]
- Khan, M.I.; Lynsdale, C.J. Strength, permeability, and carbonation of high-performance concrete. Cement. Concr. Res. 2002, 32, 123–131. [Google Scholar] [CrossRef]
- Meier, S.A.; Peter, M.A.; Muntean, A.; Böhm, M. Dynamics of the internal reaction layer arising during carbonation of concrete. Chem. Eng. Sci. 2006, 62, 1125–1137. [Google Scholar] [CrossRef] [Green Version]
- Liao, K.X.; Zhang, Y.P.; Zhang, W.P. Modeling constitutive relationship of sulfate-attacked concrete. Constr. Build. Mater. 2020, 260, 119902. [Google Scholar] [CrossRef]
- Zhao, C.; Wang, J. Comparative study on durability evaluation of concrete under different environments. Bulle. Sci. Techno. 2014, 30, 72–79. (In Chinese) [Google Scholar]
- Hong, D.H. Corrosion and Protection of Reinforcement in Concrete; China Railway Publishing House: Beijing, China, 1998. (In Chinese) [Google Scholar]
- Chen, Z.H.; Hang, H.; Yan, W.T. Constitutive model of corroded concrete under uni-axial compression. J. Huazhong Univ. Sci. Technol. (Nat. Sci. Ed.) 2008, 36, 38–41. (In Chinese) [Google Scholar]
- Sun, W. Durability and service life of structure concrete under load and environment coupling effects. J. Southeast Univ. (Nat. Sci. Ed.) 2006, 36, 7–14. (In Chinese) [Google Scholar]
- Cao, G.H.; Liao, S.J.; Peng, P. Long-term deformation of steel-concrete composite beams subjected to coupling effect of corrosion and loading. Chin. Civil. Eng. J. 2022, 55, 32–40. (In Chinese) [Google Scholar]
- Xing, M.L.; Guan, B.W.; Chen, S.F.; Sheng, Y.P.; Xiong, R. Deterioration characteristics of concrete under sulfate erosion and fatigue load. J. Build. Mater. 2013, 16, 249–254. (In Chinese) [Google Scholar]
- Shamsad, A.; Bishwajit, B.; Rajeev, W. Experiment service life prediction of rebar corroded reinforced concrete structure. ACI Mater. J. 1997, 94, 311–316. [Google Scholar]
- Yuan, Y.S.; Jia, F.P.; Cai, Y. Structural performance degradation model of corroded reinforced concrete beams. J. Civil. Eng. 2001, 6, 47–53. (In Chinese) [Google Scholar]
- Tian, Y.J.; Han, J.Y.; Hang, X.W.; Chen, Z.H. Rapid corrosion test of concrete components by domestic sewage. Chin. Water. Sewer. 2002, 5, 91–92. (In Chinese) [Google Scholar]
- Zhao, Z.; Huo, D.; Zhao, S.B. Random corrosion damage of corroded concrete structures. Chin. Harbor. Constr. 2001, 2, 23–27. (In Chinese) [Google Scholar]
- Sukhotskaya, S.S.; Mazhorova, V.P.; Terekhin, Y.N. Effect of autogenous healing of concrete subjected to periodic freeze-thaw cycles. Hydrotechn. Constr. 1983, 17, 294–296. [Google Scholar] [CrossRef]
- Yao, W.; Zhong, W.H. Mechanism of self-healing of concrete damage. Chin. J. Mater. Rese. 2006, 01, 24–28. (In Chinese) [Google Scholar]
- GB50010–2010; Chinese Academy of Architectural Sciences. Concrete Structure Design Code. China Architecture & Building Press: Beijing, China, 2010. (In Chinese)
- Cheng, H.B. Study on the deterioration law and uniaxial compressive constitutive relationship of concrete under sulfate attack. Master’s Thesis, Harbin Institute of Technology, Harbin, China, 2019. (In Chinese). [Google Scholar]
- Ding, F.X.; Yin, G.A.; Wang, L.P. Seismic performance of a non-through-core concrete between concrete-filled steel tubular columns and reinforced concrete beams. Thin. Wall. Struct. 2011, 110, 14–26. [Google Scholar] [CrossRef]
- Ding, F.X.; Ying, X.Y.; Zhou, L.C. Unified calculation method and its application in determining the uniaxial mechanical properties of concrete. Front. Architect. Civil. Eng. Chin. 2001, 5, 381–393. (In Chinese) [Google Scholar] [CrossRef]
- Ammarullah, M.I.; Santoso, G.; Sugiharto, S.; Supriyono, T.; Kurdi, O.; Tauviqirrahman, M.; Winarni, T.I.; Jamari, J. Tresca stress study of CoCrMo-on-CoCrMo bearings based on body mass index using 2D computational model. J. Tribol. 2022, 33, 31–38. [Google Scholar]
- Kong, L.J.; Liang, Z.T.; Lu, H. Accelerated simulating of the deterioration of concrete in gravity sewers. Mater. Rep. 2023, 7, 1–13. (In Chinese) [Google Scholar]


| mw/mc | Cement | Water | Medium Sand | Crushed Stone |
|---|---|---|---|---|
| 0.4 | 450 | 180 | 563 | 1148 |
| Corrosion Duration/d | Monotonic Compression Specimens No. | Cyclic Compression Specimens No. |
|---|---|---|
| 0 | F0-1; F0-2; F0-3 | F0-4; F0-5; F0-6 |
| 6 | F1-1; F1-2; F1-3 | F1-4; F1-5; F1-6 |
| 12 | F2-1; F2-2; F2-3 | F2-4; F2-5; F2-6 |
| 18 | F3-1; F3-2; F3-3 | F3-4; F3-5; F3-6 |
| 24 | F4-1; F4-2; F4-3 | F4-4; F4-5; F4-6 |
| 30 | F5-1; F5-2; F5-3 | F5-4; F5-5; F5-6 |
| Specimen No. | Corrosion Duration/d | Peak Load/kN | Peak Displacement/mm | Ultimate Displacement/mm | Peak Stress/MPa | Peak Strain/×10−6 | Ultimate Strain /×10−6 | Elastic Modulus /×104 MPa | Strength Degradation Depth/mm |
|---|---|---|---|---|---|---|---|---|---|
| F0 | 0 | 276.6 | 0.79 | 1.10 | 27.66 | 2633 | 3656 | 2.18 | 0 |
| F1 | 6 | 248.7 | 0.84 | 1.29 | 24.87 | 2800 | 4316 | 1.98 | 1.65 |
| F2 | 12 | 226.9 | 0.87 | 1.32 | 22.69 | 2900 | 4409 | 1.52 | 4.56 |
| F3 | 18 | 211.9 | 0.92 | 1.45 | 21.19 | 3067 | 4834 | 1.27 | 5.92 |
| F4 | 24 | 155.4 | 1.02 | 1.53 | 15.54 | 3400 | 5094 | 0.98 | 9.62 |
| F5 | 30 | 129.3 | 1.23 | 1.95 | 12.93 | 4100 | 6502 | 0.57 | 15.73 |
| Specimen No. | Corrosion Duration/d | Peak Load/kN | Peak Displacement/mm | Ultimate Displacement/mm | Peak Stress/MPa | Peak Strain/×10−6 | Ultimate Strain /×10−6 | Elastic Modulus /×104 MPa | Strength Degradation Depth/m |
|---|---|---|---|---|---|---|---|---|---|
| F0-5 | 0 | 273.8 | 0.78 | 1.09 | 27.38 | 2607 | 3619 | 2.16 | 0 |
| F1-6 | 6 | 246.2 | 0.83 | 1.28 | 25.62 | 2772 | 4273 | 1.96 | 2.13 |
| F2-5 | 12 | 224.6 | 0.86 | 1.31 | 23.46 | 2871 | 4365 | 1.50 | 4.71 |
| F3-5 | 18 | 209.8 | 0.91 | 1.44 | 20.98 | 3036 | 4786 | 1.26 | 6.23 |
| F4-5 | 24 | 153.8 | 1.01 | 1.51 | 17.38 | 3366 | 5043 | 0.97 | 12.51 |
| F5-4 | 30 | 128.2 | 1.22 | 1.93 | 12.80 | 4059 | 6437 | 0.56 | 16.24 |
| Corrosion Duration/d | Elastic Modulus/×104 MPa | Damage Variable (D) | Cumulative Energy Dissipation (Esum)/10−3 MPa |
|---|---|---|---|
| 0 | 2.16 | 0.000 | 147.80 |
| 6 | 1.96 | 0.093 | 123.83 |
| 12 | 1.50 | 0.306 | 121.57 |
| 18 | 1.26 | 0.417 | 103.82 |
| 24 | 1.97 | 0.551 | 95.35 |
| 30 | 0.56 | 0.741 | 84.70 |
Publisher’s Note: MDPI stays neutral with regard to jurisdictional claims in published maps and institutional affiliations. |
© 2022 by the authors. Licensee MDPI, Basel, Switzerland. This article is an open access article distributed under the terms and conditions of the Creative Commons Attribution (CC BY) license (https://creativecommons.org/licenses/by/4.0/).
Share and Cite
Cheng, L.; Shi, L.; Yi, L.; Zhao, W. Study on Mechanical Properties and Constitutive Relationship of Concrete Corroded by Hydrochloric Acid under Cyclic Load. Sustainability 2022, 14, 14692. https://doi.org/10.3390/su142214692
Cheng L, Shi L, Yi L, Zhao W. Study on Mechanical Properties and Constitutive Relationship of Concrete Corroded by Hydrochloric Acid under Cyclic Load. Sustainability. 2022; 14(22):14692. https://doi.org/10.3390/su142214692
Chicago/Turabian StyleCheng, Laixiu, Liang Shi, Ling Yi, and Weizhuo Zhao. 2022. "Study on Mechanical Properties and Constitutive Relationship of Concrete Corroded by Hydrochloric Acid under Cyclic Load" Sustainability 14, no. 22: 14692. https://doi.org/10.3390/su142214692