Article

Improving Typical Urban Land-Use Classification with Active-Passive Remote Sensing and Multi-Attention Modules Hybrid Network: A Case Study of Qibin District, Henan, China

School of Surveying and Land Information Engineering, Henan Polytechnic University, Jiaozuo 454000, China
*
Author to whom correspondence should be addressed.
Sustainability 2022, 14(22), 14723; https://doi.org/10.3390/su142214723
Submission received: 17 October 2022 / Revised: 2 November 2022 / Accepted: 4 November 2022 / Published: 8 November 2022

Abstract

:
The study of high-precision land-use classification is essential for the sustainable development of land resources. This study addresses the problem of classification errors in optical remote-sensing images under high surface humidity, cloud cover, and hazy weather. The synthetic aperture radar (SAR) images are sensitive to soil moisture, and the microwave can penetrate clouds, haze, and smoke. By using both the active and passive remote-sensing data, the Sentinel-1A SAR and Sentinel-2B multispectral (MS) images are combined synergistically. The full-band data combining the SAR + MS + spectral indexes is thus constructed. Based on the high dimensionality and heterogeneity of this data set, a new framework (MAM-HybridNet) based on two-dimensional (2D) and three-dimensional (3D) hybrid convolutional neural networks combined with multi-attention modules (MAMs) is proposed for improving the accuracy of land-use classification in cities with high surface humidity. In addition, the same training samples supported by All bands data (SAR + MS + spectral index) are selected and compared with k-Nearest Neighbors (KNN), support vector machine (SVM), 2D convolutional neural networks, 3D convolutional neural networks, and hybridSN classification models to verify the accuracy of the proposed classification model. The results show that (1) fusion classification based on Sentinel-2B MSI and Sentinel-1A SAR data produce an overall accuracy (OA) of 95.10%, a kappa coefficient (KC) of 0.93, and an average accuracy (AA) of 92.86%, which is better than the classification results using Sentinel-2B MSI and Sentinel-1A SAR images separately. (2) The classification accuracy improves upon adding the spectral index, and the OA, KC, and AA improve by 3.77%, 0.05, and 5.5%, respectively. (3) With the support of full-band data, the algorithm proposed herein produces better results than other classification algorithms, with an OA of 98.87%, a KC of 0.98, and an AA of 98.36%. These results indicate that the synergistic effect of active-passive remote-sensing data improves land-use classification. Additionally, the results verify the effectiveness of the proposed deep-learning classification model for land-use classification.

1. Introduction

Given China’s limited land resources, rapid urbanization poses a serious threat to China’s land-resource security. At the same time, the rapid development of urbanization is increasing the intensity of land, and over-exploitation of land is producing a significant negative impact on the ecological environment, producing adverse effects such as serious haze, urban heat islands, and the degradation of natural urban ecosystem services [1]. In the context of rapid urbanization, accurate and rapid urban-land-use mapping is a prerequisite for the study of land-resource issues and provides a basis for decision-making in land-use management, urban management, and sustainable development. Currently, land-use classification relies mostly on optical images, but this approach leads to classification errors for urban environments with high soil moisture and is susceptible to cloud and haze disturbances [2,3]. According to the research, the overall accuracy decreases by 10–20% when the amount of cloud coverage on the optical image is about 50%, and the addition of SAR data can increase the overall accuracy by about 5%, and the machine learning classification accuracy is low when the optical images are disturbed by soil moisture, cloud cover and haze, mostly below 85% [4,5,6]. Synthetic aperture radar (SAR) data are a type of active remote sensing and can penetrate adverse weather conditions such as clouds and haze by operating in the microwave range, allowing the detection of the geometric and dielectric properties of surface objects. In addition, the backscatter coefficient of SAR data can differentiate between different land-use types [7]. Therefore, synergistic active-passive remote-sensing data, with its all-day, all-weather, comprehensive coverage and high acquisition frequency, improve urban-land-use classification and rapid mapping.
Currently, medium-resolution (10–100 m) satellite imagery is widely used for land-use mapping [8,9,10]; for example, Landsat TM, ETM+, and Sentinel-2 multispectral images are used to produce global 30- and 10-m-resolution land-use classification maps [11]. Sentinel-1 and Sentinel-2 are two new-generation satellite platforms and are widely used in land-use studies because of their free and easy accessibility. Compared with Landsat series satellites, they have higher resolution, a faster return cycle, and provide more refined land-use classification maps. The 13 bands of Sentinel-2 MSI data provide richer feature information, and Sentinel-2 MSI data have demonstrated their value in area extraction, the monitoring of land use, and mangrove extent mapping. However, given weather conditions such as clouds, smog, and haze, Sentinel-2 MSI data are limited by the weather and the classification accuracy decreases significantly to meet the demand. Collecting feature information during the rainy season when the cloud cover is severe or the soil moisture is high does not affect the resulting SAR data [12,13,14,15]. In addition, Sentinel-1 SAR data have been used in studies involving flood monitoring, crop yield estimation, and waterbody extraction [16,17], and the results validate the use of SAR data for land-use classification.
When clouds, smoke, and haze obstruct the use of optical imagery in the study area due to high surface humidity, SAR data become an alternative solution for optical imagery [18,19,20]. Numerous studies have used optical and radar data for land-use classification in non-urban areas and have achieved improved results. Walker et al. [21] combined SAR data with Landsat optical imagery for land-use mapping of the Brazilian Amazon Forest and verified the feasibility of combining SAR data with optical imagery for large-scale forest mapping. Colson et al. [22] combined Sentinel-1 SAR data and Sentinel-2 MSI data for fire monitoring and for studying soil erosion in the Sierra del Gata wildfire in Spain in the summer of 2015. Heckel et al. [23] studied the extent of forest cover in South Africa and Thuringia by fusing Sentinel-1 SAR and Sentinel-2 MSI data and validated the potential of synergistically combined active and passive remote-sensing data for studying forest cover on a global scale. Although these studies verified the use of synergistically combined active and passive remote-sensing data in land-use studies, their target was non-urban areas in large regions. Sentinel-1 SAR data still pose a challenge for land-use classification in urban areas because of the complexity of the classes of urban-land-use features. Therefore, the fusing of Sentinel-1 SAR and Sentinel-2 MSI data for land-use classification studies in urban regions merits further investigation.
Machine learning is widely used in remote-sensing image classification because of its ability to identify feature information via an automated framework. Many scholars have studied the combination of remote-sensing data and machine-learning algorithms for land-use classification. For example, Zhang et al. [24] used the random forest algorithm to classify farmland in China and Canada by combining texture features and spectral indices and verified that the use of machine-learning algorithms with integrated spectral indices improves land-use classification accuracy. Mandal et al. [25] used a support vector machine (SVM) algorithm to classify crops in the Vijayawada region of India. They also made a comparative study of the decision tree, K-most proximity, and random forest algorithms to verify that the SVM algorithm is superior to these other methods. However, such machine-learning methods only extract shallow spectral features from remote-sensing data, which prevents the classification accuracy from satisfying the production requirements. In addition, the scene segmentation model based on Vision Transformers has attracted significant attention in urban-land-use classification research because of its accurate classification and high stability, but it often requires numerous labeled samples, which requires significant time, manpower, and material resources and thus cannot meet the demand for rapid mapping of urban-land-use classification [26,27].
The emergence of deep-learning algorithms, represented by convolutional neural networks (CNNs), has provided new ideas for the classification of remote-sensing images [28]. By leveraging their powerful feature extraction and feature representation capabilities, these algorithms have achieved remarkable results in the field of land-use classification. For example, Zhao et al. [29] compared five deep-learning classification effects based on time series Sentinel-2 images. In addition, a one-dimensional convolutional neural network was used with success to map crops at a higher level. Lee et al. [30] proposed a two-dimensional CNN (2D-CNN) structure by adding a residual structure to the 2D CNN to introduce residual connections. Ji et al. [31] classified crops by using a three-dimensional CNN (3D-CNN) and spatiotemporal remote-sensing data. 3D-CNNs enhance the feature-extraction capability through an active learning strategy, and the classification results are more accurate compared with 2D-CNNs. These methods overcome the defects of traditional classification algorithms, such as poor robustness and weak discriminative feature extraction compared with machine-learning methods. However, due to their structure and framework, CNNs are prone to problems involving the disappearance of network gradients and feature loss, resulting in inadequate extraction of information data from the data. Therefore, a classification model must be developed that can fully exploit the spatial and spectral information of remote-sensing data.
In summary, the combination of SAR data and optical images is of significant potential importance for the study of urban-land-use classification. Machine-learning and deep-learning methods are rarely trained with active-passive remote-sensing synoptic data [32,33,34,35] and are mostly studied by using optical images, whose effectiveness must be further validated. Moreover, for land-use-classification applications, medium-resolution images from satellite sensors such as Landsat or Sentinel are more desirable because they provide improved resolution, broader spatial coverage, and free and easy accessibility [8,9,10], making them an excellent choice for land-use-classification studies.
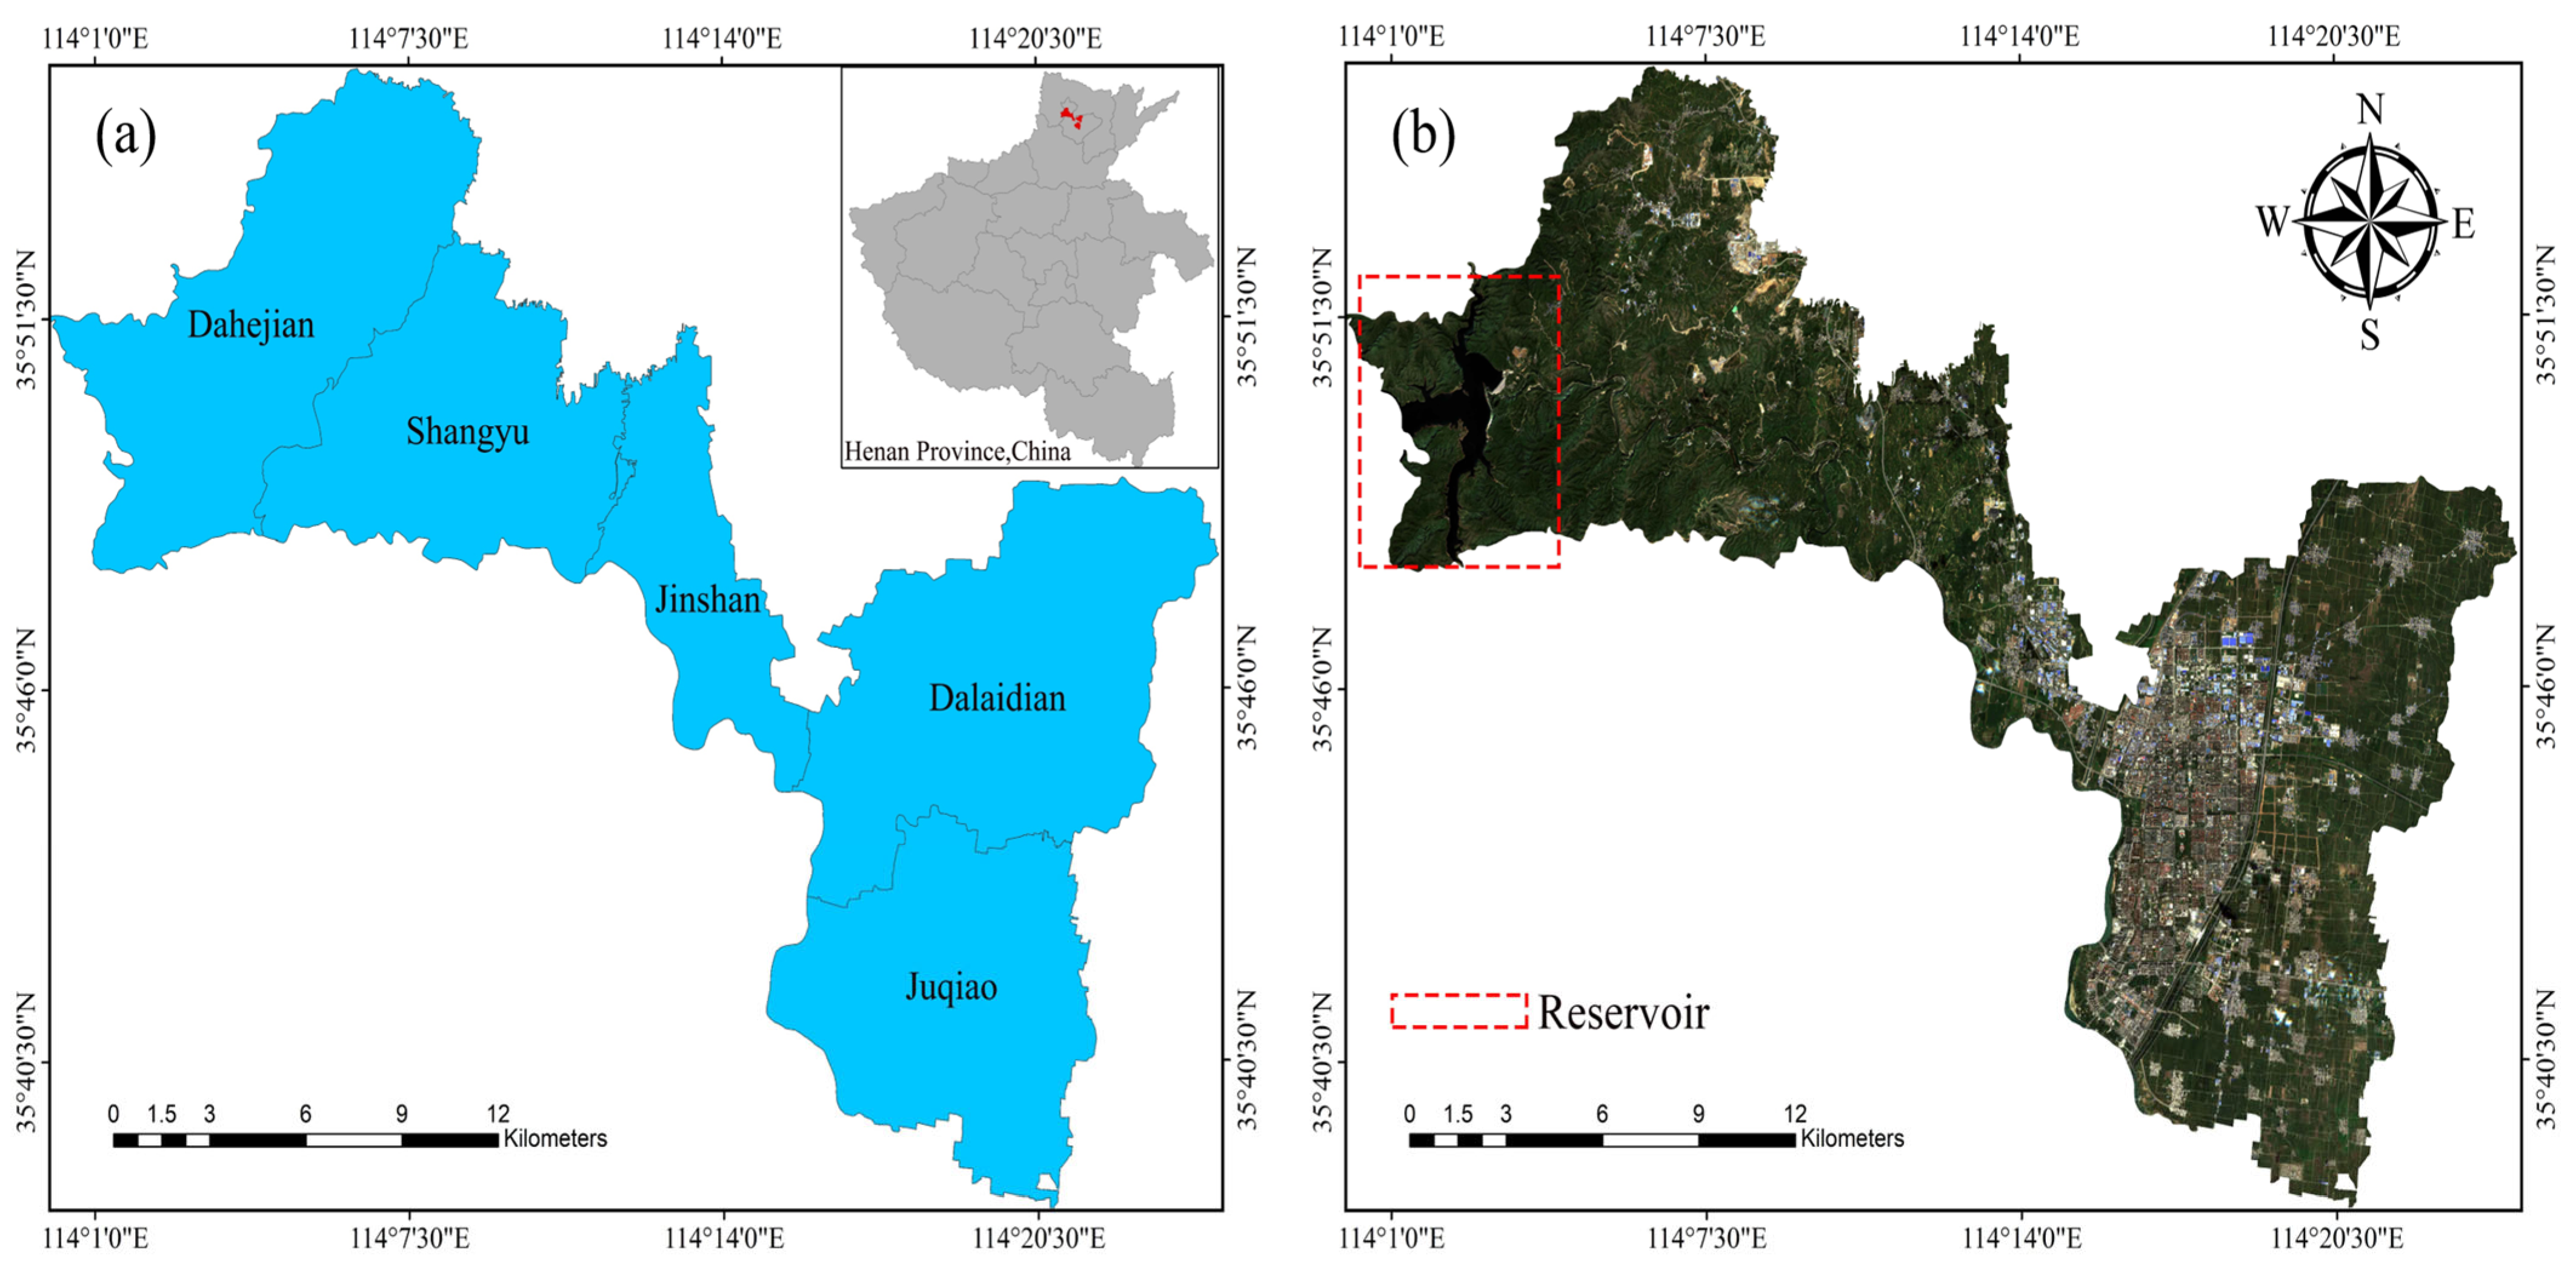
We must thus overcome the classification error of optical images due to cloud cover and haze, and information loss and overfitting in urban environments by CNNs due to the high surface-soil moisture, both of which lead to poor land-use classification. Combining active and passive remote-sensing data, we construct a hybrid CNN with multiple attention mechanisms and residual structures to avoid losing feature information with network depth and thereby fully exploiting for land-use classification the spatial and spectral information available in active and passive remote-sensing data. This study uses Qibin District, Henan Province, China as the research area. A multi-attention module hybrid CNN (MAM-HybridNet) is proposed to study land-use classification based on Sentinel-1A SAR and Sentinel-2B MSI active-passive remote-sensing synoptic data. We explore the potential of SAR and MS fused data for applications in urban-land-use classification research by verifying the effectiveness of the proposed CNN and producing land-use classification maps to provide a decision-making basis for urban development, maintain ecological services, and formulate land-use policy. The main contributions of this study are as follows:
  • A land-use classification model (MAM-HybridNet) is proposed based on a 2D- and 3D-CNN and a multi-attention mechanism.
  • A new residual spatial and spectral attention module is introduced to deeply extract discriminative features of remote-sensing image features.
  • EVI, NDBI, and MNDWI spectral indices are added to Sentinel-1A SAR and Sentinel-2B MSI fused data to explore how this affects land-use classification.
  • The performance of the proposed classification model for land-use classification is compared with that of commonly used machine-learning and deep-learning methods.

2. Study Area and Datasets

2.1. Study Area

The selected study area is the Qibin District in central Hebi City, Henan Province, China, located in the eastern branch of the Taihang Mountains, in the topographic part of the transition from mountains to plains. The elevation is high in the northwest and low in the southeast, with hills and mountains in the west; and plains in the central and eastern areas (see Figure 1). The region’s area is 34,292.98 square kilometers and is divided into five administrative districts. The study area has a temperate continental monsoon-type climate with an annual frost-free period of about 220 days, an average annual temperature of 14.2 °C, and an average annual precipitation of 683.2 mm. Winter wheat and summer maize are the main crops grown in the study area. The study area also includes a typical city in the extension of the Taihang Mountains to the plains in Henan Province that has high surface soil humidity, which leads to cloudy and hazy weather that degrades the optical remote-sensing images used for land-use classification. Therefore, land-use classification mapping must be improved in this area for urban planning and management.

2.2. Data Source and Collection

2.2.1. Sentinel-1 Images

Sentinel-1 consists of two satellites, Sentinel-1A and Sentinel-1B, each of which carries SAR sensors, which are active microwave remote-sensing sensors capable of capturing all-weather, all-day images via the C-band by avoiding cloud cover and foggy weather. This study uses the ground-range multiviewing image (IW GRD) collected in one-view Sentinel-1A interferometric wide-field mode on 22 April 2021. The two available SAR bands, vertical emission and reception as well as vertical emission and horizontal reception, are converted from σ 0 to γ 0 , and the data are resampled at 10 m spatial resolution by correcting the backscatter coefficients.

2.2.2. Sentinel-2 Images

The Sentinel-2 platform is equipped with a broadband multispectral imager that images Earth’s surface in 13 bands and at three spatial resolutions (10, 20, 60 m) from the visible to the shortwave infrared (spectral range 443–2190 nm). In careful consideration of how cloud cover affects Sentinel-2 images, the images are screened by using one view of a Sentinel-2B L2A-level optical image with less than 10% cloud cover during the winter wheat season in the study area (acquired on 17 April 2021). Only the four bands R, G, B, and near-infrared, with a spatial resolution of 10 m, are used in this study.

2.3. Reference Sample Collection

For the training sample selection, we follow the national land cover classification standards [36,37]. The land-use types are first classified into five categories: Cultivated land, construction land, forest, bare land, and water. Table 1 describes the five land-use categories. The training and validation samples in this study are obtained from field surveys and visual interpretation of remote-sensing images: (1) field survey of the study area from March to April 2021 recorded with a handheld global positioning system with an acquisition accuracy of <5 m; (2) selection of sample points (using ENVI 5.3 software) for the five land-use categories based on the April 2021 satellite image of GF-2 and field survey data. Finally, 200 regions of interest (ROIs) were selected for each land-use category by combining field surveys and visual interpretations of remote-sensing images.
There are different approaches, such as manual splitting, random splitting, and non-random splitting for the division of reference samples into training and validation samples [38]. In this regard, random sampling avoids the interference of human factors, is more objective, and is widely used in remote sensing image classification. Therefore, in this study, random sampling was employed to divide reference samples into training (80%), and validation (20%) samples.

3. Method

3.1. Data Preprocessing and Dataset Selection

Sentinel-1 and Sentinel-2 data were obtained from the Google earth engine platform, and both were preprocessed in the Google earth engine (https://code.earthengine.google.com/ (accessed on 1 August 2022)). The satellite-based spectral indices are usually calculated from the spectral reflectance of two or more bands of the optical image, and these indices enrich the feature characteristics. Combined with the actual situation of the study area, we consider that crops are easily confused with forest, water with mountains and shadows of high buildings, and bare land with construction land. The enhanced vegetation index (EVI), modified normalized difference water index (MNDWI), and normalized difference built-up index (NDBI) are used to reduce the confusion between feature classes and improve the accuracy of urban-land-use classification. The EVI is an optimized vegetation index that improves the sensitivity to high-biomass areas and reduces signal attenuation due to water vapor and aerosols. The MNDWI replaces the near-infrared band in the NDWI with short-wave infrared, which suppresses the effects of high buildings and mountain shadows. Construction land and bare land reflect more strongly in the short-wave infrared band than in the near-infrared band, and the NDBI is used to enhance the distinction between construction land and bare land. Therefore, EVI, MNDWI, and NDBI are extracted as feature variables and fused with SAR and MS synoptic data for experiments and to verify how EVI, MNDWI, and NDBI affect urban-land-use classification. The three indices are calculated as follows:
E V I = 2.5 × ( N I R R e d ) N I R + 6 × R e d 7.5 × B l u e + 1
N D B I = ( S W I R N I R ) / ( S W I R + N I R )
M N D W I = ( G r e e n S W I R ) / ( G r e e n + S W I R )
where NIR is the near-infrared band, Red is the red band, Green is the green band, and SWIR is the short-wave infrared band.
Finally, four datasets are constructed to provide input images for the MAM-HybridNet model to explore how land-use classification with SAR and the addition of spectral indexes compares with optical-image-based classification. The four data sets are (1) MS (4 bands), (2) SAR (2 bands), (3) MS + SAR (6 bands), and (4) All bands (9 bands). Figure 2 shows a flowchart describing the steps involved in land-use classification in this study.

3.2. Proposed Deep-Learning Architecture

This study proposes a hybrid 2D-3D CNN with a multi-attention modules(MAM-HybridN) to improve land-use classification accuracy in a typical city with high surface soil moisture and under cloudy and hazy conditions. The multiscale residual feature extraction module, max pooling layer, residual spectral attention module, and residual spatial attention module facilitate deep feature extraction (see Figure 3).
First, the multi-scale fusion extraction of remote sensing images was performed by three 3D convolutional layers with convolutional kernels of various sizes, and the deep spatial-spectral feature information was extracted by using different perceptual fields. The output feature-map size was reshaped and then shifted to a new multi-scale 2D convolution block to continue the deep extraction of feature information from the space. Subsequently, to generate high-level depth features, the feature maps were passed in order through the residual spectral attention module and the residual spatial attention.
The residual spatial and spectral attention modules act on each convolutional layer. When features are extracted from the convolutional layer, the attention mechanism enables adaptive calibration of the importance of the information of each feature by specifying the weight relationship between feature information in the spatial and spectral dimensions. Concurrently, the residual construction superimposes the unit inputs on the outputs in the form of jump links, which are then activated. The residual structure is constantly mapped between the feature information to lower the information loss, overcome network degradation, and improve the classification accuracy of the model. The feature information is extracted by multiple multiscale convolutional layers and attention modules to achieve deep extraction and full use of the feature information. Subsequently, the features obtained are input into the max pooling layer to reduce the size of the feature images. Finally, the depth features are flattened by the flattening layer; processed by the fully connected layer; and treated by the to classify land use based on active-passive remote-sensing images.
The following main differences exist between the proposed model and other CNNs:
  • 2D and 3D hybrid CNNs are used to extract deep spectral and spatial features.
  • We propose a spectral and spatial attention structure that is more efficient and accurate than the convolutional block attention module.
  • Multiple multiscale convolutional blocks and residual structures are introduced to filter and retain feature information in multiple rounds and thereby maximize the deep extraction of spatial-spectral features from remote-sensing images.
  • A depth-separable convolutional network is used to reduce computational overhead.

3.2.1. Attention Module

Human-inspired attention mechanisms have been proposed to improve feature learning in CNN models [39,40]. Previous studies verify the effectiveness of the attention mechanism in deep-learning network models [41,42]. Currently, attention mechanisms are widely used in image classification to enhance the focus of neural networks on the local information of input features. Machine learning is applied to adaptively correct feature-information weighting so as to better extract important features and suppress minor features. This study proposes a new attention mechanism to achieve deep extraction of spatial and spectral features of remote sensing images by considering both spatial and spectral features.
The purpose of the proposed spectral attention mechanism is to avoid the loss of features with network depth while successfully reusing the important information of the feature map. Thus inspired by the attention mechanism of squeeze -excitation (SE) [43], this study proposes the residual spectral attention module shown in Figure 4. Taking advantage of the residual structure, the network backbone of the proposed module achieves “squeeze excitation” of features through 2D convolution, global pooling, and full connectivity operations. The branch joins depth-separated convolution to achieve constant end-to-end connectivity. The branching trunks incorporate depth-separated convolution to achieve constant end-to-end connectivity. In the residual spectral attention module, the input feature map is first convolved into a convolution layer with dimensions (a, b, c) equal to the dimensions of the input feature map. The size of the output feature map is kept constant at w × h × c , and then the feature map is pooled under the global perceptual field and the size of the feature map is changed to 1 × 1 × c . After that, the feature map is transferred to two fully connected layers with different neuron sizes to implement the squeeze-excitation operation on the feature information. In other words, features are compressed on the spectral dimension of the feature map. Weights are first generated for each channel by the convolution operation and then applied to the original feature channel. In the branch of the proposed module, the depth-separable convolution is used to directly convolve the input feature map; this is divided into two operations: depth convolution and point convolution, thereby requiring fewer parameters and incurring lower operating costs than the conventional convolution operation. Finally, the feature map of the network stem is multiplied by the feature map of the branch to obtain the final output feature map of size w × h × c .
The proposed residual spatial attention module is more concerned with the spatial relationships of features in remote-sensing images. To extract deep spatial-location information from the features, we use the proposed residual spatial attention module shown in Figure 5. Its network framework is like the residual spectral attention mechanism, but the convolutional layers in the backbone network differ. In the residual spatial attention module, a 2D-CNN with a convolution kernel size of (2, 2) is first applied to the input feature map as a downsampling layer to reduce the spatial dimension of the features while ensuring that the spectral dimension of the remote-sensing image remains unchanged. After the two-layer downsampling operation, the feature maps have plenty of important spatial information. Subsequently, we introduce a new convolution operation (transposed convolution) for the upsampling operation to restore the feature map to its original dimensions.
Transposed convolution is a special forward convolution that first performs a zero-fill operation on the feature maps obtained. Subsequently, the convolution kernel is rotated by 180° to produce a new kernel size. This convolution kernel is used to perform normal convolution operations to restore the feature map size to its original size. The introduction of transposed convolution enables the spatial attention module to prevent the convolution operation from changing the mapping relationship of spatial locations, which is important for optimizing the weighting of spatial-feature information. Its branched network is the same as that of the residual spectral attention module. It uses depth-separable convolution to process the input image directly, which improves efficiency while processing the features at a deeper level. Finally, the features obtained from the backbone network and the branched network are multiplied and superimposed to complete feature extraction from the spatial relationship of the remote-sensing data.
Inspired by the structure of the convolutional block attention module(CBAM) [44], the residual spatial attention module is added after the residual spectral attention module to extract deeper spatial-spectral features from remote-sensing images and thereby improve the classification of urban land.

3.2.2. Convolution Layer

Typically, a CNN consists of an input layer, a convolutional layer, a pooling layer, an activation function, and a fully connected layer [45]. The convolutional layer serves as the core of the CNN, in which the convolutional kernel slides over the input image at a given step and extracts high-level depth features from the input image by convolutional operations [46]. The pooling layer, also known as the downsampling layer, downsamples the features extracted by the convolutional layer to reduce the amount of data while preserving important features. The activation function increases the nonlinear network factors and improves the network model expression; the common activation functions are Sigmoid, Relu, and Softmax [47]. The fully connected layer acts as a “classifier” in the CNN, mapping the learned features to the sample labeling space. The basic convolutional process of the convolutional layer can be expressed as follows:
F ( l ) = f ( l ) ( W ( l ) × F ( l 1 ) + b ( l ) ) s ( l ) p ( l ) q ( l ) n ( l )
where F ( l 1 ) and F ( l ) are the input and output of the first layer, respectively, l is the number of layers in the neural network, W ( l ) and b ( l ) are the weight and bias of the layer, respectively; f ( l ) is the activation function of the corresponding layer, subscripts s, p, and q are the size of the convolutional kernel of layer l, and the subscript n is the number of convolutional kernels.
We use the max pooling layer to downsample the feature information, so the computational process can be expressed as follows:
F = m a x { F ( l 1 ) K } s ( l ) p ( l ) q ( l ) n ( l )
where K is the convolution kernel of the pooling operation, is the pooling operator, and the maximum value is calculated as the output.
In addition, we use the residual and multiscale extraction structure to more accurately extract the deep, subtle features of the data to address the problem of differing scales in remote-sensing data. Moreover, the residual structure improves the network’s efficiency and alleviates network gradient dispersion.

3.2.3. Model Training and Validation

In this study, because the unknown parameters of the deep-learning model cannot be calculated analytically, an iterative framework is used to optimize the model parameters during the model-training phase. The advantage of this approach is that the predicted value produced by the model converges to the real value and thus improves the learning ability of the model. In this study, the adaptive moment estimation optimizer is used to optimize the model parameters, and the maximum number of iterations for network training is set to 50. In addition, the cross-entropy loss function C E l o s s is utilized to calculate the error of the network during the training phase. The model training phase is performed on the training samples, after which the loss values of the trained model are calculated by using the validation samples to complete the training and validation of the model. Table 1 shows the information obtained from the training and validation samples. The cross-entropy loss function is
C E l o s s = i = 1 N ϕ i log ω i
where N is the number of categorical categories, ϕ is the sign function (0 or 1), the prediction result of the sample model i is correct as 1 and incorrect as 0, and ω is the probability that sample i belongs to the category prediction label.

3.3. Accuracy Assessment

In this study, random sampling was employed to divide reference samples into training (80%), and validation (20%) samples.(see Table 1).
The statistical accuracy assessment is done by using the independent test sample. Overall accuracy (OA), producer accuracy (PA), commission error (CE), omission error (OE), kappa coefficient (KC), and average accuracy (AA) are extracted from the confusion matrix species of the classification to evaluate the classification accuracy.
At the same time, to reflect the validity of the classification results and the stability of the test model, each group of experiments is conducted ten times, and the results of each evaluation index are expressed in the form of the mean ± the standard deviation.

3.4. Comparison with Other Classification Methods

Machine learning and deep learning have been widely applied in land-use classification studies. Knn, RF and SVM are the most common machine-learning methods used in land-use classification studies based on optical image datasets. With the results in Table A1, we select two classification algorithms, KNN and SVM, which have better classification effects in the study area of this paper for comparison experiments. The present study implements these two machine-learning-based classification methods to evaluate their efficiency compared with deep-learning-based classification methods. 2D- and 3D-CNN, as representatives of CNNs, have produced remarkable results due to their ability to extract deep spatial and spectral features from remote-sensing images. The HybridSN model is a 2D- and 3D-CNN hybrid framework that combines the advantages of both algorithms to classify multispectral, hyperspectral, and fused band data. Therefore, five different classification models are selected to participate in the comparison experiments, which include two commonly used machine learning algorithms (i.e., KNN and SVM) and three deep learning classification models (i.e., 2D-CNN, 3D-CNN, and HybridSN) to more comprehensively evaluate the performance of the proposed models.

4. Results

By combining active-passive remote sensing with spectral indexes, we test the enhancement of typical urban-land-use classification. Four datasets are used: (1) SAR (2) MS (3) SAR + MS, and (4) All bands used separately as input data for the MAM-HybridNet model for land-use classification.

4.1. Parameter Settings

Before conducting the experiments, the parameters of the proposed classification model and other classification methods must be set. As described in the subsection on model training, the optimal parameter values for each classification method are determined based on experimental trial and error (see Table 2). The parameter settings are the same for all deep-learning classification methods. Note that the choice of some of these parameters depends on the processing system used.

4.2. Classification with Different Input Images

4.2.1. Classification with Sentinel-1A SAR Data

The MAM-HybridNet model is used to classify the Sentinel-2A SAR data, with the results shown in Table 3. The classification using the SAR image produces OA = 79.53%, with KC = 0.73, and AA = 77.83%. The cultivated land has the highest PA of 90.03%, followed by forest (89.71%), water (83.58%), construction land (73.20%), and bare land (53.89%). The results show that the classification is relatively inaccurate when using Sentinel-1A SAR images alone, so accurate feature extraction is not possible. In particular, the classification results for construction land and bare land are inaccurate, with bare land having the highest CE of 46.19%, followed by water (22.58%), construction land (19.88%), forest (13.97%), and cultivated land (10.53%). However, Sentinel-1A SAR does a good job identifying cultivated land and forest, and the CE and OE of each are low compared with the classification results of other features, which are around 10%. Figure 6 shows the land-use classification map. The misclassification of bare land and construction land is serious in the mountainous areas in the study area, and a large amount of bare land is identified as construction land. Meanwhile, cultivated land and water are also misclassified: cultivated land in the southeast is misclassified as water, and water in the eastern reservoirs is misclassified as cultivated land.

4.2.2. Classification with Sentinel-2B MSI Data

The MAM-HybridNet model is used to classify the Sentinel-2B MSI data (see results in Table 4). The classification using the MS image produces OA = 93.84%, KC = 0.91, and AA = 92.86%. Water has the highest PA of 97.93%, followed by cultivated land (97.08%), forest (92.08%), bare land (90.34%), and construction land (88.34%). The results show that the classification accuracy of all types of features improves significantly when using Sentinel-2B MSI images alone compared with the results when using Sentinel-1A SAR images. In particular, the classification accuracies of water, bare land, and construction land improve significantly, with their PA increasing by 65.35%, 36.56%, and 15.14%, respectively. The actual production demand cannot be satisfied. The highest OE for construction land is 11.65%, followed by bare land (9.65%) and forest (7.91%), which needs to further improve the classification effect. The resulting land-use classification map appears in Figure 7. Compared with the classification results using Sentinel-1A SAR alone, the Sentinel-2B MSI optical image better solves the misclassification problem between water and cultivated land in this study area, and the correct identification rate of bare land and construction land improves in the western mountainous area. However, misclassification of cultivated land and forest occurs because of similar satellite reflectance, and some cultivated land in the southeast is still misclassified as forest.
In addition, to verify the rationality of this study and the necessity of the proposed classification model, only MS data were used as input data to explore the classification effects of traditional classification algorithms (SVM, KNN, and RF), where SVM has the highest OA of 80.10%, followed by KNN (71.19%), and RF (70.09%) (see Table A1). The results show that when the urban environment is interfered by conditions such as surface humidity, clouds and haze, the traditional machine learning method has low accuracy and cannot meet the actual production needs. Therefore, it is necessary to propose a deep learning method with stronger feature extraction capability.

4.2.3. Classification with the Combination of Sentinel-2B MSI and Sentinel-1A SAR Data

The MAM-HybridNet model is used to classify the Sentinel-1A SAR and Sentinel-2B MSI fused data. The results appear in Table 5. The classification uses the SAR + MS fused data to produce OA = 95.10%, KC = 0.93, and AA = 94.57%. Water has the highest PA of 97.95%, followed by cultivated land (97.33%), construction land (95.61%), forest (93.63%), and bare land (85.49%). The results show that the classification accuracy, when using Sentinel-1A SAR and Sentinel-2B MSI fused data, improves compared with the classification accuracy obtained using the Sentinel-1A SAR data alone, with OA improving by 1.26%, KC improving by 0.18, and AA improving by 1.71%. Compared with the use of Sentinel-2B MSI data alone, the PA of cultivated land, construction land, forest, and water improves by 0.25%, 7.27%, 1.55%, 0.15%, and 0.02%, respectively, which indicates that the extraction of construction land and forest based on Sentinel-1A SAR and Sentinel-2B MSI fused data improves land classification in the study area. Figure 8 shows the resulting land-use classification map. Compared with the classification results using Sentinel-2B MSI data alone, the fused data reduce the misclassification of cultivated land and forest in the eastern part of the study area. In addition, the misclassification of cultivated land and construction land in the northwestern part of the study area is corrected, and to explore the effect of deep SAR information (grey scale co-occurrence matrix, GLCM) on land use classification, this is explored in the discussion section (see Table A2)

4.2.4. Classification with All Bands Data

To further investigate how spectral indexes affect land-use classification, we extract EVI, MNDWI, and NDBI from Sentinel-2B MSI data and fuse the data with Sentinel-1A SAR and Sentinel-2B MSI data to form “All bands data”. The MAM-HybridNet model is used to classify the All bands data, and the results appear in Table 6. The classification using All bands data (SAR + MS + Spectral Indexes) produces OA = 98.87%, KC = 0.98, and AA = 98.36%. The highest PA is 99.89% for water, followed by cultivated land (99.21%), construction land (98.82%), forest (98.48%), and bare land (97.19%). The results show that the classification accuracy improves significantly upon adding EVI, MNDWI, and NDBI spectral indexes to the Sentinel-1A SAR and Sentinel-2B MSI fused data, with OA improving by 3.77%, KC by 0.05, and AA by 5.5%. The largest improvement in classification results is for bare land, followed by forest, construction land, water, and cultivated land, with 11.7%, 4.85%, 3.21%, 1.94%, and 1.88% improvement in PA, respectively. Compared with other datasets, the CE and OE of features under full waveform data decrease significantly, with the largest OE decrease being 2.80% for bare land, followed by forest (1.51%), construction land (1.17%), cultivated land (0.78%), and water (0.10%). Figure 9 shows the resulting land-use classification map. Comparison with the classification results of other datasets verifies the effectiveness of the spectral indexes in improving the classification results.

4.2.5. Confusion Matrix Analysis of Different Input Images

The results of the above subsection show that SAR, MS, MS + SAR, and All bands data have the highest OA of 98.87%, followed by MS + SAR (95.10%) data, MS (93.48%), and SAR (79.53%) when used as input data for the MAM-HybridSN model. To further explore the advantages and disadvantages of the four data sets, we analyze their classification confusion matrix (see Figure 10). The number of correctly classified pixels for SAR data is 21,047 for cultivated land, followed by construction land (12,201), forest (16,130), bare land (3867), and water (7791). The number of correctly classified pixels for MS data is 24,352 for cultivated land, followed by construction land (14,545), forest (18,726), bare land (5200), and water (8918). The number of correctly classified pixels for MS + SAR data is 25,158 for cultivated land, followed by construction land (14,131), forest land (19,162), bare land (5470), and water (9064). The number of correctly classified pixels for All bands is 26,306 for cultivated land, followed by construction land (15,008), forest land (19,533), bare land (5472), and water (9292).
The results show that, when using SAR data alone, the SAR data are highly sensitive to water and better distinguish bare land from water: only two pixels of bare land are classified as water, and seven pixels of water are classified as bare land. When using MS data alone, the spectral information contains abundant information, which greatly improves the classification accuracy compared with SAR data alone. However, due to the similar spectral reflectance of vegetation forest and cultivated land, the two are more seriously confused. A total of 928 pixels of cultivated land are misclassified as forest, and 367 pixels of forest are misclassified as cultivated land. Upon fusing MS and SAR data, the SAR data compensates for the problem of similar spectral reflectance, which reduces the confusion between forest and cultivated land, with 183 fewer pixels of forest being misclassified as cultivated land and 306 fewer pixels of cultivated land being misclassified as forest. When using All bands data, the confusion between classes is lowest, and the best classification is obtained. The confusion between construction land and bare land improves greatly, and only 63 pixels of construction land are misclassified as bare land. A total of 78 pixels of bare land are misclassified as construction land, which shows that SAR data improve the classification accuracy of MS images of construction land, forest, and cultivated land. The EVI, MNDWI, and NDBI further improve the differentiation between cultivated land and forest, bare land and construction land, and water and other classes. Additionally, they improve the overall classification accuracy.

4.3. Classification with Different Classification Methods

4.3.1. Comparison with Other Classification Methods

In this study, to verify the effectiveness of the proposed method, All bands are used as the input image, and the classification is compared with SVM, KNN, 2D-CNN, 3D-CNN, and HybridSN under the same training samples to verify the effectiveness of the proposed deep-network model. Table 7 and Figure 11 show the classification results. The highest OA (98.87%) is produced by the proposed MAM-HybridNet model, and the lowest OA (76.66%) is produced by the KNN algorithm. The OA of the SVM classification algorithm is 86.74%, which is a significant improvement compared with the same machine-learning KNN algorithm. Still, the classification performance needs to be improved compared with the deep-learning classification algorithm because machine-learning classification algorithms only extract shallow data features and cannot extract deep features. Compared with machine-learning classification algorithms, 2D-CNN increases the depth of feature extraction, and it extracts deeper discriminative features between features, with an OA of 94.18%.
3D-CNN is more accurate than 2D-CNN, with OA = 96.76%. The 3D-CNN extracts deeper spatial information about the features and the spectral dimension of the images. The transformation of features from 2D to 3D transforms the feature information dimensionally, which increases the ability of the network to extract feature information from different dimensions. The classification results are more accurate compared with the results of 3D-CNN, and its OA of classification is 96.84%. The proposed MAM-HybridNet model produces the best classification result, with OA = 98.87%. By adding residual spectral and spatial attention, the network extracts deeper discriminative features from spatial and spectral dimensions, which reuses useful features and suppresses minor features. Meanwhile, the residual end-to-end structure constitutes a constant mapping to compensate for the disadvantage of losing feature information when the attention mechanism optimizes feature adaptation. In short, the model proposed herein produces more accurate classification results.

4.3.2. Confusion-Matrix Analysis of Different Classification Methods

Figure 12 shows the confusion matrices for KNN, SVM, 2D-CNN, 3D-CNN, HybridSN, and the proposed method for classification. The number of correctly classified pixels for KNN algorithm is 23,290 for cultivated land, followed by construction land (7629), forest (15,977), bare land (2806), and water (9135). The number of correctly classified pixels for SVM algorithm is 24,358 for cultivated land, followed by construction land (13,514), forest (15,498), bare land (3945), and water (9258). The number of correctly classified pixels for 2D-CNN algorithm is 24,449 for cultivated land, followed by construction land (14,179), forest (19,169), bare land (5229), and water (9260). The number of correctly classified pixels for 3D-CNN algorithm is 25,913 for cultivated land, followed by construction land (14,358), forest (19,109), bare land (5615), and water (9266). The number of correctly classified pixels for HybridSN algorithm is 25,821 for cultivated land, followed by construction land (14,514), forest (19,239), bare land (5478), and water (9270). The number of correctly classified pixels for the algorithm proposed herein is 26,306 for cultivated land, followed by construction land (15,008), forest land (19,533), bare land (5742), and water (9292).
These results show that the overall accuracy of the SVM algorithm exceeds that of the KNN algorithm, but the number of correctly classified pixels for all five land types is less than that of the deep-learning classification methods. The main reason is that the machine-learning classification methods only use spectral features and fail to make full use of the spatial features of the active and passive remote-sensing data. The 2D-CNN is weaker than the 3D-CNN algorithm for extracting the spectral features of remote-sensing data and is slightly weaker than the 3D-CNN in the overall number of correctly classified pixels. The HybridSN algorithm fuses the 2D-CNN and 3D-CNN, combining the two algorithms. The HybridSN algorithm combines the advantages of both algorithms and increases the extraction of spatial and spectral features of remote sensing data, and it correctly classifies more pixels, but the correct pixels of cultivated land and bare land decrease by 92 and 137, respectively. This shows that the HybridSN algorithm, after fusing multiple algorithms, overfits feature information, producing information loss with increasing network depth, which leads to weaker classification results in cultivated land and bare land. The proposed algorithm introduces the multi-attention mechanism and creates residual structure on the framework, which avoids overfitting and information loss, resulting in an overall improvement in classification and the highest number of correct pixels in each class of all the models.

5. Discussion

5.1. Impact of Active-Passive Remote Sensing Data on Urban-Land-Use Classification

Active-passive remote sensing data have significant potential for urban-land-use classification studies. The classification results of the Sentinel-1A SAR images show that SAR data can be used to distinguish between cultivated land, construction land, and forest (Table 3, Figure 6). These results are attributed to the sensitivity of SAR data to the rough ground surface, which is approximately the same as published results [12,13,14,15]. When using only MS data, the confusion between cultivated land and forest is high due to similar spectral reflectance. The synergistic use of SAR data complements the distinction between cultivated land and forest. Previous studies show that SAR images are highly differentiated for water [48,49]. In this study, confusion between water and cultivated land occurs partly because the data were collected during the rainy season. As a result, cultivated land in the southeastern part of the study area, which is low-lying, was seriously flooded, resulting in the misclassification of cultivated land and water.
Meanwhile, the SAR + MS data showed a slight improvement in classification accuracy of 1.62% compared to the MS data. To explore the contribution of the deep information of SAR data to the classification task, texture parameters (grey scale co-occurrence matrix, GLCM) were extracted. The GLCM was fused with SAR + MS to form SAR + MS + GLCM data as the input data for the MAM-HybridSN network for the experiments, and the classification results are shown in Table A2, with an OA of 96.59%, which is 3.11% higher than the OA of the previous MS data. This indicates that deeper SAR information helps to improve the classification accuracy, further validating the potential of SAR data for land use classification tasks.
The addition of spectral indices improves the OA of land-use classification. The improvement mainly benefits from the EVI, MNDWI, and NDBI. The EVI improves the neural network’s sensitivity to high biomass vegetation and identifies forest, bare land, and non-vegetation areas. The MNDWI explores the weak features of water, is insensitive to the influence of shadows for water extraction, and accurately extracts water. The NDBI accurately reflects construction land, which helps to identify construction land and bare land. The addition of EVI, MNDWI, and NDBI indexes allows the MAM-HbridNet model to extract deep-level discriminative features of cultivated land, construction land, forest, bare land, and water. They overcome the confusion between bare land, cultivated land, and construction land, which is difficult to extract.

5.2. Proposed Architecture and Deep Feature Extraction

Feature information extraction is a key element of deep-learning classification. This feature information can be obtained by joint extraction of spectral features and of spatial features from remote-sensing images. The land-use classification results of KNN and SVM classification algorithms based on machine-learning methods show that their classification accuracy is inferior to that of deep-learning methods. This is mainly because machine-learning classification algorithms only use the spectral features of the active and passive remote-sensing data. In contrast, deep learning uses the spatial features of remote-sensing data, and the results show that most of their classification results have OA values greater than 95%. These results show the importance of extracting the spatial features from active and passive remote-sensing data for urban-land-use classification.
A suitable CNN model is vital for extracting deep features from images. A suitable architecture is a key factor for extracting deep features using CNN methods. This work designs a new 2D and 3D hybrid CNN framework based on multiscale residual blocks. Moreover, residual spectral and spatial attention modules are introduced to improve network-model-specific learning and feature representation [50]. The results of urban-land use classification show that the proposed model is effective in extracting deep features of active and passive remote-sensing data, and the classification accuracy is improved compared with other advanced classification models.
The stability of the network model is the most important factor for image classification. In this paper, each classification experiment was done ten times to evaluate the stability of the algorithm classification based on the mean ± the standard deviation when the classification algorithm is evaluated with different image inputs. The results appear in Table 7 and show that the maximum standard deviation is ±0.39 for SAR data, followed by MS (±0.35), SAR with MS (±0.24), and All bands (±0.08). Moreover, the standard deviation is less than 0.5 for all four data sets, reflecting the high stability of the method proposed herein.
Semantic segmentation-based methods, such as deeplabV3+ and U-Net, have produced good results for land-use classification [51,52], but they require a large sample dataset as support and often require labeling all pixels of the image, which is labor-intensive. However, the method proposed herein uniformly labels the features and produces better classification results with only 95,929 pixel-labeled points.
The multi-attention module is introduced to improve the effectiveness of the network in the classification task. The results reveal an OA improvement of 1.66% over the HybridSN model, which shows that residual spatial and spectral attention can reuse the deep useful features of the image and improve the classification accuracy of the proposed model. In addition, it shows that the attention mechanism has a strong potential for deep-feature extraction.
In order to explore the effective effect of the proposed multi-attention module, experiments were carried out with All bands data as input data. The results are shown in Table A3. The OA of the multi-attention module is 96.37%, and the classification effect is roughly the same as that of the 3D-CNN and HybridSN algorithms, which verifies the effectiveness of the proposed multi-attention module in the urban land use classification task.

6. Conclusions

Accurate land-use classification is an important tool for monitoring urban development, protecting the urban environment, and restoring urban ecology, as well as for the sustainable development of urban-land resources. This study proposes a hybrid CNN with a multi-attention module (MAM-HybridNet) to combine active-passive remote-sensing data and spectral indexes and thereby improve land-use classification accuracy in a typical city with high surface soil moisture. This study uses the Qibin District of Henan Province as an example. The results indicate that
  • the worst classification accuracy is produced by using SAR images alone, with OA = 79.53%, KC = 0.73, and AA = 77.83%. SAR images produce more accurate classification for forest and water.
  • When using MS data alone, the OA of land-use classification is 93.48%, KC = 0.91, and AA = 92.86%. With the synergistic effect of SAR and MS data, the OA accuracy is 95.10%, which is a 1.62% improvement. After considering the deep information of SAR data (GLCM), the OA is 96.59%, which gets even greater improvement of 3.11%.
  • EVI, MNDWI, and NDBI spectral indexes combined with SAR and MS data produce the most accurate classification results, with OA = 98.87%, KC = 0.98, and AA = 98.36%. The spectral index, which was added as a characteristic variable, increases the discriminative feature classes and reduces the confusion between bare land and construction land, and between forest and cultivated land.
  • Comparing the classification results of KNN, SVM, 2D-CNN, 3D-CNN, and HybridSN methods with those of the proposed method, the latter produces the best classification results when “All bands data” are selected as the input data, with OA = 98.87%. The standard deviation of the ten experimental results is ±0.53, further testifying to the accuracy and stability of the proposed MAM-HybridNet model. These results confirm that SAR and spectral indexes can improve the classification accuracy of optical images. The synergistic active-passive remote-sensing classification can be generalized to other typical urban areas with high surface soil moisture and with clouds, haze, and smog.
In addition, the proposed MAM-HybridSN network model has more advantages over the other classification methods for feature extraction and feature representation, which further improves the classifier performance and classification accuracy. The 2D-CNN and 3D-CNN algorithms make up for the under-exploitation of spectral features and spatial features, respectively, and overcome the problems of overfitting and feature-information loss in HybridSN networks. The proposed model can be extended to applications such as crop classification, vegetation-type classification, and flood monitoring. However, the model still has shortcomings, and the introduction of the multi-attention mechanism and residual structure makes the network structure more complex. In future research, we thus plan to continue improving the structure of the network to produce a lightweight model with optimum classification accuracy.

Author Contributions

Conceptualization, H.Z. and Z.Y.; methodology, Z.Y.; software, Z.Y.; validation, Z.Y., H.Z., X.L. and W.D.; formal analysis, Z.Y.; investigation, H.Z.; resources, Z.Y.; data curation, Z.Y.; writing—original draft preparation, Z.Y.; writing—review and editing, H.Z., Z.Y., X.L. and W.D.; visualization, Z.Y.; supervision, H.Z.; project administration, H.Z.; funding acquisition, H.Z. All authors have read and agreed to the published version of the manuscript.

Funding

This research was funded by the Nation Natural Science Foundation of China (grant number U21A20108), the Joint Fund of Collaborative Innovation Center of Geo-Information Technology for Smart Central Plains, Henan Province and the Key Laboratory of Spatiotemporal Perception and Intelligent processing, Ministry of Natural Resources (grant number 211102), the project of Provincial Key Technologies R & D Program of Henan (grant number 222102320306).

Institutional Review Board Statement

Not applicable.

Informed Consent Statement

Not applicable.

Data Availability Statement

The data presented in this study are available from the corresponding author upon reasonable request.

Acknowledgments

We thank the anonymous reviewers for their constructive feedback.

Conflicts of Interest

The authors declare no conflict of interest.

Appendix A

Table A1. Classification results using machine learning algorithms with MS data.
MethodIndexCultivated LandConstruction LandForestBare LandWater
RFPA (%)94.02 ± 1.3474.98 ± 4.3755.33 ± 3.6826.71 ± 4.8289.30 ± 2.23
CE (%)18.48 ± 3.1951.22 ± 4.9132.99 ± 4.0655.51 ± 4.014.27 ± 1.01
OE (%)5.98 ± 1.5925.01 ± 3.9544.67 ± 3.8773.28 ± 5.1210.69 ± 2.58
OA (%)70.09 ± 3.15
KC (%)60.93 ± 2.56
AA (%)61.24 ± 2.72
KNNPA (%)94.52 ± 1.1276.37 ± 3.7956.35 ± 4.1827.43 ± 3.7390.08 ± 1.51
CE (%)16.59 ± 3.5750.56 ± 4.3131.97 ± 3.7655.35 ± 4.113.95 ± 0.36
OE (%)5.47 ± 1.2423.62 ± 3.1943.64 ± 4.0772.56 ± 3.949.91 ± 1.15
OA (%)71.19 ± 3.15
KC (%)62.31 ± 2.56
AA (%)63.67 ± 2.72
SVMPA (%)98.17 ± 1.5977.03 ± 3.7669.81 ± 3.9544.09 ± 3.6796.77 ± 0.52
CE (%)15.58 ± 2.1821.11 ± 3.0528.31 ± 3.7136.56 ± 3.011.55 ± 0.74
OE (%)1.82 ± 0.9222.96 ± 3.8230.18 ± 4.0355.91 ± 4.283.22 ± 0.83
OA (%)80.10 ± 1.79
KC (%)74.01 ± 2.05
AA (%)75.91 ± 1.97
Table A2. Classification results using MAM-HybridNet model with SAR + MS + GLCM data.
MethodIndexCultivated LandConstruction LandForestBare LandWater
SAR + MS + GLCMPA (%)97.65 ± 0.1496.26 ± 1.0396.48 ± 1.1790.10 ± 2.4398.71 ± 0.31
CE (%)3.13 ± 0.533.84 ± 1.672.28 ± 1.368.67 ± 1.912.40 ± 0.06
OE (%)2.34 ± 0.913.73 ± 1.263.52 ± 1.489.89 ± 2.151.28 ± 0.07
OA (%)96.59 ± 1.05
KC (%)95.48 ± 1.16
AA (%)96.02 ± 1.02
Table A3. Classification results using multi-attention modules with All bands data.
MethodIndexCultivated LandConstruction LandForestBare LandWater
multi-attention modulesPA (%)98.40 ± 0.1496.18 ± 1.0396.07 ± 1.1790.68 ± 2.4399.05 ± 0.31
CE (%)2.53 ± 0.536.25 ± 1.673.23 ± 1.367.85 ± 1.910.51 ± 0.06
OE (%)1.59 ± 0.913.81 ± 1.263.92 ± 1.489.31 ± 2.150.94 ± 0.07
OA (%)96.37 ± 1.05
KC (%)95.20 ± 1.16
AA (%)95.92 ± 1.02

References

  1. Long, H.; Liu, Y.; Hou, X.; Li, T.; Li, Y. Effects of land use transitions due to rapid urbanization on ecosystem services: Implications for urban planning in the new developing area of China. Habitat Int. 2014, 44, 536–544. [Google Scholar] [CrossRef]
  2. Li, P.; Feng, Z.; Xiao, C. Acquisition probability differences in cloud coverage of the available Landsat observations over mainland Southeast Asia from 1986 to 2015. Int. J. Digit. Earth 2017, 11, 437–450. [Google Scholar] [CrossRef]
  3. Zhu, Z.; Woodcock, C.E. Object-based cloud and cloud shadow detection in Landsat imagery. Remote Sens. Environ. 2012, 118, 83–94. [Google Scholar] [CrossRef]
  4. Skittou, M.; Madhoum, O.; Khannouss, A.; Merrouchi, M.; Gadi, T. Classification of land use areas using remote sensing data with machine learning. In Proceedings of the 2020 IEEE International conference of Moroccan Geomatics (Morgeo), Casablanca, Morocco, 11–13 May 2020; pp. 1–5. [Google Scholar] [CrossRef]
  5. Ling, J.; Zhang, H.; Lin, Y. Improving Urban Land Cover Classification in Cloud-Prone Areas with Polarimetric SAR Images. Remote Sens. 2021, 13, 4708. [Google Scholar] [CrossRef]
  6. Solórzano, J.V.; Mas, J.F.; Gao, Y.; Gallardo-Cruz, J.A. Land use land cover classification with U-net: Advantages of combining sentinel-1 and sentinel-2 imagery. Remote Sens. 2021, 13, 3600. [Google Scholar] [CrossRef]
  7. Laurin, G.V.; Liesenberg, V.; Chen, Q.; Guerriero, L.; Del Frate, F.; Bartolini, A.; Coomes, D.; Wilebore, B.; Lindsell, J.; Valentini, R. Optical and SAR sensor synergies for forest and land cover mapping in a tropical site in West Africa. Int. J. Appl. Earth Obs. Geoinf. ITC J. 2013, 21, 7–16. [Google Scholar] [CrossRef]
  8. Isaienkov, K.; Yushchuk, M.; Khramtsov, V.; Seliverstov, O. Deep Learning for Regular Change Detection in Ukrainian Forest Ecosystem with Sentinel-2. IEEE J. Sel. Top. Appl. Earth Obs. Remote Sens. 2020, 14, 364–376. [Google Scholar] [CrossRef]
  9. Malenovský, Z.; Rott, H.; Cihlar, J.; Schaepman, M.E.; García-Santos, G.; Fernandes, R.; Berger, M. Sentinels for science: Potential of Sentinel-1,-2, and-3 missions for scientific observations of ocean, cryosphere, and land. Remote Sens. Environ. 2012, 120, 91–101. [Google Scholar] [CrossRef]
  10. Gargiulo, M.; Dell’Aglio, D.A.G.; Iodice, A.; Riccio, D.; Ruello, G. Integration of Sentinel-1 and Sentinel-2 Data for Land Cover Mapping Using W-Net. Sensors 2020, 20, 2969. [Google Scholar] [CrossRef]
  11. Gong, P.; Liu, H.; Zhang, M.; Li, C.; Wang, J.; Huang, H.; Clinton, N.; Ji, L.; Li, W.; Bai, Y.; et al. Stable classification with limited sample: Transferring a 30-m resolution sample set collected in 2015 to mapping 10-m resolution global land cover in 2017. Sci. Bull. 2019, 64, 370–373. [Google Scholar] [CrossRef] [Green Version]
  12. Chen, Q.; Cao, W.; Shang, J.; Liu, J.; Liu, X. Superpixel-Based Cropland Classification of SAR Image with Statistical Texture and Polarization Features. IEEE Geosci. Remote Sens. Lett. 2021, 19, 1–5. [Google Scholar] [CrossRef]
  13. Useya, J.; Chen, S. Exploring the Potential of Mapping Cropping Patterns on Smallholder Scale Croplands Using Sentinel-1 SAR Data. Chin. Geogr. Sci. 2019, 29, 626–639. [Google Scholar] [CrossRef] [Green Version]
  14. Liao, C.; Wang, J.; Huang, X.; Shang, J. Contribution of minimum noise fraction transformation of multi-temporal RADARSAT-2 polarimetric SAR data to cropland classification. Can. J. Remote Sens. 2018, 44, 215–231. [Google Scholar] [CrossRef]
  15. Pan, Z.; Hu, Y.; Wang, G. Detection of short-term urban land use changes by combining SAR time series images and spectral angle mapping. Front. Earth Sci. 2019, 13, 495–509. [Google Scholar] [CrossRef]
  16. Liang, J.; Liu, D. A local thresholding approach to flood water delineation using Sentinel-1 SAR imagery. ISPRS J. Photogramm. Remote Sens. 2019, 159, 53–62. [Google Scholar] [CrossRef]
  17. Markert, K.; Chishtie, F.; Anderson, E.R.; Saah, D.; Griffin, R.E. On the merging of optical and SAR satellite imagery for surface water mapping applications. Results Phys. 2018, 9, 275–277. [Google Scholar] [CrossRef]
  18. Wang, J.; Xiao, X.; Liu, L.; Wu, X.; Qin, Y.; Steiner, J.L.; Dong, J. Mapping sugarcane plantation dynamics in Guangxi, China, by time series Sentinel-1, Sentinel-2 and Landsat images. Remote Sens. Environ. 2020, 247, 111951. [Google Scholar] [CrossRef]
  19. Haas, J.; Ban, Y. Sentinel-1A SAR and sentinel-2A MSI data fusion for urban ecosystem service mapping. Remote Sens. Appl. Soc. Environ. 2017, 8, 41–53. [Google Scholar] [CrossRef]
  20. Veloso, A.; Mermoz, S.; Bouvet, A.; Le Toan, T.; Planells, M.; Dejoux, J.-F.; Ceschia, E. Understanding the temporal behavior of crops using Sentinel-1 and Sentinel-2-like data for agricultural applications. Remote Sens. Environ. 2017, 199, 415–426. [Google Scholar] [CrossRef]
  21. Walker, W.S.; Stickler, C.M.; Kellndorfer, J.M.; Kirsch, K.M.; Nepstad, D.C. Large-area classification and mapping of forest and land cover in the Brazilian Amazon: A comparative analysis of ALOS/PALSAR and Landsat data sources. IEEE J. Sel. Top. Appl. Earth Obs. Remote Sens. 2010, 3, 594–604. [Google Scholar] [CrossRef]
  22. Colson, D.; Petropoulos, G.P.; Ferentinos, K.P. Exploring the Potential of Sentinels-1 & 2 of the Copernicus Mission in Support of Rapid and Cost-effective Wildfire Assessment. Int. J. Appl. earth Obs. Geoinf. ITC J. 2018, 73, 262–276. [Google Scholar] [CrossRef]
  23. Heckel, K.; Urban, M.; Schratz, P.; Mahecha, M.D.; Schmullius, C. Predicting forest cover in distinct ecosystems: The potential of multi-source Sentinel-1 and-2 data fusion. Remote Sens. 2020, 12, 302. [Google Scholar] [CrossRef] [Green Version]
  24. Zhang, H.; Li, Q.; Liu, J.; Shang, J.; Du, X.; McNairn, H.; Champagne, C.; Dong, T.; Liu, M. Image classification using rapideye data: Integration of spectral and textual features in a random forest classifier. IEEE J. Sel. Top. Appl. Earth Obs. Remote Sens. 2017, 10, 5334–5349. [Google Scholar] [CrossRef]
  25. Mandal, D.; Kumar, V.; Rao, Y.S. An assessment of temporal RADARSAT-2 SAR data for crop classification using KPCA based support vector machine. Geocarto Int. 2020, 37, 1547–1559. [Google Scholar] [CrossRef]
  26. Wang, L.; Fang, S.; Meng, X.; Li, R. Building Extraction With Vision Transformer. IEEE Trans. Geosci. Remote Sens. 2022, 60, 1–11. [Google Scholar] [CrossRef]
  27. Wang, L.; Li, R.; Zhang, C.; Fang, S.; Duan, C.; Meng, X.; Atkinson, P.M. UNetFormer: A UNet-like transformer for efficient semantic segmentation of remote sensing urban scene imagery. ISPRS J. Photogramm. 2022, 190, 196–214. [Google Scholar] [CrossRef]
  28. Rathod, V.V.; Rana, D.P.; Mehta, R.G. An Extensive Review of Deep Learning Driven Remote Sensing Image Classification Models. In Proceedings of the 2022 Third International Conference on Intelligent Computing Instrumentation and Control Technologies (ICICICT), Coimbatore, India, 25–26 August 2022; IEEE: New York, NY, USA, 2022; pp. 762–774. [Google Scholar]
  29. Zhao, H.; Duan, S.; Liu, J.; Sun, L.; Reymondin, L. Evaluation of Five Deep Learning Models for Crop Type Mapping Using Sentinel-2 Time Series Images with Missing Information. Remote Sens. 2021, 13, 2790. [Google Scholar] [CrossRef]
  30. Lee, H.; Kwon, H. Going Deeper With Contextual CNN for Hyperspectral Image Classification. IEEE Trans. Image Process. 2017, 26, 4843–4855. [Google Scholar] [CrossRef] [Green Version]
  31. Ji, S.; Zhang, C.; Xu, A.; Shi, Y.; Duan, Y. 3D Convolutional Neural Networks for Crop Classification with Multi-Temporal Remote Sensing Images. Remote Sens. 2018, 10, 75. [Google Scholar] [CrossRef]
  32. Yuan, X.; Shi, J.; Gu, L. A review of deep learning methods for semantic segmentation of remote sensing imagery. Expert Syst. Appl. 2020, 169, 114417. [Google Scholar] [CrossRef]
  33. Hoeser, T.; Bachofer, F.; Kuenzer, C. Object Detection and Image Segmentation with Deep Learning on Earth Observation Data: A Review—Part II: Applications. Remote Sens. 2020, 12, 3053. [Google Scholar] [CrossRef]
  34. Kattenborn, T.; Leitloff, J.; Schiefer, F.; Hinz, S. Review on Convolutional Neural Networks (CNN) in vegetation remote sensing. ISPRS J. Photogramm. Remote Sens. 2021, 173, 24–49. [Google Scholar] [CrossRef]
  35. Ulmas, P.; Liiv, I. Segmentation of satellite imagery using u-net models for land cover classification. arXiv 2020, arXiv:2003.02899. [Google Scholar] [CrossRef]
  36. Liu, J.; Zhang, Z.; Xu, X.; Kuang, W.; Zhou, W.; Zhang, S.; Li, R.; Yan, C.; Yu, D.; Wu, S.; et al. Spatial patterns and driving forces of land use change in China during the early 21st century. J. Geogr. Sci. 2010, 20, 483–494. [Google Scholar] [CrossRef]
  37. Song, W.; Deng, X. Land-use/land-cover change and ecosystem service provision in China. Sci. Total Environ. 2017, 576, 705–719. [Google Scholar] [CrossRef]
  38. Morais, C.L.; Santos, M.C.; Lima, K.M.; Martin, F.L. Improving data splitting for classification applications in spectrochemical analyses employing a random-mutation Kennard-Stone algorithm approach. Bioinformatics 2019, 35, 5257–5263. [Google Scholar] [CrossRef] [Green Version]
  39. Li, M.; Wang, Y.; Wang, Z.; Zheng, H. A deep learning method based on an attention mechanism for wireless network traffic prediction. Ad Hoc Networks 2020, 107, 102258. [Google Scholar] [CrossRef]
  40. Niu, Z.; Zhong, G.; Yu, H. A review on the attention mechanism of deep learning. Neurocomputing 2021, 452, 48–62. [Google Scholar] [CrossRef]
  41. Li, H.; Qiu, K.; Chen, L.; Mei, X.; Hong, L.; Tao, C. SCAttNet: Semantic Segmentation Network With Spatial and Channel Attention Mechanism for High-Resolution Remote Sensing Images. IEEE Geosci. Remote Sens. Lett. 2020, 18, 905–909. [Google Scholar] [CrossRef]
  42. Tong, W.; Chen, W.; Han, W.; Li, X.; Wang, L. Channel-Attention-Based DenseNet Network for Remote Sensing Image Scene Classification. IEEE J. Sel. Top. Appl. Earth Obs. Remote Sens. 2020, 13, 4121–4132. [Google Scholar] [CrossRef]
  43. Hu, J.; Shen, L.; Sun, G. Squeeze-and-Excitation Networks. In Proceedings of the IEEE Conference on Computer Vision and Pattern Recognition, Salt Lake City, UT, USA, 18–22 June 2018; pp. 7132–7141. [Google Scholar]
  44. Woo, S.; Park, J.; Lee, J.; Kweon, I.S. Cbam: Convolutional Block Attention Module. In Proceedings of the European Conference on Computer vision (ECCV), Munich, Germany, 8–14 September 2018; pp. 3–19. [Google Scholar]
  45. Albawi, S.; Mohammed, T.A.; Al-Zawi, S. Understanding of a Convolutional Neural Network. In Proceedings of the 2017 International Conference on Engineering and Technology (ICET), Antalya, Turkey, 21–23 August 2017; pp. 1–6. [Google Scholar]
  46. Seydi, S.; Hasanlou, M.; Amani, M. A New End-to-End Multi-Dimensional CNN Framework for Land Cover/Land Use Change Detection in Multi-Source Remote Sensing Datasets. Remote Sens. 2020, 12, 2010. [Google Scholar] [CrossRef]
  47. Crnjanski, J.; Krstić, M.; Totović, A.; Pleros, N.; Gvozdić, D. Adaptive sigmoid-like and PReLU activation functions for all-optical perceptron. Opt. Lett. 2021, 46, 2003–2006. [Google Scholar] [CrossRef] [PubMed]
  48. Martinis, S.; Kuenzer, C.; Wendleder, A.; Huth, J.; Twele, A.; Roth, A.; Dech, S. Comparing four operational SAR-based water and flood detection approaches. Int. J. Remote Sens. 2015, 36, 3519–3543. [Google Scholar] [CrossRef]
  49. Silveira, M.; Heleno, S. Separation Between Water and Land in SAR Images Using Region-Based Level Sets. IEEE Geosci. Remote Sens. Lett. 2009, 6, 471–475. [Google Scholar] [CrossRef]
  50. Mei, X.; Pan, E.; Ma, Y.; Dai, X.; Huang, J.; Fan, F.; Du, Q.; Zheng, H.; Ma, J. Spectral-spatial attention networks for hyperspectral image classification. Remote. Sens. 2019, 11, 963. [Google Scholar] [CrossRef] [Green Version]
  51. Kwak, G.; Park, N. Two-stage Deep Learning Model with LSTM-based Autoencoder and CNN for Crop Classification Using Multi-temporal Remote Sensing Images. Korean J. Remote Sens. 2021, 37, 719–731. [Google Scholar]
  52. Wei, S.; Zhang, H.; Wang, C.; Wang, Y.; Xu, L. Multi-Temporal SAR Data Large-Scale Crop Mapping Based on U-Net Model. Remote Sens. 2019, 11, 68. [Google Scholar] [CrossRef]
Figure 1. (a) The geographical location of the study area, and (b) the true color image of the study area.
Sustainability 14 14723 g001
Figure 2. Flowchart for land cover classification in the study area.
Sustainability 14 14723 g002
Figure 3. Proposed multi-attentive mechanisms Hybrid network for land use mapping.
Sustainability 14 14723 g003
Figure 4. Proposed residual spectral attention module.
Sustainability 14 14723 g004
Figure 5. Proposed residual spatial attention module.
Sustainability 14 14723 g005
Figure 6. Land-cover map obtained using MAM-HybridNet model with SAR data.
Sustainability 14 14723 g006
Figure 7. Land-cover map obtained using MAM-HybridNet model with MS data.
Sustainability 14 14723 g007
Figure 8. Land cover map obtained using MAM-HybridNet model with SAR + MS data.
Sustainability 14 14723 g008
Figure 9. Land cover map obtained using MAM-HybridNet model with All bands data.
Sustainability 14 14723 g009
Figure 10. Classification confusion matrix between different remote sensing data: (a) SAR, (b) MS, (c) MS + SAR, (d) All bands (ID represents the following classes: 1 = cultivated land, 2 = construction land, 3 = forest, 4 = bare land, 5 = water).
Sustainability 14 14723 g010
Figure 11. Land-use maps obtained using different classification algorithms with All bands data: (a) KNN, (b) SVM, (c) 2D-CNN, (d) 3D-CNN, (e) HybridSN, (f) MAM-HybridNet.
Sustainability 14 14723 g011aSustainability 14 14723 g011b
Figure 12. Classification confusion matrix between different classification algorithms: (a) KNN, (b) SVM, (c) 2D-CNN, (d) 3D-CNN, (e) HybridSN, (f) MAM-HybridNet (ID represents the following classes: 1 = Cultivated land, 2 = Construction land, 3 = Forest, 4 = Bare land, 5 = Water).
Sustainability 14 14723 g012
Table 1. Description of five land-use categories.
Class NameTraining ROIsValidation ROIsTraining PixelsValidation PixelsClass Description
Cultivated land1604026,7826695Arable land
Construction land1604015,2303807Buildings, roads, and industrial areas
Forest1604019,6654916Shrub, broadleaf, and conifers
Bare land1604060611515Open spaces with little or no vegetation
Water1604093042325Lakes, rivers, and ponds
Table 2. The optimum values of the methods parameters.
MethodDescription
KNNAlgorithm = auto, number of neighbors = 5, weights = uniform, metric = euclidean
SVMC = 1.0, kernel = rbf, degree = 3, gamma = auto, coef0 = 0.0, shrinking = True, tol = 0.001, cache_size = 200, class_weight = None, verbose = False, max_iter = −1, decision_function_shape = ovr, random_state = None
Deep-learning modelsdropout rate = 0.1, epochs = 50, initial learning = 10−4, mini-batch size = 256, weight initializer = He normal
Table 3. Classification results using MAM-HybridNet model with SAR data.
MethodIndexCultivated LandConstruction LandForestBare LandWater
SarPA (%)90.03 ± 0.6373.20 ± 2.9189.71 ± 2.1353.98 ± 3.7583.58 ± 4.68
CE (%)10.53 ± 1.3519.88 ± 1.9713.97 ± 1.8446.19 ± 3.9222.58 ± 3.84
OE (%)9.96 ± 0.0426.79 ± 3.3810.29 ± 1.2746.01 ± 4.0616.25 ± 4.01
OA (%)79.53 ± 1.57
KC (%)0.73 ± 1.18
AA (%)77.83 ± 0.53
Table 4. Classification results using MAM-HybridNet model with MS data.
MethodIndexCultivated LandConstruction LandForestBare LandWater
msPA (%)97.08 ± 0.7588.34 ± 2.5992.08 ± 1.2890.34 ± 1.8197.93 ± 1.05
CE (%)8.05 ± 1.014.49 ± 0.744.77 ± 0.6914.20 ± 2.184.13 ± 0.73
OE (%)2.91 ± 0.7611.65 ± 2.357.91 ± 1.469.65 ± 1.952.06 ± 0.65
OA (%)93.48 ± 0.85
KC (%)0.91 ± 0.83
AA (%)92.86 ± 1.26
Table 5. Classification results using MAM-HybridNet model with SAR + MS data.
MethodIndexCultivated LandConstruction LandForestBare LandWater
Sar + msPA (%)97.33 ± 0.6395.61 ± 1.4693.63 ± 1.7990.49 ± 1.2697.95 ± 0.18
CE (%)5.01 ± 0.947.21 ± 0.912.55 ± 0.149.75 ± 0.262.56 ± 0.58
OE (%)2.66 ± 0.254.38 ± 1.076.36 ± 1.329.50 ± 1.212.05 ± 0.37
OA (%)95.10 ± 0.97
KC (%)0.93 ± 1.03
AA (%)94.57 ± 1.45
Table 6. Classification results using MAM-HybridNet model with All bands data.
MethodIndexCultivated LandConstruction LandForestBare LandWater
Sar + ms + indexPA (%)99.21 ± 0.0998.82 ± 0.2398.48 ± 0.4697.19 ± 1.3499.89 ± 0.02
CE (%)0.67 ± 0.051.45 ± 0.280.67 ± 0.085.26 ± 1.490.11 ± 0.03
OE (%)0.78 ± 0.021.17 ± 0.371.51 ± 0.352.80 ± 0.840.10 ± 0.01
OA (%)98.87 ± 0.53
KC (%)0.98 ± 0.29
AA (%)98.36 ± 0.36
Table 7. Comparison of accuracies of different classification algorithms for land-use classification.
MethodIndexCultivated LandConstruction LandForestBare LandWater
KNNPA (%)97.32 ± 0.0383.73 ± 2.1961.57 ± 3.6833.45 ± 5.0397.51 ± 1.51
CE (%)12.06 ± 2.5949.90 ± 4.0138.42 ± 3.1653.70 ± 4.311.81 ± 0.16
OE (%)2.67 ± 0.8416.26 ± 3.5918.75 ± 4.1766.54 ± 3.052.48 ± 0.17
OA (%)76.66 ± 3.15
KC (%)69.24 ± 2.56
AA (%)72.75 ± 2.72
SVMPA (%)98.65 ± 0.1182.71 ± 0.3481.77 ± 1.2553.84 ± 3.6898.09 ± 0.48
CE (%)8.03 ± 0.5811.26 ± 1.4521.18 ± 2.4834.91 ± 3.120.48 ± 0.13
OE (%)1.34 ± 0.4517.28 ± 2.7818.22 ± 2.1746.15 ± 3.581.91 ± 0.13
OA (%)86.74 ± 1.83
KC (%)82.58 ± 2.47
AA (%)84.82 ± 2.54
2D-CNNPA (%)99.03 ± 0.1497.09 ± 1.6788.94 ± 0.9380.29 ± 1.5199.53 ± 0.03
CE (%)7.68 ± 0.716.90 ± 0.462.54 ± 0.1313.72 ± 2.410.46 ± 0.06
OE (%)0.97 ± 0.052.90 ± 0.7511.05 ± 0.7419.70 ± 2.061.43 ± 0.15
OA (%)94.18 ± 1.84
KC (%)92.32 ± 1.67
AA (%)93.73 ± 1.89
3D-CNNPA (%)98.59 ± 0.4196.58 ± 0.4197.17 ± 0.3786.62 ± 3.7899.78 ± 0.03
CE (%)2.15 ± 0.195.72 ± 1.012.82 ± 0.277.35 ± 1.310.39 ± 0.07
OE (%)1.40 ± 0.173.41 ± 0.213.62 ± 0.2113.37 ± 2.630.21 ± 0.04
OA (%)96.76 ± 1.69
KC (%)95.71 ± 1.84
AA (%)96.30 ± 1.34
HybridSNPA (%)98.80 ± 0.4895.60 ± 1.4796.22 ± 0.8689.22 ± 0.8199.73 ± 0.58
CE (%)2.50 ± 0.154.70 ± 0.292.16 ± 0.429.61 ± 0.490.35 ± 0.05
OE (%)1.19 ± 0.034.39 ± 0.353.77 ± 0.1710.78 ± 1.280.26 ± 0.12
OA (%)96.84 ± 1.23
KC (%)95.82 ± 1.67
AA (%)96.55 ± 1.19
Proposed MethodPA (%)99.22 ± 0.3198.83 ± 0.8198.48 ± 0.3497.19 ± 0.5499.88 ± 0.01
CE (%)0.67 ± 0.121.46 ± 0.710.67 ± 0.165.26 ± 1.510.11 ± 0.03
OE (%)0.78 ± 0.161.17 ± 0.421.52 ± 0.132.81 ± 0.310.10 ± 0.07
OA (%)98.87 ± 0.08
KC (%)98.50 ± 0.11
AA (%)98.36 ± 0.06
Publisher’s Note: MDPI stays neutral with regard to jurisdictional claims in published maps and institutional affiliations.

