Article

Cognitive Preference Performance of In-Vehicle Human–Machine Interface Icons under Female New Energy Vehicles

Shool of Mechanical Engineering, Shandong University, Jinan 250012, China
*
Authors to whom correspondence should be addressed.
Sustainability 2022, 14(22), 14759; https://doi.org/10.3390/su142214759
Submission received: 17 October 2022 / Revised: 7 November 2022 / Accepted: 7 November 2022 / Published: 9 November 2022

Abstract

:
With the advent of the “her economy” era, the new energy automobile market has also ushered in the “her era”, and female consumers have gradually become the main force of domestic and foreign vehicle consumption, thus contributing to the sustainable and rapid development of many female new energy automobile market segments. In this context, this study explores the icon cognitive preferences of female drivers based on gender differences in icon cognition by taking the human–machine interface icons in new energy automobiles as a case study. Firstly, we conducted behavioral response experiments and facial electromyography experiments on 20 male and female participants to analyze their cognitive preferences for icons by combining the four dimensions of “semantic dimension, conceptual dimension, contextual dimension and pragmatic dimension”. The results showed that the four−dimensional graphic deconstruction format had a significant effect on the improvement of icon recognition performance. At the same time, we designed 10 formats of icons as experimental stimulus materials and combined them with subjective scales to jointly explore the reasons for the bias of different gender participants towards icons. The results show that there are significant gender differences in icon perception on a four−dimensional basis, with males more likely to be disturbed by icon constituent elements (semantic dimension), while females are more likely to be disturbed by icon metaphors (semantic dimension) and usage environment and interface context (contextual dimension). This study helps to explore the best balance between studying women’s driving experiences in new energy vehicles and the sustainable product life cycle, and then improve the accuracy of women drivers’ decision−making behavior in new energy vehicles to ensure driving safety.

1. Introduction

Under the multiple pressures of energy shortage, environmental pollution, traffic congestion and unmet needs of the disadvantaged groups in today’s society, new energy vehicles with zero pollution and zero emission are developing rapidly with their unique advantages. The vigorous development of the new energy vehicle industry is an important strategic measure to effectively relieve environmental pressure and promote the transformation and upgrading of the automobile industry [1]. In recent years, with the rapid development of the market economy, products have entered the era of market segmentation, and women have gradually grown into the driving force of consumption in the new era. According to the 2021 China New Economy Series Report, China’s female consumption market is as high as CNY 10 trillion, with strong consumption power and the rise of “her economy”. It is noteworthy that with the prosperity of “her economy”, the auto industry, which used to have men as the main consumer group, has also changed its direction in recent years. 33.68% [2]. While the number of female drivers is growing, the proportion of female car purchases has also surpassed that of men. Data released by the China Vehicle Dealers Association shows that the proportion of female car purchase consumption reached 22.28% in 2020, already exceeding the 22.00% of males. The Insight Report on Preferences and Consumption Trends of Chinese Female Car Users also shows that the proportion of female users in new energy vehicles is 26.62%, which is 1.22 times higher than the proportion of female users of fuel cars. With the trend of “youthfulness and her power” in new energy vehicles, car companies have been expanding their boundaries in the marketing process, from creating women’s communication and sharing platforms to launching women−only brands, in order to close the distance with female consumers. In 2004, Volvo introduced the concept of women’s car YCC for the first time [3]. As shown in Figure 1, ORA launched the Ballet Cat, and WULING launched the MINIEV and other car designs that meet the needs of women’s appearance preferences. The biggest difference between the male and female car markets is that men are the first to consider the overall comfort and driving safety of car interiors, while women are more concerned with the design of car interiors [4]. However, for some new energy vehicle interior designs, adding a makeup mirror in the interior to meet women’s beauty needs, using feminine colors or materials from the body and interior parts, or using generalized key words such as “round, curved” to make a simple generalization of the whole female group preference have led to excessive or extreme gendering of some models, and not completely from the female user characteristics of the overall functional design. Therefore, car interior design should address women’s physiological and psychological needs from the framework of women’s cognitive thinking under the premise of meeting functionality and safety [5].
The automotive human–machine interface (HMI) is an important platform for user−vehicle information interaction [6] and is the main carrier of automotive interiors. At present, the automotive human–machine interface has been initially applied to mid−to high−end new energy vehicles and has a good development trend, which is a platform for exchanging information and converting raw and organized data into useful and operable data [7]. One of the effective icons in the interface can reduce the cognitive burden of the driver and provide a quick and complete understanding of the information to ensure the safety of the driver during the driving process [8]. It can also beautify the overall interface’s visual effect [9]. We found in our preliminary data research that the increasing number of female drivers and the increasing influence of their driving behaviors on road traffic operation have gradually become a group that cannot be ignored in modern traffic management work. The improvement of human–machine interface connectivity in new energy vehicles makes the driver’s driving operation task gradually more difficult [10]. This is accompanied by an increase in driving risks [11]. In this process, female drivers are often confused about the meaning of certain icons and the attention duration is unevenly distributed [12], which leads to female drivers performing incorrect information reorganization, thus affecting the next step of information delivery. Therefore, our research focuses on feminine refinement analysis of the in−vehicle interface icons in the interior of new energy vehicles, to realize the unification of icon function and female driver cognition based on the differences in male and female icon cognition, and ultimately to improve the efficiency of human–vehicle interaction, which is extremely important for the design of human–computer interaction interfaces in female new energy vehicles.
In our review of existing in−vehicle ISO (International Organization for Standardization) standard icons, we found that icons on in−vehicle human–machine interfaces fall into three main categories: graphics, text, and graphic–text combinations [13]. A large number of studies have compared the advantages of each icon form. For example, Roca et al. argue that icons associated with graphics have a clear mapping relationship with realistic references and will be more easily understood by drivers, and these are therefore considered the most effective and accurate type of icons to identify [14]. Chi and Dewi’s study shows that text icons can be further classified according to whether they contain words or abbreviations. The recognition response time of text−based icons is higher than that of other icon formats in the icon cognition process [15]. In the study of icon perception of graphic text combinations, it was found that key factors such as graphic perception, visual complexity, familiarity, semantic distance, and specificity influenced drivers. Specifically, visual complexity is related to the number of visual elements detailed in an icon, and therefore requires more attention and time from the user to recognize [16]. In cognitive studies of safety warning icons [17], road traffic icons [18], etc., it was shown that the higher the familiarity of the icon, the higher the level of understanding of the icon by the participants. Likewise, semantic distance and specificity have important effects on the perception of icons [19]. Studies have shown that participants’ comprehension is higher when the semantic distance between the icon and the functional meaning it expresses is closer [20]. Studies on concreteness, on the other hand, have shown that people respond more quickly and correctly to specific referential icons [21], due to the ability to interpret specific icons describing things through common life knowledge.
Previous studies have compared the advantages of each icon format and the research is mostly a reverse process of “from user research to icon design principles”. Due to the difference in the understanding of icon function among different user groups, there are some problems in the actual use of ISO car function icons. Specifically, for experienced drivers, they only operate the car with their skilled driving skills and do not pay much attention to the icons [22]. Second, the research on icon cognition in in−car human–machine interfaces focuses more on the visual search for icons and the influence of driver factors on the visual search for graphic symbols, such as driver age [23], and icon use experience [24]. On the basis of the above emergent issues, we note that there are cognitive differences between users of different genders [25], for example, when actually driving and encountering unexpected situations, drivers of different genders will be constrained by individual cognitive judgments and have different interpretations of icons. In addition, the same specific correlation exists between interface layout and gender users [26]. Therefore, we start from the icon itself to guide users to conduct positive cognitive research, explore the mapping relationship between the design expression of the icon and the function, and find the specific degree of difference in icon cognition and the feminization characteristics of the icon for drivers of different genders, so as to increase the accuracy of female drivers’ decision−making behavior and driving safety in new energy vehicles, which is the key issue of our current study.
Semiotics, as the basis for designing interface symbols, has covered interface design, sustainable design, and environmental design [27]. Symbolic interface design and evaluation [28] can not only reduce the cognitive load of users but also reduce the complexity of interface design. As part of the human–vehicle interface, the design of icons emphasizes the indication of car functions and usage (semantics) and greatly depends on the usage environment (context). Designing intuitive interface icons is essential to improve the learnability of in−vehicle systems and to ensure that the driving tasks involved are understood, supported, and completed. The four dimensions of semantics, semantic construction, context, and usage are a semiotics−based icon design method and process that explains the design reasoning processes such as user research and interface tacit knowledge representation [29]. The four−dimensional deconstruction process of icons under semiotics is shown in Figure 2. The icon deconstruction process is dissected from simple to difficult, layer by layer. Firstly, the aesthetics and unity of icons are explained from the semantic dimension; secondly, the coordination−related contents such as proportion, size, and details among icon elements are evaluated from the semantic construction dimension; and finally, the contents of graphic elements constituting icons are comprehensively evaluated under the target users of the semantic dimension in conjunction with the usage environment in the icon interaction process. This framework can reduce the cognitive distance between users and icons and enhance the cognitive accuracy [30].
In this study, we summarize the characteristics of a large number of in−car human–machine interface icons and deconstruct four dimensions of independent semantic, semantic construction, context and semantic use based on the characteristics of traditional semiotic icons, as shown in Figure 3. Taking the icon and the driver as the interaction subject and the shape and structure of the icon as the premise of cognitive processing, a closed−loop graphical dimensional analysis model independent of the design−based one is proposed according to the different gender subject differences of the driver in the process of understanding the icon. After analyzing the problems in the design and application of in−vehicle human–machine interface icons, we investigated the current status of male and female cognition of existing ISO in−vehicle functional icons, and redesigned and evaluated some of them. A standardized evaluation scale combining four dimensions of icon semantic, semantic construction, context and semantic use was used. We used facial electromyographic emotion recognition technology to study the influence of gender on in−car icon cognition, and collected participants’ facial electromyographic signals to obtain key indicators of behavioral responses of males and females in assessing icon cognitive performance, so as to objectively analyze participants’ icon familiarity and specificity performance at the instinctive level, discover differences in specific icon dimensions among drivers of different genders, and further explore the in−car human–machine interface icon interaction. The information processing process of in−vehicle HMI icon interaction was further explored. The gender−specific icon cognition results can be used to improve the ISO standard released by the International Organization for Standardization (2010), promote the development of icon personalization design, enable female drivers to access vehicle information more comfortably and accurately, and improve the safety of the driving process.

2. Methods

2.1. Participants

The scientific community draws attention to taking extra caution with experiments using student samples compared to non−student adult populations [31]. At the same time, the education level of the student sample was generally in the middle to upper level, with a high level of understanding and acceptance of the content of this experiment. In this study, in order to obtain valid experimental data, five college students were selected to conduct a pre−experiment before the formal experiment. After the pre−experimental phase proved that the experiment was feasible and valid, the formal experimental phase was entered. A total of 20 participants with driving experience were recruited for the formal experiment with the informed consent of each participant. Participants had a mean age of 25 years and a male to female ratio of 1:1 ( μ age = 2.263, σ a = 1.514). Visual acuity was normal or corrected, and there was no color blindness or color weakness. All participants were then given pre−experimental training to explain the experimental procedure and to reconfirm that participants had never participated in a similar experiment before. Laboratory experiments can provide some insight into basic thinking processes without being contaminated by unpredictable factors prone to take place in research with an industry context [32]. The experiment conformed to the codes of ethics of the American Psychological Association and the World Medical Association. After participants completed all tasks, they were compensated with at least USD 10 and could receive prizes.

2.2. Experimental Equipment

The experimental hardware equipment was a set of wireless portable surface EMG test sensors with 1024 Hz sampling rate; the software part of the experiment used ERGOLAB for EMG signal data reception. During the experiment, participants were asked to sit 420–550 mm in front of a 17−inch (433.18 mm) monitor. The range of head movement was 300 mm × 160 mm × 200 mm. the chromaticity and luminance on the monitor were calibrated with a PR655 spectroradiometer. The screen resolution was 1280 (px) × 1024 (px) and the luminance was 92 cd /m2.
Emotion is the experience of attitude toward external things that accompanies cognitive and consciousness processes and is the human brain’s response to the relationship between objective external things and the subject’s needs, which contains physiological, expressive and experiential components [33]. For interface design, the acquisition of emotional responses is an important tool that can be used to express different emotions in design works [34]. Different emotional states have different degrees of regulation on cognitive activities such as memory and attention, and similarly, the emotionality of facial expressions affects users’ decision−making [35]. Facial muscle activity is an important indicator for user facial emotion recognition [36]. To measure emotional facial expressions, researchers often use certain observation techniques or record the activity of specific muscles with facial electromyography [37]. Studies using facial EMG have shown that positive facial emotions induce increased primary activity of the zygomaticus and orbicularis oculi muscles, while negative facial expressions tend to induce primary activity of the frown muscles [38].
It should be noted that in order to identify the participants’ facial responses to better grasp the participants’ cognitive changes, as shown in the schematic diagram of the facial muscle and EMG acquisition locations in Figure 4, the electrode pads of the EMG5 EMG signal sensors were attached to the locations of the participants’ facial frown muscles and surrounding muscle groups, and the electrode pads of the EMG6 EMG signal sensors were attached to the zygomatic muscles and surrounding muscle groups. The EMG5 and EMG6 sensors had blue, red, and green electrodes, respectively. The blue electrodes were applied to the frown and zygomatic muscles, and the red and green electrodes were applied to the two muscle fibers in the direction of the frown and zygomatic muscles.

2.3. Materials

We used 64 existing driving instruction icons as pre−experimental materials. Before the experiment started, some high−precision icons that participants might be familiar with were removed, and in order to avoid the interference of icon color on participants’ performance in visual search and recognition tasks, finally, we selected 55 icons that were mainly black and white, with consistent style and high recognizability as the main experimental materials, as shown in Figure 5. Previous studies have shown that the correlation between icon content and realistic meaning in icon form is a reflection of figuration and abstraction in real things [39]. Therefore, we have divided icons into figurative and abstract according to the formal and content levels in semiotics.
After classifying the icons as figurative or abstract, we found that the figurative icons combine real life and provide people with an intuitive feeling, but at the same time, we cannot avoid the shortcomings such as un−expandable meaning and limited information. The abstract icons simplify the things in real life, but they are only designed abstract from the use state or selected part of the function, which can easily ignore the driver’s own lack of knowledge about the use state and specific function of a certain function in the display, leading to icon understanding bias. Therefore, we based our specific analysis of the correlation between the content of the icon and the meaning of reality on four dimensions, which was more accurate for improving cognitive efficiency, as shown in Table 1. The semantic meaning shown by the four icons is a mapping of real things or behaviors, but the performance for the mapping content is found to be different in other dimensions, and the explanation items and objects are accompanied by different degrees of cognitive level and thinking judgment of drivers of different genders. Therefore, there is often a certain error in simply distinguishing icons according to figurative and abstract, and adding the graphic four−dimensional evaluation index can be. Therefore, adding the four−dimensional evaluation indexes of graphics can analyze the icon cognition of drivers of different genders and propose a comprehensive icon evaluation scheme.

2.4. Experiment Design

2.4.1. Experimental Hypothesis

To investigate the validity of facial EMG signals on the assessment of gender cognitive differences in icons under four−dimensional deconstruction, the experiment subjected the EMG data obtained from search recognition to PC (Pearson Correlation) analysis and proposed three experimental hypotheses before conducting the experiment. Hypothesis 1: Icons under four−dimensional deconstruction help to identify complex icons and recall related semantic information, and the framework based on four dimensions can effectively analyze the specific reasons for drivers’ cognitive bias towards icons. Hypothesis 2: The key to the level of icon cognition lies in the semantic dimension, and gender will directly affect the changes of semantic meaning and semantic constructions. A high degree of semantic use is accompanied by a high degree of cognition of semantic meaning and semantic constructions; a low degree of semantic use is accompanied by a low degree of cognition of semantic meaning and semantic constructions, and the three are positively correlated. Hypothesis 3: There is a specific significant gender difference in the comprehensive evaluation of icon cognition under different dimensional parameters.

2.4.2. Experiment 1

The purpose of Experiment 1 was to perform icon accuracy judgments by randomized dimensional stimulus presentation by participants of different genders under the premise of a dimensional familiarity training task and to determine gender icon perception differences based on behavioral responses and facial electromyographic data. Experiment 1 consisted of a learning phase and two experimental phases. Participants were asked to complete a graphical four−dimensional theory learning session on the first day, which consisted mainly of learning the specific descriptive content of the four dimensions of icons and a simple form of icon deconstruction. The experiment was divided into a practice experiment and a formal experiment on the second day after the completion of the study. Participants were asked to focus their attention on the cognitive response to the icons according to the different dimensional descriptions that appeared randomly on the screen.
The experimental procedure was as follows: participants read the experimental instructions and pressed any key to first enter the experimental simulation practice stage. The purpose of the practice experiment was to familiarize participants with the experiment, and after the practice phase, they entered the formal experiment. The different dimensional descriptions in Experiment 1 appeared randomly in order to obtain the most natural data of participants’ responses to the experimental material, and the main content was retrieved randomly in the form of pictures, words, and graphics for the next icons to be recognized in four dimensions: semantic, constructive, contextual, and pragmatic, respectively. At the beginning of each experiment, the experimental material was displayed in the center of the screen and participants had to press the space bar to proceed. The dimension descriptions were presented randomly, and participants were asked to complete them in 5000 ms, after which time five random icons were automatically presented and participants were given a limit of 3000 ms to select the correct icon based on the dimension description. During this time, participants were asked to respond by pressing “F” (False) or “R” (Right), and when the button was pressed, they received auditory feedback. The auditory feedback consisted of two different sounds to indicate whether the participant’s response was correct or not. A total of 10 sessions were conducted, with an interval of 3000 ms between every two, and a blank screen played during the interval. The participants were prompted at the end of the experiment and thanked for their participation, and the whole process took about 15 min. The detailed flow is shown in Figure 6.

2.4.3. Experiment 2

After conducting different dimensions of cognitive selection of pictures based on semantic recall, we integrated the preference data from participants’ Experiment 1. Based on the consideration of safety and efficiency in the actual driving process, we selected five basic functional icons, and designed two different forms of figurative and abstract, respectively, while keeping the same design style for different icon formats, as shown in Table 2. Participants were asked to perform a comprehensive evaluation of the five scheme icon designs and fill out a five−level rating scale based on the four-dimensional criteria of the symbols.
For the convenience of experimental record, the icon figurative and icon abstract are replaced by scheme Mn. The bulb damage indicator is scheme M1, the window wiper indicator is scheme M2, the brake pad fault wear indicator is scheme M3, the engine fault light is scheme M4, and the gasoline particle filter indicator is scheme M5.

2.5. Experiment Design

The acquired raw facial EMG signal data were processed by filtering and noise reduction, signal segmentation, and feature extraction to identify the stimulus responses generated by the participants during the icon cognition. We used MATLAB software to perform smooth filtering processing on the raw sEMG noise−containing data collected from EMG5 and EMG6, and the processing results are shown in Figure 7. In this study, we chose to analyze the facial EMG signals of participants in both time and frequency domains during the experiment.
In the time−domain analysis, three eigenvalues, the integrated electromyographic value (IEMG) Equation (1), the root-mean-square (RMS) Equation (2) and the mean value were chosen for the characteristics of the EMG signal.
I E M G = N 2 N 1 | X ( t ) | d ( t )
Equation (1) calculates the integrated EMG value for facial EMG signal acquisition. the value of IEMG represents the size of the area of the EMG around the X coordinate in millivolts-seconds (mv−s) The strength of muscle activity can be determined by quantitative analysis of the IEMG. Where: N1 is the starting point of integration, N2 is the end point of integration, X(t) is the EMG signal, and d(t) is the sampling interval.
R M S = 1 X i 2
The root-mean-square value responds to the mean value of muscle discharges over a certain period of time and generally describes the static characteristics of the data. Where: N is the number of samples and Xi is the amplitude of the EMG at each point.
By transforming the time−domain signal into the frequency domain by Equation (3), we found that its EMG signal power spectrum waveform is more stable, which directly leads to the obtained frequency domain features also being more stable. Therefore, in this study, the eigenvalues of the EMG signal will be extracted from the frequency domain aspect as the characteristic parameters of excitability changes.
F ( ω ) = F [ f ( t ) ] = f ( t ) e i w t d t
Extraction of EMG signal features from frequency domain methods is the more common method currently used. In this study, the mean power frequency (MPF) Equation (4) and median frequency (MF) Equation (5) of EMG signal frequency domain data were extracted.
f m e a n = f m f + f p ( f ) d ( f ) / 0 + P ( f ) d ( f )
The average power frequency is a physiophysical index reflecting the signal frequency characteristics, and its level is related to the conduction speed of peripheral motor unit action potentials, the type of motor units involved in the activity, and the degree of synchronization.
0 f m f f P ( f ) d ( f ) = f m f + P ( f ) d ( f ) = 1 2 0 + P ( f ) d ( f )
The median frequency is the middle value of the muscle fiber discharge frequency during muscle contraction and is related to the ratio of fast and slow muscle fiber composition in the muscle tissue. Where, f m f is the median frequency to be found.
In summary, Experiment 1 selected the mean, standard deviation, variance, median, maxima, minima, integrated myoelectric values, and root-mean-square rms values in the time domain as the eigenvectors in the time domain, and the mean power frequency and median frequency in the frequency domain as the eigenvectors in the frequency domain.

3. Experiment Results

In order to analyze the variability of the facial EMG signals of the participants’ perception of the different dimensions of the icons in the experiment, we analyzed the four dimensions of the cognitive response state specifically in the time and frequency domains, i.e., “positive” and “negative” responses. The variability analysis of the eigenvalues of the zygomaticus muscle signal is shown in Table 3.
Significant differences are indicated by * in the table (p < 0.05).From Table 3, we can see that IEMG and MPF showed significant variability between the different state responses, while the standard deviation showed significant variability between the semantic and pragmatic dimensions but did not show variability in either the construct dimension or the context dimension, and considering the possible chance of the data, they were not used as valid eigenvalues here. Therefore, we selected IEMG and MPF as the valid feature values of zygomatic muscle signals.
The analysis of the variability of the eigenvalues of the frown muscle signal is shown in Table 4.
From Table 4, it can be seen that IEMG and MPF have significant variability between different state responses, and finally we selected IEMG and MPF as the effective characteristic values of frown muscle signals.
Our analysis of the variability of the eigenvalues of the EMG signal showed that there was always a significant difference between the two eigenvalues of IEMG and MPF between the different state responses, so we focused on these two eigenvalues specifically to analyze the variability in men and women.

3.1. Experiment 1

Reaction time and correctness can quantitatively respond to the relationship and significant differences between multiple variables. Figure 8 represents the mean distributions of reaction time and cognitive correctness of in−vehicle digital interface icons for male and female participants in different dimensional description conditions, respectively. The reaction time can reflect the difficulty of information processing by the subjects, and after excluding the abnormal data, the data results were standardized, and the RT was set in the range of 200 ms ± 30 ms, below the range indicating that the participants’ attention was low, and beyond the range indicating that the participants were disturbed by other environments. ANOVA showed that participants’ understanding of different dimensional descriptions during the experiment significantly affected the accuracy of matching target icons (t = 6.818, p < 0.05).
The comparison of male and female response time is in Figure 8. The left shows that the overall icon cognitive response time data of females are significantly lower than those of males, while the icon cognitive response time in the contextual dimension shows a high level, which reflects that females pay more attention to the spatial proportion, size and relative position in icons, and are used to understanding the details from the constituent elements in icons. Males are more likely to recognize icons quickly from the contextual dimension description of icons and their use environment and interface environment. Therefore, there was a gender difference in icon recognition in different dimensions (t = 7.359, p < 0.05).
The results of comparing the correctness of the icons for participants of different genders are shown in Figure 8. The right shows that the overall correctness rate of the participants was above 80% after familiarity with the dimension descriptions, indicating that the cognitive efficiency can be well improved through dimension training. Separate analyses of the different dimensions yielded that participants’ correctness rates for the dimension and icon categories differed by gender. Specifically, women had higher correct rates than men on average for the semantic and pragmatic dimensions (t = 8.436, p < 0.05), while men had higher rates than women for the semantic and contextual dimensions (t = 8.154, p < 0.05), and there was significant variability in the correct rates of icon recognition by participants of different genders for different dimensions.
The differential distribution of IEMG across gender participants in the experimental condition is shown in Figure 9. Previous studies have shown that when positive emotions are evoked, frown muscle activity decreases and zygomaticus and peripheral muscle activity increases [40]. Conversely, when a negative response occurs, higher muscle activity occurs at the frown muscle than at the positive response [38]. In the present experiments:
  • The maximum value of the mean IEMG value of male faces in the language construction dimension was 3,889,905 uv, the minimum value was 1,839,994 uv, and the mean was 3,184,756.3 uv. The maximum value of the mean IEMG value of female faces was 6,687,168 uv, the minimum value was 5,296,968 uv, and the mean was 5,874,959 uv. Female perception of icons in the language construction dimension was higher than that of males (p < 0.05);
  • The maximum value of the mean IEMG value of male faces in the contextual dimension was 5,825,884 uv, the minimum value was 4,047,102 uv, and the mean was 5,063,640.8 uv. The maximum value of the mean IEMG value of female faces was 3,027,688 uv, the minimum value was 2,327,181 uv, and the mean was 2,786,556.4 uv. Males had higher icon cognition than females (p < 0.05);
  • The maximum value of the mean IEMG value of male faces in the semantic dimension was 5,891,319 uv, the minimum value was 4,515,101 uv, and the mean was 5,211,807.4 uv. The maximum value of the mean IEMG value of female faces was 3,725,432 uv, the minimum value was 2,633,251 uv, and the mean was 3,185,908.8 uv. Males had higher icon cognition than females (p < 0.05);
  • The maximum value of the mean IEMG value of male faces under the discourse dimension was 4,161,213 uv, the minimum value was 3,316,871 uv, and the mean was 3,761,341 uv. The maximum value of the mean IEMG value of female faces was 5,840,651 uv, the minimum value was 4,643,138 uv, and the mean was 5,360,886 uv. Females had a higher perception of icons under the discourse dimension than males (p < 0.05).
Thus, male participants had a significant effect (p < 0.05) on both the contextual dimension and the performance indicators of the pragmatic dimension, while female participants had a significant effect (p < 0.05) on the pragmatic dimension and the pragmatic dimension.
Figure 10 reflects the mean value of the mean frequency domain median frequency (MPF) of the participants. EMG5 and EMG6 had MPF values in the range of 0 uv–0.01 uv, with small fluctuation changes, predominantly low frequency discharge and stable muscle discharge. The ANOVA results showed that participants of different genders had significant effects on all four-dimensional performance indicators. Male participants had better icon recognition accuracy compared to female participants in the context dimension and the construct dimension, while the matching accuracy under the description of the construct dimension was significantly higher for females than for males, with recognition rates above 90%.

3.2. Experiment 2

We divided the scoring results according to the different gender participants. Table 5 shows the mean and standard deviation of the results of the five design scenarios based on the four−dimensional criteria for male participants, and Table 6 shows the same for female participants. We used a mean comparison ANOVA to compare men and women using a two independent samples t-test procedure, and the hypothesis of equal variances was accepted with a p−value of 0.436 > 0.01, where the original hypothesis was “equal variances”. The second hypothesis test was then conducted to test whether there was a difference in the mean values of the four dimensions of cognition between men and women under the same Mn program, with a p value of 0 < 0.05, and the original hypothesis was accepted.
The results showed that there were differences between male and female participants in the different dimensions of the Mn icon program at the 0.05 significance level (p < 0.05). The details are as follows:
  • In M1−1, females rated the semantic and contextual dimensions higher than males (p = 0.015 < 0.05), while in M1−2, males rated the semantic and contextual dimensions higher than females (p = 0.013 < 0.05). Dimensions were higher for males than for females in M1−2 (p = 0.013 < 0.05);
  • M2 was for window wipers in both figurative and abstract designs, and the overall finding was that both males and females preferred figurative icons, and the four−dimensional scores showed that the figurative icons were more consistent with the participants’ thought patterns and association patterns. Furthermore, it is noteworthy that in the four−dimensional male–female comparison of M2−1, the female discourse construct dimension was higher than the male (p = 0.002 < 0.05), and the male context dimension was higher than the female (p = 0.012 < 0.05);
  • The two design solutions of M3 are the mapping of the operation behavior of brake pads and real things, where M3−1 is based on the action of stepping on the brake in reality, and M3−2 is a graphical treatment of car brake pads. In the four−dimensional scoring results, it was found that the different degree and style of reality metaphors directly affect the perceptions of male and female participants. Specifically, females had a higher level of perception of iconic design for behavioral metaphors and scored higher than males on the linguistic construction dimension in M3−1 (p = 0.003 < 0.05). In contrast, men’s average familiarity with car construction materials resulted in higher semantic and contextual dimension scores in M3−2 than women (p = 0.027 < 0.05);
  • The two design options for the M4 are a flattened design for the car engine, with only the addition of a warning symbol and English cues to the M4−1. Both males and females found the M4−1 with the indications to be clearer and more specific and cognizant, so the gender difference was not significant;
  • M5 is a redesign of the automotive particle filter, where M5-1 is designed to be more specific, and M5−2 is simpler. The results of the four-dimensional scoring found that in M5−1, women rated the semantic construct dimension higher than men (p = 0.024 < 0.05), while in M5−2, men rated the semantic dimension higher than women (p = 0.027 < 0.05). In M5−2, however, the gender differences were not significant because the icon form was too simple and caused participants to have low cognitive accuracy, so the ratings were more even between men and women.

4. Discussion

Icon design related to “human factors” offers more possibilities for sustainable human–computer interaction design. Icons are a system of form, color and other elements combined around a specific meaning, and are an important part of the human–computer interface [41]. As a sustainable product design for long−term human development, the human–computer interface of new energy vehicles has been initially applied to mid and high−end new energy vehicles, and there is a good development trend. In order to ensure the consistency and sustainability of new energy vehicles and user experience, it is necessary to explore the iconographic structure of the automotive interface and the user’s emotional perception, so as to improve the user’s cognitive ability.
In this context, we first tested whether participants could recognize the correct semantic meaning of target icons without any prior learning, with the aim of maximizing the efficiency of icon use in the human–machine interface in new energy vehicles. The results showed that the accuracy of icon perception was not correlated with icon representation, which is consistent with Shen’s study, who concluded that the interaction between the effects of abstract and concrete semantic icon recognition search tasks on accuracy was not significant under different icon concreteness conditions [8]. Additionally, previous studies have shown that the effect of icon complexity on icon recognition performance decreases as icon familiarity increases [16]. Therefore, we suggest that increasing the depth of icon understanding may help users to recognize complex icons and recall relevant semantic information; specifically, because simple icons have relatively few visual details, participants can only extract part of the semantic information, which is prone to cognitive bias. At the same time, for complex icons containing more visual details, the tediousness of information can also form an icon cognitive barrier. Our research focuses on the core task of icon cognition, which is to meet the visual user experience requirements while deeply analyzing the sustainable cognitive behavior of users, thus ensuring the effectiveness and efficiency of new energy vehicle use.
With the rapid development of the market economy, new energy vehicles have entered the era of market segmentation, and one of the most common market segmentation variables is gender. Gender is a key segmentation variable in product development [42]. Currently, the human–machine interface of new energy vehicles is usually defined according to the design criteria preferences of men, while women’s preferences are either subordinated or simply ignored [43]. Nowadays, the increasing number of female drivers is driving the emergence of female−exclusive car brands [2], and multifaceted and personalized car interior interfaces for women are gradually being emphasized [4]. This study focuses on the feminine refinement analysis of human–machine interface icons in the interior of new energy vehicles, to achieve the unification of icon function and female driver cognition based on the differences in male and female icon cognition, and to improve the naturalness and efficiency of human–vehicle interaction.

4.1. Experiment 1

We conducted a series of driver interviews in the pre-study period and found an interesting phenomenon—that there were significant differences in the icon perception process among drivers of different genders. For example, Sustainability 14 14759 i024 
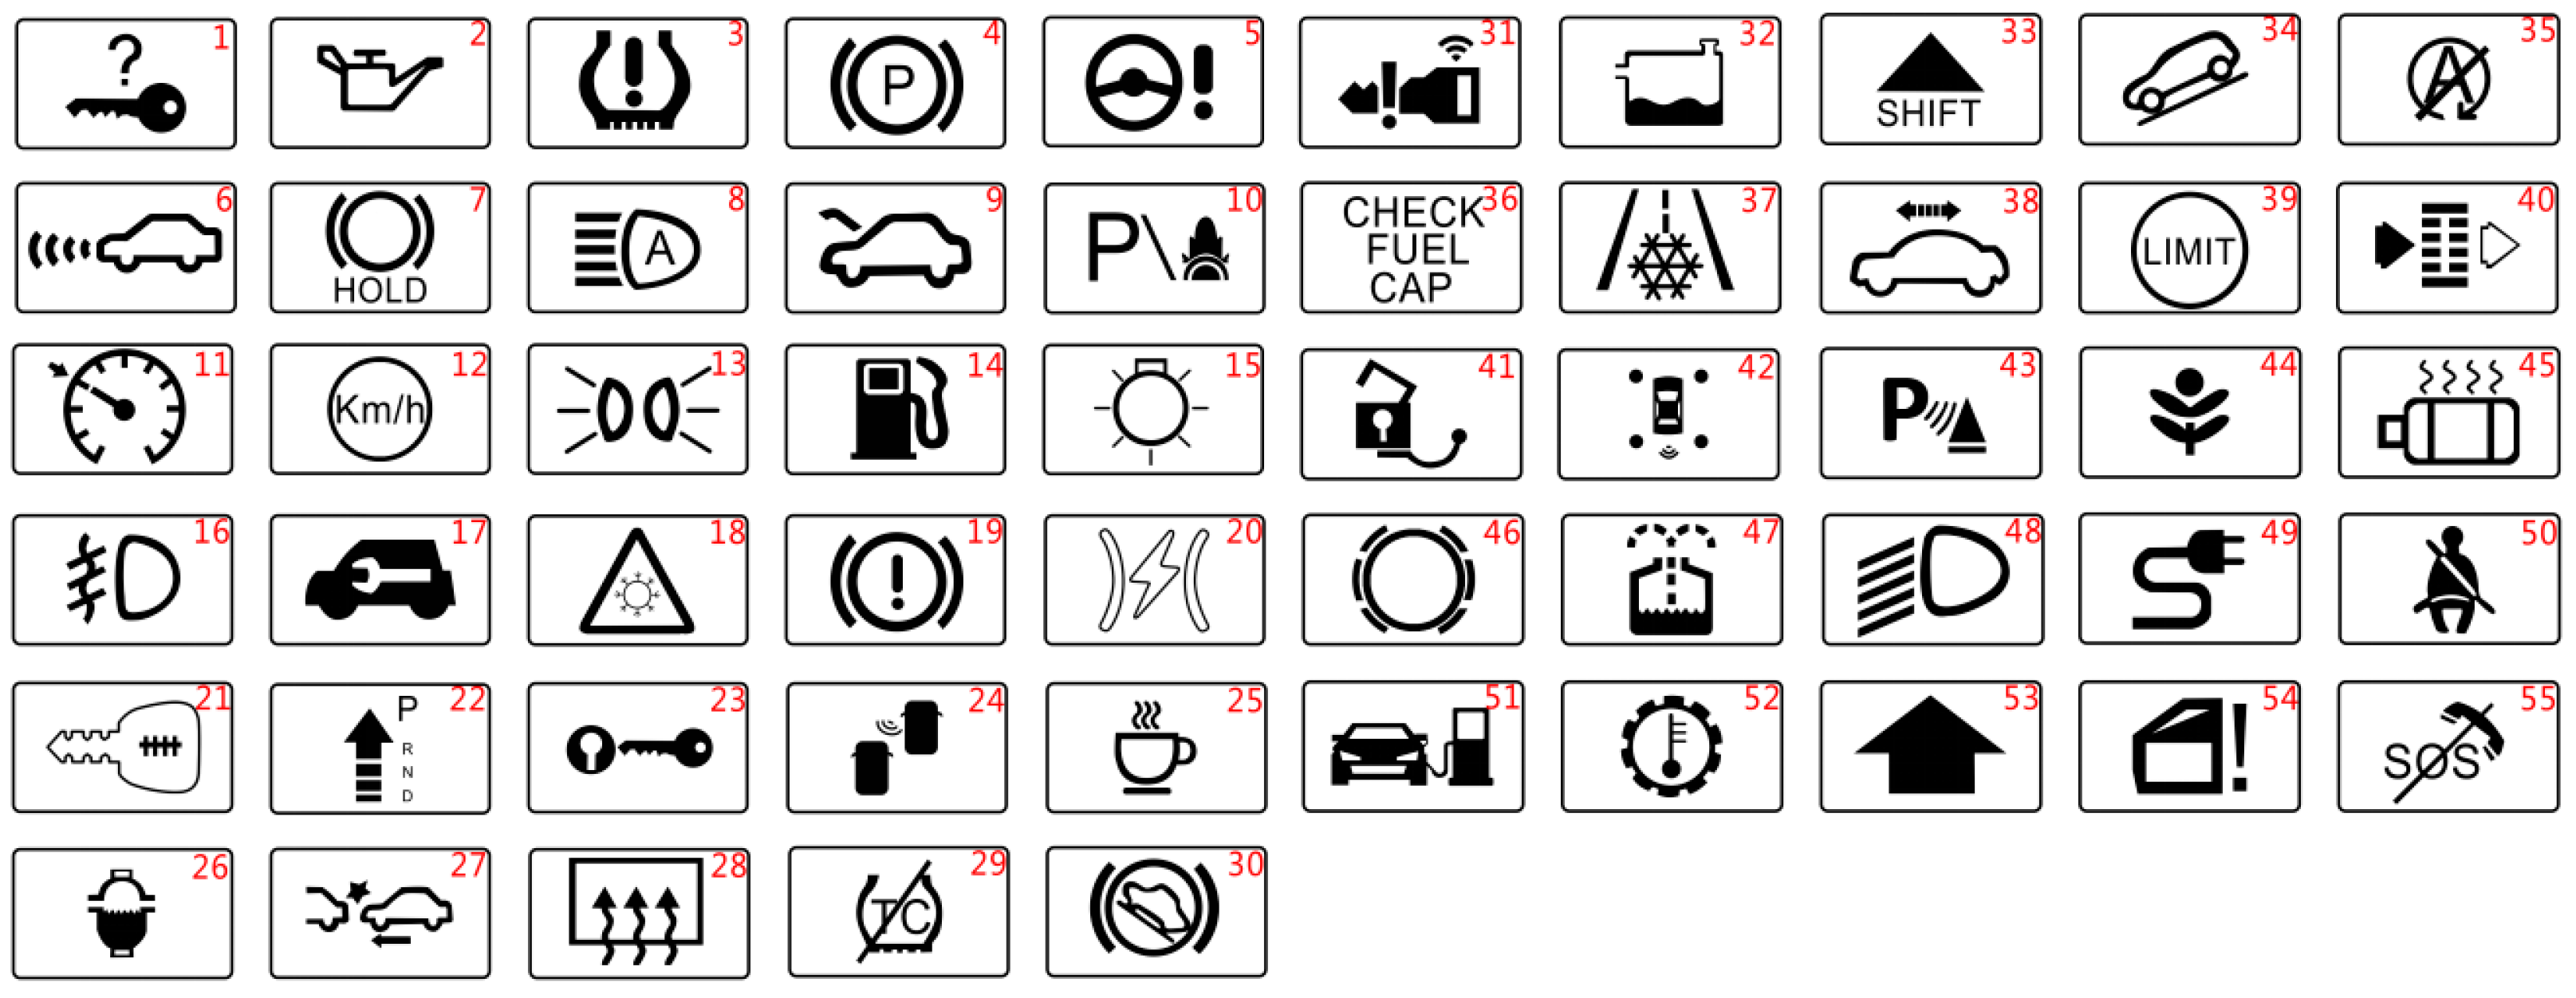
is the seatbelt indication icon, which will be recognized by some female drivers as a cartoon character with a sword. There is also Sustainability 14 14759 i025, the window anti-pinch indication icon, which, without a certain background of expertise, will be interpreted as a cell phone memory card. Humor aside, car manufacturers and interface designers must also realize that if a large number of the tested icons cannot be recognized by the full force of the driver, the recognition performance is expected to be even worse in real driving situations, and the safety hazards behind it deserve our deep thoughts. Thus, gender and individual differences are all major factors affecting driver perception, which is consistent with Zhang’s study [44]. Additionally, He et al. concluded that gender is a factor that affects driving risk, while there is an interaction effect between gender and age [45]. We mainly used the semantic dimension, semantic-constructive dimension, contextual dimension, and pragmatic dimension structural framework under semiotics for icon deconstruction, and this approach could well explain the participants’ perception of the implicit information of the interface [24] and enhance the participants’ cognitive accuracy [30]. We described the experimental material in specific details according to the four dimensions and allowed participants to analyze the reasons for the cognitive bias of the icons in the framework of the four dimensions. Each icon on the in-vehicle human–machine interface has a different functional meaning and a different four-dimensional deconstruction. The emotionality of facial expressions also affects the user’s decision-making [35]. Facial muscle activity is an important indicator for user facial emotion recognition [36]. Radjiyev et al. [46] pointed out that human–computer interaction has much to contribute to sustainability through the use of technological devices. So, we analyzed the causes of participants’ cognitive bias toward icons from the perspective of the relationship between emotion and cognition based on objective data studies of behavioral response experiments and facial electromyography experiments, which is consistent with the study of Ravaja et al. [35]. Identifying the dimensional tendencies controlling participants’ familiarity with icons can provide a new way of thinking for icon designers in the personalized design of functional icons for new energy vehicles.
Therefore, based on previous studies, we asked participants of different genders to judge the differences in different behavioral responses and facial EMG data by dimensional material stimuli with the premise of four dimensions of familiarity with the training task, and with the premise of four dimensions of understanding. Our results showed that different male and female participants had a proportional relationship between icon comprehension and reaction time, and there were significant gender differences in psychological and behavioral responses during driving behavior, which is consistent with Sun’s study [47]. Specifically, in icon cognition, males are more likely to understand the meaning of icons and make correct judgments in the description of semantic dimension and contextual dimension, while females can rationalize the structural relationships between icon elements relative to males in the semantic construction dimension by understanding the detailed performance of each constituent element in the icon. Notably, the discourse dimension can influence drivers’ subjective judgment and logical thinking, and the experimental results were consistent with the hypothesis. A strong interactive effect of driver’s license training, educational background, familiarity with icons and perception was also found.

4.2. Experiment 2

Previous studies have classified icons into three main categories (graphic, textual, and graphic–textual combinations) and researchers have compared the advantages of each category [13]. Using the results of Experiment 1 and the analysis of the three categories of icons mentioned above, we selected five basic functional icons and designed two different forms: figurative and abstract. A questionnaire survey on the tendency of iconic thinking dimensions was used to specifically dissect the differences in the perception of the ten types of icons among the participants of different genders. The results showed that, based on the division between figurative and abstract forms, the key to determining the level of perception is the pragmatic dimension, which is consistent with Bednarek’s study [48]. The results of the scale found that the thinking pattern of female participants was to figurate real things and understand icons through short-term memory and scene memory; male participants were more likely to judge the vehicle situation hindsight for icon cognition through their own driving experience, which is consistent with McDougall S’s study [22]. We believe that there is a strong correlation between semantic proximity and meaningfulness for both figurative and abstract-shaped icons, which are metaphors for real behaviors and things. Only the degree and style of metaphors differ, which in turn can lead to cognitive differences, which is consistent with the study of Roca J et al. [14]. Most of the results of Experiment 2 were consistent with the results we observed in Experiment 1, which indicated gender differences in the evaluation of design solutions under different dimensions, which is consistent with Experimental Hypothesis 3. Overall, females rated the semantic construct dimension higher than males, while males tended to favor the semantic and contextual dimensions. We also found that participants performed better when the icons were familiar, simple, or concrete, and that these beneficial effects increased as the task became more complex, consistent with Shen’s studies [9]. Both male and female participants in the experiment found symbols with indicative warning signs and English icons to be more clear and specific and more cognitive, which is consistent with Chi, C. F et al.’s study [15]. Thus, with both experiments we obtained more reliable evidence to support our research hypothesis.
In addition, through the analysis of objective experiments and subjective investigations, we also found that the semantic dimension, the constructive dimension, the contextual dimension, and the pragmatic dimension are both related and different. We can clearly find the relationship between the four dimensions through the Expression (6):
P ( F s m x , F s s x ) = F s m 1 { F s m 1 F s m 2 F s m m } F s m 2 { F s m 1 F s m 2 F s m m } F s m 3 { F s m 1 F s m 2 F s m m } F s m n   m 1 , n 1
where, Fsm denotes the semantic dimension, Fss denotes the semantic construction dimension, Fse denotes the context dimension, and Fsu denotes the semantic use dimension. The change of Fsm, Fss, Fse, Fsu is positively correlated with the change of specific design solutions, i.e., there are multiple design solutions for icons that represent the same function. Specifically, Fse determines the icon use environment and defines the style of icons, so changes in the internal use space and external natural environment will be accompanied by substantial changes in Fse, mainly from the icon size, layout, color and other aspects of comprehensive consideration. Fsu responds to the mapping of cognitive individuals, and the difference of their personal socio−cultural and cognitive backgrounds will lead to changes in the other three dimensions, and therefore plays a dominant role. The high degree of knowledge mapping of Fsu will result in a positive growth of the degree of cognition of Fsm, Fss, Fse.

5. Conclusions and Implications

5.1. Conclusions

In this study, we take female new energy vehicles as the subject and in−vehicle human–machine interface icons as a case study and propose a closed−loop graphical dimensional analysis model independent of design science based on the traditional semiotic icons and deconstructing the framework based on four dimensions: semantic, semantic construction, context and semantic use. Much work has been conducted to address the cognitive preferences of female icons under gender differences. The behavioral performance of gender−specific participants is explored through scientific experiments with subjective scales. The facial electromyographic emotion recognition technique was mainly used to collect participants’ facial electromyographic signals and obtain key indicators of emotional responses for males and females to assess icon cognitive performance, so as to objectively analyze participants’ icon familiarity and specificity performance at the instinctive level, discover differences in specific icon dimensions among drivers of different genders, and further explore the information processing process of in−vehicle human–machine interface icon interaction. While keeping the same design style for different icon formats, five functional car icons were re−modified and designed, and the differences in the perception of ten icons by participants of different genders were specifically dissected through a questionnaire survey on the tendency of iconic thinking dimensions. The results show that the four−dimensional graphic deconstruction form has a significant impact on the icon recognition performance improvement. Specifically, the internal dimensional characteristics of icons play a crucial role in drivers’ retrieval of icons. After understanding the icon−specific dimensional relationships, simple and specific icons not only led female participants to recall icons and their mapped information more accurately and quickly, but these beneficial effects also increased when the recall task became more complex. Importantly, we found significant gender differences in icon perception on a four−dimensional basis; specifically, women favored the semantic construction dimension, whereas men favored the semantic and contextual dimensions. In the interior of new energy vehicles, we extract the female preference characteristics based on the cognitive differences between male and female icons in the human–machine interface of the vehicle to find the best balance between the driving experience of women in new energy vehicles and the sustainable product life cycle, and then improve the accuracy of the decision−making behavior of female drivers in new energy vehicles to ensure driving safety.

5.2. Implications

At present, most of the “female cars” in the new energy vehicle market are the results of car companies, designers or the general public based on their own knowledge of female consumers and design experience, lacking in−depth exploration of female consumers’ cognitive preferences and needs. At the same time, most of the studies on women’s car design have extracted women’s characteristics and consumer psychology from previous research or survey results, and then analyzed and discussed women consumers’ preference for car design without considering women’s specific cognitive dimension tendencies in the car driving environment based on gender differences. The real preferences of female drivers for car design are yet to be explored. This study explores the issue of female drivers’ icon cognitive preferences based on gender differences in icon cognition, using the human–machine interface icons in new energy vehicles as a case study. As an exploratory study, our research has some shortcomings. First, our data on female drivers’ physiological information are not perfect, and we only capture data from facial electromyography, so we need to consider female drivers’ visual and EEG physiological abilities from the perspective of ergonomics in the future, and further explore the deep−seated characteristics of female drivers’ information needs, ability limitations, psychological feelings and loads. Secondly, the textual information description words or abbreviations related to functional icons in today’s cars are basically in English. How to enable drivers from non−native English-speaking regions, or drivers of different age levels and educational backgrounds, to process icon information more clearly and quickly is also an interesting research problem to be explored in the future.

Author Contributions

Conceptualization, Y.-Y.L. and F.-H.S.; methodology, Y.-Y.L.; software, Y.W.; validation, Y.L. and F.-H.S.; formal analysis, Y.W.; investigation, Y.-Y.L. and Y.W.; resources, F.-H.S.; data curation, Y.-Y.L.; writing—original draft preparation, Y.-Y.L.; writing—review and editing, Y.L. and F.-H.S.; visualization; supervision, F.-H.S.; project administration, Y.-Y.L.; funding acquisition, Y.W. All authors have read and agreed to the published version of the manuscript.

Funding

This research received no external funding.

Institutional Review Board Statement

Not applicable.

Informed Consent Statement

Informed consent was obtained from all subjects involved in the study.

Data Availability Statement

Not applicable.

Conflicts of Interest

The authors declare no conflict of interest.

References

  1. Wang, D.; Li, Y.M. Measuring the Policy Effectiveness of China’s New-Energy Vehicle Industry and Its Differential Impact on Supply and Demand Markets. Sustainability 2022, 14, 8215. [Google Scholar] [CrossRef]
  2. Ministry of Public Security Traffic Management Bureau. Ministry of Public Security: In 2021, the Number of Motor Vehicles in China Will Reach 395 Million, with a Year-on-Year Increase of 59.25%. Auto & Safety, 2022; Volume 76. Available online: https://equalocean.com/briefing/20220111230111241 (accessed on 18 February 2022).
  3. Zhu, X.M.; Liu, X.X. Gender marketing. Enterp. Manag. 2008, 8, 76–78. [Google Scholar]
  4. Tu, J.C.; Yang, C.; Hung, Y.T. A Study on Needs for Automotive Interiors Based on Lifestyle Characteristics of Taiwanese Female Office Workers. Sustainability 2018, 10, 2168. [Google Scholar] [CrossRef] [Green Version]
  5. Cunningham, J.; Roberts, P.; Liang, C.C. W Marketing—Penetration into Female Consumption Psychology; Global Publishing: Taipei, Taiwan, 2007; ISBN 9789861851242. [Google Scholar]
  6. Galitz, W.O. The Essential Guide to User Interface Design: An Introduction to GUI Design Principles and Techniques, 3rd ed.; John Wiley & Sons, Inc.: New York, NY, USA, 2007. [Google Scholar]
  7. Zhang, X.; Liao, X.P.; Tu, J.C. A Study of Bibliometric Trends in Automotive Human—Machine Interfaces. Sustainability 2022, 14, 9262. [Google Scholar] [CrossRef]
  8. Shen, Z.F.; Zhang, L.H.; Li, R.; Liang, R.Y. The Effffects of Icon Internal Characteristics on Complex Cognition. Int. J. Ind. Ergon. 2020, 79, 102990. [Google Scholar] [CrossRef]
  9. Shen, Z.; Xue, C.; Wang, H. Effects of Users’ Familiarity with the Objects Depicted in Icons on the Cognitive Performance of Icon Identification. i-Perception 2018, 9, 2041669518780807. [Google Scholar] [CrossRef] [Green Version]
  10. Silvennoinen, J.M.; Kujala, T.; Jokinen, J. Semantic Distance as a Critical Factor in Icon Design for In-Car Infotainment Systems. Appl. Ergon. 2017, 65, 369–381. [Google Scholar] [CrossRef] [Green Version]
  11. Liang, Y.; Lee, J.D.; Yekhshatyan, L. How Dangerous is Looking Away from the Road? Algorithms Predict Crash Risk from Glance Patterns in Naturalistic Driving. Hum. Factors J. Hum. Factors Ergon. Soc. 2012, 54, 1104–1116. [Google Scholar] [CrossRef]
  12. Young, K.L.; Osborne, R.; Grzebieta, R.; Williamson, A.; Haworth, N.; Senserrick, T.; Stephan, K.L.; Charlton, J.L. Using Naturalistic Driving Data to Examine How Drivers Share Attention When Engaging in Secondary Tasks. Saf. Sci. 2020, 129, 104841. [Google Scholar] [CrossRef]
  13. Campbell, J.L.; Hoffmeister, D.H.; Keifer, R.J.; Selke, D.J.; Green, P.A.; Richman, J.B. Comprehension testing of active safety symbols. In 2004 SAE World Congress and Exhibition Technical Papers; SAE International: Warrendale, PA, USA, 2004; p. 8e11. [Google Scholar] [CrossRef] [Green Version]
  14. Roca, J.; Tejero, P.; Insa, B. Accident ahead? Difficulties of drivers with and without reading impairment recognising words and pictograms in variable message signs. Appl. Ergon. 2018, 67, 83–90. [Google Scholar] [CrossRef]
  15. Chi, C.F.; Dewi, R.S. Matching Performance of Vehicle Icons in Graphical and Textual Formats. Appl. Ergon. 2014, 45, 904–916. [Google Scholar] [CrossRef] [PubMed]
  16. Ng, A.W.Y.; Chan, A.H.S. The Effects of Driver Factors and Sign Design Features on the Comprehensibility of Traffic Signs. J. Saf. Res. 2008, 39, 321–328. [Google Scholar] [CrossRef] [PubMed]
  17. Lescha, M.F.; Horreya, W.J.; Wogalterb, M.S.; Powell, W.R. Age-related differences in warning symbol comprehension and training effectiveness: Effects of familiarity, complexity, and comprehensibility. Ergonomics 2011, 54, 879–890. [Google Scholar] [CrossRef] [PubMed]
  18. Li, Y.; Cai, M.J.; Guo, T.Y.; Yu, J. Research on Recognition and Evaluation of Traffic Guide Sign. Math. Probl. Eng. 2015, 2015, 808151. [Google Scholar] [CrossRef] [Green Version]
  19. Shen, Z.F.; Ge, Q.X.; Len, H.X.; Chen, T.T.; Wang, C.X.; Chen, M. Icon format on the in-vehicle HMI affects drivers’ cognitive performance. Behav. Inf. Technol. 2022, 1–15. Available online: https://www.tandfonline.com/doi/full/10.1080/0144929X.2022.2101527 (accessed on 18 February 2022). [CrossRef]
  20. Goonetilleke, R.; Shih, H.M.; On, H.K.; Fritsch, J. Effects of training and representational characteristics in icon design. Int. J. Hum.-Comput. Stud. 2001, 55, 741–760. [Google Scholar] [CrossRef] [Green Version]
  21. Passini, S.; Strazzari, F.; Borghia, A. Icon-function relationship in toolbar icons. Displays 2008, 29, 521–525. [Google Scholar] [CrossRef]
  22. McDougall, S.; Curry, M. More than just a picture: Icon interpretation in context. In Proceedings of the First International Workshop on Coping with Complexity; University of Bath: Bath, UK, 2004. [Google Scholar]
  23. Leung, R.; Mcgrenere, J.; Graf, P. Age-related differences in the initial usability of mobile device icons. Behav. Inf. Technol. 2009, 30, 629–642. [Google Scholar] [CrossRef]
  24. Alexander, G.M.; Tim, K.; Artur, L.; Nicole, P. Automotive User Experience Design Patterns: An Approach and Pattern Examples. Int. J. Adv. Intell. Syst. 2016, 9, 275–286. [Google Scholar]
  25. He, W.; Zhang, Y.C.; Zhu, J.P.; Xu, Y.; Yu, W.J.; Chen, W.Z.; Liu, Y.H.; Wang, W. Could sex difference in color preference and its personality correlates fit into social theories? Let Chinese university students tell you. Personal. Individ. Differ. 2011, 51, 154–159. [Google Scholar] [CrossRef]
  26. Li, Y.Y.; Song, F.H.; Liu, Y.; Wang, Y. Relevance of Emotional Conflict and Gender Differences in the Cognitive Tasks of Digital Interface Layouts Using NIRS Technology. IEEE Access 2021, 9, 17382–17391. [Google Scholar] [CrossRef]
  27. Xu, H.C. Design Semiotic; Tsinghua University Press: Beijing, China, 2007; ISBN 9787302178033. [Google Scholar]
  28. MIuhammad, N.I.; Harry, B.; Najmul, A.K.M.I. Evaluating Web and Mobile User Interfaces with Semiotics: An Empirical Study. IEEE Access 2020, 8, 84396–84414. [Google Scholar]
  29. Zhou, Y.X.; Luo, S.J.; Chen, G.C. Design Semiotics Based Icon Design. J. Comput.-Aided Des. Comput. Graph. 2012, 24, 1319–1328. [Google Scholar] [CrossRef]
  30. Islam, M.N.; Bouwman, H. Towards user–intuitive Web interface sign design and evaluation: A semiotic framework. Int. J. Hum.-Comput. Stud. 2016, 86, 121–137. [Google Scholar] [CrossRef]
  31. Peterson, R.A. On the use of college students in social science research: Insights from a second-order meta-analysis. J. Consum. Res. 2001, 28, 450–461. [Google Scholar] [CrossRef] [Green Version]
  32. Stempfle, J.; Badke-Schaub, P. Thinking in design teams—An analysis of team communication. Des. Stud. 2002, 23, 473–496. [Google Scholar] [CrossRef]
  33. Nozadi, S.S.; Spinrad, T.L.; Johnson, S.P.; Eisenberg, N. Relations of emotion-related temperamental characteristics to attentional biases and social functioning. Emotion 2018, 18, 481–492. [Google Scholar] [CrossRef]
  34. Damien, L.; Nathalie, B. Towards the Evaluation of Emotional Interfaces. In International Conference on Human-Computer Interaction, Part of the Lecture Notes in Computer Science Book Series (LNISA); Springer: Berlin/Heidelberg, Germany, 2015; Volume 9169, pp. 500–511. [Google Scholar]
  35. Ravaja, N.; Bente, G.; Kätsyri, J.; Salminen, M.; Takala, T. Virtual Character Facial Expressions Influence Human Brain and Facial EMG Activity in a Decision-Making Game. IEEE Trans. Affect. Comput. 2018, 9, 282–298. [Google Scholar] [CrossRef] [Green Version]
  36. Höfling, T.T.A.; Gerdes, A.B.M.; Föhl, U.; Alpers, G.W. Read My Face: Automatic Facial Coding Versus Psychophysiological Indicators of Emotional Valence and Arousal. Front. Psychol. 2020, 11, 1388. [Google Scholar] [CrossRef]
  37. Wolf, K. Measuring facial expression of emotion. Dialogues Clin. Neurosci. 2015, 17, 457–462. [Google Scholar] [CrossRef]
  38. Yulia, G.; Adam, H.; Tali, A.; Stacey, S.; Nava, L.B. Affect dynamics of facial EMG during continuous emotional experiences. Biol. Psychol. 2018, 139, 47–58. [Google Scholar] [CrossRef]
  39. Wang, H.B.; Xue, C.Q.; She, X.; Guo, H.J. Research on the metaphor in graphic user interface. J. Anhui Inst. Archit. Ind. 2011, 19, 93–96. [Google Scholar] [CrossRef]
  40. Höfling, T.T.A.; Alpers, G.W.; Gerdes, A.B.M.; Föhl, U. Automatic facial coding versus electromyography of mimicked, passive, and inhibited facial response to emotional faces. Cogn. Emot. 2021, 35, 874–889. [Google Scholar] [CrossRef] [PubMed]
  41. Isherwood, S.J.; McDougall, S.J.P.; Curry, M.B. Icon Identification in Context: The Changing Role of icon Characteristics with User Experience. Hum. Factors 2007, 49, 465–476. [Google Scholar] [CrossRef] [PubMed]
  42. Ratzer, B.; Weisse, A.; Weixelbaumer, B.; Mirnig, N.; Tscheligi, M.; Raneburger, D.; Popp, R.; Falb, J. Bringing gender into technology: A case study in user-interface-design and the perspective of gender experts. Int. J. Gend. Sci. Technol. 2014, 6, 3–24. [Google Scholar]
  43. Lin, C.J.; Hsieh, T. Exploring the design criteria of website interfaces for gender. Int. J. Ind. Ergon. 2016, 53, 306–311. [Google Scholar] [CrossRef]
  44. Zhang, X.F.; Xue, C.Q.; Shen, Z.F. Analysis of Icon Complexity in Human-Computer Interaction Digital Interface. Design 2017, 19, 119–120. [Google Scholar]
  45. He, Q.; Zhu, X.J.; Wan, M.N. Association of Accident Risk with Demographic Factors and Environment Variables for Male and Female Drivers. Chin. J. Ergon. 2019, 25, 31–35. [Google Scholar] [CrossRef]
  46. Radjiyev, A.; Qiu, H.; Xiong, S.; Nam, K.H. Ergonomics and sustainable development in the past two decades (1992–2011): Research trends and how ergonomics can contribute to sustainable development. Appl. Ergon. 2015, 46, 67–75. [Google Scholar] [CrossRef]
  47. Sun, H.J. People-oriented User Interface Design. Packag. Eng. 2015, 36, 113–116. [Google Scholar] [CrossRef]
  48. Bednarek, M. Dimensions of evaluation: Cognitive and linguistic perspectives. Pragmatic Cogn. 2009, 17, 146–175. [Google Scholar] [CrossRef]
Figure 1. Examples of new energy vehicle brands for women. (Pictures from the official websites of ORA and WULING).
Sustainability 14 14759 g001
Figure 2. The four−dimensional deconstruction process of icons based on semiotics [29].
Sustainability 14 14759 g002
Figure 3. In−vehicle human–machine interface graphics four−dimensional deconstruction of the specific content covered.
Sustainability 14 14759 g003
Figure 4. Schematic diagram of the location of facial muscles and EMG acquisition.
Sustainability 14 14759 g004
Figure 5. 55 functional icons for in−car digital interfaces.
Sustainability 14 14759 g005
Figure 6. Experiment 1 Flow sequence of tasks.
Sustainability 14 14759 g006
Figure 7. Smoothing filtered EMG signal data graph.
Sustainability 14 14759 g007
Figure 8. Average performance of males and females on the in−vehicle digital interface icon perception experiment in different dimensional description conditions. The left panel shows the reaction time (ms) and the right panel shows the correctness rate (%).
Sustainability 14 14759 g008
Figure 9. IEMG box distribution of participants by gender.
Sustainability 14 14759 g009
Figure 10. MPF box distribution of participants by gender.
Sustainability 14 14759 g010
Table 1. Example of four−dimensional deconstruction analysis of four types of in−vehicle human–machine interface icons.
Vehicle Digital Interface IconsSemantic
Dimension
Language Construction DimensionContextual
Dimension
Semantic Dimension
Sustainability 14 14759 i001
Safety belt
Reflection of reality
Sustainability 14 14759 i002
Restore the actual use of seat belt in a silhouette mannerDirectly visualize the use of seat belt through a flat imageUse the real situation that driver has already recognized to indicate usage of seat belt, corresponding with driver’s thinking mode and logic association, and no cultural difference
Icon composition:
Sustainability 14 14759 i003
Sustainability 14 14759 i004
Warning light for
insufficient fuel
Reflection of reality
Sustainability 14 14759 i005
Restore the actual state of
car refueling in a silhouette
manner
Directly visualize the use of car refueling through a flat imageUse the real situation that the driver has already recognized to remind them to refuel in time, corresponding with driver’s thinking mode and logic association, and no cultural difference
Icon composition:
Sustainability 14 14759 i006
Sustainability 14 14759 i007
Indicator in Skylight for avoiding squeeze
Warning sign
Sustainability 14 14759 i008
Reflection of reality
Sustainability 14 14759 i009
Display the opening and
closing state of skylight in
two dimensions
Skylight simulates the dynamic effect of opening and closing in form of lines, with warning signs, so that driver can pay attention
when using it
Dynamic effect of three−dimensional skylight is displayed in a flat manner. The different educational and cultural backgrounds of the driver influence its subjective judgment and logical thinking, resulting in cognitive differences in skylight indicator.
Icon composition:
Sustainability 14 14759 i010
Sustainability 14 14759 i011
Indicator for
changing air cleaner
Reflection of reality
Sustainability 14 14759 i012
Display the filtering status of air filter in two dimensionsDescribe the filtration
process of air filter in a flat style, the icon is an expression of its functionality
Functional dynamics of air filter are displayed in a flat manner. The different educational and cultural backgrounds of the driver influence their subjective judgment and logical thinking, which may cause cognitive differences.
Icon composition:
Sustainability 14 14759 i013
Table 2. Designing functional icons for ten common in−car digital interfaces (figurative and abstract in two different forms).
Number Number
M1−1Sustainability 14 14759 i014M1−2Sustainability 14 14759 i015
M2−1Sustainability 14 14759 i016M2−2Sustainability 14 14759 i017
M3−1Sustainability 14 14759 i018M3−2Sustainability 14 14759 i019
M4−1Sustainability 14 14759 i020M4−2Sustainability 14 14759 i021
M5−1Sustainability 14 14759 i022M5−2Sustainability 14 14759 i023
Table 3. Analysis of surface electromyographic variability between gender dimensions of zygomaticus muscle.
EigenvalueSemantic Dimension
(Negative and Positive)
Language Construction Dimension
(Negative and Positive)
Contextual Dimension
(Negative and Positive)
Pragmatic Dimension
(Negative and Positive)
FPFPFPFP
Mean0.8970.3360.7610.4590.9530.4130.8350.448
Standard deviation3.9640.032 *2.7240.3823.4260.0510.2920.042 *
Median0.9590.3581.2040.9321.0290.2381.0330.556
Maxima1.8720.2071.5240.1642.0190.1871.6420.163
Minima1.3410.3091.2280.3081.4380.2661.3390.314
Variance5.7630.1295.3140.1385.6500.1174.8130.122
IEMG4.3390.035 *4.8040.042 *4.3210.038 *4.7320.031 *
RMS1.0950.3160.8280.3711.2400.5691.9540.353
MPF7.0480.017 *6.9220.019 *6.7840.012 *7.0060.014 *
MF1.3260.2941.1890.2351.4210.7621.2810.552
Significant differences are indicated by * in the table (p < 0.05).
Table 4. Analysis of surface electromyography variability among different gender dimensions of the frown muscle.
EigenvalueSemantic Dimension
(Negative and Positive)
Language Construction Dimension
(Negative and Positive)
Contextual Dimension
(Negative and Positive)
Pragmatic Dimension
(Negative and Positive)
FPFPFPFP
Mean0.5680.3520.8570.3390.6040.3710.6650.340
Standard deviation1.0080.3081.1210.3761.0850.2941.1080.359
Median0.6900.4210.8510.3160.7720.4410.8320.401
Maxima0.1920.5460.2520.4400.2630.4250.2640.483
Minima0.0300.8950.0440.8750.0520.7630.0410.857
Variance5.1820.1314.7430.1295.0190.1355.0080143
IEMG8.1200.014 *6.6220.022 *6.4070.017 *7.9510.015 *
RMS1.4090.2370.9880.3231.0390.3281.2660.264
MPF4.9210.036 *6.6210.020 *6.2780.029 *4.9130.031 *
MF1.5140.2301.4390.4021.3090.4241.5070.336
Significant differences are indicated by * in the table (p < 0.05).
Table 5. Results of the five design options by male participants based on the four−dimensional criteria.
Design
Program
Semantic DimensionLanguage Construction DimensionContextual DimensionPragmatic Dimensionp
T MeanSDTMeanSDT MeanSDT MeanSD
M1−123.732 4.350 0.579 28.248 4.050 0.453 19.636 4.100 0.658 22.583 4.160 0.582 0.000
M1−218.263 4.280 0.740 15.456 4.070 0.834 14.324 3.980 0.878 16.812 3.880 0.729 0.000
M2−129.939 4.350 0.459 41.998 3.980 0.299 21.847 4.070 0.589 23.334 4.180 0.566 0.000
M2−220.916 3.520 0.533 18.600 3.880 0.658 18.053 3.520 0.617 20.108 3.670 0.578 0.000
M3−131.500 4.200 0.421 34.447 4.100 0.376 26.706 4.270 0.506 27.480 4.370 0.159 0.000
M3−229.684 4.150 0.634 17.294 3.680 0.700 20.716 4.080 0.652 33.588 3.630 0.358 0.000
M4−131.500 4.200 0.422 34.447 4.100 0.376 26.706 4.280 0.506 27.480 4.380 0.503 0.000
M4−225.777 3.300 0.405 21.056 3.420 0.514 20.423 3.530 0.546 28.169 3.450 0.387 0.000
M5−138.536 4.120 0.338 28.412 4.020 0.448 19.596 4.000 0.645 28.842 4.220 0.463 0.000
M5−226.294 3.250 0.391 20.641 3.380 0.517 24.529 3.480 0.448 27.577 3.250 0.373 0.000
Table 6. Results of the five design options by female participants based on the four−dimensional criteria.
Design
Program
Semantic DimensionLanguage Construction DimensionContextual DimensionPragmatic Dimensionp
T MeanSDT MeanSDT MeanSDT MeanSD
M1−118.748 4.250 0.716 14.000 4.200 0.948 17.676 4.050 0.724 26.460 4.280 0.512 0.000
M1−216.199 4.020 0.786 17.472 3.950 0.715 15.456 3.520 0.721 19.416 3.950 0.643 0.000
M2−121.138 4.280 0.640 17.411 4.000 0.726 18.735 3.900 0.658 20.079 4.080 0.643 0.000
M2−223.596 3.220 0.432 17.782 3.770 0.671 14.483 3.470 0.758 17.697 3.680 0.657 0.000
M3−126.706 4.270 0.506 25.295 4.330 0.541 21.726 3.900 0.568 20.826 3.980 0.605 0.000
M3−216.251 3.100 0.603 15.886 3.530 0.701 14.246 3.150 0.699 28.316 3.500 0.391 0.000
M4−126.706 4.280 0.506 25.295 4.320 0.540 21.726 3.900 0.568 20.826 3.990 0.606 0.000
M4−225.702 3.330 0.409 27.000 3.380 0.365 30.346 3.600 0.376 30.549 3.420 0.354 0.000
M5−120.929 3.820 0.577 31.677 4.420 0.442 29.961 3.910 0.412 27.495 4.200 0.483 0.000
M5−222.320 3.200 0.453 33.500 3.350 0.316 18.783 3.500 0.589 22.765 3.230 0.447 0.000
Publisher’s Note: MDPI stays neutral with regard to jurisdictional claims in published maps and institutional affiliations.

